 Leonidas Tsapatsaris1
 Lutz Wiegart2
 Stanislas Petrash3Tobias Baumeister4Thomas Engels5
 Maya Endoh1
 Tadanori Koga1,6*
- 1Department of Materials Science and Chemical Engineering, Stony Brook University, Stony Brook, NY, United States
- 2National Synchrotron Light Source II, Brookhaven National Laboratory, Upton, NY, United States
- 3Adhesive Technologies, Henkel Corporation, Bridgewater, NJ, United States
- 4Henkel AG & Co KGaA, Heidelberg, Germany
- 5Henkel AG & Co KGaA, Düsseldorf, Germany
- 6Department of Chemistry, Stony Brook University, Stony Brook, NY, United States
Introduction: Cross-linkable polymers are in widespread use in a variety of industries because of their thermomechanical toughness, chemical resistance, and adhesive strength. But traditional methods to characterize these materials are insufficient for fully capturing the complex chemical and physical mechanisms of the crosslinking reaction. In this study, in situ X-ray photon correlation spectroscopy (XPCS) was used to investigate the crosslinking kinetics of a two-component epoxy resin adhesive.
Materials and methods: With XPCS, we tracked the temporally resolved dynamics of silica filler particles, which served as probes of the internal dynamics of the thermoset network and allowed us to study the crosslinking process. The epoxy was cured isothermally at 40 °C and 80 °C to study the effects of curing temperature on the epoxy’s crosslinking reaction. XPCS results were compared to dielectric analysis (DEA) results, to demonstrate the similarities between a traditional technique and XPCS, and highlight the additional information gained with XPCS.
Results and discussion: The epoxy resin was found to be highly sensitive to temperature. The epoxy samples exhibited different relaxation processes depending on isothermal cure temperature, indicating a complex relationship between applied temperature and the development of stress/relaxation conditions associated with formation of the thermoset network. Heating to the isothermal temperature setpoint at the start of curing promoted gelation, but the vitrification process was not completed during the isothermal curing stage. Instead, cooling the sample to room temperature facilitated the final vitrification process. This paper contextualizes this epoxy’s results within the broader field of thermoset study via XPCS, and advocates for XPCS as a fundamental technique for the study of complex polymers.
Introduction
Cross-linkable polymers are found in nearly every industry, including automotive, aerospace, construction, and microelectronics, and are used in everything from coatings to electronics to adhesives, from consumer applications through the industrial production scale (Sahagun and Morgan, 2012; Jin et al., 2015; Yavitt et al., 2020a; Yavitt et al., 2023). Their widespread use is due to their useful properties, such as thermomechanical toughness, chemical resistance, and adhesive strength (Nair, 2004; Sprenger, 2013; Morsch et al., 2016; Morsch et al., 2017). As with any useful material, various industries are interested in developing a thorough scientific understanding of why cross-linkable polymers work the way they do, because knowing why they work allows us to make better design and production decisions, tailor the material to specific needs, and develop a more successful product. However, the traditional understanding of cross-linkable polymers–often derived from empirical, time-consuming trial-and-error experiments–is insufficient to capture the complex chemical and physical mechanisms behind these remarkable materials (Min et al., 1993; Sharifi et al., 2014).
Cross-linkable polymers derive their strength from the formation of a three-dimensional crosslinked network that develops as the material undergoes the crosslinking reaction (Nair, 2004). This reaction is often initiated by an external stimulus, such as heat, UV light, moisture, or another reactant, in a process commonly referred to as “curing” (Araki et al., 2002a; Araki et al., 2002b; Ehrburger-Dolle et al., 2019; Trigg et al., 2021). A typical challenge with these materials is the difficulty of performing in situ/real-time measurements because the materials often react rapidly and solidify as they cure, making traditional characterization measurements, such as differential scanning calorimetry (DSC) and rheology, difficult. For example, rheology is not useful after the material has finished curing and is macroscopically solid, while DSC is only useful after the material has finished curing (Schlosser and Schönhals, 1989; Ellis and Ellis, 1993; Bahrami et al., 2015; Estridge, 2018). Dielectric spectroscopy can measure dynamic processes, such as curing, but it is a bulk measurement, like rheology, and lacks the capability to measure at specified length scales. Electron microscopy techniques are useful for characterizing the post-crosslinked structure, but it is not currently possible to use these techniques to study cross-linkable materials while the crosslinking reaction is occuring (Kishi et al., 2007; Gu et al., 2011). For some polymers, the high energy electron beam used for electron microscopy can actually induce crosslinking–a phenomenon that is much more likely to occur when using an electron beam than, for example, an X-ray beam (Gupta et al., 2020).
X-ray scattering is uniquely suited to the in situ study of cross-linkable polymers. It is non-destructive, it can elucidate information about the structures and dynamics of a material in real time, and it is equally useful for studying the non-crosslinked precursor materials as it is for the final, fully crosslinked polymer. Small-angle X-ray scattering (SAXS) and wide-angle X-ray scattering (WAXS) are well suited to probe the structure of polymeric materials and have been widely used by the polymer community. However, static scattering signals are only sensitive to changes in the average length scales within the system and cannot provide information about the characteristic time scales of the system. For example, the static scattering of a colloid diffusing in a liquid and the same colloid “frozen” in the solid state of the liquid would be fundamentally the same.
Emerging dynamic X-ray scattering techniques such as X-ray photon correlation spectroscopy (XPCS) can provide the spatially and temporally resolved dynamics of materials over relevant time scales (sub-milliseconds to 1000s of seconds) and length scales (nanometers to hundreds of nanometers), making them more useful for complex, out-of-equilibrium systems (Johnson et al., 2019; Lehmkühler et al., 2021). Furthermore, the recent development of in-operando XPCS allows researchers to closely mimic industrial processing conditions, shedding new light on the crosslinking and vitrification process of cross-linkable polymers (Andrews et al., 2018; Ehrburger-Dolle et al., 2019; Yavitt et al., 2020a; Hoshino et al., 2021; Yavitt et al., 2023). Moreover, XPCS is a microbeam scattering technique, with a typical beam diameter of tens of μm, and can probe materials in configurations as close to their real use-case as possible (e.g., a 100 μm thin film sandwiched between two parts), and still provide spatial resolution within that layer (Yavitt et al., 2020a; Yavitt et al., 2020b; Yavitt et al., 2023).
In this study, XPCS is used for the in situ characterization of the crosslinking kinetics of an industrially relevant two-component epoxy resin adhesive. In addition to providing mechanical and thermal stability to the epoxy resin, nanofillers conveniently act as internal dynamic probes to resolve the evolution of crosslinking by sensing the matrix’s mobility (Fluerasu et al., 2007; Guo et al., 2009; Koga et al., 2010; Mangal et al., 2016; Yavitt et al., 2020a; Lehmkühler et al., 2021; Trigg et al., 2021; Yavitt et al., 2023). We aim to demonstrate that diverse and useful information can be obtained using in situ XPCS to study the dynamics of an epoxy resin adhesive as it undergoes a crosslinking reaction.
Materials and methods
The material of interest in this study was a two-part epoxy structural adhesive supplied by Henkel AG and Co., KGaA. The primary components of the adhesive were epoxy resins and various polyamines, with fumed silica as a thickener, lamellar talc as a viscosity modifier, and carbon black for coloration and viscosity modification. The concentration of silica particles was ∼2% (by volume) with a BET surface area of 105–140 m2/g, according to ISO 9277. The concentration of CB filler was less than 0.1% by volume. The recommended cure schedule for the adhesive is 8 h at room temperature, or approximately 15 min when heated to 80°C, for initial strength. According to the manufacturer’s specifications, the final strength is achieved after a total cure time of approximately 2 days at room temperature or approximately 30 min at 80°C.
XPCS elucidates the dynamics and changes in dynamics of an out-of-equilibrium system by tracking the changes in the electron density profile through a time series of coherent scattering patterns. Equilibrium dynamics are quantified by an intensity-intensity autocorrelation function, g2, which is derived from the time series of speckle patterns:
where q is the scattering vector described by
The average elapsed time between two discrete time points in the time series is tage = (t1 + t2)/2, which also represents the elapsed experimental time and is used in this paper to denote the time elapsed after the start of data collection. With tage and a lag time τ = |t2–t1|, one can define an “aged” one-time correlation by averaging the two-time correlation function in Eq. 2 around a given tage, with the amount of averaging (Δtage) chosen such that the average is taken over parts of the two-time correlation function that describe “quasi-equilibrium” dynamics:
This aged g2 function (Eq. 3) is fit to a Kohlrausch-Williams-Watts (KWW) form shown in Eq. 4 to obtain quantitative information about the dynamics (Kohlrausch, 1854; Siegert, 1943; Williams and Watts, 1970):
where β is the optical contrast (also known as the Siegert factor), A is the baseline, Γ is the relaxation rate, and γ is the shape parameter (also known as the stretching exponent) (Siegert, 1943; Andrews et al., 2018; Yavitt et al., 2020a; Hoshino et al., 2021; Yavitt et al., 2023). The setup-dependent optical contrast was determined as β ≈ 0.12 from measurements of a static reference sample (CoralPor®, Schott) (Supplementary Figure S1). Full analytical protocols are described in previous reports (Abeykoon et al., 2016; Yavitt et al., 2020a; Yavitt et al., 2023).
The sample was used as received without further modification. The sample was prepackaged in a two-component cartridge, to which a mixing nozzle could be attached so that the sample could be mixed and extruded simultaneously. As specified by the manufacturer, the cartridge was preheated in an oven at 60°C for 1 h prior to use. The sample was extruded ex situ, outside of the beamline experimental hutch, through the mixing nozzle into a round sample holder (3 mm diameter and 1.5 mm sample thickness) walled with 25 μm thick polyamide windows (LINQTAPE™, Caplinq). The manual sample handling procedure did not allow us to control the times that elapsed between removal from the oven and extrusion into the sample holder, or between extrusion into the sample holder and initiation of the measurement. Since the cure kinetics without external heating (i.e., at room temperature) were very slow, and the time periods between when we mixed each epoxy and the start of each sample’s respective temperature ramp were comparable, we set the time at which the heating ramp began for each sample as the effective “start time”. Therefore, tage refers to the time elapsed from that point.
Once a sample was mounted in the beamline, its temperature was controlled remotely using a PID-controlled resistive heater. For this adhesive, two specific temperature profiles were of interest: constant temperature at 40°C, and constant temperature at 80°C. For the “constant 40°C” profile, the sample experienced a short heating ramp at the start of the experiment at a rate of 5°C/min, followed by an extended hold time for about 500 min, and finally a short cooling period in which the heater was turned off and the sample was allowed to cool to room temperature (see, Supplementary Figure S2A for the detailed temperature ramp). For the “constant 80°C” profile, the sample also experienced a heating ramp at the start of the experiment, but because it had to reach a higher temperature than the 40°C sample and the ramp rate was set at 5°C/min, the 80°C heating ramp took longer. This was followed by a short hold time at 80°C of about 35 min, and finally a cooling period, again induced simply by turning off the heater and allowing the sample to cool to room temperature (see, Supplementary Figure S2B).
The XPCS experiments were performed at the Coherent Hard X-ray beamline (11-ID) of the National Synchrotron Light Source II at Brookhaven National Laboratory. The partially coherent X-rays had an energy of 9.65 keV (λ = 0.128 nm), selected by Si (111) double-crystal monochromators. The unattenuated beam flux was 3 × 10¹¹ photons/second, in a 40 μm diameter spot at the sample position. Speckle patterns were collected in SAXS transmission geometry using an Eiger X 4 M pixelated photon counting detector (Dectris), with a sample-to-detector distance of 16.03 m. The optimal transmission, frame rate, and exposure times were controlled by attenuating the beam using double-sided polished silicon wafers and a millisecond fast shutter. Radiation damage was mitigated by ensuring that no changes in dynamics were induced in the sample from exposure to the X-ray beam over the length of the scan (i.e., the observed dynamics were independent of total X-ray dose and dose rate). In addition, the sample was moved perpendicular to the beam for each XPCS time series so that X-ray dose did not accumulate. A range of frame rates and exposures were used to capture dynamics over a wide range of time scales, from as low as 0.025 s by 500 frames for a total 12.5-s time series, to as high as 16.25 s by 500 frames for a total 2.25-h time series. Frame rates, temperature, and motion control were integrated and controlled by the Experimental Physics and Industrial Control System (EPICS) running on a dedicated workstation, which was in communication with the beamline to allow synchronized process control and X-ray scattering data acquisition via the BlueSky data collection framework (GitHub, 2022; EPICS, 2024). Calculations of correlation functions were performed using the CHX beamline Python code (Abeykoon et al., 2016).
Dielectric analysis was performed using a NETZSCH DEA 288 Ionic dielectric analyzer. A typical DEA experiment returns the ion viscosity (IV) of a material as a function of time. For an isothermal DEA experiment, the ion viscosity can be related to the degree of cure (α) with the relationship, α = k*log (IV) + C (Pascault and Williams, 1990), where both k and C are numerical constants. As specified by the manufacturer, the unmixed components of the epoxy were heated at 60°C for 1 h prior to extrusion, to melt a crystalline component and ensure proper mixing and reaction. The epoxies were then extruded through a mixing nozzle to begin the curing reaction and placed in the dielectric analyzer. Each DEA experiment was performed isothermally to simplify calculations of the degree of cure. One sample was held at 40°C, and another was held at 80°C.
Results and discussion
The time-resolved small-angle X-ray scattering (SAXS) curves, I(q), which reflect the structure of the system during the curing reaction, can be obtained by radial averaging of the coherent scattering pattern from the XPCS time series (Figure 1). Figure 1 shows representative SAXS profiles at the early and final stages of curing. The SAXS curve changed subtly, suggesting that the evolution of the filler structure within the experimental time window was minimal. The scattering signal is dominated in the high q regime by a form factor of filler particles, appearing as oscillations at q > 0.006 Å-1. A power-law q dependence (i.e., I(q) ∝ q-p) is observed in the low q regime. The particle size of lamellar talc (>10 μm) is larger than the length scales resolved in the q range, so its form factor is not resolved. Silica (SiO2) and carbon black (CB) fillers are also mixed in the sample. The SiO2 particles used here were surface treated to prevent aggregation, which meant they were more uniformly dispersed in the epoxy. Therefore, we attribute the oscillations to a form factor of the relatively monodisperse SiO2 filler rather than the primary CB filler which are typically fused together (Koga et al., 2008). However, the fitting of the I(q) curves was not straightforward; this epoxy was a complicated scattering system due to multiple competing scattering contributions within the observed q range. Hence, we compare the experimental data and a calculated form factor, rather than fitting.
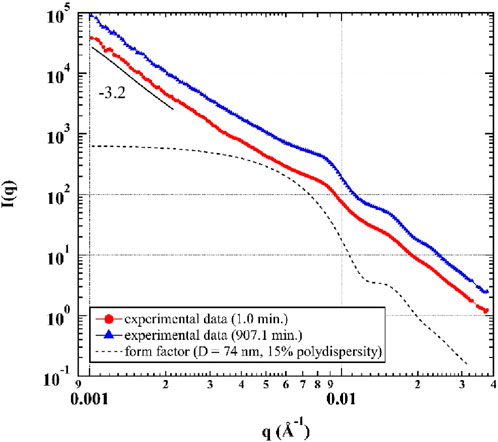
Figure 1. SAXS curves of the epoxy cured at 40°C, shown at tage = 1.0 min and tage = 907.1 min. The black dashed line is the form factor of the SiO2 filler. Curves are vertically shifted for readability. The gap in each curve at q ≈ 0.033 A-1 is due to the removal of a diffraction peak resulting from the beam stop, which was not relevant to the material studied here.
A calculated form factor of spherical SiO2 particles with a diameter (D) of 74 nm and a polydispersity of 15% is shown in Figure 1 (black dashed line). This calculated form factor reasonably expresses the shapes and peak positions of the three peaks located at approximately q = 0.009 Å-1, 0.016 Å-1, and 0.023 Å-1 in the experimental data. An “apparent” power law with an exponent p = −3.2 is observed in the low q regime. The exponent is “apparent” because the contributions from the form factor at q = 0.009 Å-1 influence the scattering curve at low q, so it is not solely a pure power-law fit in the low q regime. We expect this power-law contribution to come from a surface fractal structure of the talc. Since a detailed discussion of the nanoparticle structure is beyond our current interest, these questions deserve future work. In any case, we chose to limit the evaluation of the XPCS data to q > 0.006 Å-1, which is above the q-region that is affected by scattering from the talc and/or aggregates of SiO2 and CB, to minimize any possible influence from these structures on the dynamics. Therefore, we ensured that the dynamics discussed herein are mainly from the primary SiO2 fillers.
We studied the out-of-equilibrium dynamics of the epoxy during the curing process. Figure 2 shows two XPCS two-time correlation functions that are representative of the curing process. Each two-time correlation function in Figure 2 reflects dynamics in the curing material over a particular range of times. It is essential to note that the two-time correlation functions represent dynamics of the primary scatterers, i.e., the SiO2 filler particles (see Figure 1), which in turn are affected by the evolving dynamics of the curing epoxy. The right panel of Figure 2 depicts a later stage in the curing process, where the combination of X-ray exposure time and number of frames allowed us to capture the crosslinking dynamics in such a way that they appeared to be in “quasi-equilibrium”, represented as a straight, diagonal shape of the two-time correlation function. Therefore, for the duration of the scan, the filler particle dynamics slowed only slightly, implying that the rate of the epoxy’s crosslinking dynamics also slowed only slightly, and analysis of the two-time correlation function with Eqs 3, 4 was relatively straightforward. In contrast, and much less frequently, the dynamics of the epoxy appeared to be “out-of-equilibrium”. The left panel of Figure 2 depicts these “out-of-equilibrium” dynamics at an earlier stage in the curing process. In this time series, the range of lag times over which there is strong correlation (yellow color in Figure 2) was rapidly decreasing with increasing experimental time; the rapid loss of correlation with experimental time indicates that the epoxy’s crosslinking dynamics were speeding up. During this time series, the sample temperature was increasing due to the initial ramp up in the temperature profile, which explains the dynamics speeding up. To analyze time series like this one, a small Δtage is chosen over which to calculate the one-time correlation function. This Δtage should ideally cover a range in the time series that is approximately quasi-equilibrium (e.g., 40–60 s in the left panel of Figure 2).
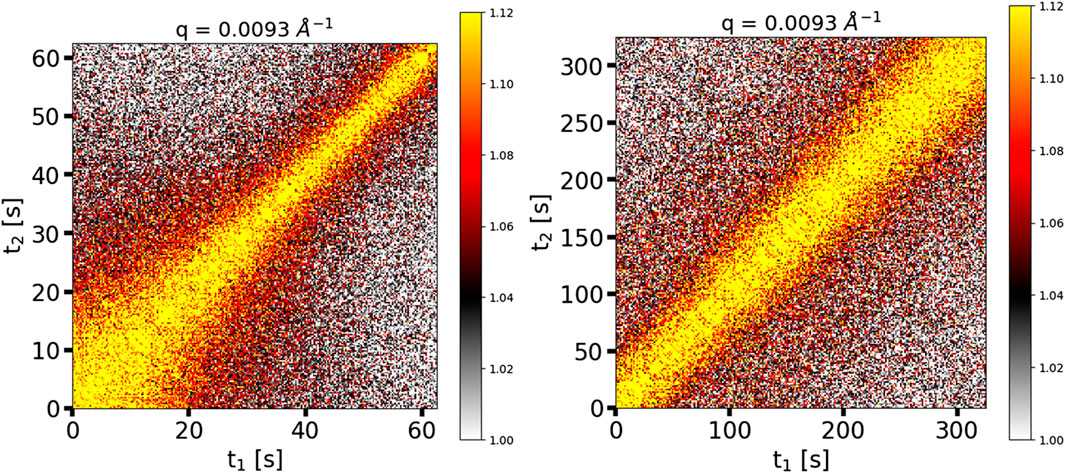
Figure 2. Two-time correlation functions of the adhesive cured at 40°C; (left) “out-of-equilibrium” dynamics; (right) “quasi-equilibrium” dynamics.
In Figure 3, we plot a series of evolving one-time correlation functions selected at various times, with a representative q value of q = 0.0093 Å-1. Here, g2 is normalized as (g2–A)/β so that the decay progresses from an initial value of one to a final baseline value of 0. For both temperature runs, we captured the dynamics with lag times (τ) extending up to 5,000 s, at aging times well after the epoxy had fully solidified macroscopically. Interestingly, for both temperature conditions, decorrelation in g2 was still observed at very long aging times (tage = 767.1 min for 40°C, tage = 772.8 min for 80°C). Previous work (Cipelletti et al., 2000; Cipelletti et al., 2003; Kwaśniewski et al., 2014) proposed that a q-independent value of the stretching exponent (γ) greater than one is indicative of deformation due to the relaxation of internal stresses built up during the curing reaction (see Figure 4 and Supplementary Figure S3). This relaxation can cause a complete decay of g2, even for fully developed solids. It is this relaxation process that is responsible for the decay of the one-time correlation function over the lag time τ > 103 s seen in Figure 3. We did not observe complete decorrelation at these late times because a scan to resolve the decorrelation would itself take longer than 103 s. It is not justified to quantitatively discuss incomplete g2 decay using a fit of the KWW equation, so these late aging times are not included in further discussions pertaining to the KWW fitting parameters. These results are consistent with the manufacturer’s claim that the epoxy takes up to 48 h to fully cure. Hence, XPCS is a powerful technique that can reliably track these slow dynamics in macroscopically solidified materials such as this epoxy resin.
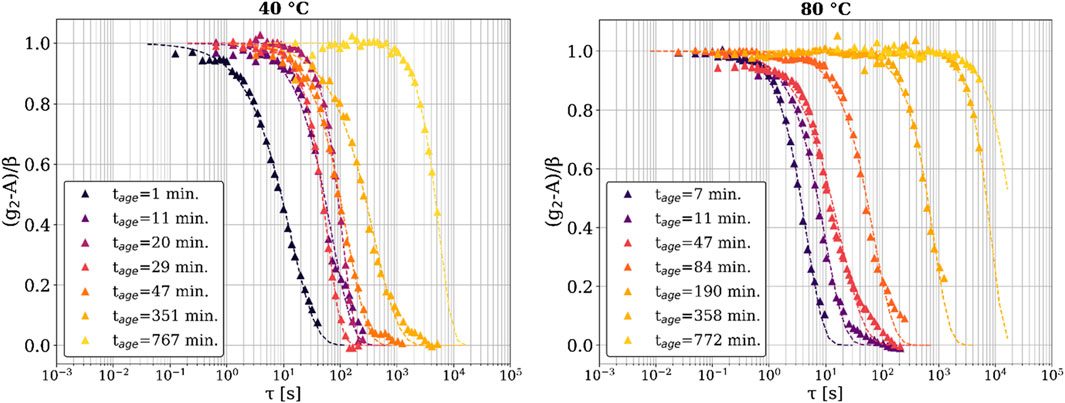
Figure 3. Fits of the KWW equation to the normalized one-time correlation functions (g2) at q = 0.0093 Å-1; (left) 40°C sample, (right) 80°C sample. The triangular points are the correlation function data, and the dashed lines are the fits of the KWW equation. The legend shows the time at which each correlation function was calculated.
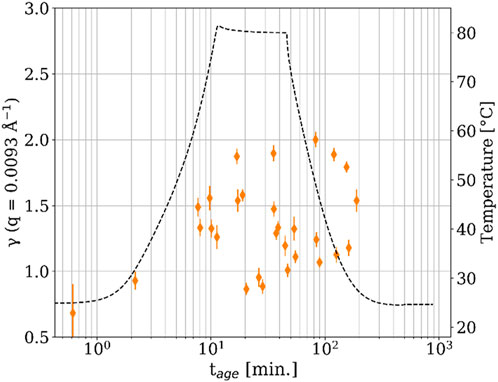
Figure 4. Stretching exponent (γ) versus time after mixing for the 80°C sample. The dashed line shows the temperature.
We studied the curing process of the epoxy through changes in the physical properties of the epoxy by fitting the KWW equation (Eq. 4) to the one-time correlation function (g2). The stretch/compression exponent (γ) determines the shape of the g2 curve and provides insight into the type of dynamics exhibited by the SiO2 filler particles as the epoxy cures. Through the interactions between the filler particles and the thermoset network, the γ exponent characterizes the overall dynamics of the epoxy, with γ < 1 indicating sub-diffusive dynamics and γ > 1 indicating hyper-diffusive dynamics (Guo et al., 2009; Jang et al., 2014).
Supplementary Figure S4 shows the time dependence of γ for the 80°C sample. At tage < 10 min, γ was less than 1, which represents sub-diffusive dynamics and is attributed to the emergence of multiple relaxation processes in the disordered system (Johnston, 2006). However, after tage = 10 min, the value of γ quickly became difficult to describe with a conclusive pattern due to high variability with tage. At the beginning of the temperature ramp, γ became greater than one and began to approach γ = 1.5 or higher, representing hyper-diffusive dynamics and indicating that the relaxation becomes compressed (i.e., faster than an exponential decay). We previously reported that a change of γ from 1 (the least stressed state, i.e., no epoxy network formation) to 1.5 < γ < 2.0 is associated with the onset of epoxy network formation (i.e., gelation) (Yavitt et al., 2020a; Yavitt et al., 2020b; Yavitt et al., 2023). Therefore, it appears that the formation of the thermoset network started around tage = 10 min for the 80°C sample. After this point, γ fluctuated significantly until tage ≈ 200 min, suggesting some stress relief in the network associated with thermally induced curing (Yavitt et al., 2020a; Yavitt et al., 2020b; Yavitt et al., 2023). Cipelletti et al. (Cipelletti et al., 2003) proposed that a compression exponent less than two is indicative of a wide distribution of ballistic relaxation times. In this epoxy the value of γ fluctuates considerably, but remains less than 2, which, in combination with the curing dynamics described below (Figure 6), may represent stress relief seen as a range of relaxation times. The observed value of γ was found to be almost independent of q for multiple values of tage (Supplementary Figure S3). For the 40°C sample, γ was also less than one before the onset of heating (Supplementary Figure S4), but the transition from γ = 1 to 1.5 < γ < 2.0 was not so clear. Like the 80°C sample, there was a lot of variability in γ over tage, making it difficult to discern a pattern. However, γ generally remained below 2, also pointing towards the same stress relief associated with curing that was seen for the 80 °C sample. Though there were notable exceptions around tage = 20 min, which makes drawing a conclusion difficult. Generally, such hyper-diffusive dynamics, characterized by γ > 1, are a common feature in the aging regime of soft condensed matter systems (Cipelletti et al., 2000; Bellour et al., 2003; Cipelletti et al., 2003; Kaloun et al., 2005; Robert et al., 2006). Further XPCS experiments on this material at different temperatures would help elucidate this difference and deserve future work.
For soft matter systems, the relationship between the relaxation rate (Γ) and q is of interest because it indicates whether the observed dynamics are diffusive or ballistic (Fluerasu et al., 2007). As shown in Figure 5, the epoxy shows linear scaling between Γ and q for both the 40°C and the 80°C samples throughout the experiment. Linear scaling between Γ and q has been observed for colloidal gels, concentrated emulsions, and nanoparticles suspended in polymer matrices (Cipelletti et al., 2000; Cipelletti et al., 2003; Bandyopadhyay et al., 2004; Fluerasu et al., 2007). The linear scaling coupled with a compressed exponential of γ = 1.5 represents collective, ballistic dynamics resulting from the release of micro-stresses generated in the internal structure of the sample (Cipelletti et al., 2003). The lines in Figure 5 show the best fits to the experimental data where Γ = vdq. In this equation, vd is a proportionality constant representing the linear, ballistic motion of scatterers as a local displacement velocity with units of Å/s (Cipelletti et al., 2000; Cipelletti et al., 2003). The samples at both curing temperatures show progressively slower dynamics as the time increases (i.e., as the crosslinking reaction takes place).
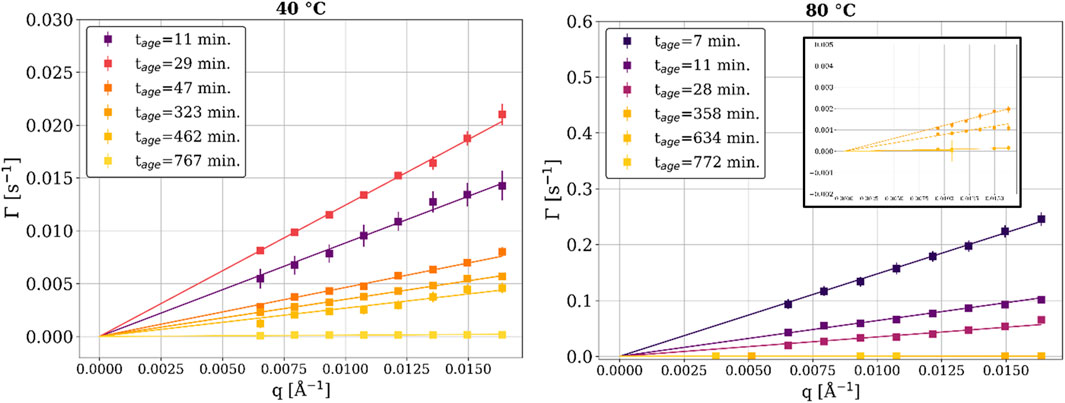
Figure 5. Relaxation rate (Γ) as a function of the scattering vector (q) for a range of times, at 40°C and 80 °C. The inset in the right image is a “zoomed in” view of the later tage relaxation rates.
The displacement velocity (vd) is a key quantity in the study of epoxy’s curing kinetics. It describes the linear displacement dynamics resulting from the interaction between the filler and the polymer matrix and is independent of length scale (as seen in Figure 5)4 (Yavitt et al., 2023). The displacement velocity is plotted as a function of time in Figure 6. The formation of the crosslink network (i.e., gelation) can be observed for both samples starting before tage = 10 min, as the vd of both samples started to decay with a power-law exponent (m) of around −1 (i.e.,
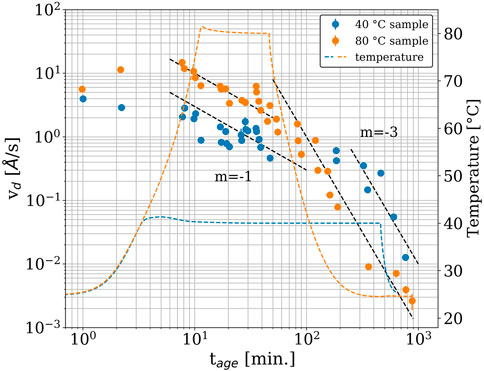
Figure 6. Displacement velocity as a function of time (colored points), with temperature included for reference (colored dashed lines). The data are the same color as the corresponding temperature profile. Dashed black lines show the power-law trend with the corresponding power-law exponent (m).
A similar trend was observed with the isothermal curing at 40°C. According to the manufacturer’s specifications, at 40°C (ambient temperature in tropical climates) the epoxy should be cured for approximately 9 h prior to practical use. Supplementary Figure S5 shows the DEA results for the epoxy resins cured at 40°C and 80°C. From the figure, we can see that curing for 450 min at 40°C allowed us to achieve a reaction conversion of about 85% (α = 0.85). However, as shown in Figure 6, the vd of the epoxy at 450 min was 0.5 Å/s. This was still at least two orders-of-magnitude greater than that of the 80 °C sample at tage = 900 min, suggesting that the vitrification process of the 40°C sample was not complete during this 450-min isothermal curing process. Again, and as we saw for the isothermal curing at 80°C, the vitrification occurred only after cooling to room temperature. This cooling-induced vitrification process of the epoxy resin, which cannot be identified by DEA alone, clearly demonstrates the additional information that can be obtained with XPCS alongside conventional technique for studying the complicated gelation/vitrification process of epoxy resins.
Enns and Gillham proposed a time-temperature-transformation (TTT) diagram that predicts gelation and vitrification as a function of cure time and temperature (Enns and Gillham, 1983). According to their TTT diagram, epoxy resins are expected to undergo gelation and then vitrification as the cure time increases at a given cure temperature. It should be noted that if the cure temperature is too high, the epoxy resin will degrade without vitrification, and if the cure temperature is too low, the epoxy resin will vitrify without gelation. Therefore, it is extremely important to optimize a cure temperature to achieve the desired final strength of an epoxy, keeping in mind that curing at “room temperature” (roughly in the 20°C–40°C range, depending on the local ambient climate conditions) is desirable. The TTT phase diagram for this epoxy is not available, but the XPCS results show that the vd gradually decreased over time during the two isothermal curing conditions, indicating a prolonged vitrification process at the microscopic scale. For both epoxy samples, cooling from the isothermal set point drastically decreased the vd, reducing the overall curing time at each temperature. Similar industrial materials reported previously (Yavitt et al., 2020a; Yavitt et al., 2020b; Yavitt et al., 2023) did not show such rapid decreases in displacement velocity when the temperature was reduced, suggesting that they were relatively temperature insensitive. This commercial epoxy’s temperature sensitivity is what ultimately allowed it to meet the curing time and “room temperature” design criteria specified by the manufacturer: ∼9 h at 40°C, or 30 min at 80°C. If the epoxy were cured isothermally, e.g., at 40°C, with no cooling, the time required to reach a sufficiently cured state would likely be much larger than what was observed with XPCS, as seen in the DEA experiments (Supplementary Figure S5). The mechanism behind the temperature sensitivity of this epoxy is beyond the scope of this paper, but it would be a promising direction for future work.
Conclusion
XPCS allows for experiments on time and length scales that are inaccessible with conventional techniques. For example, rheology can be used to obtain experimental results with comparable time resolution, but in the case of curable adhesives, the rheometer would seize up and stop working, while XPCS could continue to extract meaningful data long beyond this point. This experiment was an example of such, where the cure kinetics were analyzed up to 12 h after the epoxy resin components were mixed; a point when the epoxy is macroscopically fully solid. Another challenge in studying cross-linkable polymers under industrial application conditions is the need for spatial resolution, as crosslinking reactions often proceed in a spatially heterogeneous manner due to boundary conditions (e.g., proximity to interfaces)–another benefit granted by XPCS. XPCS experiments can also be configured to mimic a variety of industrial conditions, including ex-situ, in situ, or in-operando mixing.
We leveraged these benefits of XPCS to study a range of useful and physically relevant metrics of a commercial epoxy resin, such as the time it took for the epoxy to cure and how this was affected by the applied temperature, the type of dynamics exhibited by the nanoparticle filler markers, and the relaxation modes present in the epoxy as it cured. The crosslinking kinetics of the epoxy were resolved for more than 12 h after mixing, using the scattering of the SiO2 filler and the interactions between the thermoset network and the filler to track the crosslinking kinetics of the epoxy. The type of the filler dynamics was confirmed to be ballistic, as expected based on previous literature results for crosslinking polymers (Yavitt et al., 2020a; Yavitt et al., 2020b; Trigg et al., 2021; Yavitt et al., 2023). Our data indicate that the filler dynamics are comparable within one order-of-magnitude before and after the isothermal temperature condition was reached, indicating a similarity in dynamics between the pre-gelation and post-gelation epoxy resins. The displacement velocity during the isothermal curing portion of both temperature profiles did not decrease as much as was expected. The subsequent cooling to room temperature induced a secondary rapid decay process, and the filler dynamics were found to undergo a transition from a power-law exponent (m) of −1 to m = −3 with aging time. A dynamics-property correlation is a promising avenue for future work. This sample fits well into the broader context of cross-linkable polymers. Its trends in displacement velocity, its relaxation modes (γ), and its ballistic dynamics show a high degree of similarity to previous work on similar crosslinking polymers (Andrews et al., 2018; Yavitt et al., 2020a; Yavitt et al., 2020b; Hoshino et al., 2021; Trigg et al., 2021; Yavitt et al., 2023). For these reasons, XPCS should be considered a “go-to” technique for the study of industrially relevant and complex polymer systems under out-of-equilibrium conditions.
Data availability statement
The original contributions presented in the study are included in the article/Supplementary Material, further inquiries can be directed to the corresponding author.
Author contributions
LT: Writing–original draft. LW: Writing–review and editing. SP: Writing–review and editing. TB: Writing–review and editing. TE: Writing–review and editing. ME: Writing–review and editing. TK: Writing–review and editing.
Funding
The author(s) declare that financial support was received for the research, authorship, and/or publication of this article. TK acknowledges partial financial support from the National Science Foundation (DMR 2210207 and DGE 1922639). This work used beamline 11-ID of the National Synchrotron Light Source-II, which is a U.S. DOE Office of Science Facility at Brookhaven National Laboratory under Contract No. DE-SC0012704.
Conflict of interest
SP was employed by Henkel Corporation. TB was employed by Henkel AG & Co KGaA, Heidelberg. TE was employed by Henkel AG & Co KGaA, Düsseldorf.
The remaining authors declare that the research was conducted in the absence of any commercial or financial relationships that could be construed as a potential conflict of interest.
Publisher’s note
All claims expressed in this article are solely those of the authors and do not necessarily represent those of their affiliated organizations, or those of the publisher, the editors and the reviewers. Any product that may be evaluated in this article, or claim that may be made by its manufacturer, is not guaranteed or endorsed by the publisher.
Supplementary material
The Supplementary Material for this article can be found online at: https://www.frontiersin.org/articles/10.3389/frsfm.2024.1345791/full#supplementary-material
References
Abeykoon, S. K., Zhang, Y., Dill, E. D., Caswell, T. A., Allan, D. B., Akilic, A., et al. (2016). “Software tools for X-ray photon correlation and X-ray speckle visibility spectroscopy,” in 2016 New York Scientific Data Summit (NYSDS), New York, NY, USA, 14-17 August 2016, 1–10. doi:10.1109/NYSDS.2016.7747815
Andrews, R. N., Narayanan, S., Zhang, F., Kuzmenko, I., and Ilavsky, J. (2018). Inverse transformation: unleashing spatially heterogeneous dynamics with an alternative approach to XPCS data analysis. J. Appl. Cryst. 51 (1), 35–46. doi:10.1107/S1600576717015795
Araki, W., Adachi, T., Gamou, M., and Yamaji, A. (2002a). Time–temperature dependence of fracture toughness for bisphenol A epoxy resin. Proc. Institution Mech. Eng. Part L-journal Materials-design Appl. - PROC I 216, 79–84. doi:10.1243/146442002320139289
Araki, W., Adachi, T., Yamaji, A., and Gamou, M. (2002b). Fracture toughness of bisphenol A-type epoxy resin. J. Appl. Polym. Sci. 86 (9), 2266–2271. doi:10.1002/app.11208
Bahrami, A., Morelle, X., Hông Minh, L. D., Pardoen, T., Bailly, C., and Nysten, B. (2015). Curing dependent spatial heterogeneity of mechanical response in epoxy resins revealed by atomic force microscopy. Polymer 68, 1–10. doi:10.1016/j.polymer.2015.04.084
Bandyopadhyay, R., Liang, D., Yardimci, H., Sessoms, D. A., Borthwick, M. A., Mochrie, S. G. J., et al. (2004). Evolution of particle-scale dynamics in an aging clay suspension. Phys. Rev. Lett. 93 (22), 228302. doi:10.1103/PhysRevLett.93.228302
Bellour, M., Knaebel, A., Harden, J. L., Lequeux, F., and Munch, J. P. (2003). Aging processes and scale dependence in soft glassy colloidal suspensions. Phys. Rev. E 67 (3), 031405. doi:10.1103/PhysRevE.67.031405
Cipelletti, L., Manley, S., Ball, R. C., and Weitz, D. A. (2000). Universal aging features in the restructuring of fractal colloidal gels. Phys. Rev. Lett. 84 (10), 2275–2278. doi:10.1103/PhysRevLett.84.2275
Cipelletti, L., Ramos, L., Manley, S., Pitard, E., Weitz, D. A., Pashkovski, E. E., et al. (2003). Universal non-diffusive slow dynamics in aging soft matter. Faraday Discuss. 123 (0), 237–251. doi:10.1039/B204495A
Ehrburger-Dolle, F., Morfin, I., Bley, F., Livet, F., Heinrich, G., Chushkin, Y., et al. (2019). Anisotropic and heterogeneous dynamics in stretched elastomer nanocomposites. Soft Matter 15 (18), 3796–3806. doi:10.1039/C8SM02289E
Ellis, B. (1993). “The kinetics of cure and network formation,” in Chemistry and technology of epoxy resins. Editor B. Ellis (Netherlands: Springer), 72–116.
Enns, J. B., and Gillham, J. K. (1983). Time–temperature–transformation (TTT) cure diagram: modeling the cure behavior of thermosets. J. Appl. Polym. Sci. 28 (8), 2567–2591. doi:10.1002/app.1983.070280810
Estridge, C. E. (2018). The effects of competitive primary and secondary amine reactivity on the structural evolution and properties of an epoxy thermoset resin during cure: a molecular dynamics study. Polymer 141, 12–20. doi:10.1016/j.polymer.2018.02.062
Fluerasu, A., Moussaïd, A., Madsen, A., and Schofield, A. (2007). Slow dynamics and aging in colloidal gels studied by x-ray photon correlation spectroscopy. Phys. Rev. E 76 (1), 010401. doi:10.1103/PhysRevE.76.010401
Gu, X., Raghavan, D., Ho, D. L., Sung, L., VanLandingham, M. R., and Nguyen, T. (2011). Nanocharacterization of surface and interface of different epoxy networks. MRS Online Proc. Libr. 710 (1), 1091. doi:10.1557/PROC-710-DD10.9.1
Guo, H., Bourret, G., Corbierre, M. K., Rucareanu, S., Lennox, R. B., Laaziri, K., et al. (2009). Nanoparticle motion within glassy polymer melts. Phys. Rev. Lett. 102 (7), 075702. doi:10.1103/PhysRevLett.102.075702
Gupta, T., Strelcov, E., Holland, G., Schumacher, J., Yang, Y., Esch, M. B., et al. (2020). Electron and X-ray focused beam-induced cross-linking in liquids: toward rapid continuous 3D nanoprinting and interfacing using soft materials. ACS Nano 14 (10), 12982–12992. doi:10.1021/acsnano.0c04266
Hoshino, T., Okamoto, Y., Yamamoto, A., and Masunaga, H. (2021). Heterogeneous dynamics in the curing process of epoxy resins. Sci. Rep. 11 (1), 9767. doi:10.1038/s41598-021-89155-x
Jang, W.-S., Koo, P., Bryson, K., Narayanan, S., Sandy, A., Russell, T. P., et al. (2014). Dynamics of cadmium sulfide nanoparticles within polystyrene melts. Macromolecules 47 (18), 6483–6490. doi:10.1021/ma500956b
Jin, F.-L., Li, X., and Park, S.-J. (2015). Synthesis and application of epoxy resins: a review. J. Industrial Eng. Chem. 29, 1–11. doi:10.1016/j.jiec.2015.03.026
Johnson, K. J., Wiegart, L., Abbott, A. C., Johnson, E. B., Baur, J. W., and Koerner, H. (2019). In operando monitoring of dynamic recovery in 3D-printed thermoset nanocomposites by XPCS. Langmuir 35 (26), 8758–8768. doi:10.1021/acs.langmuir.9b00766
Johnston, D. C. (2006). Stretched exponential relaxation arising from a continuous sum of exponential decays. Phys. Rev. B 74 (18), 184430. doi:10.1103/PhysRevB.74.184430
Kaloun, S., Skouri, R., Skouri, M., Munch, J. P., and Schosseler, F. (2005). Successive exponential and full aging regimes evidenced by tracer diffusion in a colloidal glass. Phys. Rev. E 72 (1), 011403. doi:10.1103/PhysRevE.72.011403
Kishi, H., Naitou, T., Matsuda, S., Murakami, A., Muraji, Y., and Nakagawa, Y. (2007). Mechanical properties and inhomogeneous nanostructures of dicyandiamide-cured epoxy resins. J. Polym. Sci. Part B Polym. Phys. 45 (12), 1425–1434. doi:10.1002/polb.21170
Koga, T., Hashimoto, T., Takenaka, M., Aizawa, K., Amino, N., Nakamura, M., et al. (2008). New insight into hierarchical structures of carbon black dispersed in polymer matrices: a combined small-angle scattering study. Macromolecules 41 (2), 453–464. doi:10.1021/ma071867l
Koga, T., Li, C., Endoh, M. K., Koo, J., Rafailovich, M., Narayanan, S., et al. (2010). Reduced viscosity of the free surface in entangled polymer melt films. Phys. Rev. Lett. 104 (6), 066101. doi:10.1103/PhysRevLett.104.066101
Kohlrausch, R. (1854). Theorie des elektrischen Rückstandes in der Leidener Flasche. Ann. Phys. 167 (1), 56–82. doi:10.1002/andp.18541670103
Kwaśniewski, P., Fluerasu, A., and Madsen, A. (2014). Anomalous dynamics at the hard-sphere glass transition. Soft Matter 10 (43), 8698–8704. doi:10.1039/C4SM01671H
Lehmkühler, F., Roseker, W., and Grübel, G. (2021). From femtoseconds to hours—measuring dynamics over 18 orders of magnitude with coherent X-rays. Appl. Sci. 11 (13), 6179. doi:10.3390/app11136179
Mangal, R., Srivastava, S., Narayanan, S., and Archer, L. A. (2016). Size-dependent particle dynamics in entangled polymer nanocomposites. Langmuir 32 (2), 596–603. doi:10.1021/acs.langmuir.5b03311
Min, B. G., Hodgkin, J. H., and Stachurski, Z. H. (1993). The dependence of fracture properties on cure temperature in a DGEBA/DDS epoxy system. J. Appl. Polym. Sci. 48 (7), 1303–1312. doi:10.1002/app.1993.070480719
Morsch, S., Liu, Y., Greensmith, P., Lyon, S. B., and Gibbon, S. R. (2017). Molecularly controlled epoxy network nanostructures. Polymer 108, 146–153. doi:10.1016/j.polymer.2016.11.050
Morsch, S., Liu, Y., Lyon, S. B., and Gibbon, S. R. (2016). Insights into epoxy network nanostructural heterogeneity using AFM-IR. ACS Appl. Mater. Interfaces 8 (1), 959–966. doi:10.1021/acsami.5b10767
Nair, C. P. R. (2004). Advances in addition-cure phenolic resins. Prog. Polym. Sci. 29 (5), 401–498. doi:10.1016/j.progpolymsci.2004.01.004
Pascault, J. P., and Williams, R. J. J. (1990). Glass transition temperature versus conversion relationships for thermosetting polymers. J. Polym. Sci. Part B Polym. Phys. 28 (1), 85–95. doi:10.1002/polb.1990.090280107
Robert, A., Wandersman, E., Dubois, E., Dupuis, V., and Perzynski, R. (2006). Glassy dynamics and aging in a dense ferrofluid. EPL 75 (5), 764–770. doi:10.1209/epl/i2006-10179-4
Sahagun, C. M., and Morgan, S. E. (2012). Thermal control of nanostructure and molecular network development in epoxy-amine thermosets. ACS Appl. Mater. Interfaces 4 (2), 564–572. doi:10.1021/am201515y
Schlosser, E., and Schönhals, A. (1989). Recent development in dielectric relaxation spectroscopy of polymers. Colloid and Polym. Sci 267 (11), 963–969. doi:10.1007/BF01410156
Sharifi, M., Jang, C. W., Abrams, C. F., and Palmese, G. R. (2014). Toughened epoxy polymers via rearrangement of network topology. J. Mater. Chem. A 2 (38), 16071–16082. doi:10.1039/C4TA03051F
Siegert, A. J. F. (1943). On the fluctuations in signals returned by many independently moving scatterers. Cambridge, Massachusetts: Radiation Laboratory, Massachusetts Institute of Technology.
Sprenger, S. (2013). Epoxy resin composites with surface-modified silicon dioxide nanoparticles: a review. J. Appl. Polym. Sci. 130 (3), 1421–1428. doi:10.1002/app.39208
Trigg, E. B., Wiegart, L., Fluerasu, A., and Koerner, H. (2021). Dynamics of polymerization and gelation in epoxy nanocomposites via X-ray photon correlation spectroscopy. Macromolecules 54 (13), 6575–6584. doi:10.1021/acs.macromol.1c00727
Williams, G., and Watts, D. C. (1970). Non-symmetrical dielectric relaxation behaviour arising from a simple empirical decay function. Trans. Faraday Soc. 66 (0), 80–85. doi:10.1039/TF9706600080
Yavitt, B. M., Salatto, D., Huang, Z., Koga, Y. T., Endoh, M. K., Wiegart, L., et al. (2020a). Revealing nanoscale dynamics during an epoxy curing reaction with x-ray photon correlation spectroscopy. J. Appl. Phys. 127 (11), 114701. doi:10.1063/1.5141488
Yavitt, B. M., Wiegart, L., Salatto, D., Huang, Z., Endoh, M. K., Poeller, S., et al. (2020b). Structural dynamics in UV curable resins resolved by in situ 3D printing X-ray photon correlation spectroscopy. ACS Appl. Polym. Mater. 2 (9), 4096–4108. doi:10.1021/acsapm.0c00716
Keywords: X-ray photon correlation spectroscopy, epoxy, curing, network, out-of-equilibrium
Citation: Tsapatsaris L, Wiegart L, Petrash S, Baumeister T, Engels T, Endoh M and Koga T (2024) Real-time tracking of curing process of an epoxy adhesive by X-ray photon correlation spectroscopy. Front. Soft Matter 4:1345791. doi: 10.3389/frsfm.2024.1345791
Received: 28 November 2023; Accepted: 11 March 2024;
Published: 09 April 2024.
Edited by:
Kay Saalwächter, Martin-Luther-University Halle-Wittenberg, GermanyReviewed by:
Erkan Senses, Koç University, TürkiyeReiner Zorn, Helmholtz Association of German Research Centres (HZ), Germany
Mark Foster, University of Akron, United States
Copyright © 2024 Tsapatsaris, Wiegart, Petrash, Baumeister, Engels, Endoh and Koga. This is an open-access article distributed under the terms of the Creative Commons Attribution License (CC BY). The use, distribution or reproduction in other forums is permitted, provided the original author(s) and the copyright owner(s) are credited and that the original publication in this journal is cited, in accordance with accepted academic practice. No use, distribution or reproduction is permitted which does not comply with these terms.
*Correspondence: Tadanori Koga, dGFkYW5vcmkua29nYUBzdG9ueWJyb29rLmVkdQ==