 Ennio Lavagnini1
 Jonathan Booth2†
 Katy Helm2Ferdaous El-Benni2Patrick B. Warren1
 David J. Bray1
 Richard L. Anderson1*
- 1The Hartree Centre, STFC Daresbury Laboratory, Warrington, United Kingdom
- 2Croda International Plc, Goole, United Kingdom
Self-assembly of surfactants into complex structures is key to the performance of many formulated products, which form a significant fraction of the world’s manufactured goods. Here we adopt the dissipative particle dynamics simulation approach to explore the self-assembly process of surfactants, with the aim of understanding what information can be obtained that may correlate with an increased zero-shear viscosity of surfactant based products. To this end we experimentally measured the zero-shear viscosity of mixed micelle systems comprised of cocoamidopropyl betaine (CAPB) and sodium lauryl sarcosinate (SLSar), as a function of the CAPB/SLSar mass ratio and pH, and characterised the early stages of self-assembly of the same systems computationally. From simulation we identify three distinct behaviors in the micellar self-assembly process (logarithmic, linear and cubic growth) which we find show some degree of correlation with the experimental zero-shear viscosity. Owing to the relatively short simulation times required, this may provide formulation scientists with a practical route to identify regions of interest (i. e. those with a desired zero-shear viscosity) prior to synthesising de novo (potentially natural) surfactants.
1 Introduction
Surfactant molecules, with their amphiphilic nature, possess a remarkable capability to spontaneously organise into a diverse range of self-assembled structures. These structures, such as micelles and liquid crystalline phases, not only influence the physical characteristics of formulated products but also play a crucial role in enhancing their efficacy. By manipulating the surfactant chemistry, adjusting the formulation composition, or changing the external conditions, one can control the nature of the resulting self-assembled structures and in doing so tailor, for example, the viscosity, stability, and texture of formulations, thereby creating effective and economical products. However, when selecting surfactants, formulators can be faced with a difficult optimisation challenge. The surfactant must be safe to use, environmentally friendly, high performance and low cost.
A common class of ionic surfactants are the alkyl sulfates. These have many uses including cleaning products, hair care and laundry (Farn, 2008; Dave and Joshi, 2017). Unfortunately, some alkyl sulfates have the downside of being irritating to the skin (Ananthapadmanabhan et al., 1996; Deo and Somasunderan, 2003; Ananthapadmanabhan et al., 2004; Robinson et al., 2010). They can also be toxic to aquatic organisms (Abel, 1974; Liwarska-Bizukojc et al., 2005). Because of these concerns consumers are increasingly avoiding alkyl sulfate surfactants (Ananthapadmanabhan, 2019) and alternatives are needed. Sodium lauryl ether sulfate molecules have been adopted for personal care applications due to their high cleaning efficacy and reduced negative impacts upon the skin (due in part to the larger molecular structure and incorporation of ethylene oxide groups, in addition to a lower charge density). Sulfate based surfactants can, however, have negative environmental impacts due to their potential persistence in water bodies and their production processes (typically from petrochemicals), which may generate byproducts of concern (e.g., 1,4-dioxane, which can be present in trace amounts in products containing sulfate surfactants). Sarcosinates are a class of surfactant that can, potentially, overcome both of these issues. Comprising of a headgroup based on the amino acid sarcosine, and a hydrophobic alkane tail, these surfactants are milder than alkyl sulfates (Ananthapadmanabhan, 2019) and present good safety profiles (Lanigan, 2001). They are naturally derived (Ananthapadmanabhan, 2019), biodegradable (Bordes and Holmberg, 2015; Du et al., 2021) and can be produced via biological processes (Reznik et al., 2010). The presence of harmful by products is also diminished in this class of surfactant. These advantages make sarcosinate surfactants a potentially attractive option for the formulator.
Replacing existing surfactants with alternatives can be difficult, as direct replacement into an existing formulation is not guaranteed to be successful. To work effectively, formulators must understand the mechanism of action of the new surfactant and compatibility with other components. For example, sodium lauryl sarcosinate (SLSar) does not build significant viscosity when used as the sole surfactant; it is necessary to add a co-surfactant for worm-like micelle (WLMs hereafter) formation, required for viscosity build (Vu et al. (2020); Vu et al. (2021a)). For surfactants like SLSar, where the carboxylate group is highly susceptible to changes in pH this can present another challenge. Changing the ratio of protonated to deprotonated ionic surfactant present via pH (or the amount of salt present) can have dramatic consequences on self-assembled structures and the properties of the formulation (Vu et al. 2021a; Vu et al. 2021b; Xu et al., 2019).
Computer simulation is often positioned as a useful tool to aid identification of candidate surfactant systems, as it allows the elucidation of self-assembled surfactant microstructures and dynamics that may not be readily available to the experimentalist. It also affords the potential for rapid screening of candidate systems where the formulator can step outside their usual portfolio of surfactants, readily available from raw-materials suppliers, to explore novel (and natural) alternatives. Several computational approaches exist such as atomistic (e. g. molecular dynamics, MD) and coarse-grained approaches (e. g. coarse-grained MD, and dissipative particle dynamics, DPD). These offer insight at a molecular level to enable calculation of thermodynamic quantities, and to probe the self-assembly process of surfactants (into micelles and larger structures) that can inform the development of new surfactant formulations. Recently Taddese et al. (2020) has reviewed the state of the art in the simulation of surfactant systems.
Atomistic simulations (e. g. MD) have been used to study many surfactant micelle properties the including the characteristics and dynamics of micelles (Sanders et al., 2012; Anderson et al., 2017; Anderson et al. 2018; Dhakal and Sureshkumar 2015; Silva et al., 2019; Zhou and Ranjith, 2021; Song et al., 2020), structuring of surfactants on interfaces (Illa-Tuset et al., 2018; Müller et al., 2021) and use of surfactant self-assembly to deliver drugs (Bunker and Róg, 2020; He et al., 2022; Parchekani et al., 2022). Simulating surfactant self-assembly can be difficult with atomistic methods because of the computational cost associated with performing simulations over (relatively) long time-scales. Micelle structures typically form over several micro to milliseconds. This is beyond the limitations of routine atomistic approaches. Consequently, self-assembly of only a few micelles worth of surfactants can be studied with these techniques. Therefore, coarse-grained (CG) approaches are often applied (commonly based around the Martini force-field) (Marrink et al., 2007; Wang and Larson 2015; Burov et al., 2008; Wu et al., 2009; Jalili and Akhavan 2009; Sanders and Panagiotopoulos 2010; Velinova et al., 2011; Kraft et al., 2012; LeBard et al., 2012; Drew Bennett et al., 2013; Tang et al. 2014; Tang et al., 2017; Pérez-Sánchez et al., 2023; Nguyen et al., 2022; Peroukidis et al., 2022; Carvalho et al., 2022). Here, chemical structures are simplified by grouping multiple atoms together into a single interaction site (bead). Because CG systems require the simulation of fewer particles they enable the simulation of larger time-scales and systems than what are feasible with all-atom simulations.
Dissipative particle dynamics (DPD) is a particular CG approach that has become popular for the simulation of surfactant self-assembly as it allows significantly longer length and time-scales to be accessed at reduced computational cost (albeit with a potential loss in accuracy) (Hoogerbrugge and Koelman, 1992; Groot and Warren, 1997; Español and Warren, 2017). Like other CG approaches, in DPD groups of atoms (or molecules) are coarse-grained into beads. Where DPD differs is in the employment of very soft (conservative) potentials which facilitate the use of larger time-steps. DPD simulations have been applied to the study of surfactant self-assembly, for example, for WLMs Tang et al. (2017) calculated a number of micelle properties for model body-wash systems, Yu et al. (2017) studied the pH-responsive self-assembly of an amphiphilic dendritic polymers into micelles of different morphologies depending on the simulated pH, and Xu et al. (2019) investigated the pH-controlled formation of WLMs in a solution of a gemini-surfactant. Wand et al. (2020) calculated how the composition of a mixed surfactant system influences its self-assembly into WLMs. Several other DPD studies have reported on the simulated properties of micelles (Vishnyakov et al., 2013; Lee et al., 2013; Mao et al., 2015; Johnston et al., 2016; Lee et al., 2016; Anderson et al., 2017; Anderson et al., 2018; Anderson et al., 2023; Sangwai and Sureshkumar, 2011; Velinova et al., 2011; Nivón-Ramírez et al., 2022).
An important property in the development of surfactant-based formulated products is rheology, which influences a range of behaviors, from the ability of a product to flow from a bottle, the cleaning ability, to sensory interactions. The rheology of a formulation is strongly influenced by the nature of the self-assembled micellar structures present in it, in particular the presence of WLMs (Nachbar, 2011; Peroukidis et al., 2021). WLMs can lead to high viscosity (Anachkov et al., 2018; Danov et al., 2018), while more spherical and less tangled structures generally result in lower viscosity (Fogang et al., 2018; Fink, 2020). Because performance of a product is affected by its rheology, and the rheology is strongly influenced by the self-assembled surfactant microstructures, it is attractive for simulations to be able to quantify these dependencies. Direct calculation of rheological characteristics from simulation is difficult (Backer et al., 2005; Boromand et al., 2015; Kirova and Norman, 2015; Droghetti et al., 2018) although some progress has been made recently (Panoukidou et al., 2021) especially in the calculation of the scission energy of WLMs (Wang et al., 2018; Wand et al., 2020). Therefore, it is convenient to use metrics based on the surfactant structure which act as proxies for rheological properties. Simple metrics such as micelle sizes, aggregation number, shape and radius of gyration exist and are simple to calculate (Bray et al., 2019). The relationship between aggregation number (Nagg hereafter) and rheology in surfactant solutions is intricate and subject to various factors (Zhou et al., 2011; Fieber et al., 2021). Broadly, spherical micelles have minimal impact on viscosity, whereas elongated micelle aggregates are associated with a notable viscosity increases. However, a surfactant that produces large WLMs may display low viscosity if the micelle breakage rate is sufficiently high. In addition, past a certain threshold, viscosity might decrease due to the emergence of branching, or the formation of lamellar (or disc-like) structures (Rogers et al., 2014; Aveyard, 2019). Nevertheless, the primary mechanism of viscosity build in micellar systems involves growth and entanglement of long WLMs (Aveyard, 2019). Given these trends, it is interesting to explore if simulating self-assembly can be used to screen candidate surfactants and formulations for potential viscosity enhancement. If possible then one could use such simulations to direct subsequent laboratory efforts, enabling focus on a select few samples, optimising efficiency, reducing time, and minimising costs.
In this communication we focus on the zero-shear viscosity of a surfactant solution as a key rheological performance indicator, and a key formulation target which is relatively easily measured. We study the self-assembly behavior of SLSar, and co-surfactant cocoamidopropyl betaine (CAPB) to determine if DPD simulations can indeed provide insight into the zero-shear viscosity, basing our work on previously published DPD models used to describe other surfactant systems (Anderson et al., 2018; Wand et al., 2020; Panoukidou et al., 2021). Simulation results are compared to experimentally measured values for zero shear viscosity at similar compositions to understand if there is a correlation between these methods that may form the basis for confidence in a screening protocol for novel surfactants. To be of practical utility, such simulations should be geared as a rapid and cost efficient in silico screening tool. Therefore we choose to focus on short time-scale simulations, exploring the early stages of self-assembly, the motivation for which is discussed further into the paper. Note that we do not conduct imaging studies of the experimental systems, rather choosing to rely on well defined links between certain rheological behaviors and micelle structures, e. g., those determined by cryo TEM (Danino, 2012; Anachkov et al., 2018).
The article is arranged as follows. We first describe the protocols used for laboratory experimentation and the corresponding results obtained. Following this, we present the computational study including methodologies adopted and our results. Finally, we bring the experimental and simulated results together to assess the correlation between the two. We provide our conclusions before closing the article.
2 Experimental methods and results
Here we describe the experimental approach for collecting zero-shear viscosity data for the CAPB/SLSar surfactant solutions and present the results obtained.
2.1 Materials
Amino acid-based surfactant SLSar (30 wt%) containing 0.2 wt% NaCl (Crodasinic™ LS30) was used along with CAPB (30 wt%) and 4.2 wt% NaCl (Crodateric™ CAB 30). The agents used to adjust pH were NaOH and citric acid, from Sigma Aldrich, both above 99% purity. Distilled water was used in all experiments.
2.2 Sample preparation and composition
Solutions with eight different mass ratios of CAPB/SLSar were prepared as detailed in Table 1. Samples were mixed using a digital magnetic stirrer until total homogenisation. The solutions varied from pH 3.5 to 6.5. After preparation, the solutions were allowed to equilibrate for at least 24 h before any experiments were performed to ensure equilibration.
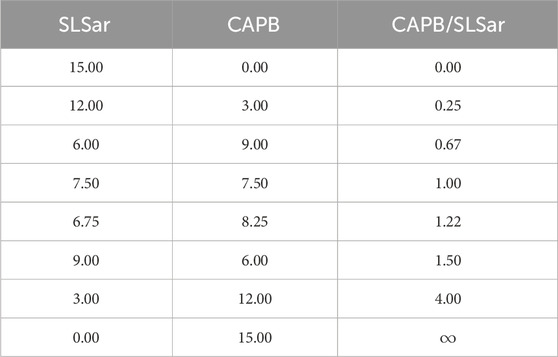
TABLE 1. Active concentrations (wt%) of CAPB/SLSar mixtures sampled.
2.3 Rheological analysis
To explore the rheological properties of solutions, measurements were taken using an Anton Paar MCR 302 rotational rheometer. Measurements were performed with a cup and bob stainless steel device of 18 mm diameter and 17 mm diameter, 25 mm length, respectively, with a fixed gap. A solvent trap was used to prevent solvent evaporation during measurements. Samples were allowed to relax and acclimatise for 5 min after loading, before measurement. All measurements were carried out at 25°C in duplicate and the average was reported in the results.
The flow properties of the samples were measured by recording shear stress (σ) and viscosity (η) values when shearing the samples at ascending and descending shear rates ranging from 0.01 to 1,000 s−1 then 1,000 to 0.01 s−1 (logarithmic scale). Data was gathered at 10 points per decade. The parameter collected during this experiment was the zero-shear viscosity, denoted η0 and oftentimes obtained in the quasi-Newtonian (plateau) region.
2.4 Experimental results
Table 2 shows the results of the flow shear rate sweep tests. In regions that were both low pH and low mass ratio of CAPB/SLSar turbid systems were observed. These liquids were white and cloudy and, under cross polarised microscopy, showed an absence of crystalline material. Shortly after blending these liquids had extremely high zero-shear viscosities of tens of thousands of mPa s. After a few hours these liquids transitioned to low viscosity. It is likely that this behavior is related to the protonation and precipitation of the acid form of SLSar at a pH close to or below its pKa of 4.5 (Wallach et al., 1992). Similar effects were encountered by Vu et al. (2020) and we agree with their assessment that these systems are best discarded due to their unsuitability for formulation. The remaining systems listed in Table 2 were clear and colorless liquids with differing viscosity as reported.
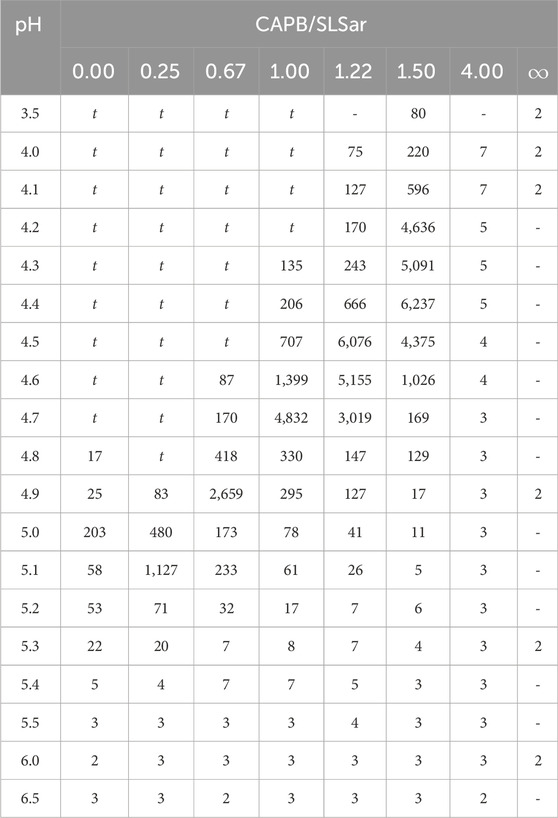
TABLE 2. Viscosities (mPa s) of CAPB/SLSar mass ratio mixtures at multiple pH levels. Data points labelled “t” were identified as turbid.
We observe a steadily increasing viscosity peak as the mass ratio of CAPB/SLSar is increased up to 1.5. Further increasing to the ratio to 4.0 results in a dramatic drop in recorded viscosity. We observe the largest peaks in viscosity at close to the experimentally recorded value pKa for SLSar of 4.5 where the molar ratio of anionic to acid form of SLSar is approximately 1:1. Similar behavior was observed by Vu et al. (2020) who hypothesized that the hydrogen bonding between the acid and anionic forms of SLSar and the zwitterionic component (CAPB here) at the effective pKa is a contributing interactions leading to viscosity enhancement.
3 Computational methods and results
In this section we describe the computational approach adopted outlining the DPD models used to simulate the surfactants, our approach for constructing simulations at multiple pH values and describing the analysis performed. At the end of the section, we present the results of the computational study saving a comparison to the experimental results to Section 4. Further details on the DPD methodology, model parameters (including model validation) and simulation setup are given in the Supplementary Material.
3.1 DPD representations of the surfactant molecules
In our DPD model (which follows the approach of Anderson et al. (2017)) both surfactant molecules are defined by a set of linearly bonded beads comprised of multiple chemical groups. These beads contain 1–5 “heavy atoms” (i. e. carbon, oxygen, nitrogen, sodium). For this study we use eight surfactant bead types; three corresponding to alkyl groups [CH3CH2] [CH2CH2] and [CH2]; a secondary amide [CH2 − C (=O)NH − CH2]; a tertiary amide [CH2 − C (=O)N(CH3) − CH2]; a quaternary ammonium cation [
[CH3CH2]–[CH2CH2]4–[CH2 − C (=O)N(CH3) − CH2]–[COO−], with [Na+ ⋅ 2 H2O] as counterion. The deprotonated form of the zwitterionic CAPB follows similarly,
except that no counterion is needed because in this state the molecule is charge neutral. In the case that either surfactant is protonated the terminal carboxylate bead is replaced by a carboxylic acid bead, and in the case of CAPB a compensating number of [OH−⋅ H2O] counterions are added to maintain overall charge neutrality. The surfactant structures are illustrated in Figure 1.

FIGURE 1. Coarse grained models of SLSar and CAPB in the deprotonated and protonated states.
We calculate the CMC of the surfactants (following Anderson et al., 2018) to validate our model. For SLSar we obtain a calculated CMC of
3.2 Acid-base surfactant populations at different values of pH
For a given pH both CAPB and SLSar surfactants can co-exist in their given acid and conjugate base form, i. e., in carboxylic acid (protonated)/carboxylate (deprotonated) form, respectively. If the pH is decreased, the fraction of protonated surfactants increases as determined by the dissociation constant pKa of the carboxylic acid group. Changing the ratio of protonated to deprotonated surfactant can have dramatic changes on the self-assembled structures and therefore the properties of formulations (Vu et al., 2021a; Vu et al., 2021b; Xu et al., 2019). We represent pH in our simulations by adjusting the ratio of protonated to deprotonated surfactants following the classic Henderson-Hasselbalch model in Eq. 1 (Henderson, 1908). From the reported pKa of the surfactants, i. e. pKa = 4.5 for SLSar (Wallach et al., 1992) and pKa = 1.83 for CAPB (Wood, 1987), the ratio of protonated and deprotonated surfactants at each pH is calculated from
Here [AH] and [A−] are the concentrations of the protonated and deprotonated surfactant, respectively. We assume that both surfactants are monoprotic acids (i. e. carboxyl group) and ignore the highly basic ammonium ion of CAPB which has a pKa ≳ 9, since we do not work in such high pH conditions.
In reality the degree of protonation depends upon the surroundings of the surfactant, i. e. the effect of self-aggregation on the acid-base equilibrium of one of these surfactants is a known effect resulting in a p
Figure 2 shows the shift in populations of acid and conjugate base as the pH changes. We can see over the pH range studied (i. e. between 3.5 and 6.5 in our study) that CAPB is in near-complete acid form and changes in populations of the SLSar forms is the main driving force behind any pH effect observed (when using fixed CAPB/SLSar surfactant mass ratio).
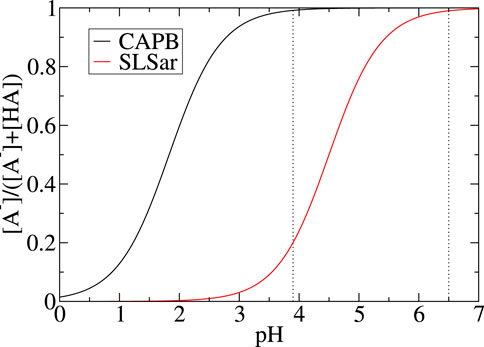
FIGURE 2. Fraction of deprotonated state for SLSar and CAPB as a function of pH, computed from the Henderson-Hasselbalch model in Eq. 1. The range investigated in this work (computationally) is between the two dotted vertical lines.
When building our models, we do not consider water dissociation. The concentrations of OH− and H3O+ ions from such are negligible compared to the counterion concentrations unless the solution becomes very acidic with a pH below 3. The presence of counterions in solvent (corresponding to [Na+ ⋅2H2O] or [OH−⋅H2O]) is used to maintain charge neutrality.
3.3 Simulation and analysis details
We sample the same eight CAPB to SLSar mass ratios as covered experimentally but chose to explore a reduced number of pH levels covering the same range–this was done to provide good sampling whilst reducing computation cost. Simulations were performed at seven pH values equivalent to 3.9, 4.3, 4.7, 5.1, 5.5, 6.0 and 6.5. As described above, the pH was used to fix the ratio of protonated to deprotonated surfactant, as a “quenched” variable. For each mass ratio and pH, we ran simulations in box sizes of 403 (22.6 nm3) to ensure enough material of each form of surfactant was present in the box and that large (relatively) aggregates have the space to form. We discuss the consequence of altering the box size in Section 4. For each system, we ran an initial simulation to determine a resultant Nagg value. Here, we adopt a cut-off of Nmic = 6, i. e., aggregates with more than 6 surfactant molecules present are considered as micelles. Anything below this point is considered a submicellar aggregate. We base this on previously reported works (Anderson et al., 2018). Where the final time-step Nagg from the simulation was greater than seventy-five, a total of ten repeats simulation of the CAPB/SLSar mass ratio/pH combination were conducted, each with a different random seed. This was done to obtain average, reliable, details of the self-assembly process Where Nagg < 75 was observed, we did not perform further repeats as random sampling of systems fulfilling this criterion showed little variation (less than ±5). This is discussed in more detail in Section 4.
For the simulation time adopted, we choose to go against convention where the aim is usually to determine equilibrium structures, and here explore self-assembly and micelle behavior over shorter time-scales. As such we sample self-assembly over one million time-steps We do this for two reasons.
• The first is computational efficiency. We have demonstrated in our previous work (Anderson et al., 2023) that equilibration of micelle structures can take a very large simulation time (at least 10–40 million time-steps in the case presented in the cited literature). Whilst it is technically feasible to simulate such long time-scales given enough resources, to be of practical use it is of our view that the computational screening protocols ought to be more cost efficient and less time consuming than the alternative of running the laboratory trials.
• Secondly, it is our view that true equilibration of large WLMs is not practically feasible in the relatively small simulation boxes used in this type of computational study. WLMs have typical aggregation numbers in the range of many thousands to millions (Danov et al., 2021; Danov et al., 2018). In our choice of system size, the total number of surfactants present at 15 wt% is
Assessing the utility of short time-scale simulations (exploring early stage self-assembly) is core to our research question in performing this work. For selected systems we explore longer, four million time-step, simulations in order to explore the consequences of extended run times.
DPD simulations were performed using the dl_meso simulation package (Seaton et al., 2013) and we adopt a DPD time-step of 0.01 DPD time-units. Hereafter we shall, for the most part, express elapsed times in DPD time-units. One DPD time-unit corresponds to
A constant pressure ensemble (NPT), following the Langevin piston implementation by Jakobsen (2005) was used, and we set the system pressure to p = 23.7 (DPD units) to match the pressure of pure water in the model defined by Groot and Warren, (1997). The electrostatics of the charged DPD beads were defined by the model of González-Melchor et al. (2006) which assumes a uniform dielectric constant (chosen to be equivalent to pure water by setting the electrostatic coupling parameter Γ = 15.4) in the simulation box. The electrostatics were solved using a smoothed-particle mesh Ewald (SPME) algorithm (Essmann et al., 1995). All simulations were started from randomly dispersed initial configurations.
Simulation trajectory files were analyzed using the ummap package (Bray et al., 2019), which was modified for this work to enable determination of branching in micelle structures following the method presented in Conchuir et al. (2020) (see below). The trajectory data comprise simulation snapshots taken every 2000 DPD time-steps (i. e. 20 DPD time-units ≈1 ns). The Nagg (number average) values are extracted as previously described in Anderson et al. (2018) after partitioning the surfactants into sub-micellar and micellar aggregates. Nagg was plotted as a function of time to understand self-assembly behavior. Shape metrics determined to understand the average morphology of micelles were calculated as reported in the original ummap paper using cut-off values ϵ = 0.333, ϵrod = 0.5, ϵdisc = 1.0, Nrod = Ndisc = 100. These values were determined by trial and error to ensure that observed structures (i. e. from visualizing simulation outputs) corresponded to the shapes described through automatic identification using the ummap package. In this work we combine spherical, oblate and prolate spheroids resulting from the shape analysis into one “spheroid” class as the distinction between these structures does not not provide detail relating to viscosity (all structures in the spheroid class would result in low viscosity). Micelles with gyration tensors that reported as rod or ellipsoid by ummap are classed as “rod-like”. This was decided upon after visualising the resulting ellipsoids resulting from the gyration tensor which were found in reality to be exclusively “bent” rods. All other classifications remain the same as the original citation except lamellar which refers to a structure with two principle extents (defined using the gyration tensor) longer than the bounding box size. In this work, these structures are generally branched micelles (determined via visual inspection) and we refer to these as 2D extended. Those with three extents larger than the box dimensions are referred to as 3D extended. It should be noted that for aggregates that self-interact across the boundaries only the unreplicated structure (suitably unwrapped) is used for shape analysis (and aggregation size) which limits their total extents. Hence care must be taken in interpreting the 1D to 3D extended structures where replicas can be staggered and stacked within the box. For these a clearer interpretation is given using the below “skeleton” method which also indicates connections between the replicated structures.
The degree of branching in micelles was determined by identifying the “skeleton” (central path) of each micelle, using a modified version of the Conchuir et al. (2020) method, and locating the points at which a junction occurred in the resulting micelle skeleton graph. From this method we can identify both micelle branches and end caps. Examples of the resulting skeleton for branched micelles are presented in Figure 3 where the skeleton is shown running a central path through the micelle. Each “red” ball is a segmented fragment of the micelle with the “blue” ball providing additional links obtained by studying the connections between segments. The line then provides the skeleton connections. The branch points are located at red points where three or more lines connect and the end caps where only one line connects. A finite branched WLM (2 branch points, 4 end-caps, no closed paths) is seen in mass ratio 0.67 at pH3.9 from a 403 simulation box (Figure 3A). Branched micelles that wrap around the box and self-link to form an infinite length (e. g. 2D and 3D extended structures) have more branch points than micelle end-caps as did cases where closed paths formed and each junction is treated as a separate branch point. Examples are Figure 3B where we see a heavily interconnected structure (7 branch points, 3 end-caps, several closed paths) from a single simulation snapshot from the mass ratio 0.0 at pH3.9 in a 403 simulation cell. In Figure 3C we show a heavily interconnected (13 branch points, 7 end-caps, many closed paths) structure resulting from a simulation snapshot from the system with mass ratio 0.0 at pH3.9 in a larger, 503, simulation cell.
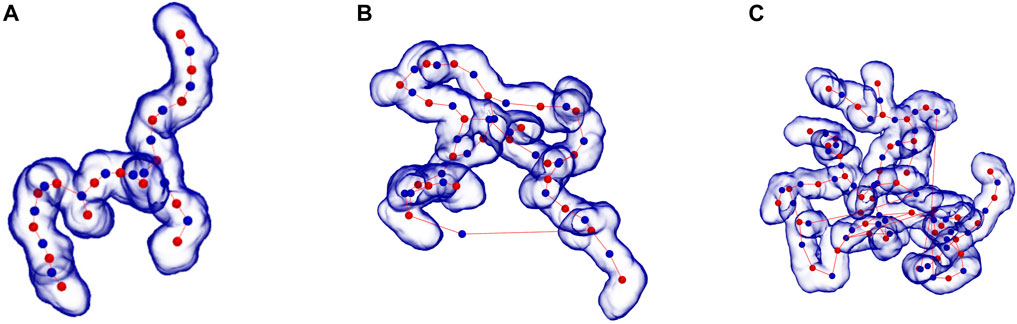
FIGURE 3. Representative branched structures of surfactants aggregates of CAPB/SLSar with (A) branched WLM (2 branch points, 4 end-caps, no closed paths) seen in mass ratio 0.67 at pH3.9 (403 simulation box), (B) heavily interconnected (7 branch points, 3 end-caps, several closed paths) seen in mass ratio 0.0 at pH3.9 (403 simulation box), and (C) heavily interconnected (13 branch points, 7 end-caps, many closed paths) seen in mass ratio 0.0 at pH3.9 (503 simulation box), demonstrating skeleton identification for determining branching (ball and line). Skeleton lines falling outside the micelle representation represent real links between parts of the micelle that wrap through the periodic boundaries.
In the text we report the average number of branch points per micelle ⟨Nbranch⟩ as indicative of the overall system. However, in practice some resulting micelles were highly branched whilst several remaining shorter and rod-like micelles which lower the reported average value.
3.4 Computational results
In Figure 4 we show the aggregation behavior as a function of time for the CAPB/SLSar mass ratio 0.67 mixture at four different pH values (Figures showing Nagg evolution for all sampled ratios and pH levels are supplied in the Supplementary Material). Figures 4A–D shows the behavior at pH 3.9, 4.3, 4.7 and 5.1, respectively. The plots show the average aggregation number (⟨Nagg⟩ hereafter) (black line), resulting from the ten repeat simulations, in addition to the best fit (red dashed line) obtained by fitting to ⟨Nagg⟩. In each case, the fit was determined with a simple nonlinear least squares procedure (via Xmgrace). Calculated fits show very high correlation with the determined value of ⟨Nagg⟩. By using replicate simulations we have been able to determine three distinct growth profiles for self-assembling micelle aggregates. These are logarithmic, linear and cubic (referred to as “cubic” hereafter) micellar growth. These behaviors are discussed more throughout the article. Results from the ten individual simulations are shown as colored dotted lines.
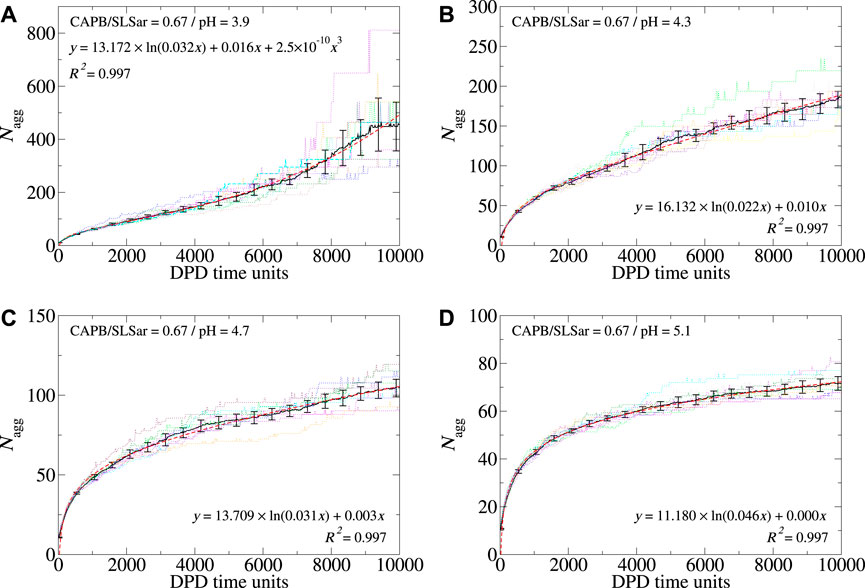
FIGURE 4. Aggregation behavior of CAPB/SLSar as a function of time for mass ratio 0.67 across four different pH levels. These are (A) mass ratio 0.67 at pH3.9, (B) mass ratio 0.67 at pH4.3, (C) mass ratio 0.67 at pH4.7, and (D) mass ratio 0.67 at pH5.1. The black line shows the averaged behavior (over 10 different repeats) and the red, dashed, line the best fit line according to the functional forms discussed in the main text. The remaining colored, dotted, lines show the aggregation behavior observed in individual simulations. For each pH level, we include the best fit and associated R2 value on the plot.
For the above system ⟨Nagg⟩ determined at the final time frame decreases with increasing pH from in excess of 400 at pH 3.9 to less than 80 at pH5.1. This trend is observed for each CAPB/SLSar mass ratio although the effect is more pronounced for the SLSar rich mixtures as this surfactant has a significantly stronger response to pH (as shown in Figure 2). Each of the presented four systems undergoes an early stage logarithmic growth region which persists to a Nagg of
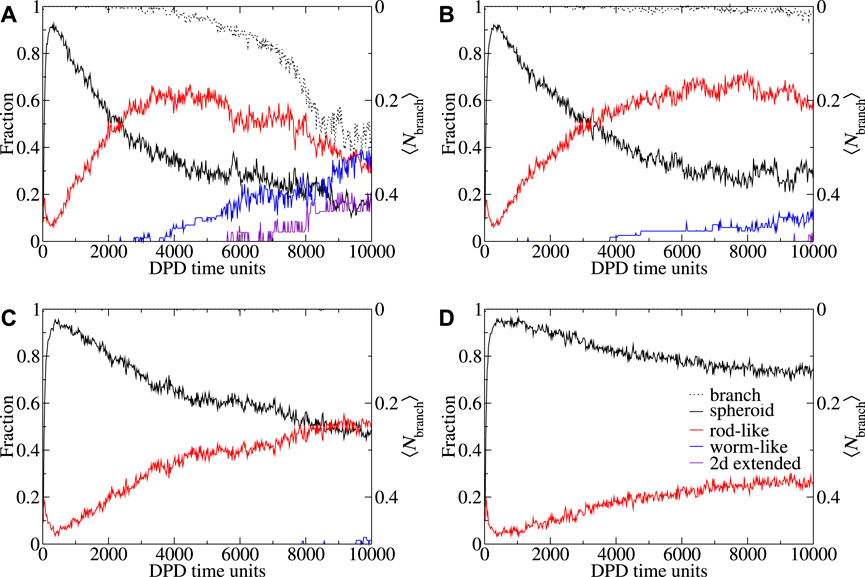
FIGURE 5. Shape and branch metrics behavior CAPB/SLSar as a function of time for mass ratio 0.67 across four different pH levels. These are (A) mass ratio 0.67 at pH3.9, (B) mass ratio 0.67 at pH4.3, (C) mass ratio 0.67 at pH4.7, and (D) mass ratio 0.67 at pH5.1. Plots show the fraction (of molecules in micelles of different shapes) of each observed shape type as a function of time. Morphologies: spheroid (black), rod-like (red), worm-like (blue), 2D extended (indigo), 3D extended (orange). Shape metric definitions are provided in the main text. Average degree of branching over time is plotted in black dots.
Inspection of the colored (dotted) lines in Figure 4, corresponding to individual simulations, shows the extent of variation in individual simulations. In the early, logarithmic growth regions, most simulations report aggregation behavior that is similar across repeats (Figure 4D). As systems present with strong linear or cubic growth, larger differences can occur. For example, the system corresponding to pH 3.9 (Figure 4A) has a discrepancy of
In Figure 5 we present shape and branching metrics corresponding to the micelles formed in the CAPB/SLSar mass ratio 0.67 simulations (the same systems as Figure 4 for consistency). Additional figures showing shape metric evolution over time for all sampled ratios at pH levels from 3.9–4.7 are supplied in the Supplementary Material. Note that the presented images show the average shape and branching behaviors across the ten replicate simulations. For a CAPB/SLSar mass ratio 0.67 at pH3.9 we see an early majority of spheroid micelles decrease rapidly with time as both rod-like and then, slightly later, extended structures such as WLMs and 2D branched morphologies appear. This appearance of extended structures corresponds to the formation of branching in the simulations. The initial increase in rod-like micelles is reversed as the fraction hits
Whilst we choose to explore the early time self-assembly and aggregation behavior of surfactants in this study, it is natural to ask the question what happens if the simulations are extended beyond this time window. To answer this we have sampled several systems over a longer time period of 40,000 DPD time-units. Examples of the longer time aggregation behavior are presented in Figure 6. In these images ⟨Nagg⟩ is displayed for the full 40,000 DPD time-units along with best fit lines calculated over the initial 10,000 DPD time-units (red dashed lines). The systems studied in Figures 6B, C (corresponding to mass ratio 0.25 at pH4.3 and mass ratio 0.67 at pH5.1, respectively) remain broadly consistent with the behavior observed over the first 10,000 DPD time-units (i. e. dominated by logarithmic growth for mass ratio 0.67 at pH5.1 and linear growth for mass ratio 0.25 at pH4.3). As the simulation for the mass ratio 0.25 at pH3.9 system (Figure 6A) is extended beyond 10,000 DPD time-units (where ⟨Nbranch⟩ = 0.5), initially the observed cubic relationship in ⟨Nagg⟩ continues up until approximately 20,000 DPD time-units. At this point we observe a sharp deviation from cubic behavior as ⟨Nagg⟩ begins to plateau. This plateau corresponds to ⟨Nagg⟩ ≈ 3,000 which is almost the entire surfactant content of the simulation box. The plateau is therefore a result of the finite material contained within the simulation box becoming depleted. At the final time-unit for this system ⟨Nbranch⟩ ≈ 8 and the resulting morphology is heavily interconnected and continuous. As we extend the mass ratio 1.22 at pH3.9 system beyond the initial 10,000 DPD time-units we observe a change from the initial linear behavior (with ⟨Nbranch⟩ = 0.1) to a much sharper cubic growth regime with ⟨Nbranch⟩ ≈ 2.5 at final time-unit. Figure 6D shows this change which can be compared to the projection of the original linear growth (red dashes).
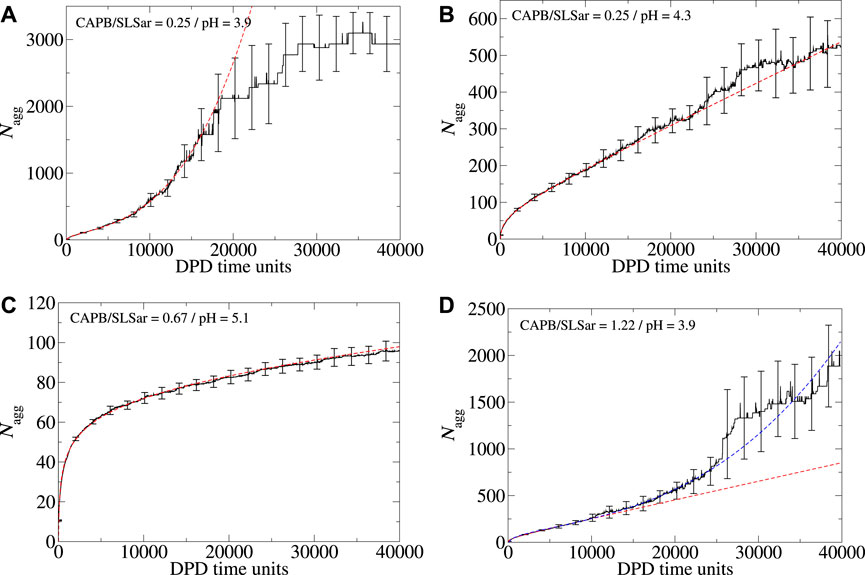
FIGURE 6. Aggregation behavior of CAPB/SLSar micelles as a function of time with different mass ratios exploring the effect of increasing the simulation time from 10,000 to 40,000 DPD time-units. Systems presented are (A) mass ratio 0.25 at pH3.9, (B) mass ratio 0.25 at pH4.3, (C) mass ratio 0.67 at pH5.1, and (D) mass ratio 1.22 at pH3.9. The black line shows the averaged behavior (over 10 different repeats). The red, dashed, line is the best fit line according to the functional forms discussed in the main text, determined over the initial 10,000 DPD time-units. For Figure 4D where we add a blue dashed line as an approximate to the behavior observed over the longer run time.
In addition to exploring the effect that longer simulation times can have on the behavior of the observed aggregates, it is natural to consider what would happen if the size of the simulation cell is modified beyond the default 403 explored in this work. In Figures 7A–D we demonstrate the impact box size can have on ⟨Nagg⟩ for mass ratio 0.0 at pH3.9, mass ratio 0.67 at pH3.9, mass ratio 1.22 at pH4.3, and mass ratio 1.33 at pH3.9. For the first two, we explore the box size effect over 10,000 DPD time-units. For the latter we explore the behavior 40,000 DPD time-units.
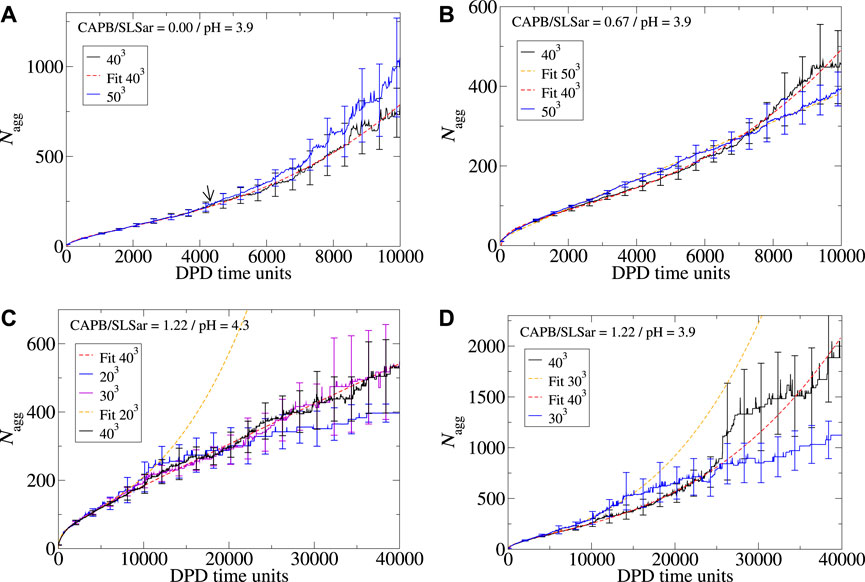
FIGURE 7. Aggregation behavior of CAPB/SLSar micelles as a function of time with different mass ratios exploring the effect of increasing the simulation box size. Systems presented are (A) mass ratio 0.0 at pH3.9, (B) mass ratio 0.67 at pH3.9, (C) mass ratio 1.22 at pH4.3, and (D) mass ratio 1.22 at pH3.9. Colors are indicated in the legend for each plot. Nonlinear least squares fits are presented as dashed lines as a guide to the eye.
For the mass ratio 0.0 at pH3.9 system (Figure 7A), simulation in both a 403 and 503 boxes result in cubic growth regimes at the end of the simulation. Here, the transition from a linear to cubic regime appears to occur at approximately the same region (marked by an arrow on the image). Whilst there is some difference between the reported ⟨Nagg⟩ over time, the results are broadly within error of each other. In Figures 8A, B we look at the shape and branching metrics for these two box sizes for the mass ratio 0.0 at pH3.9 system. For both, the general morphologies reported are similar but there is a key difference in the reported behavior. The behavior of spheroid micelles is broadly the same in both box sizes. Rods can be observed transitioning into WLMs after a slightly longer period of time in the larger box. This is intuitive as the definition of WLM is set by the box size. As the box gets larger, rods can grow longer before their classification is updated. What is perhaps less intuitive is the behavior of the 2D and 3D extended structures. Larger, 3D extended, structures seem to be preferred over the 2D alternatives as the simulation box gets larger. We speculate that the origins of this behavior stem from spatial requirements to form the 3D extended systems. The increased proportion of 3D extended structures reported from the shape metrics in Figure 8B is accompanied by a significant increase in the degree of branching in the system and the larger box presents almost double the average number of branch points per micelles when compared to the smaller box. Examples of morphologies resulting from the two box sizes for the mass ratio 0.0 at pH3.9 system are presented in Figures 3B, C. From the consideration of the mass ratio 0.0 at pH3.9 and mass ratio 0.67 at pH3.9 systems, we conclude that smaller boxes promote the 2D extended structures, whereas the larger boxes promote the 3D extended structures.
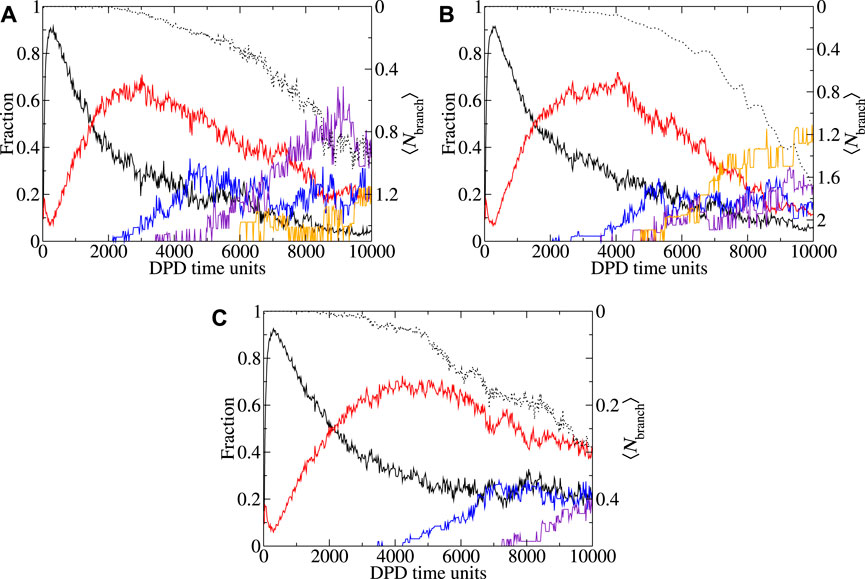
FIGURE 8. Shape metric and branching behavior as a function of time with CAPB/SLSar mass ratio 0.0 at pH3.9, (a-b) and mass ratio 0.67 at pH3.9(c). Plots show the fraction (of molecules in micelles of different shapes) of each observed shape type as a function of time for (A) 403 and (B, C) 503 simulation boxes. Note that the corresponding 403 plot of the mass ratio 0.67 at pH3.9 system is shown in Figure 5A. Morphologies: spheroid (black), rod-like (red), worm-like (blue), 2D extended (indigo), 3D extended (orange). Shape metric definitions are provided in the main text. Average degree of branching over time is plotted in black dots.
In the mass ratio 0.67 at pH3.9 system, we observe a micelle growth region following cubic growth behavior for the 403 system (Figure 7B). Upon enlarging the box to 503 the cubic behavior disappears, leaving a system that appears to grow linearly. Comparing Figures 8C, 5A, which explore the shape metrics for the mass ratio 0.67 at pH3.9 systems in 503 and 403 boxes, respectively, shows that the smaller of the two boxes presents with more WLMs and fewer rods, as can be expected based on previous discussion. For the larger box, the onset of 2D extended structures, as determined by the shape metrics, is later than that for the smaller box. Both systems present similar degrees of branching although there appears to be more branching earlier for the larger box. For both box sizes, the total fraction of 2D extended structures is comparable at the final time-unit. Deviation from the linear behavior of the 403 box occurs at the point at which the 2D extended structures appear in the analysis of the shape metrics (
Similar size effects to those already observed can be seen in the behavior from the mass ratio 1.22 at pH4.3 system (Figure 7C) in which we explore 203, 303 and 403 simulation cells. Reducing the box size from 403 (black line) to 303 (violet line) results in similar behavior with both box sizes following the same best fit line (linear). Further reduction to a box size of 203 results in different behavior, however. Here we see a micelle growth behavior that turns to a cubic just prior to 10,000 DPD time-units (blue line). After a short cubic region (demonstrated by the orange dashed line) we notice that the ⟨Nagg⟩ begins to plateau as was observed in Figure 6A. The resulting aggregate size for this box size corresponds to the total number of surfactants present in the simulation box. For the mass ratio 1.22 at pH3.9 system (Figure 7D) we appear to observe the same behavior on reducing the box size as surfactant is depleted in the smaller box.
The exploration of simulation times and box sizes presented here provides some degree of the behaviors that may be observed as changes are made to the simulation protocols. One could argue that longer simulations are required, or that larger boxes are necessary. The difficulty is where does this end? It is always possible (theoretically) to run longer/larger, and new behaviors may be observed. Practically, however, in designing a simulation campaign, one must balance simulation cost (resulting from box size and simulation length) with the desired accuracy and reliability in the derived result.
Finally, in Table 3 we present the ⟨Nagg⟩ value, the average number of micelles and the average number of micelle branch points, in addition to the overall maximum and minimum micelle sizes recorded over the ten repeats (where performed), for each of the sampled systems. We also present the functional form (logarithmic, linear or cubic) of a nonlinear least squares fit performed on the average micelle growth rate. We note that the different, dominant, growth behaviors are a continuum and therefore we assign the category based on somewhat arbitrary cut-off values. We are able to observe, in Figure 5, that cubic growth is a result of branching and the corresponding formation of extended structures. However, as we see from comparing Figure 5B with Figure 4B small amounts of branching can be tolerated in what is defined as linear growth.
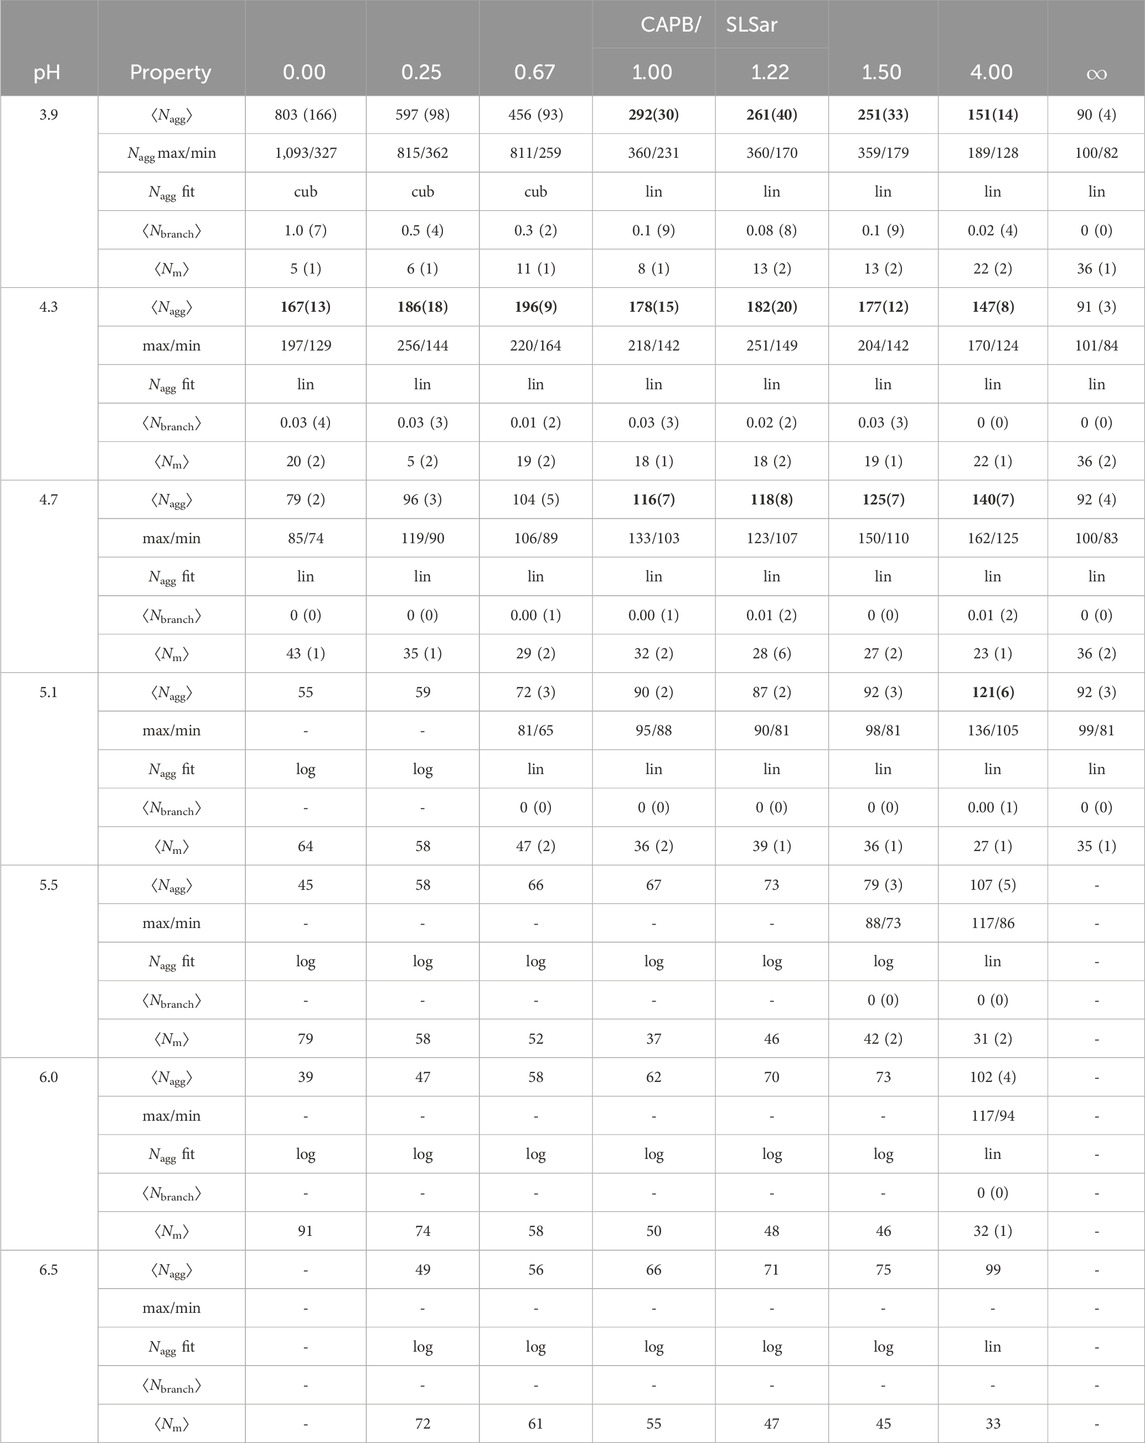
TABLE 3. Properties of the simulated systems including: final Nagg (nearest integer); max and min micelle sizes observed across repeats; final growth relationship type being logarithmic (log), linear (lin), or cubic (cub) (for linear coefficient less than 0.001, to 1 significant figure, in plots of Nagg as a function of DPD time-units, we assign log); micelle branching extent (average branches per micelle, Nbranch) for final time frame; number of micelles (Nm) in the final time frame. Standard errors are presented in brackets (for the final digit). Bold values are systems that we feel could be of interest experimentally based on two determinant cut-offs discussed in Section 3.4.
From inspection of Table 3, we observe that low CAPB/SLSar mass ratio and pH (top left of Table 3) results in the largest micelle growth. This appears intuitive as here there is less charge repulsion in the resultant micelles as most surfactants appear in a protonated state, potentially leading to decreased curvature and therefore larger structures. In this region, for pH 3.9, strong cubic growth is observed, brought about by micelle branching and the formation of extended structures. As the pH increases more the table becomes dominated by linear growth (corresponding to rod-like species and much less branch formation), until at even higher pH values the table presents extensive logarithmic growth of smaller spheroid type micelles. Broadly, resulting ⟨Nagg⟩ decreases with increased CAPB content (left to right in the table) and decreases as pH increases (top to bottom in the table). However, at the bottom of the table ⟨Nagg⟩ is lower for SLSar rich systems. The decrease in size with increasing pH is more pronounced for the high SLSar content systems, which is a consequence of the larger changes to the protonation state of SLSar in response to pH versus that of CAPB. At the extreme, pure CAPB shows little change in behavior with increasing pH as the protonation state of this surfactant remains largely unchanged.
Table 3 highlights the difference in the maximum and minimum sizes obtained in the simulations and shows the danger of not performing several repeats in a study like this where we are looking to correlate self-assembly of micelle aggregates to the potential for viscosity build, especially for systems with resultant ⟨Nagg⟩ above 100. In the extreme case, if one was to perform only a single simulation, it would be very hard to make sense of the results and trends in behavior would not emerge cleanly. For systems that tend to form the largest aggregates, we see significant discrepancies between the maximum and minimum reported values at the final time-step of simulation.
We label certain systems ⟨Nagg⟩ in bold in the table. These are systems that we feel could be of interest experimentally based on two determinant cut-offs. The first is the resultant ⟨Nagg⟩ itself which we set as requiring to be ≳ 1.5× the typical spherical micelle size (enabling us to be well into the rod forming region at minimum), which also corresponds to the approximate ⟨Nagg⟩ where half of a system morphology is in spheroid configuration and half in rod-like configuration (See, for example Figure 5C). In this study, this value is
4 Discussion
If rate of micelle growth and resultant aggregation properties are used as a proxy for viscosity, on the assumption that large WLMs (which lead to high viscosity) will have a high (or larger) aggregate size, then the simulated results correlate well with the experimental data. Systems that have faster growth and larger resultant aggregates are in broad agreement with regions of high experimental viscosity. The exception to this agreement is for the low pH systems that were turbid (or unstable) in the laboratory.
Ignoring the turbid region for the moment (we return to this shortly), an inspection of Tables 2, 3 reveals that for each CAPB/SLSar mass ratio the regions of higher ⟨Nagg⟩ broadly corresponds to the regions of high zero-shear viscosity with an error of around 0.3 pH units. The small discrepancy in the pH could be due to the approximations made when modelling the pH during the simulations, where the Henderson-Hasselbalch equation was used to determine the ratio of protonated to deprotonated surfactants corresponding to a particular pH. As discussed in Section 3.2 this does not reflect the complex effects of micelle environment on the pKa of an ionic surfactant. However, the error in the optimal pH is small and it would not be difficult for a formulator, having used the simulations to choose the pH at which to work, to adjust the pH to the true optimum. This would still represent a significant speedup over formulating without predictions.
The most significant conflict between experimental and simulated results in the non-turbid region is for the CAPB/SLSar mass ratio 4.0. Here, the simulation suggests that the system should have an elevated zero-shear viscosity based on the aggregates at other mass ratios. The laboratory data measured for this work reports low viscosity at all pH levels sampled. This may be because the samples of CAPB used in the experimental work in this study were impure (the models are 100% pure), as is almost always the case with commercial surfactants. Work performed by Lu et al. (2015) shows that the CAPB/SLSar mass ratio 4.0 (albeit for a different total surfactant loading of 12%) should, in fact, lead to a increased viscosity. Therefore it is possible that the simulation here is correct and the experimental data has been affected by the choice of materials and measurement approach (this in itself is useful information). Dwelling a little longer on the results from Lu et al. (2015), we notice that these differ slightly from those reported here. This may be due to subtle differences in the composition of the surfactants used, or in the rheological test methods employed. It is also possible that the differences are due to the fact that Lu et al. (2015) used a total surfactant concentration of 12% whereas we sample at 15%. Despite the differences the trends are the same: moderate richness of CAPB leads to higher viscosity at the correct pH whereas adding too little or too much does not, and the optimum mass ratios of CAPB to SLSar are similar.
Returning to the region identified as turbid by the laboratory measurements, herein lies the main source of discrepancy between simulation and experiment. At low pH and CAPB/SLSar values, the turbid laboratory samples initially had a very high viscosity, which reduced to low viscosity after a few hours. This is in agreement with results observed by Vu et al. (2020). Note that we observe a pH threshold for turbid mixtures that varies with the mass ratio of CAPB to SLSar (Table 2) which further supports the idea that the micellar environment affects pKa discussed in previous sections. In the regions defined as turbid by laboratory testing, our simulations report multiple different behaviors. At the lowest pH sampled by simulation (i. e. pH 3.9) for the CAPB/SLSar mass ratios of 0.0, 0.25 and 0.67 we observe large aggregates, displaying a relatively large degree of branching, with a dominant cubic defined micelle growth region towards the final configuration. Taken in isolation, the large aggregates may signify a propensity for higher viscosity but the degree of branching confirmed by direct calculation and the cubic growth region indicate other processes at play. Heavily branched and large structures are not likely to be associated with a massively enhanced zero-shear viscosity and in fact these structures are more likely indicative of a tendency towards macroscopic phase separation, corresponding to the turbid and eventually phase separated samples seen experimentally. As such, one may consider systems that branch heavily during short time-scale simulation as indicative of compositions to discard in a screening procedure using our methods. On the other hand, low levels of branching may provide a mechanism of stress relaxation in micelles that leads to a reduction in the structural relaxation time and consequently lowering the zero-shear viscosity (Rogers et al., 2014).
We believe we have evidence that the simulation approach as described above can act as a useful method to guide the formulator to regions in formulation space where appropriate zero-shear viscosity may be found. The errors in optimum pH are small and would easily be corrected in the laboratory, and compared to searching a very large formulation space with no predictive guidance, the formulator would still have arrived at an optimal blend in a much reduced time and cost. However, we caveat that more testing is required to ensure the method works for other surfactant systems. Here we have explored two highly synergistic surfactants and could expect the approach to work for other synergistic pairs. What the outcome would be for a single surfactant and salt is still unknown.
Here we summarise the steps to be undertaken for further explorations using the methods outlined above. This is not meant as a definitive list of tasks but more of a guide to be adapted as required. Note, whilst we focus on DPD in this article for computational efficiency, we see no reason this approach would not work for other dynamics based simulation methods (in principle) where appropriate surfactant models are used.
1. For the given surfactant system, determine the experimental space for exploration. This could follow the same type of study here, where we explore the effect of the ratio of co-surfactant and pH, or it could be a different study, e. g., where a single surfactant is screened for salt (or other additive) sensitivity.
2. Determine most appropriate DPD model, parameters and box size based on composition being explored. Simulation boxes need to be large enough to ensure representative quantities of all surfactants and additives can be accommodated in simulation and to enable sufficiently large structures to form.
3. Develop inputs and run single simulations for all appropriate combinations identified in step 1.
4. Evaluate aggregate sizes, shape and branch properties at the final time-step (simulation length set to one million steps in this study but this is not a hard and fast “rule” and the appropriate time-scale may depend upon your system of choice).
5. For systems dominated by non-spheroid aggregates, prepare and run multiple replicate simulations (we chose 10 replicates but more will potentially give improved statistics).
6. Perform analysis to determine micelle/aggregate properties as a function of simulation time to understand behavoir.
7. Define regions of interest for experimental exploration by looking for strongly growing systems that do not present highly branched structures following cubic growth in short time-scale simulations (i. e. those with significant amounts of 2D and 3D extended structures).
8. Test for zero-shear viscosity potential in the laboratory.
5 Conclusion
In this article we set out to explore if the early stage self-assembly behavior seen in coarse grained simulations of surfactant solutions could be used to guide laboratory efforts when developing new candidate formulations, which require specific levels of zero-shear viscosity. In essence, we believe we have successfully done that, and the discussed approach can be used to aid formulators to screen ratios of surfactants and pH levels that are likely to result in positive outcomes. It is important to note that the guidance is correlative: we do not set out to provide a complete prediction for viscosity, rather we aim to identify potential regions of interest in formulation and chemistry space.
To do this we focus on determining simple metrics (aggregation number, micelle shape, micelle branching, etc.) relating to the aggregation behavior of surfactant systems. Our rationale for this is that whilst rheological behavior of surfactant systems is complex, depending upon numerous factors include micellar structure and scission and recombination rates, it is known that in order to build good levels of zero-shear viscosity, large aggregates (preferably worm-like) are required as a prerequisite. Whilst we do not perform imaging studies in this article, cryo TEM has been use extensively to understand micelle structure and the impact on rheology (Danino, 2012; Anachkov et al., 2018).
Given that our objective is to use molecular simulation as a screening method and our emphasis on the importance of running replicate simulations, we need to be able to execute a substantial number of simulations at a reasonable cost. As such we choose to explore the potential of relatively short time-scale simulations to provide insight. While extensive and intricate simulations have the potential to enhance output precision, they typically entail a substantial per-simulation cost, impeding their economic and temporal viability. Simulations that are more expensive and take longer than experimental studies cannot in good faith be proposed as a viable screening option. Consequently, striking a balance between accuracy, speed and cost becomes imperative.
As mentioned, a key factor in our work is our approach to determining average behavior of micelles resulting from replicate simulations, rather than performing single long runs. In doing this we have been able to identify distinct ensemble behaviors associated with the self-assembly of micelles that otherwise would be masked by the natural fluctuations in individual simulations. Specifically, we are able to identify regions of logarithmic, linear and cubic growth. To the best of our knowledge, this has not been previously reported. The logarithmic region corresponds to the growth of spheroid micelles, the linear region to the formation of rod-like micelles and the cubic regions to extended, branched structures.
Our simulations show a good degree of correlation with experimental data. If the formulator were to assume that the aggregation behavior is positively correlated to zero-shear viscosity then these simulations would be sufficient to quickly and cheaply guide such a person to useful areas of formulation space which might not be found by a traditional “trial and error” search. While a simple assumption for aggregation number wrongly suggests that several blends at low pH have may high viscosity, the extent of branching in these systems and the observation of cubic growth may hint at these regions as being unfit for formulation. If we discount the regions of nonlinear aggregate growth (e. g. logarithmic and cubic), we could potentially eliminate
Data availability statement
The raw data supporting the conclusion of this article will be made available by the authors, without undue reservation.
Author contributions
EL: Data curation, Formal Analysis, Investigation, Methodology, Software, Writing–original draft, Writing–review and editing. JB: Conceptualization, Data curation, Investigation, Methodology, Supervision, Writing–original draft, Writing–review and editing, Funding acquisition. KH: Investigation, Supervision, Writing–original draft, Project administration, Resources. FE-B: Formal Analysis, Investigation, Methodology, Writing–original draft. PW: Writing–original draft, Writing–review and editing, Conceptualization, Supervision, Validation. DB: Formal Analysis, Investigation, Methodology, Writing–original draft, Conceptualization, Data curation, Software, Supervision, Visualization, Writing–review and editing. RA: Conceptualization, Data curation, Formal Analysis, Funding acquisition, Investigation, Methodology, Project administration, Resources, Software, Supervision, Validation, Visualization, Writing–original draft, Writing–review and editing.
Funding
The author(s) declare financial support was received for the research, authorship, and/or publication of this article. This work was funded by the STFC Bridging for Innovators award (B4i) 2019.
Acknowledgments
The authors acknowledge the use of the Hartree Centre Scafell Pike super computing facility.
Conflict of interest
JB, KH and FE-B were employed by Croda International Plc at the time of the study.
The remaining authors declare that the research was conducted in the absence of any commercial or financial relationships that could be construed as a potential conflict of interest.
Publisher’s note
All claims expressed in this article are solely those of the authors and do not necessarily represent those of their affiliated organizations, or those of the publisher, the editors and the reviewers. Any product that may be evaluated in this article, or claim that may be made by its manufacturer, is not guaranteed or endorsed by the publisher.
Supplementary material
The Supplementary Material for this article can be found online at: https://www.frontiersin.org/articles/10.3389/frsfm.2024.1341445/full#supplementary-material
References
Abel, P. (1974). Toxicity of synthetic detergents to fish and aquatic invertebrates. J. Fish. Biol. 6, 279–298. doi:10.1111/j.1095-8649.1974.tb04545.x
Anachkov, S. E., Georgieva, G. S., Abezgauz, L., Danino, D., and Kralchevsky, P. A. (2018). Viscosity peak due to shape transition from wormlike to disklike micelles: effect of dodecanoic acid. Langmuir 34, 4897–4907. doi:10.1021/acs.langmuir.8b00421
Ananthapadmanabhan, K., Moore, D., Subramanyan, K., Misra, M., and Meyer, F. (2004). Cleansing without compromise: the impact of cleansers on the skin barrier and the technology of mild cleansing. Dermatol. Ther. 17, 16–25. doi:10.1111/j.1396-0296.2004.04s1002.x
Ananthapadmanabhan, K., Yu, K., Meyers, C., and Aronson, M. (1996). Binding of surfactant to stratum corneum. J. Soc. Cosmet. Chem. 47, 185–200.
Ananthapadmanabhan, K. P. (2019). Amino-acid surfactants in personal cleansing (review). Tenside Surfact. Det. 56, 378–386. doi:10.3139/113.110641
Anderson, R. L., Bray, D. J., Del Regno, A., Seaton, M. A., Ferrante, A. S., and Warren, P. B. (2018). Micelle formation in alkyl sulfate surfactants using dissipative particle dynamics. J. Chem. Theory Comput. 14, 2633–2643. doi:10.1021/acs.jctc.8b00075
Anderson, R. L., Bray, D. J., Ferrante, A. S., Noro, M. G., Stott, I. P., and Warren, P. B. (2017). Dissipative particle dynamics: systematic parametrization using water-octanol partition coefficients. J. Chem. Phys. 147, 094503. doi:10.1063/1.4992111
Anderson, R. L., Gunn, D. S. D., Taddese, T., Lavagnini, E., Warren, P. B., and Bray, D. J. (2023). Phase behavior of alkyl ethoxylate surfactants in a dissipative particle dynamics model. J. Phys. Chem. B 127, 1674–1687. doi:10.1021/acs.jpcb.2c08834
Aveyard, B. (2019). “Aggregation of surfactants in aqueous systems,” in Surfactants: in solution, at interfaces and in colloidal dispersions (Oxford University Press), 177–230. doi:10.1093/oso/9780198828600.003.0009
Backer, J. A., Lowe, C. P., Hoefsloot, H. C. J., and Iedema, P. D. (2005). Poiseuille flow to measure the viscosity of particle model fluids. J. Chem. Phys. 122, 154503. doi:10.1063/1.1883163
Bordes, R., and Holmberg, K. (2015). Amino acid-based surfactants – do they deserve more attention? Adv. Colloid Interf. Sci. 222, 79–91. doi:10.1016/j.cis.2014.10.013
Boromand, A., Jamali, S., and Maia, J. M. (2015). Viscosity measurement techniques in dissipative particle dynamics. Comput. Phys. Commun. 196, 149–160. doi:10.1016/j.cpc.2015.05.027
Bray, D. J., Anderson, R. L., Warren, P. B., and Lewtas, K. (2020). Wax formation in linear and branched alkanes with dissipative particle dynamics. J. Chem. Theory Comput. 16, 7109–7122. doi:10.1021/acs.jctc.0c00605
Bray, D. J., Anderson, R. L., Warren, P. B., and Lewtas, K. (2022). Modeling alkyl aromatic hydrocarbons with dissipative particle dynamics. J. Phys. Chem. B 126, 5351–5361. doi:10.1021/acs.jpcb.2c02048
Bray, D. J., Del Regno, A., and Anderson, R. L. (2019). UMMAP: a statistical analysis software package for molecular modelling. Mol. Simul. 46, 308–322. doi:10.1080/08927022.2019.1699656
Bunker, A., and Róg, T. (2020). Mechanistic understanding from molecular dynamics simulation in pharmaceutical research 1: drug delivery. Front. Mol. Biosci. 7, 604770. doi:10.3389/fmolb.2020.604770
Burov, S. V., Obrezkov, N. P., Vanin, A. A., and Piotrovskaya, E. M. (2008). Molecular dynamic simulation of micellar solutions: a coarse-grain model. Colloid J. 70, 1–5. doi:10.1134/S1061933X08010018
Carvalho, A. P., Santos, S. M., Pérez-Sánchez, G., Gouveia, J. D., Gomes, J. R. B., and Jorge, M. (2022). Sticky-martini as a reactive coarse-grained model for molecular dynamics simulations of silica polymerization. npj Comput. Mater. 8, 49. doi:10.1038/s41524-022-00722-w
Conchuir, B. O., Gardner, K., Jordan, K. E., Bray, D. J., Anderson, R. L., Johnston, M. A., et al. (2020). Efficient algorithm for the topological characterization of worm-like and branched micelle structures from simulations. J. Chem. Theory Comput. 16, 4588–4598. doi:10.1021/acs.jctc.0c00311
Dai, C., Zhao, J., Yan, L., and Zhao, M. (2014). Adsorption behavior of cocamidopropyl betaine under conditions of high temperature and high salinity. J. Appl. Polym. Sci. 131, 40424. doi:10.1002/app.40424
Danino, D. (2012). Cryo-tem of soft molecular assemblies. J. Colloid Interface Sci. 17, 316–329. doi:10.1016/j.cocis.2012.10.003
Danov, K., Kralchevsky, P., Stanimirova, R., Stoyanov, S., Cook, J., and Stott, I. (2021). Analytical modeling of micelle growth. 4. molecular thermodynamics of wormlike micelles from ionic surfactants: theory vs. experiment. J. Colloid Interf. Sci. 15, 561–581. doi:10.1016/j.jcis.2020.10.004
Danov, K. D., Kralchevsky, P. A., Stoyanov, S. D., Cook, J. L., Stott, I. P., and Pelan, E. G. (2018). Growth of wormlike micelles in nonionic surfactant solutions: quantitative theory vs. experiment. Adv. Colloid Interf. Sci. 256, 1–22. doi:10.1016/j.cis.2018.05.006
Dave, N., and Joshi, T. (2017). A concise review on surfactants and its significance. Int. J. Appl. Chem. 13, 663–672. doi:10.37622/IJAC/13.3.2017.663-672
Del Regno, A., Warren, P. B., Bray, D. J., and Anderson, R. L. (2021). Critical micelle concentrations in surfactant mixtures and blends by simulation. J. Phys. Chem. B 125, 5983–5990. doi:10.1021/acs.jpcb.1c00893
Deo, K., and Somasunderan, P. (2003). Effects of sodium dodecyl sulfate on mixed liposome solubilization. Langmuir 19, 7271–7275. doi:10.1021/la020962e
Dhakal, S., and Sureshkumar, R. (2015). Topology, length scales, and energetics of surfactant micelles. J. Chem. Phys. 143, 024905. doi:10.1063/1.4926422
Drew Bennett, W. F., Chen, A. W., Donnini, S., Groenhof, G., and Tieleman, D. P. (2013). Constant ph simulations with the coarse-grained martini model application to oleic acid aggregates. Can. J. Chem. 91, 839–846. doi:10.1139/cjc-2013-0010
Droghetti, H., Pagonabarraga, I., Carbone, P., Asinari, P., and Marchisio, D. (2018). Dissipative particle dynamics simulations of tri-block co-polymer and water: phase diagram validation and microstructure identification. J. Chem. Phys. 149, 184903. doi:10.1063/1.5049641
Du, W., Huang, X., Zhang, J., Wang, W., Yang, Q., and Li, X. (2021). Enhancing methane production from anaerobic digestion of waste activated sludge with addition of sodium lauroyl sarcosinate. Bioresour. Technol. 336, 125321. doi:10.1016/j.biortech.2021.125321
Durchschlag, H., and Zipper, P. (1994). Calculation of the partial volume of organic compounds and polymers. Prog. Colloid. Polym. Sci. 94, 20–39. doi:10.1007/bfb0115599
El-Dossoki, F. I., Abdalla, N. S. Y., Gomaa, E. A., and Hamza, O. K. (2020). An insight into thermodynamic and association behaviours of cocamidopropyl betaine (capb) surfactant in water and water–alcohol mixed media. SN Appl. Sci. 2, 690. doi:10.1007/s42452-020-2504-y
Español, P., and Warren, P. B. (2017). Perspective: dissipative particle dynamics. J. Chem. Phys. 146, 150901. doi:10.1063/1.4979514
Essmann, U., Perera, L., Berkowitz, M. L., Darden, T., Lee, H., and Pedersen, L. G. (1995). A smooth particle mesh ewald method. J. Chem. Phys. 103, 8577–8593. doi:10.1063/1.470117
Fieber, W., Scheklaukov, A., Kunz, W., Pleines, M., Benczédi, D., and Zemb, T. (2021). Towards a general understanding of the effects of hydrophobic additives on the viscosity of surfactant solutions. J. Mol. Liq. 329, 115523. doi:10.1016/j.molliq.2021.115523
Fogang, L. T., Sultan, A. S., and Kamal, M. S. (2018). Understanding viscosity reduction of a long-tail sulfobetaine viscoelastic surfactant by organic compounds. RSC Adv. 8, 4455–4463. doi:10.1039/C7RA12538K
Fraaije, J. G. E. M., van Male, J., Becherer, P., and Serral Gracià, R. (2018). Calculation of diffusion coefficients through coarse-grained simulations using the automated-fragmentation-parametrization method and the recovery of Wilke-Chang statistical correlation. J. Chem. Theory Comput. 14, 479–485. doi:10.1021/acs.jctc.7b01093
Goldsipe, A., and Blankschtein, D. (2006). Molecular-thermodynamic theory of micellization of ph-sensitive surfactants. Langmuir 22, 3547–3559. doi:10.1021/la052896x
González-Melchor, M., Mayoral, E., Velázquez, M. E., and Alejandre, J. (2006). Electrostatic interactions in dissipative particle dynamics using the ewald sums. J. Chem. Phys. 125, 224107. doi:10.1063/1.2400223
Groot, P. B., and Warren, R. D. (1997). Dissipative particle dynamics: Bridging the gap between atomistic and mesoscopic simulation. J. Chem. Phys. 107, 4423–4435. doi:10.1063/1.474784
He, M., Zheng, W., Wang, N., Gao, H., Ouyang, D., and Huang, Z. (2022). Molecular dynamics simulation of drug solubilization behavior in surfactant and cosolvent injections. Pharmaceutics 14, 2366. doi:10.3390/pharmaceutics14112366
Henderson, L. J. (1908). Concerning the relationship between the strength of acids and their capacity to preserve neutrality. Am. J. Physiol. 21, 173–179. doi:10.1152/ajplegacy.1908.21.2.173
Hoogerbrugge, P. J., and Koelman, J. M. V. A. (1992). Simulating microscopic hydrodynamic phenomena with dissipative particle dynamics. Europhys. Lett. 19, 155–160. doi:10.1209/0295-5075/19/3/001
Illa-Tuset, S., Malaspina, D. C., and Faraudo, J. (2018). Coarse-grained molecular dynamics simulation of the interface behaviour and self-assembly of ctab cationic surfactants. Phys. Chem. Chem. Phys. 20, 26422–26430. doi:10.1039/C8CP04505D
Jakobsen, A. F. (2005). Constant-pressure and constant-surface tension simulations in dissipative particle dynamics. J. Chem. Phys. 122, 124901. doi:10.1063/1.1867374
Jalili, S., and Akhavan, M. (2009). A coarse-grained molecular dynamics simulation of a sodium dodecyl sulfate micelle in aqueous solution. Colloid. Surf. A 352, 99–102. doi:10.1016/j.colsurfa.2009.10.007
Johnston, M. A., Swope, W. C., Jordan, K. E., Warren, P. B., Noro, M. G., Bray, D. J., et al. (2016). Toward a standard protocol for micelle simulation. J. Phys. Chem. B 120, 6337–6351. doi:10.1021/acs.jpcb.6b03075
Kirova, E. M., and Norman, G. E. (2015). Viscosity calculations at molecular dynamics simulations. J. Phys. Conf. Ser. 653, 012106. doi:10.1088/1742-6596/653/1/012106
Kraft, J. F., Vestergaard, M., Schiøtt, B., and Thøgersen, L. (2012). Modeling the self-assembly and stability of dhpc micelles using atomic resolution and coarse grained md simulations. J. Chem. Theory Comput. 8, 1556–1569. doi:10.1021/ct200921u
Lanigan, R. (2001). Final report on the safety assessment of cocoyl sarcosine, lauroyl sarcosine, myristoyl sarcosine, oleoyl sarcosine, stearoyl sarcosine, sodium cocoyl sarcosinate, sodium lauroyl sarcosinate, sodium myristoyl sarcosinate, ammonium cocoyl sarcosinate, and ammonium lauroyl sarcosinate. Int. J. Toxicol. 20, 1–14.
LeBard, D. N., Levine, B. G., Mertmann, P., Barr, S. A., Jusufi, A., Sanders, S., et al. (2012). Self-assembly of coarse-grained ionic surfactants accelerated by graphics processing units. Soft Matter 8, 2385–2397. doi:10.1039/C1SM06787G
Lee, M.-T., Mao, R., Vishnyakov, A., and Neimark, A. V. (2016). Parametrization of chain molecules in dissipative particle dynamics. J. Phys. Chem. B 120, 4980–4991. doi:10.1021/acs.jpcb.6b00031
Lee, M.-T., Vishnyakov, A., and Neimark, A. V. (2013). Calculations of critical micelle concentration by dissipative particle dynamics simulations: the role of chain rigidity. J. Phys. Chem. B 117, 10304–10310. doi:10.1021/jp4042028
Liwarska-Bizukojc, E., Miksch, K., Malachowska-Jutsz, A., and Kalka, J. (2005). Acute toxicity and genotoxicity of five selected anionic and nonionic surfactants. Chemosphere 58, 1249–1253. doi:10.1016/j.chemosphere.2004.10.031
Lu, H., Yuan, M., Fang, B., Wang, J., and Guo, Y. (2015). Wormlike micelles in mixed amino acid-based anionic surfactant and zwitterionic surfactant systems. J. Surfactants Deterg. 18, 589–596. doi:10.1007/s11743-015-1683-9
Maeda, H., and Kakehashi, R. (2000). Effects of protonation on the thermodynamic properties of alkyl dimethylamine oxides. Adv. Colloid Interf. Sci. 88, 275–293. doi:10.1016/S0001-8686(00)00048-8
Mao, R., Lee, M.-T., Vishnyakov, A., and Neimark, A. V. (2015). Modeling aggregation of ionic surfactants using a smeared charge approximation in dissipative particle dynamics simulations. J. Phys. Chem. B 119, 11673–11683. doi:10.1021/acs.jpcb.5b05630
Marrink, S. J., Risselada, H. J., Yefimov, S., Tieleman, D. P., and de Vries, A. H. (2007). The martini force field: coarse grained model for biomolecular simulations. J. Phys. Chem. B 111, 7812–7824. doi:10.1021/jp071097f
Müller, P., Bonthuis, D. J., Miller, R., and Schneck, E. (2021). Ionic surfactants at air/water and oil/water interfaces: a comparison based on molecular dynamics simulations. J. Phys. Chem. B 125, 406–415. doi:10.1021/acs.jpcb.0c08615
Nachbar, L. S. (2011). Effects of formulation conditions on micellar interactions and solution rheology in multi-component micellar systems. Ph.D. thesis. Cambridge, Massachusetts: Massachusetts Institute of Technology.
Nguyen, T. X. D., Vu, T. V., Razavi, S., and Papavassiliou, D. V. (2022). Coarse grained modeling of multiphase flows with surfactants. Polymers 14, 543. doi:10.3390/polym14030543
Nivón-Ramírez, D., Reyes-García, L. I., Oviedo-Roa, R., Gómez-Balderas, R., Zuriaga-Monroy, C., and Martínez-Magadán, J.-M. (2022). Critical micelle concentration of sds through dpd simulations using cosmo-rs–based interaction parameters, the thermal effects. Colloid. Surf. A 645, 128867. doi:10.1016/j.colsurfa.2022.128867
Panoukidou, M., Wand, C. R., and Carbone, P. (2021). Comparison of equilibrium techniques for the viscosity calculation from dpd simulations. Soft Matter 17, 8343–8353. doi:10.1039/D1SM00891A
Panoukidou, M., Wand, C. R., Del Regno, A., Anderson, R. L., and Carbone, P. (2019). Constructing the phase diagram of sodium laurylethoxysulfate using dissipative particle dynamics. J. Colloid Interf. Sci. 557, 34–44. doi:10.1016/j.jcis.2019.08.091
Parchekani, J., Allahverdi, A., Taghdir, M., and Naderi-Manesh, H. (2022). Design and simulation of the liposomal model by using a coarse-grained molecular dynamics approach towards drug delivery goals. Sci. Rep. 12, 2371. doi:10.1038/s41598-022-06380-8
Patra, N., Ray, D., Aswal, V. K., and Ghosh, S. (2018). Exploring physicochemical interactions of different salts with sodium n-dodecanoyl sarcosinate in aqueous solution. ACS Omega 3, 9256–9266. doi:10.1021/acsomega.8b00718
Pérez-Sánchez, G., Costa, F. M., Silva, G. M., Piñeiro, M. M., and Coutinho, J. A. (2023). Coarse-grain molecular dynamics simulation framework to unravel the interactions of surfactants on silica surfaces for oil recovery. Colloid. Surf. A 670, 131583. doi:10.1016/j.colsurfa.2023.131583
Peroukidis, S. D., Mintis, D. G., Stott, I., and Mavrantzas, V. G. (2021). Molecular simulation of the morphology and viscosity of aqueous micellar solutions of sodium lauryl ether sulfate (slens). J. Phys. Mater. 4, 044001. doi:10.1088/2515-7639/ac0093
Peroukidis, S. D., Stott, I. P., and Mavrantzas, V. G. (2022). Coarse-grained model incorporating short- and long-range effective potentials for the fast simulation of micelle formation in solutions of ionic surfactants. J. Phys. Chem. B 126, 5555–5569. doi:10.1021/acs.jpcb.2c02751
Reznik, G., Vishwanath, P., Pynn, M., Sitnik, J., Todd, J., Wu, J., et al. (2010). Use of sustainable chemistry to produce an acyl amino acid surfactant. Appl. Microbiol. Biotechnol. 86, 1387–1397. doi:10.1007/s00253-009-2431-8
Robinson, V., Bergfield, W., Belsito, D., Hill, R., Klaassen, C., Marks, J., et al. (2010). Final report of the amended safety assessment of sodium laureth sulfate and related salts of sulfated ethoxylated alcohols. Int. J. Toxicol. 29, 151S–161S. doi:10.1177/1091581810373151
Rogers, S. A., Calabrese, M. A., and Wagner, N. J. (2014). Rheology of branched wormlike micelles. Curr. Opin. Colloid Interf. Sci. 19, 530–535. doi:10.1016/j.cocis.2014.10.006
Sanders, S. A., and Panagiotopoulos, A. Z. (2010). Micellization behavior of coarse grained surfactant models. J. Chem. Phys. 132, 114902. doi:10.1063/1.3358354
Sanders, S. A., Sammalkorpi, M., and Panagiotopoulos, A. Z. (2012). Atomistic simulations of micellization of sodium hexyl, heptyl, octyl, and nonyl sulfates. J. Phys. Chem. B 116, 2430–2437. doi:10.1021/jp209207p
Sangwai, A. V., and Sureshkumar, R. (2011). Coarse-grained molecular dynamics simulations of the sphere to rod transition in surfactant micelles. Langmuir 27, 6628–6638. doi:10.1021/la2006315
Seaton, M. A., Anderson, R. L., Metz, S., and Smith, W. (2013). Dl_meso: highly scalable mesoscale simulations. Mol. Simul. 39, 796–821. doi:10.1080/08927022.2013.772297
Silva, G., Morgado, P., Lourenco, P., and Filipe, E. (2019). Spontaneous self-assembly and structure of perfluoroalkylalkane surfactant hemimicelles by molecular dynamics simulations. Proc. Natl. Acad. Sci. (USA) 116, 14868–14873. doi:10.1073/pnas.1906782116
Song, Y., Lee, J. H., Jung, I., Seo, B., and Hwang, H. (2020). Molecular dynamics simulations of micelle properties and behaviors of sodium lauryl ether sulfate penetrating ceramide and phospholipid bilayers. J. Phys. Chem. B 124, 5919–5929. doi:10.1021/acs.jpcb.0c02856
Taddese, T., Anderson, R. L., Bray, D. J., and Warren, P. B. (2020). Recent advances in particle-based simulation of surfactants. Curr. Opin. Colloid Interf. Sci. 48, 137–148. doi:10.1016/j.cocis.2020.04.001
Tang, X., Koenig, P. H., and Larson, R. G. (2014). Molecular dynamics simulations of sodium dodecyl sulfate micelles in water - the effect of the force field. J. Phys. Chem. B 118, 3864–3880. doi:10.1021/jp410689m
Tang, X., Zou, W., Koenig, P. H., McConaughy, S. D., Weaver, M. R., Eike, D. M., et al. (2017). Multiscale modeling of the effects of salt and perfume raw materials on the rheological properties of commercial threadlike micellar solutions. J. Phys. Chem. B 121, 2468–2485. doi:10.1021/acs.jpcb.7b00257
Velinova, M., Sengupta, D., Tadjer, A. V., and Marrink, S.-J. (2011). Sphere-to-rod transitions of nonionic surfactant micelles in aqueous solution modeled by molecular dynamics simulations. Langmuir 27, 14071–14077. doi:10.1021/la203055t
Venturoli, M., and Smit, B. (1999). Simulating the self-assembly of model membranes. Phys. Chem. Comm. 2, 45–49. doi:10.1039/A906472I
Venturoli, M., Sperotto, M. M., Kranenburg, M., and Smit, B. (2006). Mesoscopic models of biological membranes. Phys. Rep. 437, 1–54. doi:10.1016/j.physrep.2006.07.006
Vishnyakov, A., Lee, M.-T., and Neimark, A. V. (2013). Prediction of the critical micelle concentration of nonionic surfactants by dissipative particle dynamics simulations. J. Phys. Chem. Lett. 4, 797–802. doi:10.1021/jz400066k
Vu, T., Koenig, P., Cochran, B. M., Ananthapadmanabhan, K., Weaver, M., Reeder, B., et al. (2020). Thickening mechanisms for an amino acid-derived surfactant composition. Colloid. Surf. A 589, 124424. doi:10.1016/j.colsurfa.2020.124424
Vu, T., Reynolds, G., Hutton, H. D., Kasting, G. B., and Koenig, P. (2021a). Rheology control using nonionic cosurfactants and ph titration in an amino acid-derived surfactant composition. Langmuir 37, 12327–12334. doi:10.1021/acs.langmuir.1c01802
Vu, T., Weaver, M. R., Kasting, G. B., and Koenig, P. (2021b). Effect of ph on the structure and dynamics of wormlike micelles in an amino acid-derived surfactant composition. Langmuir 37, 4112–4120. doi:10.1021/acs.langmuir.0c03582
Wallach, D. F. H., Mathur, R., Redziniack, G. J. M., and Tranchant, J. F. (1992). Some properties of n-acyl sarcosinate lipid vesicles. J. Soc. Cosmet. Chem. 43, 113–118.
Wand, C. R., Panoukidou, M., Del Regno, A., Anderson, R. L., and Carbone, P. (2020). The relationship between wormlike micelle scission free energy and micellar composition: the case of sodium lauryl ether sulfate and cocamidopropyl betaine. Langmuir 36, 12288–12298. doi:10.1021/acs.langmuir.0c02210
Wang, H., Tang, X., Eike, D. M., Larson, R. G., and Koenig, P. H. (2018). Scission free energies for wormlike surfactant micelles: development of a simulation protocol, application, and validation for personal care formulations. Langmuir 34, 1564–1573. doi:10.1021/acs.langmuir.7b03552
Wang, S., and Larson, R. G. (2015). Coarse-grained molecular dynamics simulation of self-assembly and surface adsorption of ionic surfactants using an implicit water model. Langmuir 31, 1262–1271. doi:10.1021/la503700c
Wood, E. J. (1987). in Data for biochemical research. Editors R. M. C. Dawson, D. C. Elliott, W. H. Elliott, and K. M Jones. third edition (oxford: oxford science publications, oup), 580. 1986. €35/$59. isbn 0-19-855358-7. Biochem. Ed. 15, 97–97. doi:10.1016/0307-4412(87)90110-5
Wu, R., Deng, M., Kong, B., and Yang, X. (2009). Coarse-grained molecular dynamics simulation of ammonium surfactant self-assemblies: micelles and vesicles. J. Phys. Chem. B 113, 15010–15016. doi:10.1021/jp906055d
Xu, J., Xie, H., Zhang, H., Xu, H., Fang, L., Zhao, W., et al. (2019). New insight into the transition mechanism of ph-tunable wormlike micelles based on experiments and dpd simulation. Colloid. Surf. A 563, 280–288. doi:10.1016/j.colsurfa.2018.12.010
Yu, C., Ma, L., Li, K., Li, S., Liu, Y., Liu, L., et al. (2017). Computer simulation studies on the ph-responsive self-assembly of amphiphilic carboxy-terminated polyester dendrimers in aqueous solution. Langmuir 33, 388–399. doi:10.1021/acs.langmuir.6b03480
Zhou, J., and Ranjith, P. (2021). Self-assembly and viscosity changes of binary surfactant solutions: a molecular dynamics study. J. Colloid Interf. Sci. 585, 250–257. doi:10.1016/j.jcis.2020.11.022
Zhou, Y.-B., Xu, N., Ma, N., Li, F.-C., Wei, J.-J., and Yu, B. (2011). On relationships among the aggregation number, rheological property, and turbulent drag-reducing effect of surfactant solutions. Adv. Mech. Eng. 3, 345328. doi:10.1155/2011/345328
Keywords: simulation, surfactant, self-assembly, dissipative particle dynamics, rheology
Citation: Lavagnini E, Booth J, Helm K, El-Benni F, Warren PB, Bray DJ and Anderson RL (2024) Simulating micelle self-assembly to assess potential for viscosity build in surfactant formulations. Front. Soft Matter 4:1341445. doi: 10.3389/frsfm.2024.1341445
Received: 20 November 2023; Accepted: 09 January 2024;
Published: 12 February 2024.
Edited by:
Mohammad Peydayesh, ETH Zürich, SwitzerlandReviewed by:
Animesh Pan, University of Rhode Island, United StatesMarcel Krzan, Polish Academy of Sciences, Poland
Copyright © 2024 Lavagnini, Booth, Helm, El-Benni, Warren, Bray and Anderson. This is an open-access article distributed under the terms of the Creative Commons Attribution License (CC BY). The use, distribution or reproduction in other forums is permitted, provided the original author(s) and the copyright owner(s) are credited and that the original publication in this journal is cited, in accordance with accepted academic practice. No use, distribution or reproduction is permitted which does not comply with these terms.
*Correspondence: Richard L. Anderson, cmljaGFyZC5hbmRlcnNvbkBzdGZjLmFjLnVr
†Present address: Jonathan Booth, The Hartree Centre, STFC Daresbury Laboratory, Warrington, United Kingdom