 Jennifer Gilbert
 Simon Christensen3
 Tommy Nylander
 Leif Bülow
- 1Department of Chemistry, Physical Chemistry, Lund University, Lund, Sweden
- 2NanoLund, Lund University, Lund, Sweden
- 3Department of Chemistry, Pure and Applied Biochemistry, Lund University, Lund, Sweden
- 4LINXS Institute of Advanced Neutron and X-Ray Science, Lund, Sweden
- 5School of Chemical Engineering and Translational Nanobioscience Research Center, Sungkyunkwan University, Suwon, Republic of Korea
Globins are usually associated with oxygen carriage in vertebrates. However, plants also contain similar heme-containing proteins, called phytoglobins (Pgbs). Unlike conventional hemoglobin, these proteins are often linked to nitric oxide metabolism, energy metabolism and redox maintenance under hypoxic and related abiotic and biotic stress conditions. Class I and II non-symbiotic Pgbs (nsPgbs) have different degrees of heme hexacoordination. This involves direct interaction of the distal histidine in the E-helix with the sixth coordination site of the central iron, resulting in increased stability, in contrast to the oxygen storage linked to pentacoordinated globins, such as myoglobin (Mb). Due to their robustness, nsPgbs have substantial potential for various biomedical applications, particularly for iron supplementation. In this study, a class I nsPgb from sugar beet (Beta vulgaris ssp. vulgaris) was encapsulated in a lipid sponge phase system for potential protein delivery purposes and compared to a similar system of Mb containing nanoparticles. Bulk phases and dispersions were made with two lipid compositions (30/45/25 diglycerol monooleate (DGMO)/Capmul GMO-50/sorbitan monooleate (P80) and 28/42/30 DGMO/GMO-50/P80, where the DGMO/GMO-50 ratio was kept constant at 40/60). In addition, buffer effects on protein loading and particle formation were investigated. High concentrations of BvPgb1.2 (60 mg/mL) showed higher aggregation tendencies than Mb but these appeared to be transient. This property could be coupled to the higher isoelectric point (pI) of the BvPgb1.2 (7.85, compared to 6.8 for Mb), which make it more sensitive to small pH changes. In addition, excess protein/leakage was observed with Mb from the nanoparticles when analysed with size exclusion chromatography. This work highlighted the encapsulation efficiency of these proteins, which might be directly linked to difference in iron coordination and therefore, reactivity and lipid peroxidation. The interactions between the bulk phases and dispersion of the hemeproteins are complex, more research is needed to proper elucidate these relations in more detail, in order to facilitate the encapsulation capacity for heme-containing proteins in similar lipid-based systems.
1 Introduction
Hemoglobins (Hbs) are normally associated with oxygen (O2) transport in vertebrates and these proteins are members of the globin superfamily (Tejero and Gladwin, 2014). The majority of globins are oligomeric, consisting of two or more subunits; each comprised the characteristic myoglobin-fold (Mb-fold) secondary structure (Vázquez-Limón et al., 2012; Ahmed et al., 2020). This fold consists of six to eight α-helices, labelled A-H, which forms a 3/3 sandwich structure, where a hydrophobic core contains the prosthetic heme group (Vázquez-Limón et al., 2012). Whereas Hbs in red blood cells transport O2 from the lungs to the rest of the tissues through the circulatory system, myoglobin (Mb) is present in muscle tissue, serving as a local O2 supplier in contracting muscles (Stryer et al., 2019).
Globins are usually classified into penta- and/or hexacoordinated globins, depending on the number of direct interactions with the central heme iron (Gupta et al., 2011). The proximal histidine residue is located at position F8 in the F-helix, fixating the heme moiety to the protein backbone. In contrast, the distal histidine is usually found at E7 in the E-helix (Vázquez-Limón et al., 2012; Ahmed et al., 2020). This residue can interact with both the bound ligand, stabilizing the binding, or bind to the iron itself. Globins have different degrees of distal histidine involvement, affecting ligand binding, affinity and dissociation, where pentacoordinated globins often function as O2 transporters due to the lower affinity (Perazzolli et al., 2004; Igamberdiev et al., 2006). In contrast, hexacoordinated globins allow for a tighter binding and higher ligand affinity (Smagghe et al., 2008). Thus, these proteins are less likely to function as O2 transporters. The different degrees of iron coordination offer new properties, including stability, interactions with the local environment and functionality.
Plants also contain various Hbs, referred to as “phytoglobins” (Pgbs) and they are classified depending on function and characteristics (Bülow et al., 1999; Becana et al., 2020). One such feature is the hexacoordination equilibrium constant (KH), which describes the involvement of the distal histidine in heme coordination. For instance, a lower KH corresponds to less occupation of the sixth coordination site by this residue and allows ligand binding. Class I non-symbiotic Pgbs (nsPgb) are usually distinguished from class II by exhibiting a much reduced value of this constant (class I: KH∼2, class II: KH∼100) (Smagghe et al., 2009). This results in extremely high O2 affinities for class 1 nsPgbs, which are especially due to slow ligand dissociation rates. Thus, these proteins are unlikely to function as efficient O2 transporters in plants (Riquelme and Hinrichsen, 2015). Instead, class 1 nsPgbs are believed to be involved in other cellular mechanisms, such as nitric oxide (NO) metabolism, energy maintenance, redox balance, hormonal regulation and similar functions, primarily under hypoxic conditions (Garrocho-Villegas et al., 2007; Dordas, 2009; Igamberdiev et al., 2011; Hill, 2012; Riquelme and Hinrichsen, 2015). These proteins are upregulated to help the plant survive in stressful environments and improve the resiliency under suboptimal growing conditions (Hoy and Hargrove, 2008; Riquelme and Hinrichsen, 2015). Thus, the practical use of class I non-symbiotic Pgbs in various biotechnical applications has become evident.
In particular, nsPgbs from sugar beet (Beta vulgaris ssp. vulgaris) possess valuble features. These proteins are mainly produced in germinating seeds of sugar beet, thereby aiding the early developmental process of the plant (Leiva-Eriksson et al., 2014). Moreover, recombinant expression and purification verified that their NO dioxygenase and nitrite reductase activities were linked to Pgbs (Leiva Eriksson et al., 2019). Furthermore, the crystal structure for one of these proteins (BvPgb1.2) was recently elucidated (Christensen et al., 2022; Christensen et al., 2023), providing additional information about the structural integrity of this class. Thus, the protein did not show any indications of heme loss, in contrast to the pentacoordinated Hbs, and demonstrated high thermal stability (Christensen et al., 2022).
All these features make them attractive candidates for different applications, such as iron supplements or as ingredients in meat analogues. Iron deficiency, ultimately leading to anemia, is one of the major micronutrient deficiencies in the world. Heme iron has significantly higher bioavailability (15%–35%) (Chouraqui, 2022) compared to inorganic iron salts (<5%) (van der Merwe et al., 2019) that are commonly used for treatment of anemic conditions today. By supplementing the diet with more easily-absorbed heme iron, the amount of iron medicated can be reduced and thereby circumventing the side effects of the iron salts, including nausea, bloating, constipation and cancer when used over prolonged time periods (Fisher and Naughton, 2004). In addition, plant-derived molecules, such as phytates and polyphenols, do not affect absorption of heme iron, as opposed to free iron (Piskin et al., 2022). Thus, heme iron from suitable plant proteins can be explored to mitigate some of the current health challenges.
To ensure maintained function, stability and increased absorption, proteins often need to be protected, which may be achieved by encapsulation in lipid-based nanoparticles. One common option is to use lipid liquid crystalline (LLC) phases, due to their biocompatibility, high surface area for encapsulation and tunability (Boyd et al., 2009; Mulet et al., 2013; Bisset et al., 2015). A variety of different structures can be formed in these LLC nanoparticles, depending on lipid composition, which are typically responsive to environmental factors, such as temperature and pH (Seddon and Templer, 1995; Hyde and Schröder, 2003; Boyd et al., 2009; Fong et al., 2009; Mulet et al., 2013; Bisset et al., 2015). Common structures used for encapsulation are vesicles (or liposomes) and cubosomes, which have found frequent use in drug delivery applications. In previous studies, it has been demonstrated that encapsulation of various biomolecules, including both low molecular weight drugs and proteins, in lipid matrices has several advantages. These include increased thermal stability, mechanical stability, controlled release for a sustained long term drug delivery, resistance to aggregation and decreased toxicity in vivo (Shah et al., 2001). To optimise these formulations, it is vital to understand the interactions between the system components. This includes possible effects of encapsulation on the molecule of interest and how the lipid structure and properties are affected by the presence of the molecule.
The lipid sponge phase has been shown to be a promising candidate for large biomolecule encapsulation, due to its large water channel size and less rigid nanostructure (Gilbert et al., 2019). In previous work by Valldeperas et al. (Valldeperas et al., 2016; Gilbert et al., 2019; Valldeperas et al., 2019), formation of a stable sponge phase and encapsulation of industrially relevant enzymes could be achieved with food grade components and without the use of organic solvents.
Here, we encapsulated BvPgb1.2 and Mb and examined effects of encapsulation on both the lipid and protein components. We have characterised the structure of the bulk and dispersed lipid phases, and their colloidal stability. The influence of the dispersing medium, including the potential effect of the different degrees of iron coordination, are also discussed.
2 Materials and methods
2.1 Materials for protein encapsulation
The lipid samples were prepared using Capmul GMO-50, diglycerol monooleate (DGMO) and polyoxyethylene (20) sorbitan monooleate (P80). Capmul GMO-50 (Lot # 190111-9, Abitec, United States) was composed of 53.8% monoglycerides, 15–35% diglycerides, and 2–10% triglycerides with the following fatty acid composition: 86.6% oleic (C18:1), 4.9% linoleic, 4.1% palmitic and 3.3% stearic. DGMO (DGMO-90V, Lot # 9147) was purchased from Nikkol Chemicals (Japan) and P80 (Lot # 1102YP0133) from Croda (Limhamn, Sweden) was kindly provided by Camurus (Lund, Sweden).
Equine skeletal muscle myoglobin (Mb) (Sigma Aldrich) and purified BvPgb1.2 (see 2.2) were dissolved in 50 mM Tris-HCl pH 8.5 or milli-Q purified water (MQ, 18 MΩ cm) to make a stock solution of 60 mg/mL.
2.2 Recombinant protein production and purification
Wild type (WT) BvPgb1.2 (GenBank: KF549981) was expressed in BL21-DE3 Escherichia coli using a pET-DEST42 vector as described previously (Leiva Eriksson et al., 2019). The production of BvPgb 1.2 was conducted following previously described methods (Leiva Eriksson et al., 2019), but here the Q-Sepharose HP step was omitted. The final BvPgb1.2 fractions had an absorbance ratio at 412 nm and 280 nm (A412/A280) in the range 2.5-3, corresponding to >95% purity. BvPgb1.2 preparation was lastly concentrated using 10 kDa Vivaspin® 20 mL ultrafiltration units (Vivascience) and stored at −80°C before use.
2.3 Sample preparation for encapsulation
Hemeprotein concentration was determined by recording the spectra between 500 and 600 nm using a Cary 60 UV-Vis system (Agilent Technologies) by adding 0.2 mL Pyridine (Fischer Scientific), 0.1 mL 1 M NaOH, H2O and sample up to 1 mL in a cuvette. By supplementing 0.1 mg of sodium dithionite to the protein, the reduced spectrum was obtained and Hb concentration was determined from the absorbance difference between peaks 556 to 540 nm and the millimolar extinction coefficient for heme (20.7).
The final concentrations used for BvPgb1.2 and equine skeletal Mb (Sigma) were 60 mg/mL. Both proteins were diluted/dissolved in 50 mM Tris-HCl pH 8.5 or MQ water for further characterization.
2.4 Protein encapsulation
2.4.1 Bulk phases
Preparation of the lipid bulk phase has been described previously (Gilbert et al., 2019) and is summarised below. Lipid mixtures with weight ratios (40/60)/X (DGMO/GMO-50)/P80 where X = 25, 27.5, 30 were prepared and equilibrated for at least 24 h on a roller table. The bulk phases were prepared with a weight ratio 40/60 lipid mixture/aqueous solution, where the aqueous solution was either MQ water, 50 mM Tris-HCl buffer pH 8.5 or various concentrations of Mb or BvPgb1.2 in 50 mM Tris-HCl buffer pH 8.5. The samples were centrifuged at 419 g for 2 minutes with the cap facing up then again with the cap down 3 times and were then left to equilibrate for 14 days at room temperature (approximately 25°C).
2.4.2 Dispersions
For the protein concentration range samples, the dispersions were prepared by weighing the corresponding bulk phase into water or 50 mM Tris-HCl buffer pH 8.5 to a concentration of 10 wt% of bulk phase (4 wt% of lipid), vigorously shaken 3 times by hand and left for 24 h on an orbital shaker table at 300 rpm (Gilbert et al., 2019). For the P80 range samples, the dispersions were prepared by hydrating the lipid mixture with either MQ or 50 mM Tris-HCl buffer pH 8.5 and sonicating using a Vibra-Cell VCX 130 tip sonicator (Sonics & Materials Inc., Newton, CT, United States) with the following settings: 1 s sonication with 1 s cooling period, 3 min at 30% amplitude and 1 min at 35% amplitude.
2.5 Small angle x-ray scattering
2.5.1 Measurements
In house SAXS measurements were performed on a SAXSLab Ganesha 300XL (SAXSLAB ApS, Skovlunde, Denmark) with a 2D 300K Pilatus detector (Dectris) and Genix 3D x-ray source (λx-ray = 1.54 Å) and temperature control from an external water bath. Bulk phase samples were measured in custom-built solid sample holders, in which the sample is sandwiched between 2 mica windows separated by a rubber O-ring and held in place by a metal case. Dispersions were measured in reusable quartz capillaries (SAXSLAB). All samples were analysed at 25°C and data was collected over a q range of 0.012–0.76 Å−1. The measurement times for the bulk phases and dispersions were 1 h and 2–4 h respectively. The 2D scattering pattern was radially averaged using SAXSGui software to obtain I(q), which was then background subtracted and further analysed using MATLAB R2020b (MathWorks, United States).
SAXS measurements were also performed at the CoSAXS beamline at MAX IV (Lund University, Sweden). The scattered intensity was recorded at room temperature (25°C ± 1°C) using a wavelength of 1 Å, a beam size of 50 × 60 μm and an Eiger2 4M SAXS detector at a sample-to-detector distance of 3.044 m. Silver behenate was used as a reference to calibrate sample-to-detector distance and detector position. Samples were loaded through an autoloader into a 1.5 mm quartz capillary. The data was integrated and reduced using the CoSAXS autoreduction pipeline and further analysed using MATLAB R2020b (MathWorks, United States).
2.5.2 Estimating water channel radius
The peaks in the SAXS curves for the bulk phase samples were indexed and the structure determined from the characteristic peak spacing, as noted in Table 1. The water channel diameters of the structures formed were estimated using the q value of the lowest q peak, qfirstpeak which can be used to calculate lattice parameter, a, of the structure.
where
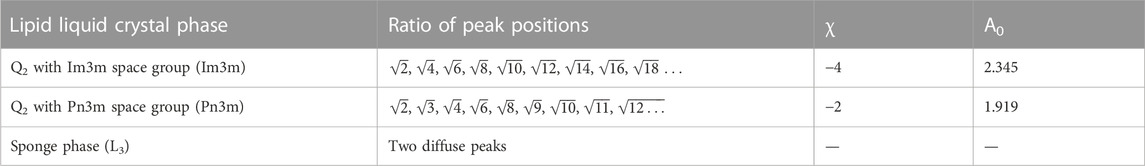
TABLE 1. Characteristic structural values for the different lipid liquid crystal phases including ratios between Bragg peaks and values of A0 and χ for the Im3m and Pn3m cubic space groups (Anderson et al., 1989).
For the inverse bicontinuous cubic (Q2) phases, the water channel diameter can be calculated from their infinite periodic minimal surfaces (IPMS) as follows:
Where rw-cubic is the radius of the water channel, acubic is the experimentally determined lattice parameter of the cubic phase and l is the monolayer thickness, previously determined to be 23 Å for this lipid system (Valldeperas et al., 2016). Both A0, the ratio of the IPMS area to (unit cell volume)2/3, and χ, the Euler characteristic per unit cell, are defined by the cubic space group (see Table 1).
The water channel of the sponge phase can be estimated by extrapolating from the characteristics of the cubic phase formed at the same lipid ratio along the dilution line but at higher lipid content, as follows (Valldeperas et al., 2016):
2.6 Dynamic light scattering
Dynamic light scattering (DLS) measurements were performed on a Zetasizer Nano ZS (Malvern Instruments Ltd., United Kingdom) using ZEN0040 disposable micro cuvettes filled with 1 mL of sample. Before measuring, dispersions were diluted to 0.1 wt% and proteins were diluted to 6 mg/mL with their dispersing solvent, which had been filtered with a 0.2 μm syringe filters (PALL® Acrodisc® 13 mm 0.2 μm PVDF). The temperature was set to 25°C and all samples were allowed to equilibrate for 120 s before measurement. The apparent hydrodynamic diameter was calculated using the Einstein-Stokes equation, with the viscosity of water, η, as 0.8872 cP and assuming spherical particles. For each sample, 5 measurements were collected and the standard deviation calculated.
2.7 Size exclusion chromatography
To examine possible effects on and leakage from the nanoparticles, BvPgb1.2 and Mb-containing nanoparticles with varying protein loading concentrations (0–60 mg/mL) were used. Analytical size exclusion chromatography (SEC) was carried out with a Superdex 7,510/300 GL column (CV = 24 mL) on an ÄKTA™ Avant system (Cytiva Life Science, Uppsala, Sweden) calibrated with conalbumin (75 kDa), carbonic anhydrase (29 kDa), ribonuclease A (13.7 kDa), and aprotinin (6.512 kDa) as molecular weight (Mw) standards (Cytiva Life Science) and 50 mM NaP+150 mM NaCl pH 7.2 was used as running buffer (Christensen et al., 2022). All standard protein solutions were run in volumes of 100 µL with a protein concentration of 1 mg/mL. The same sample volume was applied for all nanoparticles. Different filter pore sizes (0.45, 1.2 and 5 µm) (Sarstedt) were tested for nanoparticles. The largest pore size (5 µm) was used in the final preparations of the particles before column loading. The Mw of the BvPbg and Mb solutions were estimated by fitting the measured retention volume (Vr) to a semi-log plotted calibration curve (Christensen et al., 2022).
3 Results
3.1 Characterization of bulk phases using SAXS
Bulk phase samples with two different P80 fractions (30/45/25 DGMO/GMO-50/P80 and 28/42/30 DGMO/GMO-50/P80), but a constant DGMO/GMO-50 ratio of 40/60, were prepared with a range of BvPgb1.2 and Mb concentrations in 50 mM Tris-HCl buffer pH 8.5. Clear physical differences between the samples were observed, as the 25% P80 samples for both proteins had a rigid gel-like consistency, whereas all of the 30% P80 samples were fluid. The colour intensity increased with protein concentration; all the BvPgb and the 25% P80 Mb samples were red, whereas the 30% P80 Mb series were brown, indicating strong oxidation. SAXS measurements of these bulk samples showed that the P80 content strongly affected the phase behaviour, while mostly small changes were observed with increasing protein concentration. In the 25% P80 samples (Figures 1A, B), the structure changed from inverse bicontinuous cubic with Im3m space group to Pn3m space group with increasing protein concentrations. This transition occurred at a lower protein concentration for Mb than BvPgb and in the trace for the highest concentration of Mb there was an additional peak at q = 0.046 Å−1, indicating coexistence with another phase.
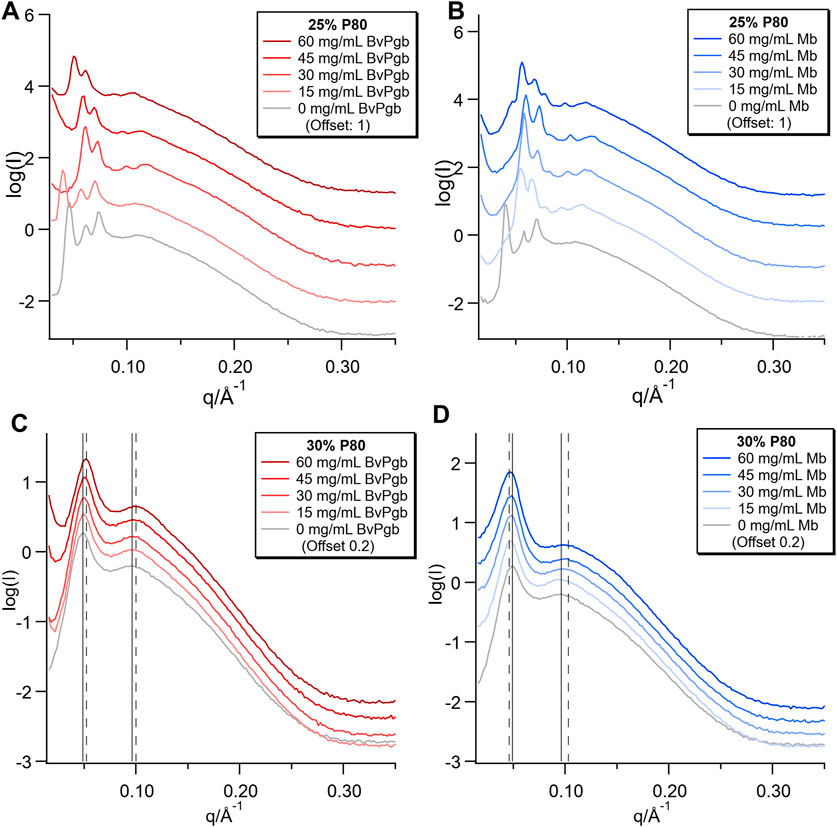
FIGURE 1. SAXS of bulk phases with varying concentrations of BvPgb1.2 (A,C) and Mb (B,D). Two different lipid compositions were used: 30/45/25 DGMO/GMO-50/P80 and 28/42/30 DGMO/GMO-50/P80, where the DGMO/GMO-50 ratio was kept constant at 40/60.
In the 30% P80 samples (Figures 1C, D), the two diffuse peaks characteristic of the sponge phase were observed, where the lower q peak of the sponge phase (q ≈ 0.05 Å−1) relates to the cell-cell correlation distance and the higher q peak (q ≈ 0.11 Å−1) relates to the bilayer thickness (Valldeperas et al., 2016). These were present for all concentrations of protein, with only very minor shifts of the peaks. In Figure 1C, there is a sharp upturn at low q, which increases in magnitude with increasing [BvPgb]. This low q upturn in scattering intensity indicates the formation of aggregates with a larger length scale than is covered by the available q range. It should be noted that aggregates could be observed visually in these samples (see Supplementary Figure S1). In some of the 25% P80 samples with Mb and BvPgb1.2, these upturns can also be observed, but without such a clear effect of concentration. We also note that the upturn was associated with a shift of the peaks to lower q that reflects dehydration of the phase. Thus, the visible aggregates likely reflect excess of water in the sample. Conversely, in Figure 1D, increasing [Mb] results in a minor broadening and shift to higher q of the higher q peak. This indicates that additional Mb causes the bilayer to become more disordered, which likely results in higher head group hydration.
From these SAXS patterns, it is possible to estimate the diameter of the water channels in the structure, as plotted in Figure 2. For the inverse bicontinuous cubic structures, the calculation was made using the infinite periodic minimal surface (IPMS) that the structure is based on. For the sponge phase, it was made by extrapolating from the the characteristics of the cubic phase formed at the same lipid ratio along the dilution line, but at higher lipid content, the calculation was made by comparison to the cubic phase immediately preceding it. For the 30% P80 samples, all of which retained the sponge phase structure, there was very little change in water channel diameter with both proteins. For the 30% P80 with BvPgb, there was a slight decrease in water channel diameter, whereas for Mb, the water channel diameter stayed at approximately 9 nm for all the Mb concentrations measured. For the 25% P80 samples, however, very different behaviours were observed. For the BvPgb, there was little change in water channel diameter even with the phase change from Im3m to Pn3m. For Mb, the size of the water channel decreased with increasing protein concentration until the highest concentration, where we observed an additional structure.
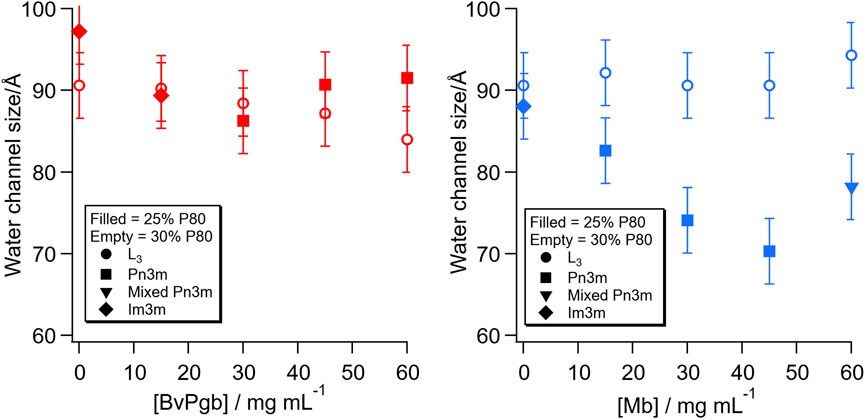
FIGURE 2. Change in water channel diameter with concentration of BvPgb (left) and Mb (right). The filled symbols refer to the lipid composition with 25% P80 and the empty symbols with 30% P80. The symbols refer to the following structures: sponge phase, L3 (●, circle), inverse bicontinuous cubic phase with Pn3m space group (■, square), mixed phase including Pn3m cubic (▼, inverted triangle) and inverse bicontinuous cubic phase with Im3m space group (♦, diamond).
Some interesting behaviour was observed for the highest concentration of BvPgb in the 30% P80 samples. The sample initially appeared homogenous when loaded into the SAXS sandwich cells. After leaving the sample in a vertical position for 24 h in the holder, a distinct region of higher BvPgb concentration could be observed (see inset of Figure 3). SAXS measurements of the protein rich and poor regions showed that the sponge phase structure was retained in each region and peak positions were similar to the sample before separation. However, the low q upturn was sharper in the protein rich region even than the pre-separation 60 mg/mL BvPgb sample. After placing the sample in a horizontal position, the sample returned to the pre-separation appearance (see Supplementary Figure S2). This cycle was repeated, indicating that this protein redistribution is reversible. This behaviour might indicate that the sample contained one phase rich in protein and another where the protein is depleted. Both phases had a similar structure of the lipid matrix.
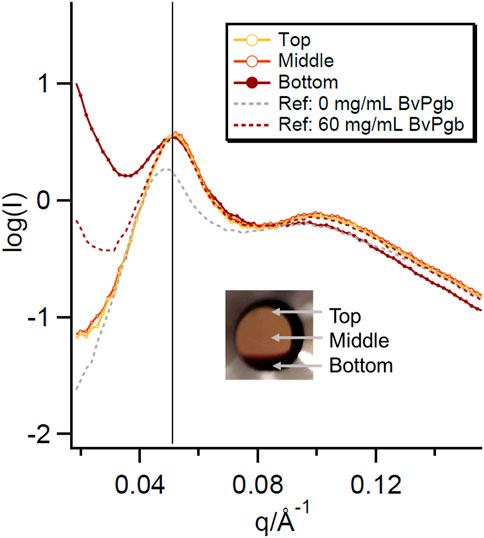
FIGURE 3. SAXS curves for the protein rich and poor regions of the phase separated 60 mg/mL BvPgb with 30% P80. SAXS data for the 0 mg/mL and pre-separation 60 mg/mL BvPgb bulk phases are plotted for comparison. The positions measured in the sample labelled “Top,” “Middle” and “Bottom” are shown in the inset.
3.2 Dispersions and size exclusion chromatography of BvPgb1.2 and Mb
Dispersions were prepared from the bulk samples with varying concentrations of Mb and BvPgb with different appearance depending on the starting bulk structure. For the 25% P80 sample series, there was no clear trend of change in colour with concentration (see Supplementary Figure S3). The dispersions with Mb appeared homogeneous and there were no visible aggregates. For the BvPgb samples, however, large translucent red/orange aggregates were observed at all concentrations and the number of aggregates increased with concentration. For both the 30% P80 sample series, the intensity of the colour increased with concentration and the dispersions appeared homogeneous (see Supplementary Figure S4). However, for the BvPgb series, a small number of opaque dark red aggregates were observed at the edges of the vials, most likely the protein aggregates observed at the edges of the corresponding bulk phases.
Broad peaks were observed in the SAXS patterns for all samples (Figure 4), with more well-defined and rounded peaks in the 30% P80 samples. The concentration dependent low q upturn observed in the bulk samples were also present in both the 25% and 30% P80 dispersions with BvPgb. However, for the 25% P80 samples with Mb the low q upturn was found to be independent of protein concentration.
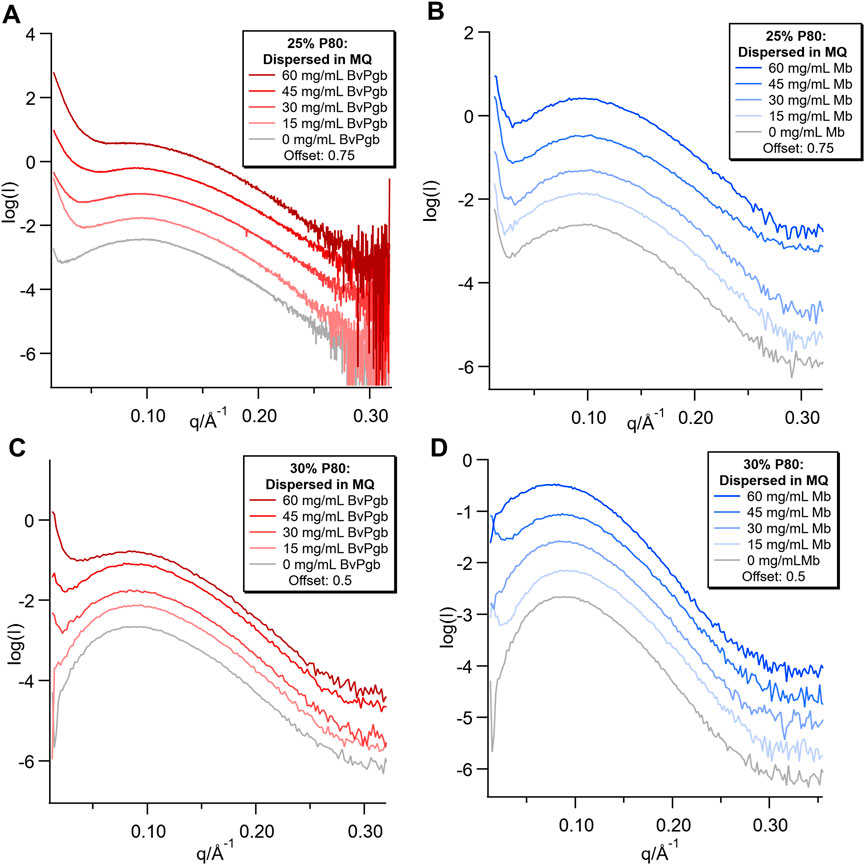
FIGURE 4. SAXS of dispersions with varying concentrations (0–60 mg/mL) of BvPgb and Mb. (A) samples were measured on CoSAXS beamline, (B,C,D) measured on the inhouse SAXS.
Due to the large size of the aggregates in the 25% P80 BvPbg sample series, the filtration required to run size exclusion chromatography was not possible. For the 30% P80 samples, however, size exclusion chromatography was performed to analyse the amount of free protein in the dispersion, either from leakage or protein that was not originally encapsulated.
Firstly, empty nanoparticles (no loaded protein) were run as a control and this is shown in Figure 5. Here, the particles eluted at ∼7.5 mL, corresponding to the maximal separation capacity of the column (75 kDa). As expected, no additional significant peak around 11–13 mL was observed, where both proteins would be detected. Thus, this spectrum can be compared to the protein-containing nanoparticles to evaluate the degree of free protein present in the samples.
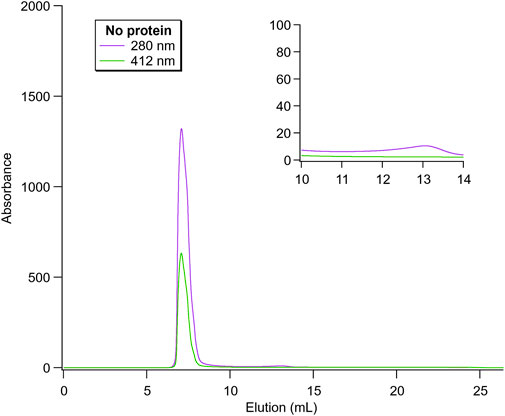
FIGURE 5. Size exclusion chromatography of empty nanoparticles. The peaks at 280 and 412 nm correspond to protein-backbone absorption and heme-containing proteins, respectively. Since no protein was loaded, the lipid phase system also showed absorbance here. The inset highlights the region in which the elution peak for the free proteins would be observed.
Nanoparticles containing BvPgb1.2 or Mb were analysed with different proteins loads. The results for the lowest and highest concentrations are shown in Figure 6. No free Mb was detected for 15 mg/mL (Figure 6A), showing similar results as the empty particles. However, a clear peak at 12.8 mL elution volume was observed for the highest protein load (60 mg/mL, Figure 6B). This is the expected elution volume for the 16.9 kDa protein, indicating presence of free Mb in the sample. In addition, the strong peak at 412 nm indicates a heme-containing protein was eluted. This was not observed for BvPgb1.2, either for 15 or 60 mg/mL (Figures 6C, D, respectively). The lower concentration showed no free protein at all, whereas the highest concentration showed a minor peak at 11.9 mL. However, the expected elution volume for the dimeric BvPgb1.2 corresponds to ∼10.9 mL (38.4 kDa). Thus, the observed peak was presumably a minor contamination, probably from the encapsulation, rather than monomeric, dimeric or oligomeric BvPgb1.2.
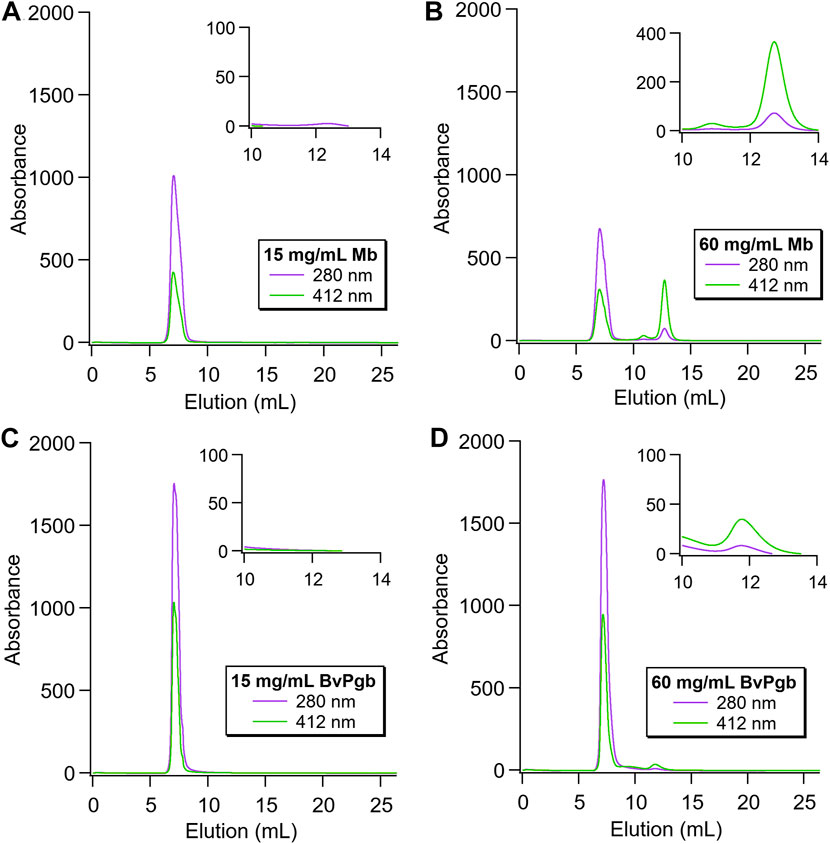
FIGURE 6. Size exclusion chromatography of encapsulated Mb and BvPgb1.2, with insets displaying the elution region for the free proteins (A) and (B): Nanoparticles loaded with 15 and 60 mg/ml Mb, respectively. A clear peak at 12.8 mL for the highest protein load was observed, highlighted in the inset, indicating the presence of free Mb. (C) and (D): Nanoparticles loaded with 15 and 60 mg/mL BvPgb1.2, respectively. No peak at the expected elution volume (10.9 mL) was observed, indicating no presence of free protein. The inset shows the peak at 11.9 mL in more detail, which, as it does not correspond to the expected elution volume for BvPgb, is most likely contamination from the encapsulation rather than free protein.
3.3 Buffer effects on BvPgb1.2 and Mb-containing dispersions
In the 25% P80 dispersions, aggregation of the proteins clearly plays a role, as apparent from the low q upturn observed in the SAXS curves for the Mb concentration series and the extensive aggregation of BvPgb at the bottom of the vials in the BvPgb series. As protein stability is highly dependent on the environment, there are a range of factors that could affect the protein stability in the sponge phase, including interactions with the sponge phase lipids, and pH and ionic strength (Talley and Alexov, 2010; Deller et al., 2016). Although the dispersing solvent easily diffuses in and out of the water channels in the bicontinuous phases, the buffering effect of the Tris-HCl buffer in the bulk systems is affected by the large area of lipid aqueous interface. The “local pH” close to the lipid interfaces can therefore drop close to or below the isoelectric point, pI, of the proteins, which may result in aggregation. The pI of Mb is 7.3 (major component) and 6.8 (minor component) (Zhao et al., 2017) whereas the corresponding pI values for BvPgb are 7.85 (monomer) and 8.32 (dimer) (see Supplementary Material for calculation), making the BvPgb more sensitive to any pH fluctuations. We therefore prepared an additional set of samples with Mb of different concentrations included in a lipid dispersion with 25% P80 in 50 mM Tris-HCl buffer pH 8.5 instead of MQ.
SAXS data from this dispersion series containing the lowest and highest Mb concentration are plotted with the SAXS data for the corresponding dispersions in MQ water for comparison in Figure 7 (SAXS data for the full concentration series are shown in Supplementary Figure S7). The SAXS curves showed broad peaks for both Mb concentrations in MQ and Tris-HCl. The peaks in MQ were more well defined than for the Tris-HCl samples. Additionally, the sharp upturn at low q seen in the MQ dispersion data was either not present or greatly reduced for all of the dispersions in Tris-HCl.
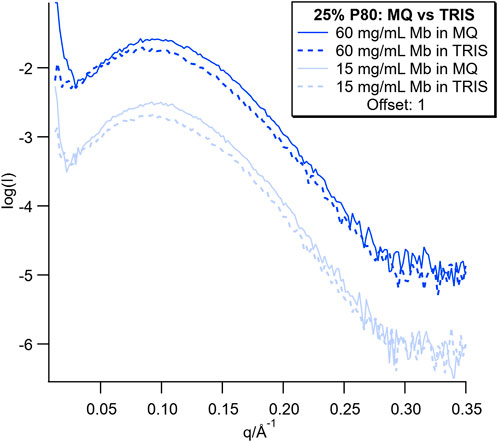
FIGURE 7. SAXS curves for dispersions with the lowest and highest concentration of Mb in MQ and Tris buffer. SAXS curves for the full concentration series are plotted in Supplementary Figure S7.
Figure 8 shows the correlation curves from the corresponding DLS measurements for these samples. The data for the dispersions in MQ have a similar shape for all Mb concentrations. However, with increasing Mb concentration in Tris-HCl buffer, the y intercept of the curve decreases and the growth of a shoulder at longer relaxation time indicates the increasing contribution of larger objects, which most likely were sedimenting (Stetefeld et al., 2016; Hawe et al., 2020).
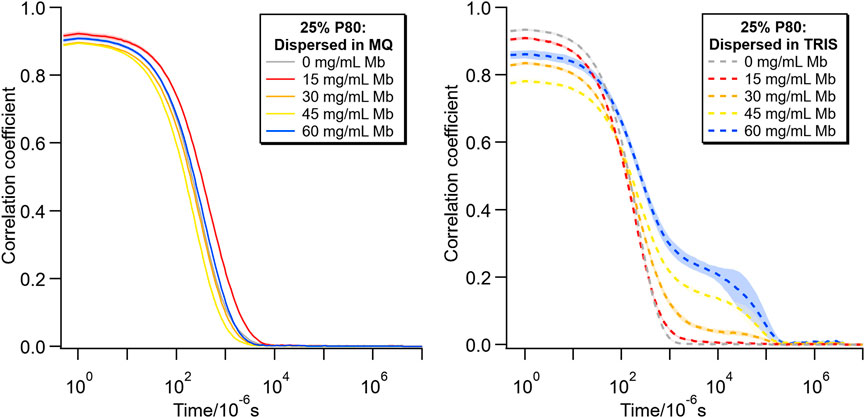
FIGURE 8. DLS correlograms comparing lipid particles with 25% P80 in MQ (left) and Tris-HCl buffer (right) for different concentrations of Mb (0–60 mg/mL).
3.4 Buffer effects regarding lipid interactions
Although there was a clear case for the buffer effect on the encapsulated proteins, it should be noted that there is a possible buffer effect on the lipids too. In previous work, the DLS data for these samples typically had a polydispersity index (PDI) of <0.26 (Valldeperas et al., 2016; Gilbert et al., 2019) for 30% P80 without protein, while here we observed a typical PDI of >0.4. This value increased to >0.5 with addition of the protein. In order to investigate this effect, lipid mixtures containing 25, 27.5% and 30% P80 were dispersed directly into MQ or 50 mM Tris-HCl buffer pH 8.5.
The mean hydrodynamic diameter of the dispersions was very similar for all samples (summarised in Figures 9A, B), while the PDIs for the dispersions in Tris-HCl were significantly lower than those in MQ. Although they cannot by directly compared due to the difference in dispersion methods, as described in the Supplementary Material, the PDI of the dispersions in MQ here are similar to those observed in previous work (Gilbert et al., 2019).
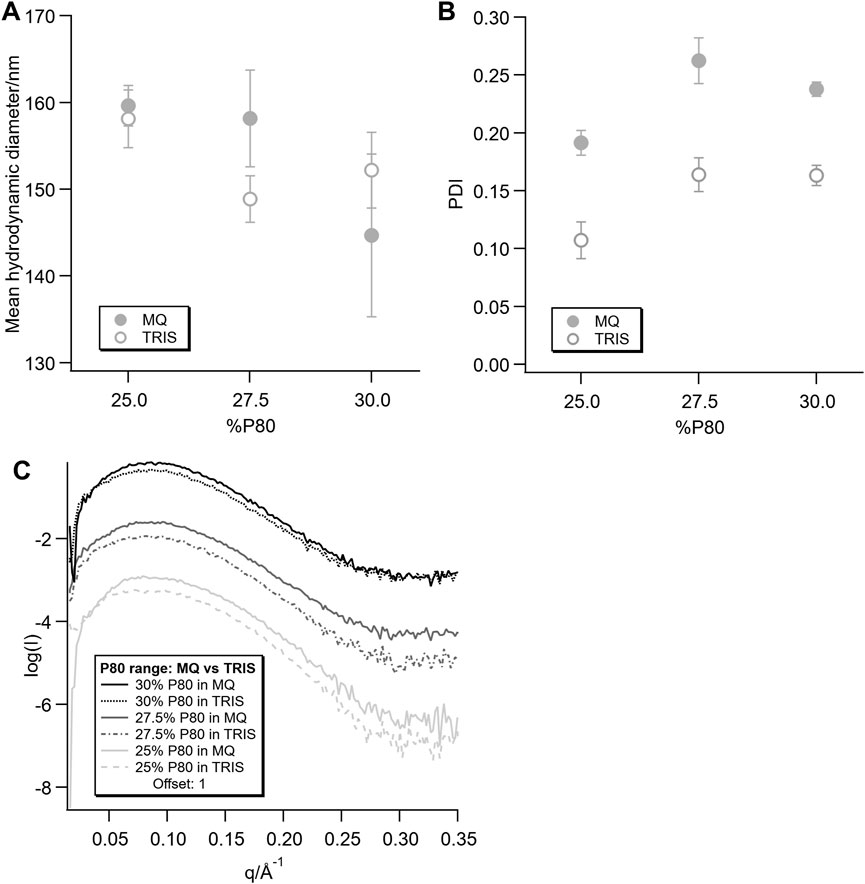
FIGURE 9. Hydrodynamic diameter (A) and polydispersity index (B) from DLS measurements and SAXS data (C) for the dispersions without protein dispersed directly in MQ or Tris-HCl.
In the corresponding SAXS data (Figure 9C), the same trend as for the 25% P80 Mb concentration series dispersed in MQ and Tris-HCl was observed. The dispersions in both solvents showed broad peaks, but with a less well defined, lower intensity peak for the dispersions in Tris-HCl.
4 Discussion
4.1 Characterization of bulk phase containing BvPgb1.2 or Mb
Self-assembly of lipids into different structures can be affected by many factors, including lipid composition, ionic strength, pH and presence of additives, such as proteins (Lindblom and Rilfors, 1992; Seddon and Templer, 1995; Hyde and Schröder, 2003; Boyd et al., 2009). Both Mb and BvPgb have relatively hydrophilic amino acids at the surface and hydrodynamic diameters that are smaller than the calculated water channel diameters, 4.3 ± 0.1 nm for Mb and 6.7 ± 0.3 nm for BvPgb (see Supplementary Table S1). This indicates that they would most likely be situated in the water channels of the bulk phase and/or interacting with the hydrophilic head groups of the lipids.
As seen when comparing Figures 1A–D, increasing the amount of P80 in the lipid mixture changed the structure formed from a higher curvature (inverse bicontinuous cubic phase) to one with lower curvature due to the large head group of P80 (Valldeperas et al., 2016). This effect has previously been observed in work comparing the ternary DGMO/GMO-50/water system and quaternary DGMO/GMO-50/P80/water systems (Valldeperas et al., 2016). For both proteins studied a transition from the bicontinuous cubic Im3m to Pn3m structure occurred for the samples with 25% P80 with increasing protein concentration (Figures 1A, B). This cubic-cubic phase transition has typically been associated with a decrease in hydration (Mezzenga et al., 2019), indicating that there are protein-lipid head group interactions for both proteins. This has previously been shown for similar systems in which water-lipid head group bonds are replaced by protein-lipid head group bonds, decreasing hydration of the head groups (Gilbert et al., 2019; Gilbert et al., 2022). For both 30% P80 protein series, the sponge phase was retained for both protein concentration ranges measured here with some minor changes in peak position.
For both BvPgb sample series (Figure 2, left), little change in water channel size was observed with either percentage of P80, indicating that there are no particularly strong lipid-protein interactions. In literature, electrostatic interactions have been observed between Hb and negatively charged lipids (PS) below physiological pH (7.4), but not between zwitterionic and neutral lipids at physiological pH (Shviro et al., 1982; Szebeni et al., 1985). Although, due to the difference in quaternary structure between tetrameric Hb and dimeric BvPgb1.2, the interactions between these proteins and lipids might differ. Moreover, the hexacoordinated heme in BvPgb1.2 would make the protein less prone to cause lipid oxidation or similar fatty acid interactions. Additionally, both BvPgb sample series were red, indicating that BvPgb was able to retain O2 in its active ferrous (Fe2+) oxidation state, probably due to its increased thermal and redox stability (Christensen et al., 2022).
This contrasts with the behaviour of the Mb sample series (Figure 2, right), where, although the water channel size for the 30% P80 series was relatively constant, the size for the 25% P80 series decreased with increasing Mb concentration. It has previously been reported that fatty acids can bind both specifically and non-specifically to Mb at physiological pH (Shih et al., 2015). In addition, particularly relevant for this work, oleic acid, which has the same lipid tail as all of the lipid components used in this system, can bind strongly to Mb (Sriram et al., 2008). The heme subunit has also been observed to partition into the hydrophobic core of phospholipid bilayers, due to hydrophobic interactions (Ginsburg and Demel, 1983; Cannon et al., 1984). This could result in a strong interaction between Mb and the hydrophobic part of the bilayer. This raises the question, however, of why there is a strong trend in the water channel size with Mb concentration for the 25% P80 series, but less so in the 30% P80 series. This can be an effect of the different structures, the added P80, the oxidation state of the Mb or a combination of these factors. The samples in the 25% P80 sample series were red, indicating that the Mb is in the oxyMb form, which has been shown to have a higher fatty acid binding affinity (Götz et al., 1994) than the metMb form, most likely present in the brown 30% P80 series. In the case that the Mb fatty acid binding is significant, it is also possible that the addition of P80, with its large head group, limits the Mb interaction with and access to the hydrophobic region, thereby reducing this effect.
It should also be noted that both Mb and BvPgb have the ability to autoxidize to metMb and metPgb (i.e., from Fe+2 to Fe+3). Although the reduced form has a lower pro-oxidant ability, both forms have been shown to cause oxidation and peroxidation in lipids (Sterniša et al., 2018; Tatiyaborworntham et al., 2022; Wu et al., 2022). However, due to the stabilization of the hexacoordination ferrous form in BvPgb1.2; this protein would potentially be less reactive in comparison to the pentacoordniated Mb.
In previous work with the 30% P80 lipid system, similar effects on the lipid bulk structure have been observed with other encapsulated proteins over a similar concentration range. For beta-galactosidase (238 kDa, hydrodynamic diameter = 11.8 nm), the sponge phase structure was retained over the full range studied (Erskine et al., 2003; Pereira-Rodríguez et al., 2012), but a significant decrease in water channel size was observed, whereas for aspartic protease (34 kDa, hydrodynamic diameter = 6.0 nm), a transition from sponge phase to Pn3m cubic phase was observed at an intermediate protein concentration. For both proteins, a strong interaction with the lipid bilayer, including (partial) insertion was observed, even though both proteins have mostly hydrophilic surface amino acids (Erskine et al., 2003; Pereira-Rodríguez et al., 2012), indicating that there can be strong hydrophobic interactions even for hydrophilic proteins (Valldeperas Badell, 2019).
The additional observation of gravity induced phase separation in the highest concentration sample of the 30% P80 BvPgb sample into a protein rich and protein poor region indicates an interesting aggregation behaviour of the BvPgb in the bulk phase. The concentration dependent low q upturn observed for the 30% P80 BvPgb series most likely indicates a concentration dependent protein aggregation. However, this phase separation was only observed in the highest concentration sample of the series. For sedimentation, the size of the aggregates must be dense and sufficiently large. Therefore, a much stronger upturn at low q could be observed in the SAXS data for the protein rich region than both the protein poor regions and the pre-separation in the 60 mg/mL BvPgb sample (Figure 3). However, the separation was reversible and upon changing position, the protein appeared to diffuse through the sponge phase structure to the pre-separation state. This implies that these aggregates are transient (induced by confinement), weakly bound or can exist alongside the sponge phase structure without disrupting it.
4.2 Characterizations of dispersions of BvPgb1.2 and Mb
SAXS data were less well-defined for the dispersions of the sponge phase structure, where the cell-cell correlation peak becomes more diffuse, partly due to surface effects of the particle morphology (Valldeperas et al., 2016). The peak due to the bilayer form factor, which is present in the scattering pattern for both sponge phase nanoparticles and vesicles, remains well-defined in the dispersion data. As a result, the bilayer peak tends to dominate the scattering curve and the cell-cell correlation peak becomes weak, making it hard to differentiate the contribution from the sponge phase nanoparticles and any vesicles in the sample. From complementary cryo-TEM images of the 30% P80 sample series (Supplementary Figure S8), a significant vesicle population could be observed in all samples, indicating that they can contribute to the dispersion SAXS data in Figure 4. However, we cannot rule out that some of the sponge phase particles are transferred to vesicles during the blotting process for the cryo-TEM samples.
For the 25% P80 sample series for both proteins, there seems to be no direct relation between the colour and the protein concentration. For the BvPgb, this is clearly due to extensive protein aggregation and sedimentation. However, this is less clear in the case of Mb, where there were no visible aggregates in the Mb dispersions. However, the protein concentration independent upturn in scattering intensity at low q observed in the SAXS data implies that there are similarly sized aggregates in all of the samples. This reflects the limited colloidal stability of the system in the presence of 25% P80. Additionally, in the presence of protein it is possible that the aggregate size is linked to the higher pI of BvPgb and therefore aggregation can be induced even by smaller changes in pH towards the pI.
In contrast, however, there was a clear concentration dependent color change for both 30% P80 sample series. Although the concentration dependent upturn in scattering intensity at low q was present for the BvPgb series, most of the protein appears to remain in the particles as observed when SEC (Figure 6) analyzed presence of free protein in the dispersions. For the highest concentration of BvPgb, no free protein was detected, showing that the protein remained within the lipid nanoparticles. A minor peak corresponding to a slightly larger mass than the protein was observed, however, which was possibly contamination or more likely a protein-lipid complex. In contrast, the presence of free monomeric Mb was observed for the higher Mb concentration, possibly due to leakage or incomplete encapsulation.
The two coordination states of the heme iron may have caused other types of interactions of the proteins with lipid matrix. The higher autoxidation rate and tendency to appear in the inert ferric (Fe3+) for pentacoordinated Hbs (Silkstone et al., 2016), like in Mb, might not impact the encapsulation process. However, it could cause oxidative reactions with lipids due to the rapid oxidation and increase the interactions with the lipids. Furthermore, even though the hexacoordinated BvPgb1.2 has increased thermal and redox stability in comparison (Christensen et al., 2022), the ability to retain O2 in its active ferrous oxidation state might have affected the encapsulation capacity and lead to the formation of aggregates. The heme-containing proteins are known to interact with lipids in vivo (Ahmed et al., 2020) and differently between saturated/unsaturated lipid components (Szebeni et al., 1985). The clear difference in encapsulating capacity could indicate the inefficiency for hexacoordinated Hbs in this particular lipid phase system.
4.3 Buffer effects on BvPgb1.2 and Mb encapsulation
When comparing the data for the dispersions without proteins, it can be concluded that the presence of the Tris-HCl buffer also has an effect on the lipid self-assembly. When comparing the SAXS data for the dispersions in Tris-HCl and MQ (Figures 7, 9 and Supplementary Figure S6), the dispersions in Tris-HCl consistently had slightly less intense and well-defined peaks regardless of the protein or lipid composition. This indicates that the presence of Tris-HCl affects the order in the bilayer. For dispersions prepared from the bulk phase prepared with Tris-HCl buffer and dispersed in MQ, the PDI was consistently higher than in previous measurements where the bulk phase was prepared with the same concentration of phosphate buffer (pH7) or acetate buffer (pH5.5) (Gilbert et al., 2019; Valldeperas Badell, 2019) and dispersed in MQ. It is possible that if the bulk structure is formed and equilibrated with a higher concentration of Tris-HCl, it causes some kind of osmotic shock when the bulk phase is dispersed in MQ, where the reduced Tris-HCl concentration could lead to disrupted salt bridges and cause structural changes. However, when dispersing the lipids mixture directly via sonication or preparing the bulk phase with Tris-HCl buffer and dispersing it in Tris-HCl via the shaking method (Figure 9, Supplementary Table S2), the PDI of the dispersions in Tris-HCl have a lower PDI than the dispersions in MQ regardless of lipid composition, where the Tris-HCl ions may have a stabilising effect.
5 Conclusion
In this study, we have compared the encapsulating capacity of heme-containing proteins BvPgb1.2 and Mb in a lipid sponge phase system. Techniques including SAXS, DLS and SEC were used to characterize the resulting bulk phases and dispersions, as well as buffer effects with and without proteins. The study highlights the propensity for BvPgb1.2 to form transient aggregates in high protein concentrations, while this was not observed for Mb. In addition, the higher pI of BvPgb1.2 could make it more prone to aggregation and more sensitive to small pH changes near physiological pH. Both proteins showed potentially weak interactions with the surrounding lipid structure, even though the less stable pentacoordination of Mb might cause a higher degree of lipid peroxidation than the hexacoordinated BvPgb1.2. This study has demonstrated the overall complexity of this system, with synergistic/competing effects of the protein, buffer and lipid on aggregate size and self-assembled lipid structure. Even though bulk phases and dispersions were characterized, additional studies are needed to further investigate these interactions in the future to facilitate efficient protein loading and delivery using this and similar lipid sponge phase systems.
Data availability statement
The raw data supporting the conclusion of this article will be made available by the authors, without undue reservation.
Author contributions
JG, SC, TN, and LB initiated and planned the project. JG performed the encapsulations, SAXS and DLS measurements. SC produced and purified BvPgb1.2 and made protein samples used for encapsulation. SC performed the analytical size exclusion chromatography. JG and SC analyzed the data. JG and SC co-wrote the manuscript. All authors contributed to the article and approved the submitted version.
Funding
The financial support from Swedish Research council under contract 2017-06716 and 2020-05421 and from NanoLund is gratefully acknowledged.
Acknowledgments
We acknowledge MAX IV Laboratory for time on Beamline CoSAXS under Proposal 20211155. Research conducted at MAX IV, a Swedish national user facility, is supported by the Swedish Research council under contract 2018-07152, the Swedish Governmental Agency for Innovation Systems under contract 2018-04969, and Formas under contract 2019-02496. We are thankful for the generous support of and valuable discussions with Ann Terry at Max IV.
Conflict of interest
The authors declare that the research was conducted in the absence of any commercial or financial relationships that could be construed as a potential conflict of interest.
The author TN declared that they were an editorial board member of Frontiers, at the time of submission. This had no impact on the peer review process and the final decision.
Publisher’s note
All claims expressed in this article are solely those of the authors and do not necessarily represent those of their affiliated organizations, or those of the publisher, the editors and the reviewers. Any product that may be evaluated in this article, or claim that may be made by its manufacturer, is not guaranteed or endorsed by the publisher.
Supplementary material
The Supplementary Material for this article can be found online at: https://www.frontiersin.org/articles/10.3389/frsfm.2023.1201561/full#supplementary-material
References
Ahmed, M. H., Ghatge, M. S., and Safo, M. K. (2020). Hemoglobin: Structure, function and allostery. Subcell. Biochem. 94, 345–382. doi:10.1007/978-3-030-41769-7_14
Anderson, D., Wennerstroem, H., and Olsson, U. (1989). Isotropic bicontinuous solutions in surfactant-solvent systems: The L3 phase. J. Phys. Chem. 93 (10), 4243–4253. doi:10.1021/j100347a067
Becana, M., Yruela, I., Sarath, G., Catalán, P., and Hargrove, M. S. (2020). Plant hemoglobins: A journey from unicellular green algae to vascular plants. New Phytol. 227 (6), 1618–1635. doi:10.1111/nph.16444
Bisset, N. B., Boyd, B. J., and Dong, Y. D. (2015). Tailoring liquid crystalline lipid nanomaterials for controlled release of macromolecules. Int. J. Pharm. 495 (1), 241–248. doi:10.1016/j.ijpharm.2015.08.072
Boyd, B. J., Dong, Y. D., and Rades, T. (2009). Nonlamellar liquid crystalline nanostructured particles: Advances in materials and structure determination. J. Liposome Res. 19 (1), 12–28. doi:10.1080/08982100802691983
Bülow, L., Holmberg, N., Lilius, G., and Bailey, J. E. (1999). The metabolic effects of native and transgenic hemoglobins on plants. Trends Biotechnol. 17 (1), 21–24. doi:10.1016/s0167-7799(98)01252-9
Cannon, J. B., Kuo, F. S., Pasternack, R. F., Wong, N. M., and Muller-Eberhard, U. (1984). Kinetics of the interaction of hemin liposomes with heme binding proteins. Biochemistry 23 (16), 3715–3721. doi:10.1021/bi00311a022
Chouraqui, J. P. (2022). Dietary approaches to iron deficiency prevention in childhood-A critical public health issue. Nutrients 14 (8), 1604. doi:10.3390/nu14081604
Christensen, S., Groth, L., Leiva-Eriksson, N., Nyblom, M., and Bülow, L. (2022). Oxidative implications of substituting a conserved cysteine residue in sugar beet phytoglobin BvPgb 1.2. Antioxidants 11 (8), 1615. doi:10.3390/antiox11081615
Christensen, S., Stenström, O., Akke, M., and Bülow, L. (2023). Conformational dynamics of phytoglobin BvPgb1.2 from beta vulgaris ssp. vulgaris. Int. J. Mol. Sci. 24 (4), 3973. doi:10.3390/ijms24043973
Deller, M. C., Kong, L., and Rupp, B. (2016). Protein stability: A crystallographer's perspective. Acta Crystallogr. F. Struct. Biol. Commun. 72 (2), 72–95. doi:10.1107/s2053230x15024619
Dordas, C. (2009). Nonsymbiotic hemoglobins and stress tolerance in plants. Plant Sci. 176 (4), 433–440. doi:10.1016/j.plantsci.2009.01.003
Erskine, P. T., Coates, L., Mall, S., Gill, R. S., Wood, S. P., Myles, D. A., et al. (2003). Atomic resolution analysis of the catalytic site of an aspartic proteinase and an unexpected mode of binding by short peptides. Protein Sci. 12 (8), 1741–1749. doi:10.1110/ps.0305203
Fisher, A. E. O., and Naughton, D. P. (2004). Iron supplements: The quick fix with long-term consequences. Nutr. J. 3, 2. doi:10.1186/1475-2891-3-2
Fong, W. K., Hanley, T., and Boyd, B. J. (2009). Stimuli responsive liquid crystals provide 'on-demand' drug delivery in vitro and in vivo. J. Control Release 135 (3), 218–226. doi:10.1016/j.jconrel.2009.01.009
Garrocho-Villegas, V., Gopalasubramaniam, S. K., and Arredondo-Peter, R. (2007). Plant hemoglobins: What we know six decades after their discovery. Gene 398 (1-2), 78–85. doi:10.1016/j.gene.2007.01.035
Gilbert, J., Ermilova, I., Nagao, M., Swenson, J., and Nylander, T. (2022). Effect of encapsulated protein on the dynamics of lipid sponge phase: A neutron spin echo and molecular dynamics simulation study. Nanoscale 14 (18), 6990–7002. doi:10.1039/D2NR00882C
Gilbert, J., Valldeperas, M., Dhayal, S. K., Barauskas, J., Dicko, C., and Nylander, T. (2019). Immobilisation of β-galactosidase within a lipid sponge phase: Structure, stability and kinetics characterisation. Nanoscale 11 (44), 21291–21301. doi:10.1039/C9NR06675F
Ginsburg, H., and Demel, R. A. (1983). The effect of ferriprotoporphyrin IX and chloroquine on phospholipid monolayers and the possible implications to antimalarial activity. Biochimica Biophysica Acta (BBA) - Biomembr. 732 (1), 316–319. doi:10.1016/0005-2736(83)90219-5
Götz, F. M., Hertel, M., and Gröschel-Stewart, U. (1994). Fatty acid binding of myoglobin depends on its oxygenation. Biol. Chem. Hoppe Seyler 375 (6), 387–392. doi:10.1515/bchm3.1994.375.6.387
Gupta, K. J., Hebelstrup, K. H., Mur, L. A. J., and Igamberdiev, A. U. (2011). Plant hemoglobins: Important players at the crossroads between oxygen and nitric oxide. FEBS Lett. 585 (24), 3843–3849. doi:10.1016/j.febslet.2011.10.036
Hawe, A., Weinbuch, D., Zölls, S., Reichel, A., and Carpenter, J. F. (2020). “Chapter 10 - submicrometer, micrometer and visible particle analysis in biopharmaceutical research and development,” in Biophysical characterization of proteins in developing biopharmaceuticals. Editors D. J. Houde, and S. A. Berkowitz (Amsterdam, Netherlands: Elsevier (North Holland Publishing Co.)), 285–310.
Hill, R. D. (2012). Non-symbiotic haemoglobins-What's happening beyond nitric oxide scavenging? AoB PLANTS 2012, pls004. doi:10.1093/aobpla/pls004
Hoy, J. A., and Hargrove, M. S. (2008). The structure and function of plant hemoglobins. Plant physiology Biochem. PPB 46 (3), 371–379. doi:10.1016/j.plaphy.2007.12.016
Hyde, S. T., and Schröder, G. E. (2003). Novel surfactant mesostructural topologies: Between lamellae and columnar (hexagonal) forms. Curr. Opin. Colloid & Interface Sci. 8 (1), 5–14. doi:10.1016/S1359-0294(03)00014-1
Igamberdiev, A. U., Bykova, N. V., and Hill, R. D. (2006). Nitric oxide scavenging by barley hemoglobin is facilitated by a monodehydroascorbate reductase-mediated ascorbate reduction of methemoglobin. Planta 223 (5), 1033–1040. doi:10.1007/s00425-005-0146-3
Igamberdiev, A. U., Bykova, N. V., and Hill, R. D. (2011). Structural and functional properties of class 1 plant hemoglobins. IUBMB Life 63 (3), 146–152. doi:10.1002/iub.439
Leiva Eriksson, N., Reeder, B. J., Wilson, M. T., and Bülow, L. (2019). Sugar beet hemoglobins: Reactions with nitric oxide and nitrite reveal differential roles for nitrogen metabolism. Biochem. J. 476 (14), 2111–2125. doi:10.1042/BCJ20190154
Leiva-Eriksson, N., Pin, P. A., Kraft, T., Dohm, J. C., Minoche, A. E., Himmelbauer, H., et al. (2014). Differential expression patterns of non-symbiotic hemoglobins in sugar beet (Beta vulgaris ssp. vulgaris). Plant Cell. Physiol. 55 (4), 834–844. doi:10.1093/pcp/pcu027
Lindblom, G., and Rilfors, L. (1992). Nonlamellar phases formed by membrane lipids. Adv. Colloid Interface Sci. 41, 101–125. doi:10.1016/0001-8686(92)80009-m
Mezzenga, R., Seddon, J. M., Drummond, C. J., Boyd, B. J., Schröder-Turk, G. E., and Sagalowicz, L. (2019). Nature-inspired design and application of lipidic lyotropic liquid crystals. Adv. Mater. 31 (35), 818. doi:10.1002/adma.201900818
Mulet, X., Boyd, B. J., and Drummond, C. J. (2013). Advances in drug delivery and medical imaging using colloidal lyotropic liquid crystalline dispersions. J. Colloid Interface Sci. 393, 1–20. doi:10.1016/j.jcis.2012.10.014
Perazzolli, M., Dominici, P., Romero-Puertas, M. C., Zago, E., Zeier, J. r., Sonoda, M., et al. (2004). Arabidopsis nonsymbiotic hemoglobin AHb1 modulates nitric oxide bioactivity. Plant Cell. 16 (10), 2785–2794. doi:10.1105/tpc.104.025379
Pereira-Rodríguez, A., Fernández-Leiro, R., González-Siso, M. I., Cerdán, M. E., Becerra, M., and Sanz-Aparicio, J. (2012). Structural basis of specificity in tetrameric Kluyveromyces lactis β-galactosidase. J. Struct. Biol. 177 (2), 392–401. doi:10.1016/j.jsb.2011.11.031
Piskin, E., Cianciosi, D., Gulec, S., Tomas, M., and Capanoglu, E. (2022). Iron absorption: Factors, limitations, and improvement methods. ACS Omega 7 (24), 20441–20456. doi:10.1021/acsomega.2c01833
Riquelme, A., and Hinrichsen, P. (2015). Non-symbiotic hemoglobin and its relation with hypoxic stress. Chil. J. Agric. Res. 75, 80–89. doi:10.4067/S0718-58392015000300009
Seddon, J. M., and Templer, R. H. (1995). “Chapter 3 - polymorphism of lipid-water systems,” in Handbook of biological physics. Editors R. Lipowsky, and E. Sackmann (Amsterdam, Netherlands: Elsevier (North Holland Publishing Co.)), 97–160.
Shah, J. C., Sadhale, Y., and Chilukuri, D. M. (2001). Cubic phase gels as drug delivery systems. Adv. Drug Deliv. Rev. 47 (2-3), 229–250. doi:10.1016/s0169-409x(01)00108-9
Shih, L., Chung, Y., Sriram, R., and Jue, T. (2015). Interaction of myoglobin with oleic acid. Chem. Phys. Lipids 191, 115–122. doi:10.1016/j.chemphyslip.2015.07.010
Shviro, Y., Zilber, I., and Shaklai, N. (1982). The interaction of hemoglobin with phosphatidylserine vesicles. Biochim. Biophys. Acta 687 (1), 63–70. doi:10.1016/0005-2736(82)90170-5
Silkstone, G. G. A., Silkstone, R. S., Wilson, M. T., Simons, M., Bülow, L., Kallberg, K., et al. (2016). Engineering tyrosine electron transfer pathways decreases oxidative toxicity in hemoglobin: Implications for blood substitute design. Biochem. J. 473 (19), 3371–3383. doi:10.1042/BCJ20160243
Smagghe, B. J., Halder, P., and Hargrove, M. S. (2008). Measurement of distal histidine coordination equilibrium and kinetics in hexacoordinate hemoglobins. Methods Enzymol. 436, 359–378. doi:10.1016/s0076-6879(08)36020-0
Smagghe, B. J., Hoy, J. A., Percifield, R., Kundu, S., Hargrove, M. S., Sarath, G., et al. (2009). Review: Correlations between oxygen affinity and sequence classifications of plant hemoglobins. Biopolymers 91 (12), 1083–1096. doi:10.1002/bip.21256
Sriram, R., Kreutzer, U., Shih, L., and Jue, T. (2008). Interaction of fatty acid with myoglobin. FEBS Lett. 582 (25-26), 3643–3649. doi:10.1016/j.febslet.2008.09.047
Sterniša, M., Dvořak, P., Lunda, R., Linhartova, Z., Smole Možina, S., and Mraz, J. (2018). Bleeding of common carp (Cyprinus carpio) improves sensory quality of fillets and slows oxidative and microbiological changes during refrigerated aerobic storage. Food Technol. Biotechnol. 56 (4), 524–532. doi:10.17113/ftb.56.04.18.5792
Stetefeld, J., McKenna, S. A., and Patel, T. R. (2016). Dynamic light scattering: A practical guide and applications in biomedical sciences. Biophys. Rev. 8 (4), 409–427. doi:10.1007/s12551-016-0218-6
Stryer, L. B., Gatto, G. J., and Tymoczko, J. L. (2019). Biochemistry. 9th ed. New York: Macmillan International Higher Education.
Szebeni, J., Di Iorio, E. E., Hauser, H., and Winterhalter, K. H. (1985). Encapsulation of hemoglobin in phospholipid liposomes: Characterization and stability. Biochemistry 24 (12), 2827–2832. doi:10.1021/bi00333a003
Talley, K., and Alexov, E. (2010). On the pH-optimum of activity and stability of proteins. Proteins 78 (12), 2699–2706. doi:10.1002/prot.22786
Tatiyaborworntham, N., Oz, F., Richards, M. P., and Wu, H. (2022). Paradoxical effects of lipolysis on the lipid oxidation in meat and meat products. Food Chem. X 14, 100317. doi:10.1016/j.fochx.2022.100317
Tejero, J., and Gladwin, M. T. (2014). The globin superfamily: Functions in nitric oxide formation and decay. Biol. Chem. 395 (6), 631–639. doi:10.1515/hsz-2013-0289
Valldeperas Badell, M. (2019). Lipid sponge phase nanostructures as carriers for enzymes. (Doctor Doctoral Thesis). Lund, Sweden: Lund University, 978.
Valldeperas, M., Talaikis, M., Dhayal, S. K., Velička, M., Barauskas, J., Niaura, G., et al. (2019). Encapsulation of aspartic protease in nonlamellar lipid liquid crystalline phases. Biophys. J. 117 (5), 829–843. doi:10.1016/j.bpj.2019.07.031
Valldeperas, M., Wiśniewska, M., Ram-On, M., Kesselman, E., Danino, D., Nylander, T., et al. (2016). Sponge phases and nanoparticle dispersions in aqueous mixtures of mono- and diglycerides. Langmuir 32 (34), 8650–8659. doi:10.1021/acs.langmuir.6b01356
van der Merwe, R., Kruger, J., Ferruzzi, M. G., Duodu, K. G., and Taylor, J. R. N. (2019). Improving iron and zinc bioaccessibility through food-to-food fortification of pearl millet with tropical plant foodstuffs (moringa leaf powder, roselle calyces and baobab fruit pulp). J. Food Sci. Technol. 56 (4), 2244–2256. doi:10.1007/s13197-019-03711-y
Vázquez-Limón, C., Hoogewijs, D., Vinogradov, S. N., and Arredondo-Peter, R. (2012). The evolution of land plant hemoglobins. Plant Sci. 191-192, 71–81. doi:10.1016/j.plantsci.2012.04.013
Wu, H., Richards, M. P., and Undeland, I. (2022). Lipid oxidation and antioxidant delivery systems in muscle food. Compr. Rev. Food Sci. Food Saf. 21 (2), 1275–1299. doi:10.1111/1541-4337.12890
Keywords: hexacoordination, myoglobin, pentacoordination, iron supplementation, phase transition, phytoglobin
Citation: Gilbert J, Christensen S, Nylander T and Bülow L (2023) Encapsulation of sugar beet phytoglobin BvPgb 1.2 and myoglobin in a lipid sponge phase system. Front. Soft. Matter 3:1201561. doi: 10.3389/frsfm.2023.1201561
Received: 14 April 2023; Accepted: 29 May 2023;
Published: 08 June 2023.
Edited by:
Sugam Kumar, Bhabha Atomic Research Centre (BARC), IndiaReviewed by:
Paolo Mariani, Polytechnic University of Marche, ItalyNikos Hatzakis, University of Copenhagen, Denmark
Jens Meissner, BASF, Germany
Copyright © 2023 Gilbert, Christensen, Nylander and Bülow. This is an open-access article distributed under the terms of the Creative Commons Attribution License (CC BY). The use, distribution or reproduction in other forums is permitted, provided the original author(s) and the copyright owner(s) are credited and that the original publication in this journal is cited, in accordance with accepted academic practice. No use, distribution or reproduction is permitted which does not comply with these terms.
*Correspondence: Jennifer Gilbert, amVubmlmZXIuZ2lsYmVydEBma2VtMS5sdS5zZQ==; Leif Bülow, bGVpZi5idWxvd0BraWx1Lmx1LnNl