
95% of researchers rate our articles as excellent or good
Learn more about the work of our research integrity team to safeguard the quality of each article we publish.
Find out more
ORIGINAL RESEARCH article
Front. Soft Matter , 10 November 2022
Sec. Colloids and Emulsions
Volume 2 - 2022 | https://doi.org/10.3389/frsfm.2022.1035377
This article is part of the Research Topic Liquid foams and emulsions stabilized by bio-based particles View all 6 articles
 Kevin Gräff1
 Sebastian Stock1Luca Mirau1Sabine Bürger1Larissa Braun1Annika Völp2Norbert Willenbacher2
 Regine von Klitzing1*
Foam film’s properties have a high impact on the properties of the macroscopic foams. This work focusses on protein stabilized foam films. The direct comparison of three different proteins with a concentration normalized to the protein surface enables to distinguish between electrostatic, steric and network stabilization effects. In order to untangle those effects, we study and compare two globular proteins (β − lactoglobulin, BLG, and bovine serum albumin, BSA) and a disordered, flexible protein (whole casein, CN) at low ionic strengths with varying solution pH. Image intensity measurement as a recently developed image analysis method in this field allows to record spatially resolved disjoining pressure isotherms in a Thin Film Pressure Balance (TFPB). This reveals insights into the structure formation in inhomogeneous protein films. As a novel method we introduce tracking inhomogeneities (features) which enables the measurement of interfacial mobility and stiffness of foam films. Around the isoelectric point (IEP), Newton Black Films (NBF) form which are stable for the globular proteins while they are unstable for the disordered flexible one. This difference in film stability is explained by different characteristics of the network structures which is supported by findings in the bulk and at the surface of the respective protein solutions.
Foams are ubiquitous in our daily life in many forms and for many purposes. For certain applications, stable foams are desired: in hygiene products such as shampoos, foams create a good haptic, in Haute Cuisine foams like Mousse au Chocolate transport the taste or for firefighters to extinguish e.g. oil pool fires [Kang et al. (2019); Dahlbom et al. (2022); Wood, Ramboll, and COWI (2020)]. In contrast, unstable foams are required in industrial applications as e.g. in bottling plants or in chemical reactor chambers [Deshpande and Barigou (1999)]. The foam building blocks are the foam films: They separate the air bubbles from each other and belong to the framework of the foam besides Plateau borders and nodes [Schulze-Zachau and Braunschweig (2017)]. Understanding stabilization effects in single free-standing foam films is crucial to understand the stabilization of foams on a larger length scale. Due to their numerous applications in everyday life, using non-toxic and bio-degradable [Wood, Ramboll, and COWI (2020)] stabilizers that are sustainable becomes more and more important. Foam films in solutions with low molecular weight surfactants for example appear in two different states: Common black films (CBF) and Newton black films (NBF). CBFs are stabilized mainly by electrostatic repulsion, while NBFs are stabilized by steric interaction. Usually, a transition from a CBF to a NBF occurs, when the electrostatic forces are reduced by e.g., changing the salt concentration or the pH value. The CBF expels the water between the interfaces until no more free water (that is not bound to the proteins at the interface) is present and the NBF state is reached [Exerowa et al. (2018)].
Proteins display one important stabilizer category for foam films. They are found in nature as well as in industry and lab applications [Cascao Pereira et al. (2003); Maldonado-Valderrama and Langevin (2008); Rullier et al. (2010); Engelhardt et al. (2013); Gochev et al. (2014)]. For future applications proteins may replace harmful surfactants due to their similar surface activity. Proteins occur in various forms and sizes in nature. Some are known for network formation like e.g., BLG (Engelhardt 2013a), while others tend to agglomerate in micelles like casein (CN). For the food industry foams made from whole CN foams are of great interest [Maldonado-Valderrama and Langevin (2008)], as well as β − Lactoglobulin (BLG) stabilized foams. In addition, we compare the results with Bovine Serum Albumin (BSA). BSA is the most abundant protein in bovine blood serum and therefore often used as standard protein in lab use [Majorek et al. (2012)]. It is a globular protein, it is 583 amino acids long and has a molecular weight of around 66 kDa [Majorek et al. (2012)].
BLG is a globular whey protein and used as a model globular protein in interface and colloidal science Gochev et al. (2019); Wierenga and Gruppen (2010); Tcholakova et al. (2006). BLG forms stable foam films that are able to stabilize macroscopic foams [Engelhardt et al. (2013)]. Depending on the pH, BLG forms monomers, dimers, octamers or aggregates [Cheison et al. (2011); Gottschalk et al. (2003)] leading to different appearances of thin foam films and therefor varying macroscopic foam properties [Engelhardt et al. (2013)]. It consists of 162 amino acids and has a molecular weight of 18.3 kDa [Fiocchi et al. (2022)].
Whole CN makes about 80% of milk proteins [Maldonado-Valderrama and Langevin (2008)] and is a mixture of αS1 −, αS2 −, β- and κ-Casein [Huppertz (2013); Mezodour et al. (2006); Silva and Malcata (2005)]. The molecular weight of whole CN varies between 19 and 25 kDa [Maldonado-Valderrama and Langevin (2008)]. In contrast to BLG and BSA, CN is a disordered and flexible protein and it is distinguished from the compact and highly ordered globular proteins [Dickinson (1998)]. In milk for example casein strongly aggregates into polydisperse micelles (diameter
Engelhardt et al. (2013) for example studied pH-dependent rheological properties of macroscopic BLG foams. They found thick and disordered adsorption layers for a pH value around the isoelectric point (IEP) that resulted in highest foam stability and yield stress. Also a blocking of the Plateau borders increased the foam stability [Braun et al. (2020)].
Foam films stabilized by proteins often are very complex in their appearance. Earlier studies struggled with investigations of inhomogeneous structures [Fauser and von Klitzing (2014); Yampolskaya and Platikanov (2006); Cascao Pereira et al. (2003)] since it was not possible to measure the single structures spatially resolved. Gochev et al. (2014) investigated the effect of pH and buffer concentration in BLG solutions on the properties and stability in foam films. However, for better insights into protein stabilized foam films, a pH range and the influence of ionic strength should be investigated. Often protein foam films show a very inhomogeneous appearance (called “Pizza films”, [Rullier et al. (2010)], and a classical measurement (without the possibility to choose positions of intensity measurements in post processing) is difficult or even impossible.
Since proteins differ very much in shape, size, hydrophilic/hydrophobic balance or charge, the question rises if unifying concepts can be found and described. Therefore, in the present study we compare the three different proteins mentioned above: BLG, BSA, and CN under the same conditions: pH and ionic strength with the same method to get a deeper insight into the interactions across foam films and to disentangle the underlying effects. It is mandatory to get access to inhomogeneous foam films. Therefore, we take advantage of a CCD camera system on a Thin Film Pressure Balance (TFPB) to guarantee images with a high spatial resolution and low noise. These images enable trustworthy intensity and spatially resolved intensity measurements, which are crucial for the thickness determination of foam films in the TFPB [Scheludko (1967); Chatzigiannakis et al. (2020)]. By using this technique, we can generate multiple disjoining pressure isotherms of a single foam film at different positions simultaneously. This technique gives insights into the behavior under compression of distinct foam film areas (such as agglomerates and networks). Furthermore, this method allows to investigate even inhomogeneous films and tracks lateral movements of regions on interest on the inhomogeneous foam film. It is possible to investigate thicker common black film (CBF) areas (stabilized by electrostatic repulsion) separated from thinner Newton black film (NBF) areas (stabilized by steric repulsion) simultaneously and thus opens to understand the network formation of proteins under confinement.
This work focuses on the influence of protein networks on the maximum pressure before film rupture. Offer these networks a framework for describing the foam film stabilization for various proteins? Light will be shed on the influence of the ionic strength compared to the influence of the pH.
BLG was isolated as described elsewhere [Toro-Sierra et al. (2013)] and kindly provided by the group of Ulrich Kulozik (Technische Universität München, Germany). BLG was used as received. BSA was bought from Santa Cruz Biotechnology, Inc. (Dallas, Texas, United States ) and used as received. Whole CN was bought from EMD Chemicals, Inc. (San Diego, California, United States ). All samples were prepared with ultrapure water from a Milli-Q purification system (Merck KGaA, Darmstadt, Germany) with a resistivity of ρ = 18.2 MΩcm. CN was dissolved using an adapted method from Mezodour et al. (2006). 1 g of CN was added to 200 ml of ultrapure water and treated by ultrasonication for 30 min at room temperature. Then the liquid was placed in a centrifuge at 2000×g for 30 min. The transparent supernatant was extracted with a pipette. The concentration was increased by evaporating the water at 50°C and 70 mbar for 40 min. The temperature has no effect on denaturation of CN [Sabarwal and Ganguli (1972); Joyce et al. (2017)]. After this process the concentration was determined by extracting a defined volume from the solution and drying it. The weight difference before and after drying gives the concentration of the stock solution. All sample concentrations for foam film measurements are normalized to the identical monomer surface for comparability to ensure an equal surface coverage irrespective from the different protein sizes. The pH values were adjusted by the addition of HCl or NaOH, respectively.
All glassware except the film holders were cleaned with Q9 cleaning solution (Bernd Kraft, Duisburg, Germany) over night and rinsed thoroughly with ultrapure water before use. The self-made film holders were rinsed 10 times with ethanol and afterwards boiled several times in ultrapure water.
The ζ-potential was measured using a Zetasizer Nano ZS (Malvern Instruments Ltd. Malvern, United Kingdom). The cuvettes were cleaned using ethanol and rinsed thoroughly with ultrapure water afterwards. The given values are the average of at least 5 to 10 measurements.
Hydrodynamic radii were measured using a multi angle dynamic light scattering setup (DLS) (LS Instruments, Fribourg, Switzerland). For BLG pH-series the concentration used in the DLS was 10 g/L (this comparable high concentration was chosen to guarantee an acceptable count rate for the BLG sample), for BSA 3.52 × 10⁻⁶ M and for CN 1.17 × 10⁻⁵ M respectively.
The static surface tension was measured with a K11 Tensiometer from Krüss (Krüss GmbH, Hamburg, Germany), using the du Noüy ring method using the correction function by Huh and Mason (1975). Temperature was kept constant at 25°C. Prior to the use in the tensiometer, the same samples were used in the TFPB. After filling the sample in the tensiometer, the ring was pulled multiple times through the surface which takes several hours in total (minimum 3 h), until the value for the surface tension of each individual sub-measurement does not change any more.
Dynamic surface tension was measured by the pendant drop method using a drop shape analyzer OCA 20 (DataPhysics instruments GmbH, Filderstadt, Germany). The drop volume was 7 μL of freshly prepared samples.
Disjoining pressure isotherms are measured using a self made TFPB. The basis of this device is the porous-plate technique described first by Mysels and Jones (1966) and later improved by Exerowa et al. (1987). A porous glass disk (pore size 10–16 μm, porosity P16 (ISO 4793)) with a countersunk hole (diameter = 1 mm) is connected to a glass capillary tube and located in a stainless-steel pressure chamber. The film holder is submerged in the solution for at least 2 h before a measurement. After rising the film holder out of the sample solution, the film was equilibrated for 30 min.
All measurements were performed at 22°C.
The disjoining pressure Π can be calculated using Eq. 1:
Pg is the pressure applied to the pressure chamber, Pr is the ambient reference pressure, γ is the surface tension of the sample solution, r is the radius of the glass capillary tube, Δρ is the density difference between solution and air, g is the gravitational constant and hc is the height of the liquid inside the glass capillary tube above the level of the foam film. To determine the thickness h of the foam films an interferometric method developed by (Scheludko, 1967) is used. The free-standing foam film is examined using a reflective light microscope. The incoming light is reflected at the upper and the lower film interface and due to interference, a certain brightness results.
Here n is the refractive index of the sample (n = 1.33 for water since a deviating refractive index for a thin protein layer can be neglected [Cascao Pereira et al. (2003)] and λ is the wavelength of the used interference filter (λ = 550 nm). Δ is given by:
where I is the actual measured intensity, Imin is the minimum intensity (offset intensity) measured with no film in the film holder, and Imax is the maximum film intensity measured during film formation. R is given by:
Two methods of intensity measurements for thin films of thicknesses below 100 nm are used: a photomultiplier (with a filter for λ = 550 nm) with a measurement area of around 25 μm2 useful for homogeneous foam films and a camera-based intensity measurement as suggested by Yilixiati et al. (2018) for spatial resolution especially useful for inhomogeneous foam films. The camera is a color CCD camera (JAI Go-2400-USB, pixel size: 5.86 μm × 5.86 μm, Stemmer Imaging, Puchheim, Germany) having a resolution of 0.93 μm/px regarding all optical pathways (reflected light microscope with a × 10 far distance objective, focal reducer, extension tube). The camera is intensity calibrated for each color band individually by a linear regression model to match the intensity values from the photomultiplier attached to the TFPB in parallel. All image series were performed with a fixed-position sample holder, to prevent sample displacement during measurements. For all evaluations with the camera, only the “red” band was used in this work. Reflected light intensity and pressure were logged for all experiments. For region of interest (ROI) measurements the thickness h was calculated for each pixel individually and the average over all pixels in the ROI was taken at the end. Images at specific time steps were stored accordingly so the corresponding pressure can be assigned.
For protein pH-series in the TFPB, the following concentrations were used: c = 10 μM for BLG, c = 3.52 μM for BSA and c = 11.68 μM for CN. The concentrations refer to single proteins and were chosen to achieve the same internal surface for all proteins, respectively. The calculations are based on the hydrodynamic radii of the single proteins [BLG rH = 4 nm (Gottschalk et al. (2003)], BSA rH = 6.8 nm [Zhang et al. (2015)] and CN rH = 3.7 nm [Huppertz (2013)] and assume a globular shape of the proteins.
Since the proteins are weak polyelectrolytes, the pH affects the net charge and the configuration (monomers, dimers, octamers or aggregates) or denaturation of proteins. Thus, it is crucial to compare the pH-induced change of the ζ-potential with effects of the proteins adsorbed at the interface, such as the surface tension. When kept in mild pH ranges (between pH 2 and pH 9) the proteins are present in their inherent folded structure, while for a more extreme pH, denaturation can change the proteins secondary and tertiary structure [Chi et al. (2003)]. Therefore, this work only considers mild pH to prevent denaturation. Figure 1 shows the ζ-potential of the three investigated proteins BLG, BSA and CN as function of the solution pH.
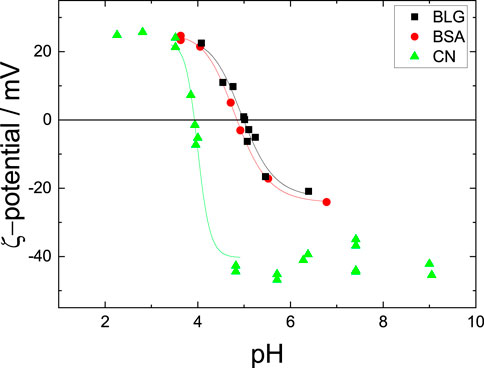
FIGURE 1. ζ-potentials for all three investigated protein solutions over the present pH strength. IEPs are 5.05 for BLG, 4.90 for BSA and 3.90 for CN, respectively. The concentrations are c = 10 μM for BLG, c = 10 μM for BSA and c = 10 μM for CN. The lines guide the eye.
The ζ-potential measurements show a point of zero charge. This point of zero charge is denoted as the isoelectric point (IEP), where the net charge of the proteins is zero. The IEP for BLG is at pH = 5.05, for BSA at pH = 4.90 and for CN at pH = 3.90. Lower or higher pH results in an absolute increase of the ζ-potential for all samples, where the ζ-potentials for BSA and BLG reach ζ ≈ 25 mV. The ζ-potential of CN reaches ζ = 25 mV for pH
At the IEP the proteins carry no net charges which results in a reduction of the solubility and thus in aggregation [Fennema (1996); Engelhardt et al. (2013)]. Further away from the IEP, the absolute net charges increase and strong repulsive intermolecular forces prevent protein aggregation.
The hydrodynamic radius rH was measured as function of the pH for all three proteins. Figure 2 shows a maximum of rH for BLG. Far away from the IEP, rH is strongly reduced. This behavior is well known in literature [Gottschalk et al. (2003)]. The reason is a change in conformation of BLG: For low and high pH the protein is in a monomeric state with rH = 4 nm. By increasing pH, dimers with rH = 8 nm form. Around the IEP octamers [Gottschalk et al. (2003)], large aggregates and flocculation occur, causing turbidity in the solution. Further increase in pH promotes the formation of dimers and monomers. CN forms micelles in the range of 20–250 nm in diameter as described by Kudo et al. (1979) and Morris et al. (2000) for the whole pH range. Here their radius rH is around 80 nm irrespective of the pH. A decrease can be noticed towards neutral solution pH from around 80 nm–44 nm. BSA shows a rH around 6 nm and no significant changes appear regarding the change of solution pH.

FIGURE 2. Hydrodynamic radii for the three investigated proteins BLG, BSA and CN as function of the pH, measured with DLS. The concentrations are c = 10 g/L for BLG, c = 3.52 μM for BSA and c = 11.68 μM for CN.
Figure 3 shows the steady state surface tension γ measured with the du Noüy ring method of the three investigated proteins for varying pH values. Samples were characterized after a whole TFPB cycle. The surface tension is reduced from the value of pure water (γ = 72.5 mN/m) for all investigated proteins at all solution pH and shows a non-monotonous behavior. This effect is pronounced differently for the investigated proteins. BSA shows the smallest, BLG an intermediate and CN the most expressed overall surface tension reduction. Around the isoelectric point (IEP) denoted by arrows in the graphic, γ shows a minimum. At the IEP the proteins are more prone to attach to the surface due to lower solubility [Engelhardt et al. (2013); Richert et al. (2018)]. BLG, BSA, and CN have a minimum surface tension of γmin, BLG = 52.4 mN/m, γmin, BSA = 56.2 mN/m and γmin, CN = 49.5 mN/m, respectively. Since the slopes before and after the IEP are the steepest for BSA, it is the most sensitive protein for varying pH studied here.
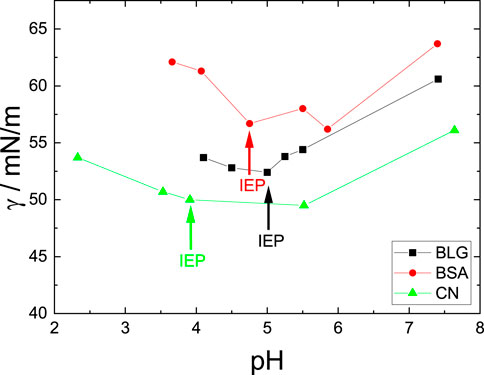
FIGURE 3. Surface tension for BLG, BSA and CN with varying pH values. Colored arrows mark the IEPs for each protein solution. The concentrations are c = 10 μM for BLG, c = 3.52 μM for BSA and c = 11.68 μM for CN. Error bars are smaller than the symbols.
Figure 4 sows the surface tension γ over the age of the interface of the protein solution drop. After 30 min, the steady-state value is approximately achieved, suggesting a saturation at the interface. Around the IEP, the respective adsorption dynamics are the fastest which was also observed for BSA by Richert et al. (2018), while the resulting static surface tensions are the lowest. Accordingly, BLG shows the slowest adsorption kinetics for samples around the IEP, since the decreasing of the values appears over a longer time period compared to BSA and CN. At the end of the measurement at t = 1,200 s there are still some minor changes observable. The slowest kinetics for samples far off the IEP shows BSA, especially for pH = 3.63 and pH = 7.34.
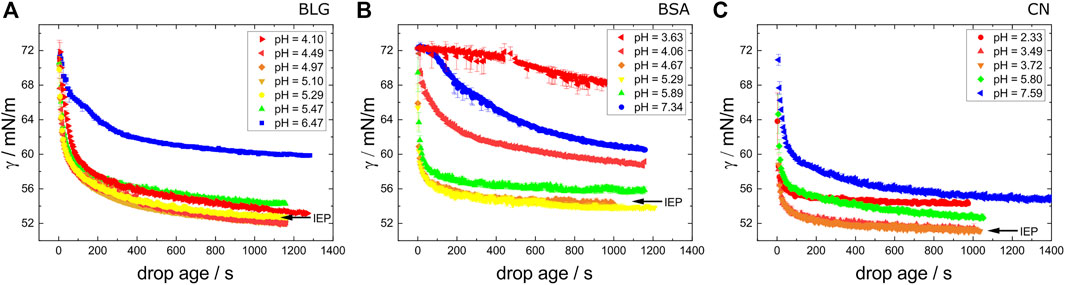
FIGURE 4. Kinetics of the surface tension of fresh prepared (A) BLG, (B) BSA and (C) CN with varying pH values measured as function of time. The concentrations are c = 10 μM for BLG, c = 3.52 μM for BSA and c = 11.68 μM for CN. The black arrows mark the curves for the IEP.
When compared, the values in Figure 3 (samples after a whole TFPB cycle, measured with the Du Noüy ring method), Supplementary Figure S1 (exemplarily for freshly mixed BLG samples measured with the Du Noüy ring method) and Figure 4 (fresh samples, measured with pendant drop method) match, proving that impurities do not play a role at all for the measurements.
This section presents the measured disjoining pressure isotherms for the investigated proteins as function of the pH around the individual IEP value using the photomultiplier method sensing only on one small area of around 25 μm2.
The measured isotherms can be divided into two regimes: A CBF regime, where the disjoining pressure isotherms show an exponential behavior (for high film thicknesses) and the foam films are stabilized electrostatically [Kristen and von Klitzing (2010); von Klitzing et al. (1999)], and a NBF regime with nearly vertical isotherm, where the films are stabilized by steric repulsion.
Figure 5A shows disjoining pressure isotherms of aqueous BLG solutions with c = 10 μM at varying pH from pH = 4.10 to pH = 7.40. For high (pH = 7.40) and low (pH = 4.10) pH, the disjoining pressure isotherms show an exponential decay with increasing foam film thickness h in the higher film thickness regime. The average film thickness is significantly larger for these pH values than for the intermediate pH values (pH = 4.50 to pH 5.50). The maximum pressure before foam film rupture Πmax reaches up to around Π = 1,000 Pa. The transition from CBF to NBF is characterized in the isotherms by a change from an exponential decay, to a constant thickness at minimum limit of 15 nm for increasing Π. The NBFs close to the IEP exceed the stability tenfold, reaching Π = 10,000 Pa and are comparable to the findings of Gochev et al. (2014).
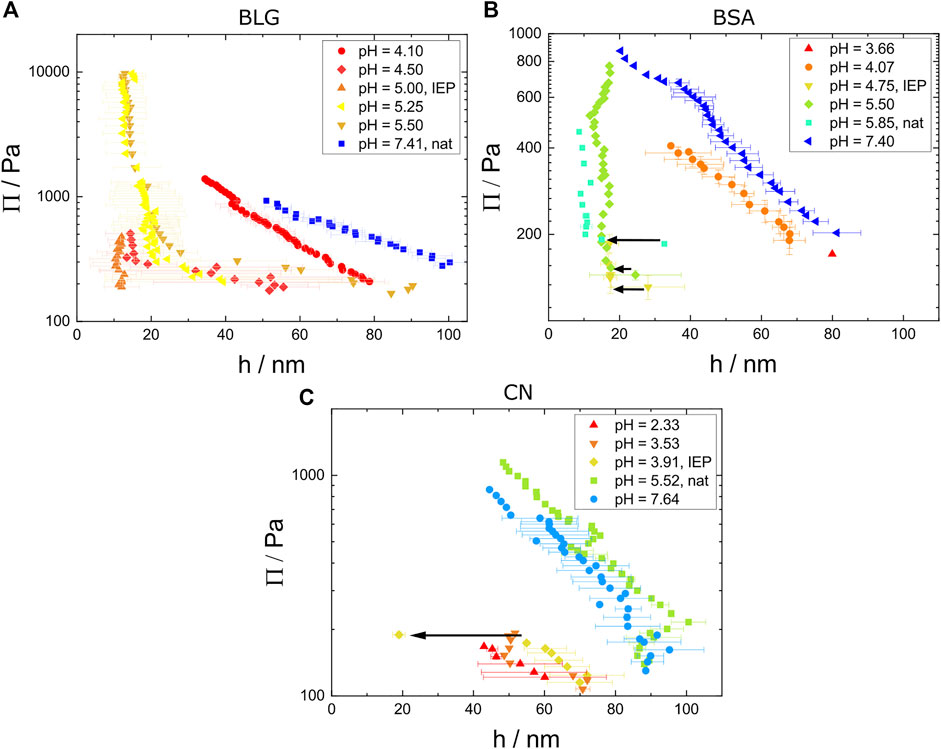
FIGURE 5. Disjoining pressure isotherms measured at homogeneous areas in the foam films with the photomultiplier method for (A) BLG solutions with c =10 μM at varying pH from pH = 4.10 to pH=7.41, (B) BSA solutions with c =3.52 μM at varying pH from pH =3.66 to pH =7.40, (C) CN solutions with c =11.68 μM at varying pH from pH =2.33 to pH =7.64. The single point at pH = 3.91 with the thickness of around 20 nm was measured using the CCD intensity method. The black arrows indicate CBF to NBF transitions for (B) and (C).
Figure 5B shows disjoining pressure isotherms of aqueous BSA solutions with c = 3.52 μM at varying pH values from pH = 3.66 to pH = 7.40. For the highest pH (7.40) and the lowest pH (4.07) pH values the disjoining pressure isotherms show an exponential behavior, while for the intermediate pH values a constant thickness h is reached. At the natural pH = 5.85 a thickness step from 32 nm to 14 nm can be seen as indicated by the black arrow. For solution pH = 5.05 and pH = 4.75 a CBF to NBF transition is visible and exemplarily visualized by the images in Figure 8 II and III. In comparison to BLG the onset of the constant foam film thickness is reached at earlier pressure steps and there is only one point with a brighter and therefor thicker foam film before the thickness step. The thicknesses of BSA foam films and BLG foam films are similar for high pressures (between 10 and 20 nm).
Figure 5C shows disjoining pressure isotherms for aqueous CN solutions with c = 11.68 μM for varying pH values from pH = 2.33 to pH = 7.64. A measurable NBF forms only at pH = 3.91 at the IEP and for pH = 3.53. The film ruptures shortly after the CBF to NBF transition (minutes after the transition for pH = 3.91 and seconds after the transition for pH = 3.53). So, the foam films form unstable NBFs around the IEP and stable CBFs further away from the IEP.
Figure 6 shows the maximum disjoining pressure before film rupture Πmax as a function of the solution pH for BLG, BSA and CN.
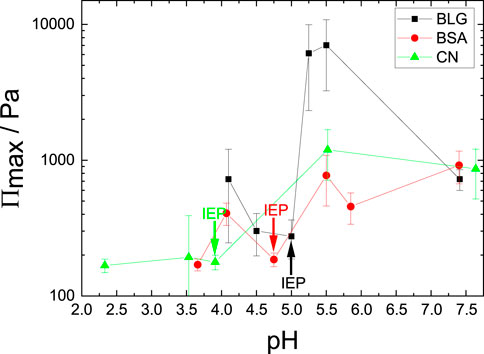
FIGURE 6. Maximum disjoining pressure Πmax in dependence of pH for BSA, BLG and CN. The concentrations are c = 10 μM for BLG, c = 3.52 μM for BSA and c = 11.68 μM for CN. The arrows indicate the corresponding IEPs.
BLG shows stable foam films over the whole investigated pH range and a clear dependency of the pH. A maximum in foam Πmax is reached slightly above the IEP (Πmax = 7000 Pa). Πmax of BSA and CN vary and increase slightly with increasing pH.
The onset of the transition from CBF to NBF depends of the pH for all the investigated proteins. Figure 7A shows the transition pressure Πtrans as function of the pH:
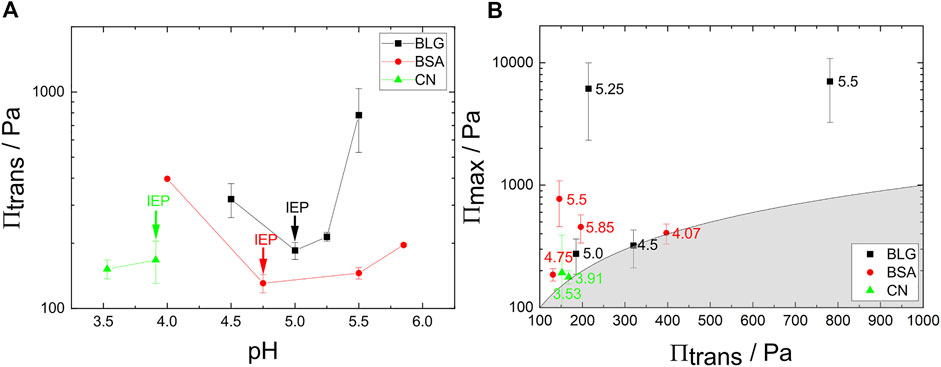
FIGURE 7. (A) Transition pressure Πtrans against the pH for BLG, BSA and CN. The arrows indicate the respective IEPs. (B) Πmax plotted against Πtrans. The number values represent the respective pH. For (A) and (B) the concentrations are c = 10 μM for BLG, c = 3.52 μM for BSA and c = 11.68 μM for CN.
BSA and BLG show a qualitatively similar behavior regarding the onset pressure for NBF formation Πtrans over the pH: Πtrans of both foam films exhibit a minimum at their respective IEP. Πtrans is lowest around the IEP. Around the IEP the NBFs form at low pressures right at the initial foam film formation.
For CN the NBFs formed only at two investigated pH, which are close to the IEP. Soon after formation of NBFs they ruptured which is visualized in Figure 7B, which shows Πmax as a function of Πtrans. The border between the shaded and unshaded area divides the graph into two areas. The shading represents the physically prohibited area where the transition pressure Πtrans would be higher than the maximum Πmax. Therefore, this separation is given by Πmax (Πtrans) = Πtrans. Points lying exactly at the border of the curve indicate unstable NBFs which rupture while or shortly after the transition process. The larger the distance to the shaded area, the more stable the NBFs. BLG for example shows very stable NBFs independent from their transition pressure.
Foam films stabilized by proteins are often very inhomogeneous. Figure 8 shows images of foam films stabilized by BLG (I), BSA (II–III) and CN (IV–V) from film formation over intermediate pressures until the last pressure step before film rupture.
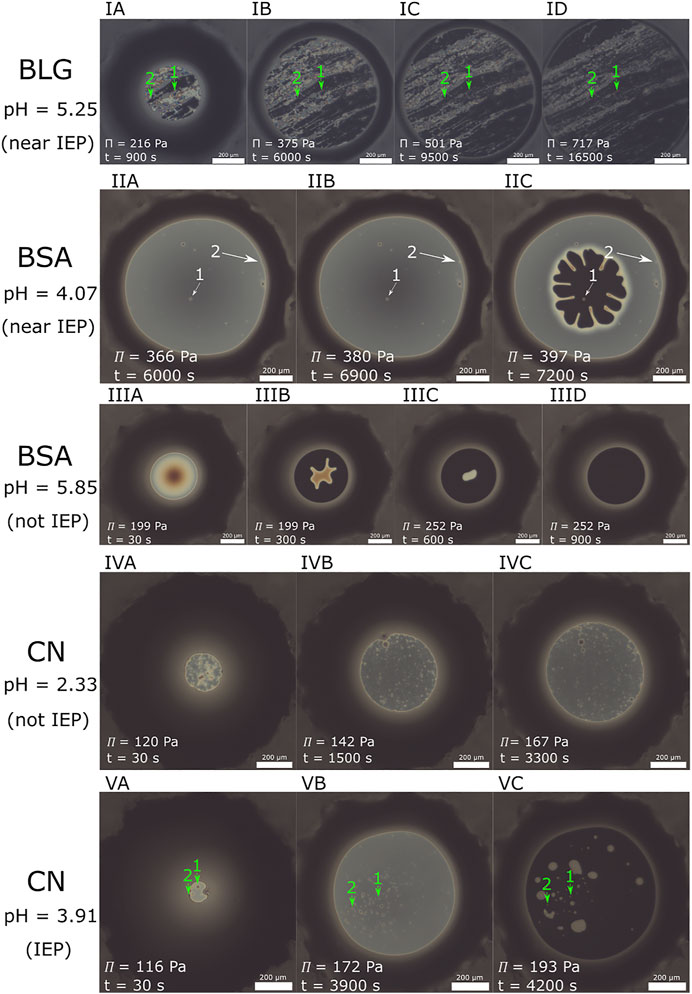
FIGURE 8. (IA–ID) Formation of a BLG stabilized foam film [c =10 μM, pH =5.25 (near IEP)]. NBFs are forming early in the foam films life cycle at low pressure, but they are interspersed by bright networks. The networks are immobile and long lively. Image (ID) was at the highest pressure before film rupture. The green arrows indicate the positions for feature 1 and feature 2 used for displacement measurements. (IIA–IIC): Transition of a CBF to a NBF of a foam film stabilized by BSA (c =3.52 μM, pH =4.07). Arrows mark aggregates which are either built into the CBF [image (IIA, IIB)] or into the NBF [image (IIB, IIC)]. (IIIA–IIID): Transition of a CBF to a NBF of a BSA stabilized foam film (c =3.52 μM, pristine pH =5.85). The CBF to NBF transition starts at the films outer rims leaving a dimple in the film center. The dimple was able to flatten out within 15 min suggesting remaining flow channels in the freshly formed NBF. (IVA–IVC): Foam film life cycle of a CN stabilized film (c =11.68 μM, pH = 2.33). Note that this film ruptured without former NBF formation. (VA–VC): Foam film life cycle for a CN stabilized foam film [c =11.68 μM, pH = 3.91 (IEP)]. Green arrows indicate feature 1 and 2 for displacement measurements. The film ruptured immediately after NBF formation. The white scale bares are 200 μm for all images.
Figures 8IIA–IIC shows the dynamics of the transition from a CBF to a NBF of BSA (c = 3.52 μM at pH = 4.07). Shortly after the transition, the film ruptured at a total age of 125 min. Note the aggregates which were also observed by e.g., Richert et al. (2018) marked by white arrows. Arrow 2 marks an aggregate, which is built into the CBF at the film’s borderline. It is invisible at the very thick part of the films surrounding thick film and becomes visible, when the thin film evolves around it. The fringes and their higher intensity show, that the diameter of the aggregates is several times larger than the films thickness. Arrow 1 marks an aggregate, which is built into the evolving NBF in image IIC. Figures 8(IIIA–IIID) shows the transition of a CBF to a NBF for BSA with c = 3.52 μM and pristine pH = 5.85. The NBF forms after 5 min entrapping the dimple which was present from the beginning. Poorly elastic interfaces lead to asymmetric dimple drainage [Rullier et al. (2010)] which results in a dimple moving quickly towards the periphery of the foam film. In contrast, highly elastic interfaces result in symmetric drainage and the dimple stays in the film center for a long time draining slowly. Since the present dimple was able to flatten out within 15 min in a symmetrical way, we assume an elastic gel-like network in the foam film. The NBF is stable for several pressure steps (up to Π = 507 Pa) until a film age of 62 min.
Previous studies investigated foam film inhomogeneities only insufficiently [Rullier et al. (2010)]. Employing CCD imagery enables investigating the mobility of the foam film structures over time and sheds light into foam film surface elasticity and especially networks. To investigate the foam films structure mobility, feature tracking is used. Specific features such as aggregates or filaments in the foam film marks good contrast and were selected on the images as probes. The pixel positions for each selected feature at each pressure step are stored. The displacement from the position at a specific disjoining pressure Π (x(Π), y(Π)) regarding the origin position (x (Π = 0), y (Π = 0)) is then calculated as follows:
Figures 8(IA–ID) exemplarily show the formation of immobile network structures that have a long lifetime in a BLG foam film at pH = 5.25 (near IEP). Similar structures can also be seen for other measurements at this pH and also for the pH values 4.50, 5.00 and 5.50 and were also observed by Gochev et al. (2020). The green arrows indicate the features for the displacement measurements. Position and lateral size of the network structure remain constant over time and pressure. Only “new” structures are forming at the film borders, where the transition of a thick film to a thin film happens. These observations indicate that the structures probably have already been formed in the liquid bulk. Using the presented processing method results in displacement curves, shown in Figure 9.
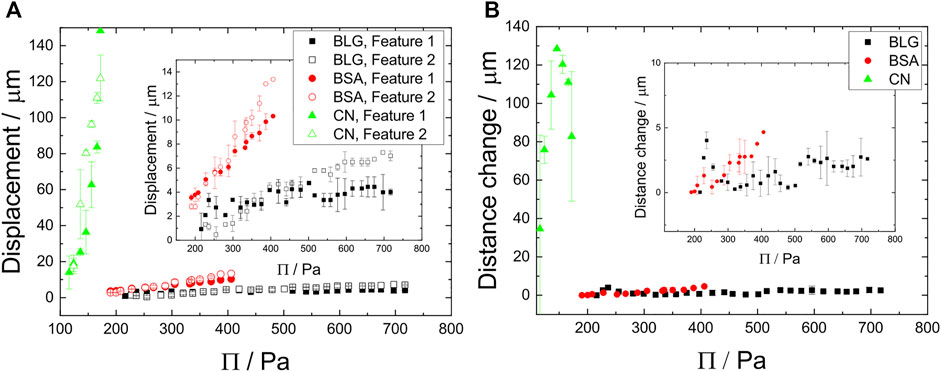
FIGURE 9. (A) Displacement D as function of the disjoining pressure Π for BLG (c =10 μM, pH =5.25), BSA (c =3.52 μM, pH =4.07) and CN (c =11.68 μM, pH =3.91). Closed symbols represent features appearing in the middle of the foam film, while open symbols show the behavior of features far off the film center. The inset focusses on the small displacements of BLG and BSA. (B) Distance changes between feature 1 and 2 for all three investigated proteins respectively as function of Π. The inset highlights the slopes of the BSA and BLG measurements.
Figure 9A shows the displacement curves stemming from feature 1 and feature 2 in Figure 8 I, V and Supplementary Figure S2 for all investigated proteins. CN shows a higher slope (m = 2.07 ± 0.31 μm/Pa) than both BSA (m = 0.04 ± 0.001 μm/Pa) and BLG (m = 0.00879 ± 0.000712 μm/Pa) with the maximum displacement of 148 μm, indicating a highly mobile foam film structure compared to the immobile foam film structures of BSA and BLG. BSA has a maximum displacement of around 13 μm and BLG of around 7 μm. There is no big difference whether the tracked feature is located in the film center (feature 1, green arrow marked with “1”) or off the center (feature 2, green arrow marked with “2”) in displacement.
An indication for foam film interface stiffness is given by the feature distance change shown in Figure 9B. Here the distance change between feature 1 and feature 2 is plotted for increasing Π. CN shows the biggest distance change, compared to BSA and BLG which show negligible changes in distance.
Since the features in the investigated foam films are all colorless, a thickness of below 100 nm is assumed. Therefore, the interference thickness calculation is applied to CCD images in order to measure the foam film thickness. Here the thickness is resolved spatially which is a clear advantage over the classical photomultiplier method which can only resolve a single spot. The spatially resolved results are shown in Figure 10, where the foam film thicknesses are color encoded.
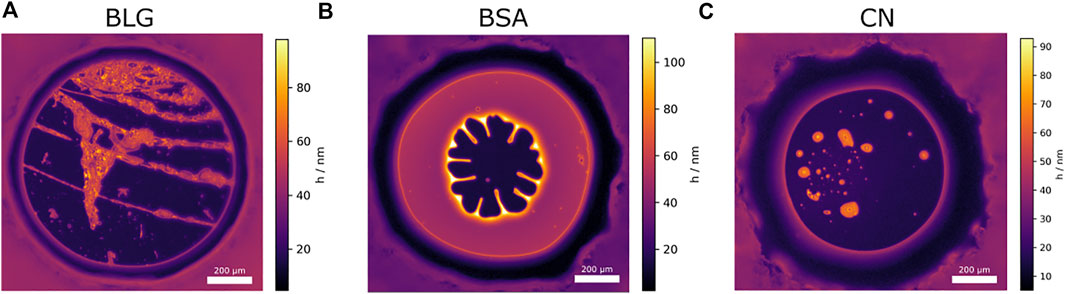
FIGURE 10. False color representation of a NBF formation for each protein. The colors represent the foam film thickness. (A) Foam film of BLG [c =10 μM at pH = 5.00 (IEP)] The disjoining pressure inside the foam film is Π =475 Pa. (B) Foam film of BSA (c =3.52 μM at pH =4.07). The disjoining pressure inside the film is Π =397 Pa as the NBF is formed. Note the increased thickness (up to h =100 nm) around the borders of the NBF where the excess liquid from the NBFs location is now placed. About a minute after NBF formation the film ruptured. (C) Foam film of CN (c =11.68 μM, pH =3.91 (IEP). The disjoining pressure is Π =193 Pa. The film ruptured immediately after NBF transition.
Figure 10A shows a BLG foam film at the IEP. Here clearly network structures are visible that intersperse the whole foam film and surround the NBF areas.
Figure 10B shows the NBF formation for BSA at pH = 4.07 and a thickening at the NBF borders, since the liquid is pressed out of the forming NBF. The thickness reaches up to 100 nm at the points where the inwards pointing CBF “fingers” meet the border of the NBF. The NBF has a thickness of around 10 nm. The CBF with a thickness of around h = 40–50 nm surrounding the NBF remains constant over the whole CBF area. Note that the NBF formed at the area with the lowest film thickness in the center (h = 30 nm, Figure 8IIB) by hole nucleation [Chowdhury and Stauffer (1992)]. Also, the thickening is strictly located at the borders and looks like a dimple formation. Since the outflow is hindered, gel-like network structures seem to increase the film interface elasticity for the investigated BSA foam films. Figure 10C shows a CN NBF where thicker dimple-like areas are entrapped by a NBF. Seconds after the image was taken, the film ruptured.
In order to investigate the thinning processes in foam films in more detail, a spatially resolved film structure analysis is performed. Here, in contrast to the pressure measurements (Figure 5), where only one point per foam film (by photomultiplier or camera method) was considered for thickness determination, several specific positions in a foam film are investigated. Figure 11 shows three different disjoining pressure isotherms from one specific thin foam film (BLG, c = 10 μM, pH = 5.00) at different regions of interest (ROI) with 15 × 20 pixels (14.01 μm × 18.68 μm). Due to the static structure behavior no active ROI tracking was needed and the positions of the selected areas did not change over time. ROI 1 is located close to the films center, where a NBF has formed only seconds after film formation. Here the film has a constant thickness of around h = 10 nm over the whole pressure range. This behavior is typical for NBFs: the free water is pushed out of the film and it is sterically stabilized. The other two ROIs are located on thicker (hence brighter) areas of the film: close to the films center (ROI 2), and one off center (ROI 3). The foam film in ROI 2 has a thickness of around h = 50 nm and in ROI 3 of h = 55 nm. Interestingly, the thicker areas of the film also have a constant thickness unlike usual CBFs do by expelling water towards the film borders. This indicates strong and stiff networks in absence of electrostatic forces.

FIGURE 11. Image (A) shows disjoining pressure isotherms of a single thin foam film stabilized by BLG (c =10 μM, pH = 5.00) measured by the camera intensity method for different ROIs. Image (B) is a true color image of the regarding BLG stabilized foam film with ROIs imprinted as green squares. ROI 1 is a NBF near the center of the film, while ROI 2 is a CBF close to the films center. ROI 3 is a CBF off center.
In Figure 5B there is an exponential thinning behavior for BSA (c = 3.52 μM at pH = 7.40) presumably due to electrostatical stabilization. This happens not homogeneously over the whole film area, some spots differ in the thinning behavior in form of unusual dimple formation. Therefore, we investigate this dimple formation in these particular foam films in more detail. The films life circles are depicted in Figure 12.
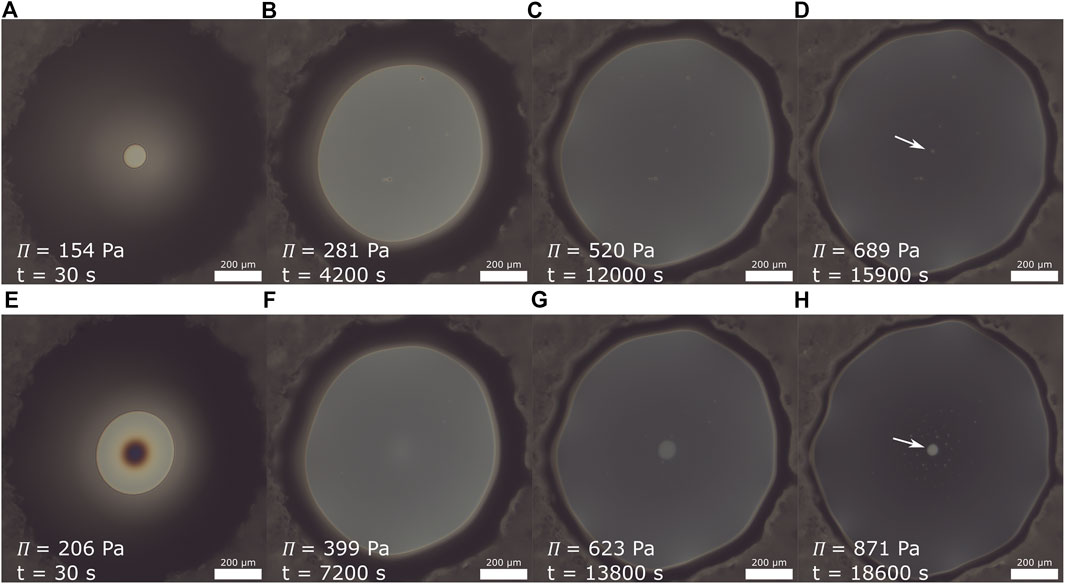
FIGURE 12. Image (A–D) and (E–H) show life circles of two BSA foam film made from the same solution from film formation (A,E) to rupture (shortly after images [D,H] respectively). Note the darkening of the films with increasing pressure and age. White arrows mark brighter spots in the darker film.
To investigate the different thinning behaviors in this specific foam film, two separate areas were observed: The center area with the formation of a brighter spot, and an off-center area appearing homogeneous. The disjoining pressure isotherms for both areas are shown in Figure 13.
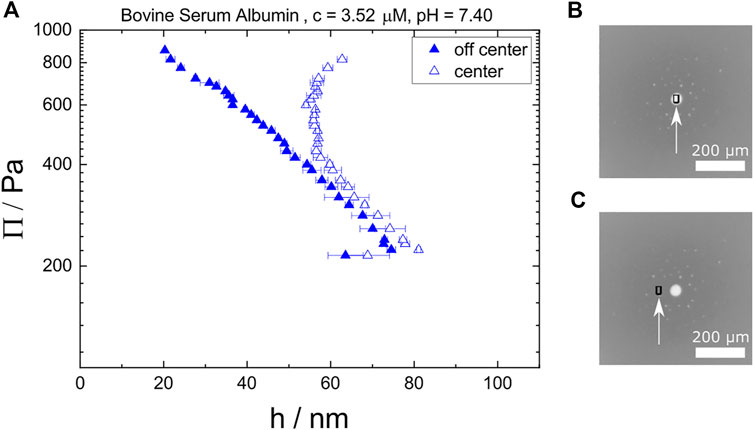
FIGURE 13. (A) Disjoining pressure isotherms of two different areas in a single foam film: one area at the center where a bright spot forms (open symbols), and one off-center at a the homogeneous CBF (closed symbols). Image (B,C) show an example image with increased brightness for better visibility and separated sampling spots (black squares marked by white arrows) for center and off-center, respectively.
The off-center area shows a typical thinning behavior for CBFs. But, the center area shows a constant thickness of around h = 60 nm, once the bright spot forms. For higher Π, the thickness even increases. This increase can be explained by water which is expelled out of the homogeneous CBF part collected in the dimple at the center spot.
As most proteins [Engelhardt et al. (2013); Dickinson (1998)], also the investigated ones are surface active (Figure 3). All proteins possess a positive ζ-potential for low pH and exhibit a charge reversal at their individual IEP towards a negative ζ-potential for increasing pH. However, only for BLG aggregates around the IEP are detected by the rise of the hydrodynamic radius. The reason for the very strong BLG aggregation might be the higher concentration of BLG (10 g/L) compared with BSA (3.52 μM) and CN (11.68 μM). But also for lower concentrations (c = 10 μM), flocculation after some time could be observed. BSA seems not to form aggregates in the bulk at the given concentration since the hydrodynamic radius stays constant. CN forms micelles with calcium phosphate present in whole CN samples [Dickinson (1998); Horne (2006)]. This configuration is unaffected by the pH value in our study.
Reaching the IEP effects the surface activity of all proteins: due to the charge neutrality, the proteins become more hydrophobic and thus surface active. This behavior can be compared to the behavior of polyelectrolyte/surfactant (P/S) mixtures, where around the nominal bulk stoichiometric mixing point (comparable to the IEP) surface active complexes form. The stability of the P/S stabilized foam films is independent of the net charge within the films but highly dependent on the amount of material that is adsorbed to the foam film’s interfaces [Kristen et al. (2009); Braun et al. (2022)]. But at the BSMP they did not observe a NBF formation and the maximum pressure before film rupture of the CBFs was low in contrast to the high stability of the CBFs and especially the NBFs in BLG solutions observed in this study. We find a decelerated adsorption kinetic of BLG compared to BSA which is the result of the increasing size (dimer- and octamer formation) of the BLG near to the IEP.
Far off the IEP all protein stabilized foam films studied here form a CBF and do not show a CBF to NBF transition. In the CBF regime, the foam film thicknesses vary which can be explained by different surface charges due to the adsorbed proteins. Higher surface charge results in thicker foam films due to electrostatic repulsion [Scheludko and Exerowa (1959); Gochev et al. (2014)] between the two film’s interfaces. The electrostatic stabilization is less pronounced the closer the pH value comes to the IEP. Around the IEP, the electrostatic repulsion is reduced and a transition to a NBF occurs for all studied proteins.
We observe NBF thicknesses between 10 and 20 nm (Figure 5). Especially the thicker NBFs indicate a high surface adsorption of proteins which is in line with the surface activity of the investigated proteins (Figure 3). Another indication for the high surface adsorption is the visual appearance of aggregate structures in the TFPB for example highly expressed in BLG foam films (Figure 8I) around the IEP.
The impact of pH and ionic strength on foam films of BLG was investigated by Gochev et al. (2014). They found thinner foam films due to a higher ionic strength (3 M–100 M) than in the present study. Here the ionic strengths for BLG are between I = 1.5 × 10⁻⁵ M and I = 5.66–5 M (Supplementary Table S1) and therefor lower. The change of pH outweighs the effects of changing the ionic strength. The loss in charge at the IEP reduces the electrostatic barrier, that prevents the CBF to NBF transition, and results in the minimum in the transition pressure Πtrans (Figure 7A).
A stepwise CBF to NBF transition could be observed for BSA at solution pH from 4.75 to 5.85 and a transition by a thickness step of about Δh = 35 nm for a whole CN solution with pH = 3.91 (IEP). For pH = 3.53 we could also observe a CBF to NBF transition in the CN stabilized foam film, but the NBF immediately ruptured after the transition. This stepwise transition of whole casein foam films was not seen by Maldonado-Valderrama and Langevin (2008) but suggested by Cascao Pereira et al. (2003) for β-Casein and BSA for varying pH and varying ionic strength [Cascao Pereira et al. (2003)]. There is an obvious discrepancy between the CN micelle diameter and the foam film thickness. The hydrodynamic diameter for CN micelles is around 160 nm while the foam films are thinner than 100 nm. Either the micelles deform highly (reduction of 2/3 in one axis) and/or are expelled from the foam film liquid. The NBFs of CN, which have a thickness of around 19 nm are obviously only stabilized by single casein molecules or by κ-casein submicelles of a diameter of d = 10–15 nm [Kayshev et al. (2019)] since the diameter of the full micelles is too large. The concentration of these sub-micelles is further decreased since the submicelles are usually present within micelles, which are expelled out of the NBF.
The investigated protein stabilized foam films show a multitude of different appearances depending on the stabilization effects acting within the films. Figure 14 gives an overview of all investigated foam films and a sketch of their observed appearance depending on the pH. The regarding IEP positions are marked in red letters in the graphic.
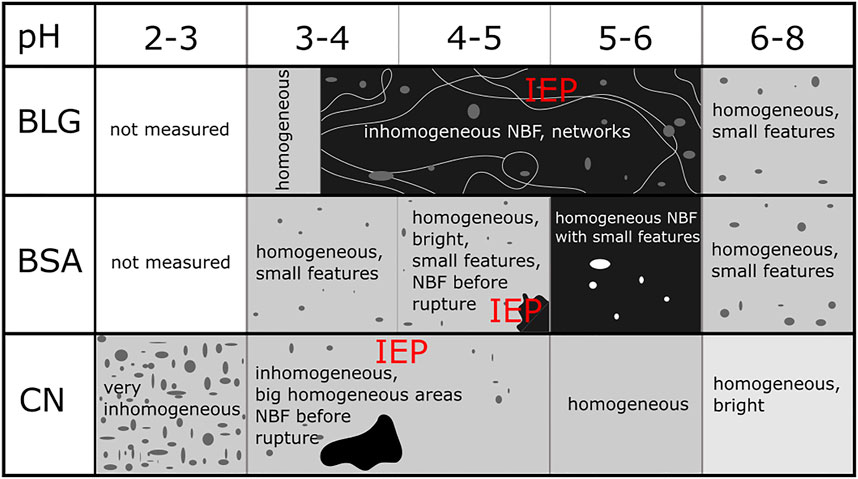
FIGURE 14. Overview of investigated foam films of BLG, BSA and CN and their appearances depending on the pH.
All three investigated proteins form NBFs at a pH around the IEP. BLG shows the broadest NBF pH range and the NBFs are interspersed with well pronounced aggregate structures. BSA shows NBFs with some features, but the features are less expressed than for BLG. A reason for this difference between BLG and BSA could be the different repartition of positive and negative patches in the both proteins. Therefore, there remain still some charged species at the surface of the BSA Seyrek et al. (2003). The remaining charged areas could reduce the aggregation of the BSA. For CN, only unstable NBFs appear around the IEP, that show several small, dimple like structures. Apparently, the foam films change from being electrostatically to sterically stabilized around their protein specific IEPs.
The maximum pressure before rupture Πmax does not correlate with the surface tension solely (Figures 3, 6), so the pure presence of an increased amount of material at the interface is not the only reason for foam film stability but rather competing effects have to be considered. For BLG and BSA the NBFs are very stable (Figure 5A,B, Figure 7B). For CN the CBF to NBF transition happens only in a narrow pH interval and the NBF is not stable (Figure 5C, Figure 7B).
Structure formation could be observed for all three protein stabilized foam films around the IEP. These structures were used as probes for displacement and distance change measurements representing the foam film’s interface elasticity. As indicated by the feature mobility analysis (Figure 9) and the locally selected disjoining pressure isotherms (Figure 11), BLG shows the most immobile structures with a high stiffness. Although the protein monomers radii are very similar, the displacement, and thus the mobility of features in the films made from BLG and BSA differ by a factor of 5. Gochev et al. (2019) found that BLG forms viscoelastic layers at the interface while Rullier et al. (2010) found gel-like networks in the foam films. Engelhardt et al. (2013) found networks around gas bubbles of macroscopic foam at the IEP that increase the foam stability. We assume the feature immobility at the surface to be a result of the formation of networks within the foam films. The networks also seem to stabilize the films against rupture. It might be that this network formation of especially BSA is promoted due to confinement.
BLG shows pH dependent aggregate size in DLS measurements. This is an indication that the network formation for BLG solutions is probably not surface mediated but already present in the bulk liquid. Also, the visually bright network structures are only added at the films periphery when the pressure is increased (Figures 8IA–ID). The excess water is pushed out of the film and so the optical contrast gets big enough to visualize the networks. Engelhardt et al. (2013) found multilayers formed due to reduced net charge around the IEP at the air/water interface. Therefore, the networks in the CBF as well as the multilayering in combination with network structures, reaching into the NBFs act as a stabilizing backbone in BLG stabilized foam films. These networks are stable against mechanical stress (Engelhardt et al. (2013)). Film structure analysis and locally resolved disjoining pressure measurements showed that these structures do not change in position and thickness. The networks within the NBF appear strong and able to additionally stabilize the foam film. These findings match to the high yield stress and storage modulus of macroscopic BLG foam close to the IEP [Engelhardt et al. (2013)].
Dimples formed in BSA foam films (Figure 8III) are able to drain symmetrically (as the dimple stays stable in the film’s center) within a short time (about 900 s), which can be seen as proof for elastic film interfaces. Considerable elasticity of BSA stabilized interfaces characterized in dilatation and shear was reported earlier [Völp and Willenbacher (2021)]. Lu et al. (1999) measured the deformation of adsorbed BSA molecules at the interface versus the adsorbed amount with neutron reflectometry. The resulting BSA layer thickness is 3.2 nm. Assuming this deformation, there is enough space for multilayering due to network formation and enough space for water molecules to be pressed out of the dimple towards the film borders. Lu et al. (1999) also stated that the network in BSA foam films are not rigid, in line with the increased displacement of BSA foam films versus BLG foam films we found. This is also in accordance to higher dilatational and shear elasticity found for BLG stabilized interfaces than for BSA [Lexis and Willenbacher (2014); Völp and Willenbacher (2021)].
Contrary to the work of Cascao Pereira et al. (2003) (where they investigated β-casein in contrast to whole CN in this work) we did not observe a difference in Πmax for BSA and CN. The restructuring of the foam film interfaces seems to happen on different size scales, since whole CN forms large micelles in contrast to pure β-casein. One might speculate that β-casein is one of the main stabilizers in whole CN, and that the same concentrations of whole CN and β-casein results in a lower effective β-casein concentration in our case. Cascao Pereira et al. (2003) explained the higher Πmax of β-casein compared to BSA with the higher deformability and ability of a transition from a trilayer to a bilayer and claimed that this is not possible for BSA. A bilayer adsorption of single β-casein molecules appears around the IEP [Atkinson et al. (1995)], while for whole CN mainly micelles are present Horne (2006), even if the formation/dissociation of CN micelles from/to subunits is a dynamic reversible process [Huppertz (2013)]. Since we observe a thickness step of around Δh = 35 nm at the IEP for whole CN (pH = 3.91), which is much larger than the step of Δh = 8.8 nm described by Cascao Pereira et al. (2003), the presence of adsorbed micelles can be assumed.
The visual interpretation of CN foam films shows that only separated aggregates are present. Surface mobility measurements indicate a reduced network formability, since these films have a highly increased movability/strechability (Figure 9) indicating that the CN micelles and submicelles can be mobile. Despite possible aggregation, CN is known for its poor network formation properties [Martin et al. (2002)]. Due to significant protein aggregation and therefore resulting very inhomogeneous foam films it was not possible for Cascao Pereira et al. (2003) to measure β-Casein disjoining pressure isotherms below the IEP. Due to their low aggregate concentration, DLS is not suitable for investigation. Nevertheless, inhomogeneities in the foam films (Figure 8 (IV and V)) confirm their presence.
The reason for the varying stabilities of NBFs may be the protein’s capability of forming networks and in general we observe that the more stable the foam films are against rupture, the stiffer and more immobile are the networks inside the foam films.
Figure 15 summarizes interpretations for microscale models in foam films stabilized by BLG, BSA and CN. All three proteins have the ability to stabilize CBFs as well as NBFs. Due to different kinds of interactions, the stabilization effects differ widely. In foam films these effects can be visualized as follows:
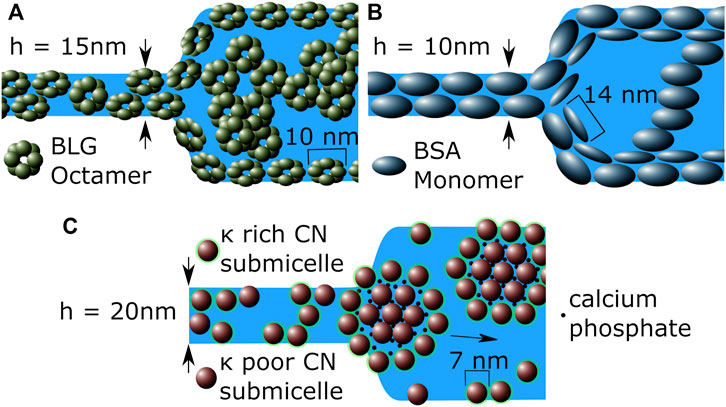
FIGURE 15. Cross-section sketches of the CBF to NBF transition area in a thin foam film stabilized by (A) BLG, (B) BSA and (C) CN around their IEP. Each subfigure shows a NBF on the left hand side, while on the right hand side depicts a CBF. Note that for image (C) only the sub-divisions of micelles consisting of submicelles for CN are shown, since the whole micelles are too large to match within the foam film.
Figure 15A shows BLG stabilized foam films at the IEP, where octamers are present and aggregation can occur. The octamers are deformed at the interface, intersected in the NBF (left hand side of Figure 15A and might even bridge the two film interfaces. In the CBF they form strong and stable networks through the whole film, reducing drainage and interface mobility which increases the whole Πmax in addition to electrostatic stabilization. Figure 15B shows a BSA stabilized foam film. Here the BSA monomers are deformed at the interfaces as well. A monomer double layer is present at the NBF, indicated by the reduced interface mobility.
Figure 15C shows that CN does not form networks but large micelles and subdivisions of micell aggregations. The micelles consist of κ − casein poor submicelles in the center linked by colloidal calcium phosphate surrounded by κ − casein rich submicelles Horne (2006). The NBF may be stabilized only by submicelles, since the micelles and the bigger subdivisions of the micelles themselves are too large to match the dimensions of the NBFs. Since the formation and dissociation of CN micelles is a dynamic and reversible process [Huppertz (2013)], the presence of submicelles in the NBF can be assumed. In the CBF the whole micelles are present and adsorbed at the interface. Since the hydrophobic micelles are self-contained and highly stabilized by the colloidal calcium phosphate, they do not tend to form networks. This results in highly mobile foam film interfaces (Figure 9).
We studied foam films stabilized by β-lactoglobulin (BLG), bovine serum albumin (BSA) and whole casein (CN) and correlated the results to bulk and interfacial properties of the proteins. For all three proteins, foam films TFPB measurements show a CBF to NBF transition around the IEP, but with different NBF stabilities. While the NBFs are stable for BLG and BSA, they nearly immediately rupture for CN. BLG is a globular protein with a high ability for pH dependent aggregation and shows network formation already in the bulk around the IEP. In the foam film, BLG forms macroscopic and very immobile networks resulting in very stable foam films. BSA is a compact protein, but the aggregation behavior is not as highly expressed as for BLG and it forms such networks only upon the confinement of foam films. The BSA networks are also quite immobile but the stabilization ability for these networks might be reduced compared to BLG. CN is a disordered and flexible protein in contrast and does not form networks at all, but it forms micelles in bulk. CN shows a very mobile interface, so the formation of macroscopic networks can be ruled out. This leads to unstable NBFs.
The open question remains if the findings can be generalized to polymer particles. Therefore, further investigations of particles with varied hydrophobic/hydrophilic balance and different charges have to be performed. Networks make an important contribution to the maximum pressure before film rupture. In bigger scales (macroscopic foams) networks are beneficial to prevent foam coarsening and drainage and increase the resistance of the foams against mechanical stresses [Engelhardt et al. (2013)]. Our findings help to tailor environment-friendly protein foams with specific properties.
The raw data supporting the conclusion of this article will be made available by the authors, without undue reservation.
Conceptualization, KG; Data acquisition, KG; Discussion, SS, LB, AV, NW, and RK; Formal analysis, KG; Investigation, KG, LM, and SB; Resources, RK; Visualization, KG; Writing original draft, KG; Writing—review and editing, KG, SS, LB, AV, NW, and RK; Supervision, NW and RK; Funding acquisition, NW and RK; Project administration, NW and RK.
Gefördert durch die Deutsche Forschungsgemeinschaft (DFG)—395854042. Funded by the Deutsche Forschungsgemeinschaft (DFG, German Research Foundation)—395854042.
KG is thankful to Olaf Soltwedel and Amin Rahimzadeh for fruitful discussions and proofreading. Also KG is thankfull for Ulrich Kulozik for providing BLG.
The authors declare that the research was conducted in the absence of any commercial or financial relationships that could be construed as a potential conflict of interest.
All claims expressed in this article are solely those of the authors and do not necessarily represent those of their affiliated organizations, or those of the publisher, the editors and the reviewers. Any product that may be evaluated in this article, or claim that may be made by its manufacturer, is not guaranteed or endorsed by the publisher.
The Supplementary Material for this article can be found online at: https://www.frontiersin.org/articles/10.3389/frsfm.2022.1035377/full#supplementary-material
Atkinson, P. J., Dickinson, E., Horne, D. S., and Richardson, R. M. (1995). Neutron reflectivity of adsorbed β-casein and β-lactoglobulin at the air/water interface. J. Chem. Soc. Faraday Trans. 91, 2847–2854. doi:10.1039/FT9959102847
Braun, L., Kühnhammer, M., and von Klitzing, R. (2020). Stability of aqueous foam films and foams containing polymers: Discrepancies between different length scales. Curr. Opin. Colloid Interface Sci. 50, 101379. doi:10.1016/j.cocis.2020.08.004
Braun, L., Uhlig, M., Löhmann, O., Campbell, R. A., Schneck, E., and Von Klitzing, R. (2022). Insights into extended structures and their driving force: Influence of salt on polyelectrolyte/surfactant mixtures at the air/water interface. ACS Appl. Mat. Interfaces 14, 27347–27359. doi:10.1021/acsami.2c04421
Cascao Pereira, L. G., Johansson, C., Radke, C. J., and Blanch, H. W. (2003). Surface Forces and Drainage Kinetics of Protein-Stabilized Aqueous Films, 57, 7503–7513.
Chatzigiannakis, E., Veenstra, P., Ten Bosch, D., and Vermant, J. (2020). Mimicking coalescence using a pressure-controlled dynamic thin film balance. Soft Matter 16, 9410–9422. doi:10.1039/d0sm00784f
Cheison, S. C., Lai, M. Y., Leeb, E., and Kulozik, U. (2011). Hydrolysis of β-lactoglobulin by trypsin under acidic pH and analysis of the hydrolysates with MALDI-TOF-MS/MS. Food Chem. 125, 1241–1248. doi:10.1016/j.foodchem.2010.10.042
Chi, E. Y., Krishnan, S., Randolph, T. W., and Carpenter, J. F. (2003). Physical stability of proteins in aqueous solution: Mechanism and driving forces in nonnative protein aggregation. Pharm. Res. 20, 1325–1336. doi:10.1023/A:1025771421906
Chowdhury, D., and Stauffer, D. (1992). Nucleation and size-distribution of holes in a microscopic model of Newton black films. Phys. A Stat. Mech. its Appl. 189, 70–80. doi:10.1016/0378-4371(92)90128-D
Dahlbom, S., Mallin, T., and Bobert, M. (2022). Fire test performance of eleven PFAS-free class B firefighting foams varying fuels, admixture, water types and foam generation techniques. Fire Technol. 58, 1639–1665. doi:10.1007/s10694-022-01213-6
Deshpande, N. S., and Barigou, M. (1999). Performance characteristics of novel mechanical foam breakers in a stirred tank reactor. J. Chem. Technol. Biotechnol. 74, 979–987. doi:10.1002/(SICI)1097-4660(199910)74:10¡979:AID-JCTB139¿3.0.CO;2-8
Dickinson, E. (1998). Proteins at interfaces and in emulsions Stability, rheology and interactions. Faraday Trans. 94, 1657–1669. doi:10.1039/a801167b
Engelhardt, K., Lexis, M., Gochev, G., Konnerth, C., Miller, R., Willenbacher, N., et al. (2013). PH effects on the molecular structure of β-lactoglobulin modified air-water interfaces and its impact on foam rheology. Langmuir 29, 11646–11655. doi:10.1021/la402729g
Exerowa, D., Gochev, G., Platikanov, D., Liggieri, L., and Miller, R. (2018). Foam films and foams. Suite 300 Boca Raton: CRC Press Taylor & Francis Group 6000 Broken Sound Parkway NW. FL 33487-2742.
Exerowa, D., Kolarov, T., and Khristov, K. (1987). Direct measurement of disjoining pressure in black foam films. I. Films from an ionic surfactant. Colloids Surfaces 22, 161–169. doi:10.1016/0166-6622(87)80218-4
Fauser, H., and von Klitzing, R. (2014). Effect of polyelectrolytes on (de)stability of liquid foam films. Soft Matter 10, 6903–6916. doi:10.1039/c4sm01241k
Fiocchi, A., Bognanni, A., Brożek, J., Ebisawa, M., Schünemann, H., Ansotegui, I. J., et al. (2022). World allergy organization (WAO) diagnosis and rationale for action against cow’s milk allergy (DRACMA) guidelines update – I – plan and definitions. World Allergy Organ. J. 15, 57–161. doi:10.1016/j.waojou.2021.100609
Gochev, G., Retzlaff, I., Exerowa, D., and Miller, R. (2014). Electrostatic stabilization of foam films from β-lactoglobulin solutions. Colloids Surfaces A Physicochem. Eng. Aspects 460, 272–279. doi:10.1016/j.colsurfa.2013.12.037
Gochev, G. G., Scoppola, E., Campbell, R. A., Noskov, B. A., Miller, R., and Schneck, E. (2019). β-Lactoglobulin adsorption layers at the water/air surface: 3. Neutron reflectometry study on the effect of pH. J. Phys. Chem. B 123, 10877–10889. doi:10.1021/acs.jpcb.9b07733
Gochev, G. G., Ulaganathan, V., Retzlaff, I., Gehin-Delval, C., Gunes, D. Z., Leser, M., et al. (2020). β-Lactoglobulin adsorption layers at the water/air surface: 4. Impact on the stability of foam films and foams. Minerals 10, 1–19. doi:10.3390/min10070636
Gottschalk, M., Venu, K., and Halle, B. (2003). Protein self-association in solution: The bovine pancreatic trypsin inhibitor decamer. Biophysical J. 84, 3941–3958. doi:10.1016/S0006-3495(03)75122-4
Horne, D. S. (2006). Casein micelle structure: Models and muddles. Curr. Opin. Colloid Interface Sci. 11, 148–153. doi:10.1016/j.cocis.2005.11.004
Huh, C., and Mason, S. G. (1975). A rigorous theory of ring tensiometry. Colloid Polym. Sci. 253, 566–580. doi:10.1007/BF01753960
Huppertz, T. (2013). “Chemistry of the caseins,” in Advanced dairy chemistry: Volume 1A: Proteins: Basic aspects, 4th edition 1, 135–160. doi:10.1007/978-1-4614-4714-6_4
Joyce, A. M., Brodkorb, A., Kelly, A. L., and O’Mahony, J. A. (2017). Separation of the effects of denaturation and aggregation on whey-casein protein interactions during the manufacture of a model infant formula. Dairy Sci. Technol. 96, 787–806. doi:10.1007/s13594-016-0303-4
Kang, W., Yan, L., Ding, F., Guo, X., and Xu, Z. (2019). Experimental study on fire-extinguishing efficiency of protein foam in diesel pool fire. Case Stud. Therm. Eng. 16, 100557. doi:10.1016/j.csite.2019.100557
Kayshev, V. G., Blinov, A. V., Serov, A. V., Gvozdenko, A. A., Kravtsov, A. A., Blinova, A. A., et al. (2019). Quantum-chemical simulation of the interaction between the Zn2+ ions with C-terminal sites of kappa-casein. J. Hyg. Eng. Des. 29, 119–124.
Kristen, N., Simulescu, V., Vu, A., Miller, R., and Klitzing, R. V. (2009). No charge reversal at foam film surfaces after addition of oppositely charged polyelectrolytes ? 7986–7990.
Kristen, N., and von Klitzing, R. (2010). Effect of polyelectrolyte/surfactant combinations on the stability of foam films. Soft Matter 6, 849–861. doi:10.1039/b917297a
Kudo, S., Iwata, S., and Mada, M. (1979). An electron microscopic study of the location of κ-casein in casein micelles by periodic acid-silver methenamine staining. J. Dairy Sci. 62, 916–920. doi:10.3168/jds.S0022-0302(79)83348-2
Lexis, M., and Willenbacher, N. (2014). Relating foam and interfacial rheological properties of β-lactoglobulin solutions. Soft Matter 10, 9626–9636. doi:10.1039/c4sm01972e
Lu, J. R., Su, T. J., and Thomas, R. K. (1999). Structural conformation of bovine serum albumin layers at the air-water interface studied by neutron reflection. J. Colloid Interface Sci. 213, 426–437. doi:10.1006/jcis.1999.6157
Majorek, K. A., Porebski, P. J., Dayal, A., Zimmerman, M. D., Jablonska, K., Stewart, A. J., et al. (2012). Structural and immunologic characterization of bovine, horse, and rabbit serum albumins. Mol. Immunol. 52, 174–182. doi:10.1016/j.molimm.2012.05.011
Maldonado-Valderrama, J., and Langevin, D. (2008). “On the difference between foams stabilized by surfactants and whole casein or -casein,” in Comparison of foams , foam films , and liquid surfaces studies, 3989–3996.
Martin, A. H., Grolle, K., Bos, M. A., Cohen Stuart, M. A., and Van Vliet, T. (2002). Network forming properties of various proteins adsorbed at the air/water interface in relation to foam stability. J. Colloid Interface Sci. 254, 175–183. doi:10.1006/jcis.2002.8592
Mezodour, S., Brulé, G., and Korolczuk, J. (2006). Physicochemical analysis of casein solubility in water-ethanol solutions. Lait 86, 435–452. doi:10.1051/lait:2006022
Morris, G. A., Foster, T. J., and Harding, S. E. (2000). Further observations on the size, shape, and hydration of casein micelles from novel analytical ultracentrifuge and capillary viscometry approaches. Biomacromolecules 1, 764–767. doi:10.1021/bm0055807
Mysels, K. J., and Jones, M. N. (1966). Direct measurement of capacitance. IETE J. Res. 42, 399–401. doi:10.1080/03772063.1976.11451052
Richert, M. E., García Rey, N., and Braunschweig, B. (2018). Charge-Controlled surface properties of native and fluorophore-labeled bovine serum albumin at the air-water interface. J. Phys. Chem. B 122, 10377–10383. doi:10.1021/acs.jpcb.8b06481
Rullier, B., Axelos, M. A., Langevin, D., and Novales, B. (2010). β-Lactoglobulin aggregates in foam films: Effect of the concentration and size of the protein aggregates. J. Colloid Interface Sci. 343, 330–337. doi:10.1016/j.jcis.2009.11.015
Sabarwal, P. K., and Ganguli, N. C. (1972). Effect of micellar casein on heat induced denaturation of whey proteins in milk. J. Dairy Sci. 55, 765–767. doi:10.3168/jds.S0022-0302(72)85570-X
Scheludko, A., and Exerowa, D. (1959). Über den elektrostatischen Druck in Schaumfilmen aus wässerigen Elektrolytlösungen. Kolloid-Zeitschrift 165, 148–151. doi:10.1007/BF01809974
Schulze-Zachau, F., and Braunschweig, B. (2017). Structure of polystyrenesulfonate/surfactant mixtures at air-water interfaces and their role as building blocks for macroscopic foam. Langmuir 33, 3499–3508. doi:10.1021/acs.langmuir.7b00400
Seyrek, E., Dubin, P. L., Tribet, C., and Gamble, E. A. (2003). Ionic strength dependence of protein-polyelectrolyte interactions. Biomacromolecules 4, 273–282. doi:10.1021/bm025664a
Silva, S. V., and Malcata, F. X. (2005). Caseins as source of bioactive peptides. Int. Dairy J. 15, 1–15. doi:10.1016/j.idairyj.2004.04.009
Tcholakova, S., Denkov, N. D., Ivanov, I. B., and Campbell, B. (2006). Coalescence stability of emulsions containing globular milk proteins. Adv. Colloid Interface Sci. 123-126, 259–293. doi:10.1016/j.cis.2006.05.021
Toro-Sierra, J., Tolkach, A., and Kulozik, U. (2013). Fractionation of α-lactalbumin and β-lactoglobulin from whey protein isolate using selective thermal aggregation, an optimized membrane separation procedure and resolubilization techniques at pilot plant scale. Food bioproc. Tech. 6, 1032–1043. doi:10.1007/s11947-011-0732-2
Völp, A. R., and Willenbacher, N. (2021). Shear modulus and yield stress of foams: Contribution of interfacial elasticity. Soft Matter 17, 3937–3944. doi:10.1039/d0sm02246b
von Klitzing, R., Espert, A., Asnacios, A., Hellweg, T., Colin, A., and Langevin, D. (1999). Forces in foam films containing polyelectrolyte and surfactant. Colloids Surfaces A Physicochem. Eng. Aspects 149, 131–140. doi:10.1016/S0927-7757(98)00307-0
Wierenga, P. A., and Gruppen, H. (2010). New views on foams from protein solutions. Curr. Opin. Colloid Interface Sci. 15, 365–373. doi:10.1016/j.cocis.2010.05.017
Wood, Ramboll, and COWI (2020). The use of PFAS and fluorine-free alternatives in fire-fighting foams, 531.
Yampolskaya, G., and Platikanov, D. (2006). Proteins at fluid interfaces: Adsorption layers and thin liquid films. Adv. Colloid Interface Sci. 128-130, 159–183. doi:10.1016/j.cis.2006.11.018
Yilixiati, S., Rafiq, R., Zhang, Y., and Sharma, V. (2018). Influence of salt on supramolecular oscillatory structural forces and stratification in micellar freestanding films. ACS Nano 12, 1050–1061. doi:10.1021/acsnano.7b05391
Zhang, X., Poniewierski, A., Hou, S., Sozański, K., Wisniewska, A., Wieczorek, S. A., et al. (2015). Tracking structural transitions of bovine serum albumin in surfactant solutions by fluorescence correlation spectroscopy and fluorescence lifetime analysis. Soft Matter 11, 2512–2518. doi:10.1039/c5sm00101c
Keywords: disjoining pressure, β-lactoglobulin, bovine serum albumin, casein, foam films, networks
Citation: Gräff K, Stock S, Mirau L, Bürger S, Braun L, Völp A, Willenbacher N and von Klitzing R (2022) Untangling effects of proteins as stabilizers for foam films. Front. Soft. Matter 2:1035377. doi: 10.3389/frsfm.2022.1035377
Received: 02 September 2022; Accepted: 25 October 2022;
Published: 10 November 2022.
Edited by:
Anne-laure Fameau, Institut National de recherche pour l’agriculture, l’alimentation et l’environnement (INRAE), FranceReviewed by:
Björn Braunschweig, University of Münster, GermanyCopyright © 2022 Gräff, Stock, Mirau, Bürger, Braun, Völp, Willenbacher and von Klitzing. This is an open-access article distributed under the terms of the Creative Commons Attribution License (CC BY). The use, distribution or reproduction in other forums is permitted, provided the original author(s) and the copyright owner(s) are credited and that the original publication in this journal is cited, in accordance with accepted academic practice. No use, distribution or reproduction is permitted which does not comply with these terms.
*Correspondence: Regine von Klitzing, a2xpdHppbmdAc21pLnR1LWRhcm1zdGFkdC5kZQ==
Disclaimer: All claims expressed in this article are solely those of the authors and do not necessarily represent those of their affiliated organizations, or those of the publisher, the editors and the reviewers. Any product that may be evaluated in this article or claim that may be made by its manufacturer is not guaranteed or endorsed by the publisher.
Research integrity at Frontiers
Learn more about the work of our research integrity team to safeguard the quality of each article we publish.