 Ricardo A. Pérez-Camargo
 Dario Cavallo
 Alejandro J. Müller
- 1Beijing National Laboratory for Molecular Sciences, CAS Key Laboratory of Engineering Plastics, Institute of Chemistry, Chinese Academy of Sciences, Beijing, China
- 2Department of Chemistry and Industrial Chemistry, University of Genova, Genova, Italy
- 3POLYMAT and Department of Polymers and Advanced Materials, Physics, Chemistry and Technology, Faculty of Chemistry, University of the Basque Country UPV/EHU, Donostia-San Sebastián, Spain
- 4IKERBASQUE, Basque Foundation for Science, Bilbao, Spain
Successive Self-nucleation and Annealing (SSA) is a thermal fractionation technique that is performed by Differential Scanning Calorimetry (DSC). The combination of non-isothermal and isothermal steps applied during SSA achieves efficient molecular segregation during polymer crystallization. Such molecular segregation magnifies the effect of defects in polymer chain crystallization, thereby providing information on chain structure. The technique was created and implemented by Müller and co-workers in 1997, becoming a powerful resource for studying ethylene/α-olefin copolymers. The different variables to design the SSA protocol: fractionation window, fractionation time, scanning rate, sample mass, and the first self-nucleation temperature to be applied (Ts, ideal), have been previously reviewed, together with the different applications of SSA. SSA versatility, simplicity (when properly applied), and short times to produce results have allowed its use to study novel and more complex polymeric systems. This review article explores the most recent applications of SSA of the past decade. First, the principles of the technique are briefly explained, covering all the relevant variables. Next, we have selected different cases that show how SSA is employed in various novel fields, such as studying intermolecular interactions and topological effects in homopolymers; supernucleation and antinucleation effects in nanocomposites, including the pre-freezing phenomenon; crystallization modes in random copolymers; solid-solid transitions; miscibility, co-crystallization and composition in blends; evaluation of polymer synthesis variables; and the novel information that could be gained by using fast scanning chip-based calorimetry. Finally, we offer a perspective on SSA, a technique that has become a powerful method for studying the distribution of defects affecting crystallization in semi-crystalline polymers.
1 Introduction
The most important fractionation techniques are based on the analysis of the crystallizable components of a given material, which, for example, in polyolefins, strongly depend on branching type and distribution (Eselem Bungu et al., 2020a). Still, other fractionation techniques allow probing the microstructure irrespectively of the crystallinity, based on molar mass and chemical composition (Eselem Bungu et al., 2020a).
This work briefly deals with crystallization-based techniques. The crystallization-based methods can be subdivided into solution-based and thermal-based fractionation techniques. Temperature Rising Elution Fractionation (TREF) and Crystallization Analysis Fractionation (CRYSTAF) are the mainly employed solution-based fractionation techniques. The main disadvantages of TREF and CRYSTAF are: 1) the use of harmful solvents and expensive instrumentation are required; 2) the method cannot be used for all kinds of materials since the columns can be plugged by, for example, cross-linked particles, during the elution process; 3) only slow cooling and heating rates can be used leading to a time-consuming analysis; 4) since the physical separation of the chains occurs during the process, the method is less sensitive to intra-molecular heterogeneity; 5) the solution-based methods are not easy to implement (Carmeli et al., 2020). Despite these disadvantages, solution-based fractionation techniques are widely used (Meunier et al., 2021), since they allow determining the molecular weight (MW) of the fractions and separating them (physically), including soluble or amorphous/rubber parts (Carmeli et al., 2020). As discussed below, such fractions’ quantification is impossible using thermal fractionation. Thus, solution-based and thermal fractionation techniques can be complementary for some topics, resulting in a more detailed characterization of the molecular heterogeneities that hinder the crystallization of polymer chains (Carmeli et al., 2020). In fact, TREF and SSA can be combined, together with other techniques (cross-fractionation) to obtain valuable information on the chain microstructure (Xue et al., 2015a).
The main thermal-based fractionation techniques are Step-Crystallization (SC) and Successive Self-nucleation and Annealing (SSA). Due to its significant advantages, we will focus on the latter. Often, the solution-based and SSA fractionation results are comparable, remarking the analysis power of the SSA technique. SSA is a thermal fractionation technique created in 1997 by Müller et al. (1997), which employs easy and inexpensive DSC (Differential Scanning Calorimetry) methods in the absence of solvents (Carmeli et al., 2020). The SSA consists of a thermal protocol that combines isothermal and non-isothermal steps, which induce the molecular segregation of the material without physical separation. The lack of physical separation of the chains during crystallization made the thermal fractionation techniques sensitive to intra- and inter-molecular heterogeneities, allowing the study of any crystallizable material without damaging the equipment. In addition, SSA can be performed at fast scanning rates [up to 50°C/min in conventional DSC (Müller and Arnal, 2005; Müller et al., 2015)] by using the mass compensation principle, reducing the analysis time compared with other fractionation techniques. Further reduction of testing times can be obtained by using fast scanning chip-based calorimetry (FSC). With SSA/FSC the early stages of fractionation can be studied, representing a new venue of research (Cavallo et al., 2016; Sangroniz et al., 2020a).
SSA is often compared with the SC fractionation method, although SC only applies cooling steps (Keating and McCord, 1994; Shanks and Amarasinghe, 2000; Müller and Arnal, 2005; Müller et al., 2015), whereas in SSA a series of heating and cooling cycles are applied. Both techniques can fractionate the samples without a physical separation and solvents. Still, the times employed in the SSA technique are significantly lower than those required in SC. The features of the SSA technique allow applying it to various materials and obtaining important information, mainly regarding chain structure, chain length, etc. A first review, reflecting the versatility of the technique, was made in 2005 by Müller and Arnal (2005) and next in 2015 by Müller et al. (2015). In the latest study, the correct variables selection was discussed, providing guidelines for the proper design of an SSA protocol. Here, we briefly review all the concepts related to the SSA technique.
Scheme 1 summarizes the key variables for designing an SSA protocol, further discussed in previous contributions (Müller and Arnal, 2005; Müller et al., 2015). The SSA protocol’s correct design requires performing previous self-nucleation (SN) experiments (Michell et al., 2017; Sangroniz et al., 2020b) to determine the ideal self-nucleation temperature, Ts, ideal. The SN protocol and its principles are briefly reviewed below. Next, the SSA protocol and its variables are discussed.
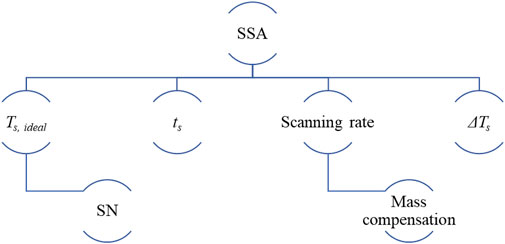
SCHEME 1. Summary of the key variables to correctly design an SSA protocol.
1.1 Self-nucleation: Ts, ideal determination
The SN protocol was defined by Fillon et al. (1993), and is represented in Scheme 2A. The standard SN procedure consists of the following steps (Michell et al., 2017; Sangroniz et al., 2020b):
Step 1. Erasure of the thermal history and crystalline memory. This step employs a temperature, T, well above the melting temperature, Tm, of the material, i.e., T = Tm + 20–30°C, which is kept between 3 and 5 min to erase the thermal history and crystalline memory. Only temperature-resistant heterogeneous nuclei of unknown nature (catalyst residues, impurities, or any other type of heterogeneities) can survive this treatment (Fillon et al., 1993; Müller and Arnal, 2005; Müller et al., 2015; Michell et al., 2017). It is important to remark that aiming to avoid thermal degradation, short times, e.g., 1 min, can be employed in sensitive polymers (e.g., polyhydroxybutirate).
Step 2. Creation of a standard crystalline state. The standard crystalline state is created by cooling the sample from the melt (at T) to a selected temperature T1, and maintaining it at T1 for a chosen time, e.g., 1 min, creating the standard crystalline state. Here, T1 is a temperature well below the crystallization temperature, Tc, of the material, e.g., a temperature at which the material has finished its crystallization during cooling. The output Tc of this Step is the standard Tc since it is equivalent to the Tc registered in a non-isothermal DSC scan from an isotropic melt. For reproducing this standard state, the thermal conditions (cooling rate, T, and T1) must be constant in every SN protocol applied to a sample since they affect the crystallization kinetics. In this way, the standard state depends only on the material characteristics (concentration and activity of heterogeneous nuclei and molecular features affecting the growth rate) (Carmeli et al., 2020).
Step 3. Heating from T1 to Ts, being Ts a selected self-nucleation or self-seeding temperature.
Step 4. Thermal conditioning at Ts. The sample is kept at a selected Ts, generally between the Tm, onset and T of the sample (Scheme 2A), for a set time, ts. In general, ts = 5 min is employed, although shorter times, e.g., 1–3 min (Colonna et al., 2017; Fernández-d'Arlas et al., 2021), can be used to avoid degradation. Depending on the Ts, the sample can experience different effects, defining the self-nucleation Domains, as illustrated in Scheme 2C.
1) Complete melting (Domain I or complete melting Domain): By using Ts >> Tm; the sample will be completely molten (isotropic melt), and thus, its thermal behavior will be the same as in a standard state.
2) Melting of most of the crystals (Domain II or exclusive self-nucleation Domain): In this case, the Ts is high enough to melt most of the crystals but low enough to leave small crystals fragments (Domain IIb) or ordered regions in the melt (Domain IIa) that act as self-nuclei.
3) Partial melting (Domain III or self-nucleation and annealing Domain): Ts is low enough to cause the melt of a fraction of crystals and the annealing of unmolten crystals during the holding time at Ts.
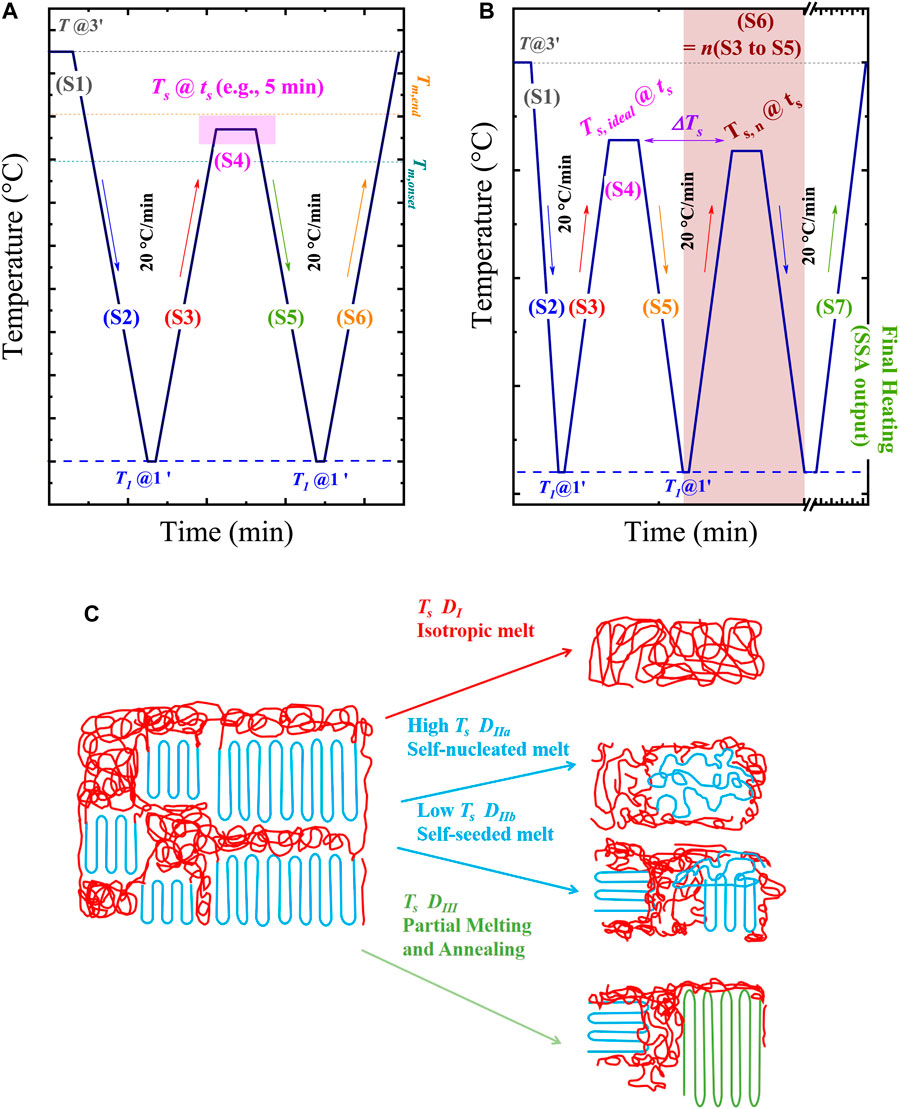
SCHEME 2. Schematic representation of (A) self-nucleation (SN), and (B) Successive Self-nucleation and Annealing (SSA) protocols. In (C), cartoons of the different effects of the holding time at Ts (see the shadowed region in (A)) are presented. Scheme 2C is adapted from (Müller et al., 2015).
The changes caused by the holding time at Ts will be reflected in the following steps:
Step 5. Cooling from Ts to T1. The sample is cooled from Ts to T1, maintaining the latter during a set time, e.g., 1 min, for conditioning. In this cooling scan, the effects of Ts on Tc will be appreciated (see Figure 1A) by comparing the “standard” Tc (Step 2) with the output Tc after SN (Step 5):
1) If Tc (Step 2) = Tc (Step 5), the polymer is in Domain I.
2) If Tc (Step 2) < Tc (Step 5), the sample has been self-nucleated and could be in Domain II or Domain III. Note that the lowest Ts in Domain II (the boundary between Domain III and II) will produce the highest number of self-nuclei, i.e., the maximum nucleation density, without causing any annealing, corresponding to the highest Tc. This point is defined as ideal self-nucleation temperature, Ts, ideal.
Step 6. Final heating from T1 to T. In this step, any change in the melting behavior caused by Step 4 is displayed (see Figure 1B) with the comparison of the standard Tm and the resulting output Tm after the SN process (Step 6):
1) Minor changes in melting endotherm, e.g., Tm (standard) = Tm (Step 6), indicates that the sample is in Domain I or Domain II.
2) An annealing process causes the appearance of an additional high-temperature melting peak; thus, the material is in Domain III. Hence, this Step is needed to determine whether the material is in Domain III.
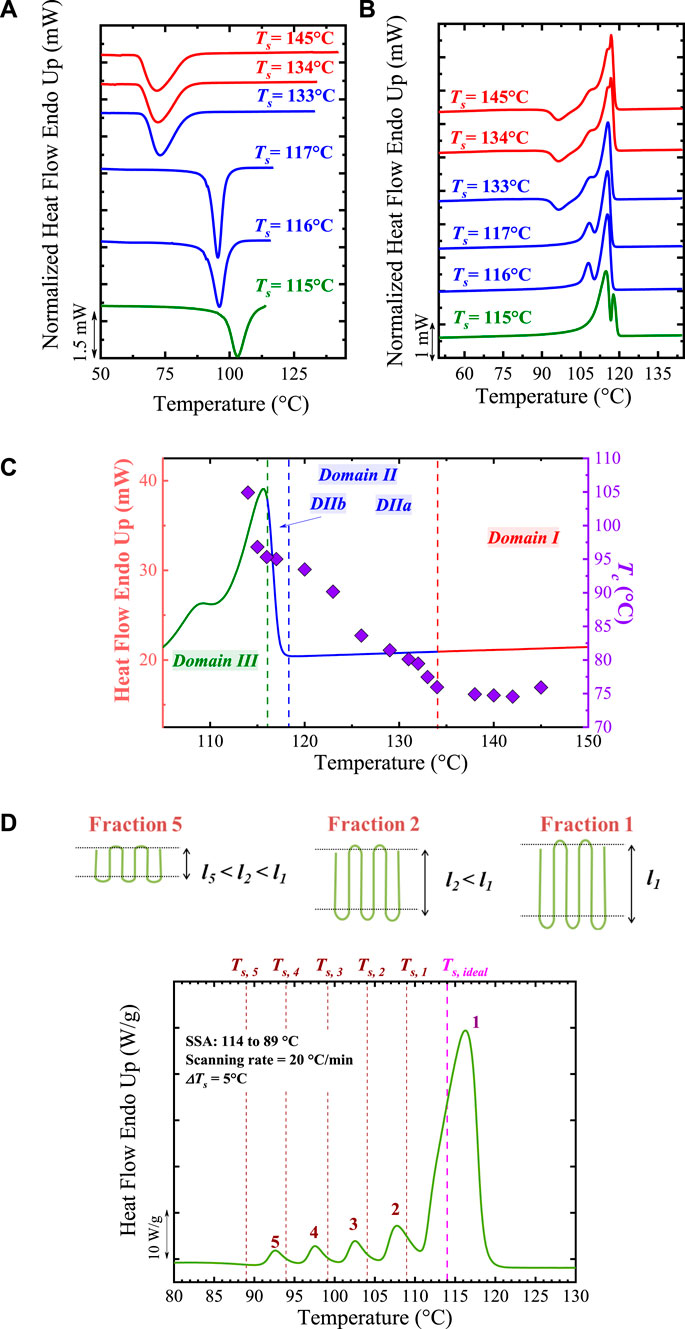
FIGURE 1. (A) Cooling and (B) heating DSC scans for PBS after holding the sample at the indicated Ts values. The curves in Domain I, II, and III are indicated with red, blue, and green colors. In (C) the standard DSC heating curve (in Domain I) is plotted superimposed with the Tc values (right hand side Y-axis) vs. Ts values (X-axis). The obtained Domains from (A) and (B) analyses are indicated. In (D) SSA profile of PBS. The vertical lines represent the employed Ts, while the generated fractions are labeled. At the top, it is illustrated that the crystals that melt at the highest temperature in Fraction 1 correspond to crystals of thicker lamellar thickness, whereas those crystals that melt at the lowest Tm fractions are thinner crystals. Figure 1A–C is adapted from (Arandia et al., 2015). The PBS SSA profile (Figure 1D) was obtained from (Pérez-Camargo et al., 2020a).
Recently, Michell et al. (2017), Sangroniz et al. (2018), Liu et al. (2020a) proposed the division of Domain II into two subdomains:
1) Domain IIa or melt memory effect Domain: it occurs when the Ts is high enough to melt all crystals in the sample but low enough to leave certain ordered regions in the melt (self-nucleated melt in Scheme 2C) that act as self-nuclei upon the following cooling. Domain IIa starts at a Ts > Tm, end of the material.
2) Domain IIb or self-seeding Domain. It is defined by a Ts high enough to melt (self-seeded melt in Scheme 2C) the entire sample but low enough to leave small crystal fragments unmolten that can represent self-seeds (they are, however, incapable of annealing). Domain IIb is located in the lower temperature region in Domain II. The value of Ts, ideal is typically found within Domain IIb.
Figures 1A–C illustrates the typical SN curves and the division of self-nucleation Domains found in poly (butylene succinate), PBS, as an example.
The SSA protocol ideally starts with the Ts, ideal defined in the SN experiments. The SN process should always be performed before the SSA experiments to determine the Ts,ideal. Using the Ts, ideal reported in the literature usually generates erroneous results, as many factors can be different: materials, DSC equipment, calibration, etc. The steps of the SSA protocol are illustrated (see Scheme 2B) and described below. Next, the discussion of the main variables of the SSA protocol is presented.
Step 1. Erasing the thermal history at T for 3 min.
Step 2. Cooling from T to T1, and holding (e.g., 1 min) the sample at T1 to create a standard thermal history.
Step 3. Heating from T1 to Ts. The initial or starting Ts should be Ts, ideal. Other considerations are explained below.
Step 4. Holding Ts for a time, Ts. Often Ts = 5 min is used, but shorter times can be used, either for avoiding degradation or in chip-based DSC experiments.
Step 5. Cooling from Ts to T1, and hold T1 for conditioning. Often a holding time of 1 min is used.
Steps 1 to 5 are the same as the SN protocol described above.
Step 6. Repeating Steps 3 to 5 (see S6 = n times S3 to S5 in Scheme 2B) at progressively lower Ts values. The difference between the selected Tss (see the difference between Ts, ideal and Ts, n in Scheme 2B) is defined as the fractionation windows (ΔTs). Note that Ts, ideal only self-nucleates the sample. The next Ts < Ts, ideal will anneal the sample: the highest Ts anneal the crystals that melt at higher temperatures (thicker crystals), and the lowest Ts the crystals that melt at lower temperatures (thinner crystals).
Step 7. Final heating from T1 to T at a selected scanning rate is performed, revealing the sample’s fractionation profile (SSA profile), as described in Figure 1D.
As shown in Scheme 1, different variables are crucial to designing an SSA protocol correctly. The most critical points to consider for each variable are described briefly below. For more details, the reader is referred to References (Müller and Arnal, 2005; Müller et al., 2015; Michell et al., 2017).
1.2 Ts selection
The initial Ts (see Step 4 on Scheme 2B) is crucial for the SSA protocol. As was reviewed by Müller et al. (2015) there are two different ways of designing SSA protocols, and their application depends on the objectives of the research: obtainment of quantitative vs. qualitative information.
1) The SSA experiment should start with the Ts, ideal when quantitative information is required. For instance, short-chain branch distribution, comonomer distribution, crosslink distribution, stereo-defects, or any other defect distribution along the chain provoked by different catalytic systems or chemical reactions represent quantitative information (Müller et al., 2015). The Ts, ideal must be determined by a previous SN experiment of each sample, and the SSA protocol should be designed accordingly. Note that the Ts, ideal reported in the literature should not be used since Ts,ideal values are sensitive to molecular parameters, additive contents, processing history, and DSC calibration.
2) An identical common Ts values can be set to design one SSA protocol and qualitatively compare a set of samples. For this case, the SN experiment can be performed on the sample with the highest melting point to determine the highest Ts, ideal among all the samples. This Ts, ideal, does not generate annealing on the other low-temperature samples and hence should be used as a starting point or initial point, Ts,i (see Step 4) for performing the SSA experiments. The advantage of this method is that all the samples have the same thermal history allowing more meaningful comparisons (qualitatively). Müller et al. (2015) pointed out that by using the same thermal history, all the valleys (i.e., minima) will be located at precisely the same temperature for all the samples since the selected Ts determines their values. If the melting point difference between the samples is very high, some SSA steps could be skipped in the sample with the lower melting temperature to avoid imposing several steps in Domain I, which will cause no thermal effects but may risk sample degradation.
It is worth noting that some materials possess a direct transition from Domain I to Domain III. For them, it is impossible to determine Ts, ideal, and instead, the lowest Ts in Domain I is employed since this Ts does not generate any annealing.
1.3 Holding times at Ts: ts
The holding times or ts values have been studied in previous works (Müller and Arnal, 2005; Müller et al., 2015). It has been demonstrated that increasing ts beyond ts = 5 min (up to 20 min) does not improve the SSA fractionation significantly. For that reason, ts = 5 min is often the employed time. However, it should be noted that the SN is a kinetic technique that depends on time. Therefore, the Ts, ideal is defined at a specific ts, e.g., between 5 to 15 min. It has been demonstrated that increasing the ts to 30 min and beyond (up to 15 h) changes the boundary between Domain III and II; thus resulting in a Ts, ideal (estimated with a ts = 5 min) that can anneal the crystals and produce a new high-temperature fraction (Müller et al., 2015). On the other hand, for some materials, long ts values can provoke the degradation of the material. Therefore, shorter times, e.g., 1 min, can be employed (Colonna et al., 2017; Fernández-d'Arlas et al., 2021). In addition, short ts values are required to study the early stages of the thermal fractionation by fast scanning calorimetry (Cavallo et al., 2016). Thus, in that sense, the ts is adaptable to the desired target.
The key messages here are: 1) The ts employed in the SN (for the Ts, ideal determination) must be the same as in the SSA experiment; 2) it has been proven that ts between 5 to 15 min generates similar results; thus, using shorter ts values is preferred; 3) in materials that tend to suffer thermal degradation ts < 5 min can be used, following the point (a), and checking whether the SSA profiles have enough resolution; and 4) for specific studies, ts << 5 min can be used, again following the point (a).
1.4 Scanning rate: Mass compensation principle
Müller and Arnal (2005) showed that compensating the increment in heating rates by reducing the mass of the sample allows for performing SSA experiments at scanning rates as high as 50°C/min (e.g., using a sample mass of 1.2 mg in a conventional DSC) with an equivalent resolution to the experiments with scanning rates of 10°C/min (e.g., using sample mass of 5.2 mg). The faster rates lead to shorter thermal fractionation times, avoiding superheating effects (Müller et al., 2015). In Section 2.7, it is shown that Cavallo et al. (2016) and Sangroniz et al. (2020a) employed scanning rates as fast as 100°C/s using FSC, and the mass compensation principles.
1.5 Fractionation windows (ΔTs)
The difference in temperature between Ts, ideal, and the next Ts, e.g., Ts,1 (see Scheme 2B), is set and defined as the fractionation window (ΔTs). The set ΔTs determines the width of the thermal fraction, and it should be kept constant through the SSA experiment (Müller et al., 2015). The ideal ΔTs should provide the best compromise between high resolution (i.e., given by peak separation and how deep are the valleys between the peaks (Carmeli et al., 2020)) of the single fractions and an acceptable number of fractions (Carmeli et al., 2020). Overall, ΔTs < 2.5°C, e.g., ΔTs = 1°C, will generate more fractions but is too narrow to resolve the individual fractions, leading to a poor fractionation, as demonstrated by Müller and Arnal in hydrogenated polybutadiene, HPB (Müller and Arnal, 2005). In general, for most of the materials, it is recommended ΔTs = 5°C. For linear materials (defect-free) with low fractionation capacity, Müller et al. (2015) suggest that increasing ΔTs to 10°C can be convenient. Recently, Carmeli et al. (2020) employed a fractionation window of 7.5°C for isotactic polypropylene.
With the correct design of the SSA protocol, an SSA profile of the material can be obtained. Figure 1D illustrates the final SSA heating or SSA profile of PBS, in which a correctly designed SSA protocol was employed. In this case, the PBS is a linear material; thus, the multiple fractions have been provoked by molar mass differences, although the influence of intermolecular interactions could also affect the fractionation profile of polar materials as recently demonstrated by Sangroniz et al. (2022). The correctly designed protocol consisted of 6 steps, which generated 5 melting fractions, labeled in Figure 1D. As already mentioned, the Ts, ideal, in this case, Ts, ideal = 114°C, does not generate any fraction since it provokes self-nucleation only. The Ts < Ts, ideal cause self-nucleation and annealing. As a result, Ts, 1 produced Fraction 1, Ts, 2 produced fraction 2, and so on, until Ts, 5 produced Fraction 5. This terminology (Ts, n creating Fractions n) will be used from now onwards in most cases. Each fraction melts at Tm, SSA (melting points after SSA treatment), corresponding to a different lamellar thickness, as schematically illustrated in the top part of Figure 1D. Fraction 1 melts at the highest temperature due to the annealing of the thickest crystals (with a lamellar thickness l1). On the contrary, Fraction 5, which melts at the lowest temperature, corresponds to the annealing of the thinner crystals, with l5 << l1.
With the concepts and correct design of the SSA protocol in mind, we explore how the versatility of the SSA technique has been exploited recently. This work focuses on the recent applications of the SSA technique, collected in Table 1, providing a complete picture of how the technique has advanced and been applied in the last decade. The SSA fractionation has continued growing in the study of polyolefins, e.g., branching distribution analysis in complex polyolefins and stereo-defects analysis, but it is becoming an essential tool for the analysis of other materials as well. We have grouped selected novel works by different topics discussed in the next sections of this work. Finally, we offer our perspective on the challenges and future of this valuable and versatile technique.
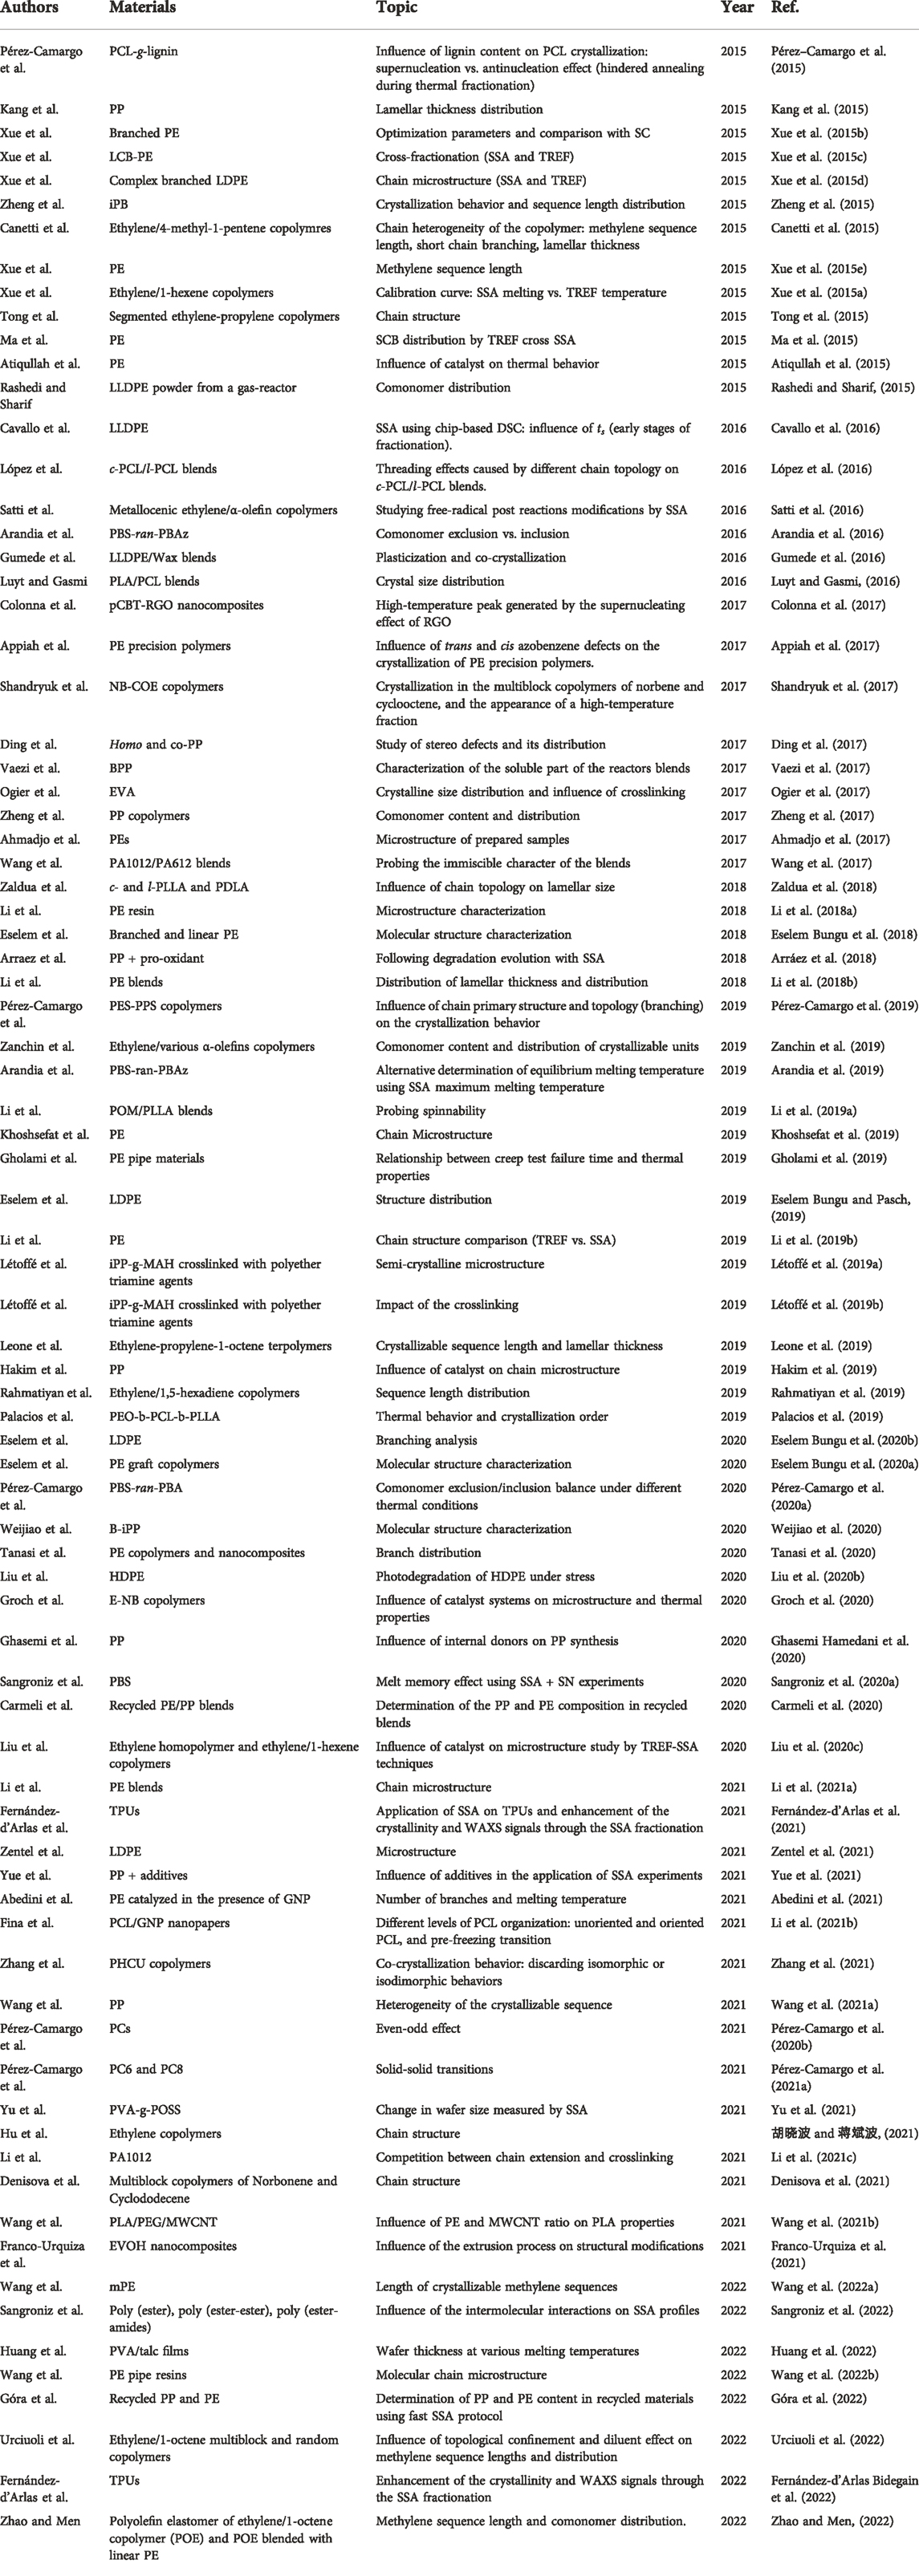
TABLE 1. Recent use of the SSA technique in the last decade (2015 to 2022 (July)).
2 Novel applications of SSA
The SSA technique has been widely used for various purposes and materials, as illustrated in Table 1. For the ethylene/α-olefins copolymers and polyolefins in general, the SSA technique, due to its versatility, is practically employed as a routinary characterization technique in the polyolefin industries. For other polymeric families, copolymers, and nanocomposites, among others, the SSA has been engaged for the first time or has found novel applications, which will be the focus of this work. Table 1 collects the different results reported in the literature from 2015 to 2022.
From Table 1, we will discuss selected works that reflect the SSA technique’s novel applications. For clarity, the novel applications have been grouped in the following topics: 2.1. Homopolymers: intermolecular interactions and topology effects; 2.2. Nanocomposites: super-nucleation, anti-nucleation, and pre-freezing effects; 2.3. Copolymers: random copolymers, block copolymers, and tri-block copolymers; 2.4. Improving thermal transitions signals: solid-solid transitions and polyurethanes; 2.5. Evaluating polymer blends by SSA experiments; 2.6. Evaluating synthesis conditions; and 2.7. Using FSC in SSA studies.
2.1 Homopolymers: Intermolecular interactions and topology effects
One of the main elements that interrupt the length of the crystallizable sequences and provoke thermal fractionation is the presence of defects. For instance, in ethylene/α-olefins copolymers, the short branches act as defects, interrupting the length of crystallizable sequences, leading to different crystallizable lengths reflected in the thermal fractionation (i.e., various thermal fractions). On the contrary, the fractionation profiles do not display precise thermal fractions in high density polyethylene (HDPE), mainly a linear polymer with a few branches. In linear homopolymers, such as HDPE, there are no defects (often, they do not possess branches); therefore, the fractionation is generated by differences in MW since the fractionation also depends on the chain length. Besides the differences in MW, it has recently been found that the intermolecular interactions and topology affect the final fractionation profiles of homopolymers (López et al., 2016; Zaldua et al., 2018; Pérez-Camargo et al., 2019; Sangroniz et al., 2022).
2.1.1 Intermolecular interactions in homopolymers
Sangroniz et al. (2022) recently demonstrated that the intermolecular interactions within a linear homopolymer could affect the final fractionation profile. These authors studied polyesters (PEsx-y), poly (ester-ester) (PEEx-y), and poly (ester-amide)s (PEAx-y) with different numbers of carbon atoms in the diol (the number of carbons is indicated by x) and diacid (the number of carbons is indicated by y) parts. In addition, they varied the position of the amide groups in the poly (ester-amide). The chemical structures of these materials are superimposed in Figure 2 (see Figures 2C–E). The influence of the chemical structure on the SSA profile was studied by designing an SSA protocol with ts = 5 min, ΔTs = 5°C, and a scanning rate of 10°C/min. Following the criteria proposed by Müller et al. (2015), the highest Ts, ideal = 167°C (PEA8-2), was employed for all materials as starting Ts, Ts,i. This guaranteed that all the Ts,i fall in Domain II, and the use of the same Ts for all the materials is suitable for meaningful comparisons. For those materials that melt at the lowest temperature, the sequence set for Ts, i = 167°C is followed, but it is not necessary to apply the steps at the highest temperature since they do not generate self-nucleation and annealing. For instance, for the PEs8-10, the starting Ts = 77°C is in Domain II; and the steps at Ts = 167°C–84°C (17 steps) are not needed, saving time and avoiding degradation. Still, at the lowest temperature Ts < 83°C the PEs8-10 and PEA8-2 can be directly compared. Figure 2A shows, for illustration purposes, the final SSA heating scans for the PEAx-y series. From the SSA profiles (as shown in Figure 2A), the melting peaks, Tm, SSA, and the enthalpies of each fraction were analyzed and plotted versus the number of melting peaks after SSA, as shown Figures 2B–E.
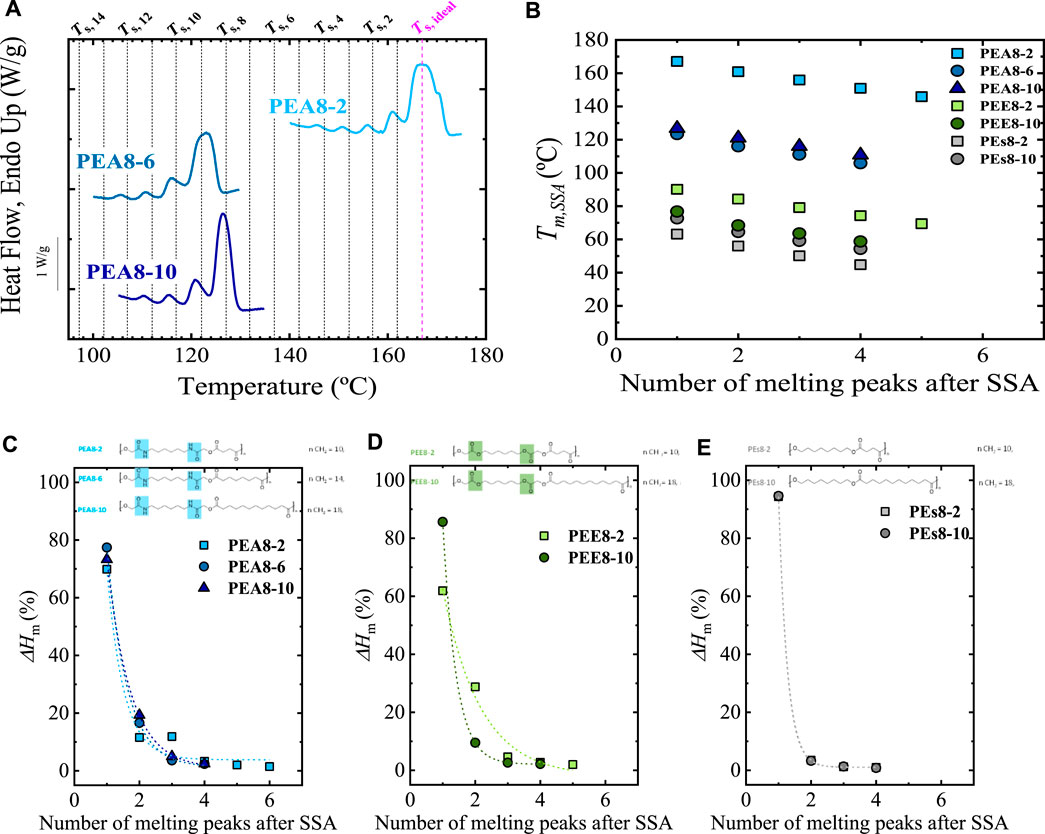
FIGURE 2. (A) SSA profiles for PEA-x series; (B) Tm, SSA (Tm of each fraction generated by SSA) vs. number of melting peaks after SSA for PEA8-x, PEE8-x, PEs8-x materials; ΔHm (%) vs. number of melting peaks after SSA for (C) PEA8-x, (D) PEE8-x; and (E) PEs8-x. The chemical structure of the different families of materials are indicated at the top of (C–E). In (A) the vertical lines indicate the employed Ts. Figure 2 is Adapted from (Sangroniz et al., 2022).
Sangroniz et al. (2022) found that the Tm, SSA value depends on the intermolecular forces: the stronger interactions, the higher the Tm, SSA. Thus, the poly (ester-amide)s that can form hydrogen bonds (due to the presence of amide groups) exhibit the highest Tm, SSA, followed by lower Tm, SSA in the poly (ester-ester), and the lowest for the poly (ester), as displayed in Figure 2B. The methylene groups significantly influence the poly (ester-amide)s since increasing the number of methylene groups leads to a decrease of the Tm, SSA up to 30 degrees (see PEA8-2 vs. PEA8-6 and PEA8-10 in Figures 2A,B). Figure 2B shows that the increase in methylene groups in poly (ester-ester) (see PEE series in Figure 2B) and poly (ester) (see PEs series in Figure 2B) does not lead to such significant changes.
Analyzing the “weight” of each fraction by studying their melting enthalpy, Sangroniz et al. (2022) concluded that “intermolecular interactions act as defects that interrupt the linear crystallizable chain length of the polymer.” Therefore, the highest fraction’s enthalpy is significantly higher for the poly (ester) (Figure 2E) since “few interactions, fewer defects interrupt the crystallizable chain length, and therefore a higher proportion of thickest lamellae can be formed. The longer the crystallizable sequence length, the thicker the lamellae produced, which melt at higher temperatures in the first thermal fraction.” For the poly (ester-ester) (Figure 2D) and poly (ester-amide)s (Figure 2C), the “defects” (intermolecular interactions) facilitate the thermal fractionation, as reflected in the enthalpies of the lower temperature fractions. It is interesting to note that the intermolecular interactions facilitate thermal fractionation by SSA. In contrast, as it will be shown, the interactions found in nanocomposites or with different topologies affect the annealing capacity without affecting the fractionation capacity.
2.1.2 Even-odd effect
The even-odd and odd-even effect is another interesting effect in some semi-crystalline polymers (Zhang et al., 2019; Zhou et al., 2019; Pérez-Camargo et al., 2020b; Flores et al., 2022) that contain functional groups that provoke strong intermolecular interactions. These effects have been recently reported in aliphatic polyethers (odd-even effect) (Flores et al., 2022) and polycarbonates (even-odd effect) (Pérez-Camargo et al., 2020b); the latter denoted as PCx, with x = the number of methylene groups or chain length (nCH2). The most distinctive characteristic of the even-odd effect is the alternation of the physical properties (e.g., melting point, enthalpies, modulus, among others) in the solid state as a function of nCH2 within the repeating unit of the polymer. For an even-odd effect, the properties of the even samples possess higher values than the odd ones; the opposite occurs for an odd-even effect.
Recent studies show that the even-odd or odd-even effect is saturated as nCH2 increases. Pérez-Camargo et al. (2020b) used SSA experiments to generate different thermal histories in aliphatic polycarbonates with nCH2 = 6 to 12. They found that the even-odd effect is independent of the crystallization condition (i.e., non-isothermal, isothermal, and SSA experiments). Thus, the Tm, SSA vary according to the even-odd effect (i.e., Tm, SSA (even) > Tm,SSA (odd) for nCH2 = 6 to 9) of these samples. The SSA final profile for all the samples is shown in Figure 3A. It is worth noting that Pérez-Camargo et al. (2020b) performed the SSA experiments by taking the highest Ts, ideal = 68°C (corresponding to that of PC12) and the Ts, ideal of every single material, obtaining similar results.
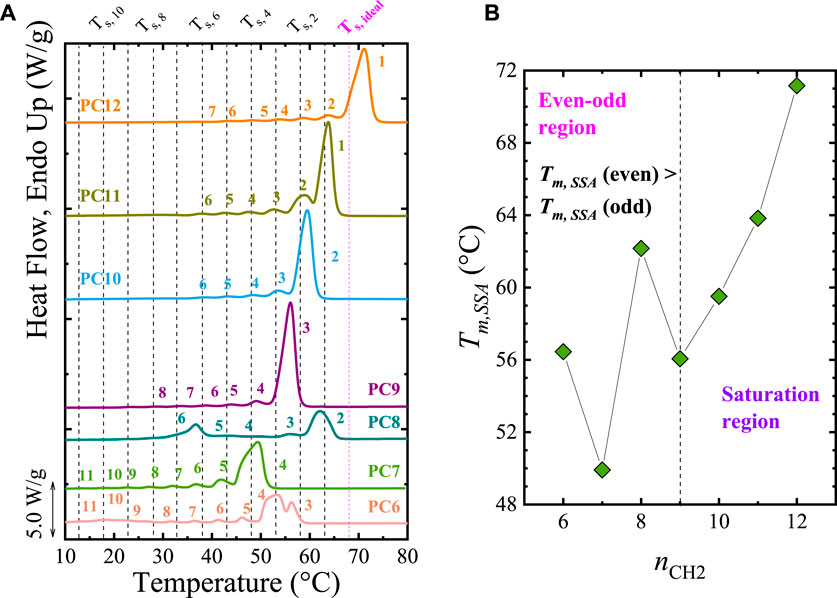
FIGURE 3. (A) SSA profile for all the samples. The SSA protocol was designed with the following conditions: Ts, ideal = 68°C (PC12), ΔTs = 5°C, and scanning rates = 20°C/min. The vertical lines indicate the Ts employed. In (B), the maximum melting point generated by the SSA treatment, Tm,SSA is plotted as a function of nCH2. Note that the plot is divided in the even-odd (nCH2 = 6 to 9) and saturation (nCH2 = 10 to 12) regions. Figure 3 adapted from (Pérez-Camargo et al., 2020b).
Besides the differences in Tm, SSA, Figure 3A shows that despite having more methylene units, the PC7 and PC9 have a lower annealing capacity, reaching only up to Fractions 4 and 3, respectively, compared with PC6 and PC8 that reach up to Fractions 3 and 2. From Figure 3A, Pérez-Camargo et al. (2020b) showed that the even-odd effect occurs for nCH2 = 6 to 9, as reflected in the Tm, SSA vs. nCH2 plot in Figure 3B. In the even-odd region, the intramolecular interactions of the carbonyl groups are present, generating different chain conformation and unit cell (even (monoclinic) vs. odd (orthorhombic)), leading to higher melting points for the even samples than the odd ones. When the increasing methylene groups dilute the influence of the carbonyl groups, the even-odd effect is saturated for nCH2 = 10 to 12, and the Tm, SSA (see Figure 3A and Tm, SSA vs. nCH2 in Figure 3B) increase linearly with nCH2 instead of showing an alternation. In the saturation region, independently of the nCH2, the samples displayed the same conformation, memory effect, and crystalline structure, which, as expected, resembles that of polyethylene.
2.1.3 Topology effects: Cyclic vs. linear topology
Apart from the intermolecular interactions and even-odd effect, the fractionation of homopolymers can be affected by chain topology. The influence of chain topology (cyclic vs. linear) in the SSA fractionation was illustrated in our previous works (Pérez et al., 2014a; Müller et al., 2015), by fractionating cyclic and linear PCLs of equal MW. By applying the same SSA protocol, it was found that independently of the MW, the c-PCL has a greater annealing capacity, forming thicker lamellae that melt at higher Tm than its analogous l-PCL. Note that thermodynamically l-PCL can be extended to twice the maximum length of c-PCL. Therefore, the remarkable higher annealing capacity of the c-PCL is explained by the kinetic factors that dominate the SSA experiments. This means that during the ts = 5 min, the c-PCL has a higher thickening capacity. Its topology boosts the thickening process due to the lower entanglement density and easier diffusion capability than linear chains (Müller et al., 2015).
SSA has continued to be a helpful tool for evaluating the differences between cyclic and linear polymers and even of the blends between them (López et al., 2016). Zaldua et al. (2018) assessed the differences between cyclic and linear poly (L-lactide) (PLLA) and poly (D-lactide) (PDLA). These authors evaluated not only the topological differences but also the stereochemistry. Ring closure click chemistry methods were employed to prepare the cyclic samples, whereas ring-opening polymerization was used to prepare linear ones (reference (Zaldua et al., 2018)). All samples with equal number average molecular weight (Mn ∼ 14000 to 16700 g/mol) were systematically characterized, including SSA protocols. Zaldua et al. (2018) employed an SSA protocol starting, for all the samples, with the highest Ts, ideal = 155.5°C (of the material with the highest Tm), using a ΔTs = 5°C, and 10 cycles of fractionation. The melting traces recorded during the final heating of the SSA protocol are shown in Figure 4A.
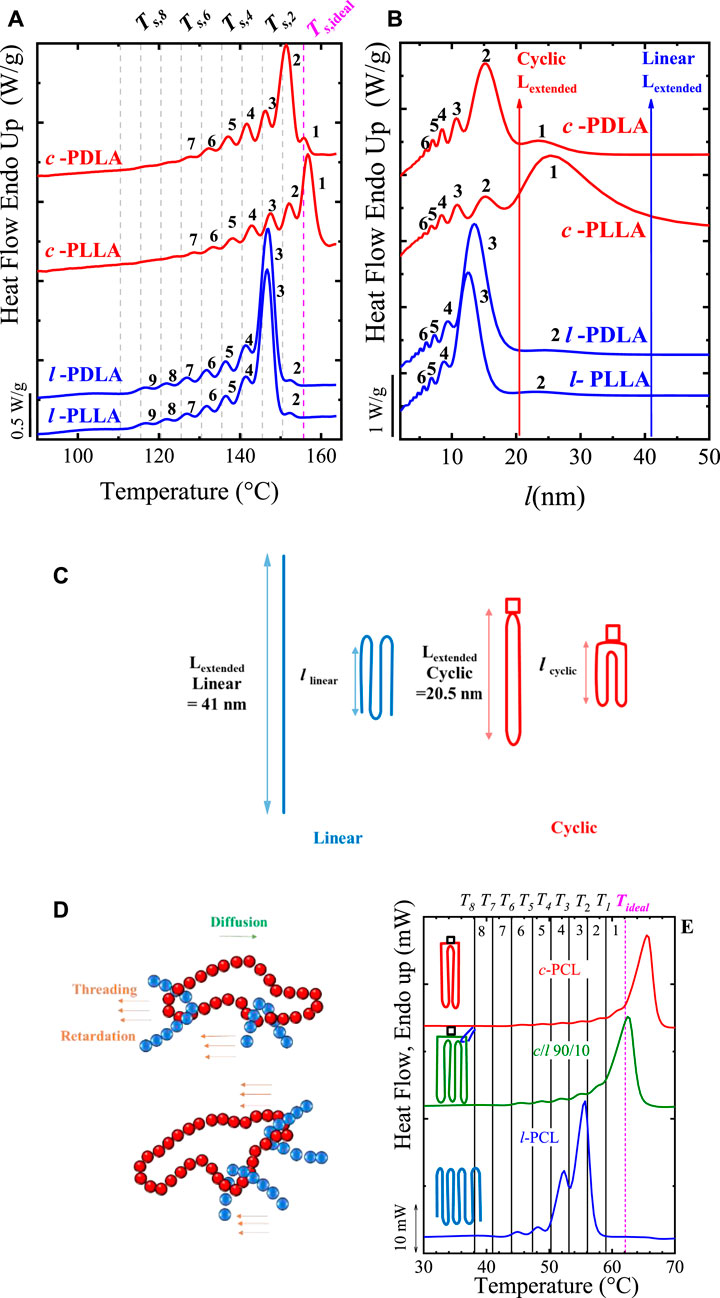
FIGURE 4. SSA profiles for all the samples as a function of (A) temperature and (B) lamellar thickness (l). In (C), the schematic representation shows the differences between the extended chain in cyclic polymers and the once-folded chain conformation in linear ones. In (D) Schematic representation of the threading effect; (E) SSA profile for l- and c-PCL (of 3 kg/mol) and the 90/10 c/l-PCL blend (ΔTs = 5°C). In Figures 4A and E the vertical lines indicate the Ts employed. Figures 4A to C Adapted from (Zaldua et al., 2018). Figure 4D Adapted from (Ruiz et al., 2021), and Figure 4E Adapted from (López et al., 2016).
Figure 4A clearly shows that the c-PLLA and c-PDLA display a higher annealing capacity than their linear analogous, i.e., l-PLLA and l-PDLA. The cyclic polymers can be fractionated up to Fraction 1, whereas linear ones only up to Fraction 2, due to kinetics, i.e., the lower entanglement density of cyclic polymers plays an important role in facilitating annealing.
Zaldua et al. (2018) carefully determined the equilibrium melting temperature, Tm°, using the Thompson-Gibbs (Strobl et al., 2007) equation (for linear polymers) and its modified version for cyclic polymers (Su et al., 2013), expressed in Eqs 1, 2. Note that the modified Thompson-Gibbs equation (Eq. (2)) considers that the entropies of the cyclic and linear chains in the melt are not the same (Su et al., 2013; Zaldua et al., 2018).
where Tm° is the equilibrium melting temperature, Tm°L is the linear polymer’s Tm°, and ΔScyc is the cyclization entropy difference between the crystalline and melt state. Δhf° is the enthalpy per volume of a perfect crystal (100% crystalline), σe is the fold-free energy, and l is the lamellar thickness. Experimentally, SAXS measurements were performed, at RT, after crystallizing the material at selected isothermal temperatures, Tc,iso, for 24 h, obtaining l as l = Xv. d*, where Xv is the crystal volume fraction, and d* is the long period. Next, the experimental Tm values of the samples crystallized at the selected Tc,iso was plotted against the inverse of l, 1/l. Then, the extrapolation to an infinite l, i.e., 1/l ∼ 0, leads to Tm°. Independently of the stereochemistry, it was found Tm° (linear) ∼ 159°C and Tm°(cyclic) ∼ 164°C, probing that the Tm° (cyclic) > Tm°(linear), in line with other cyclic and linear polymers (Tezuka et al., 2008; Kitahara et al., 2011; Takeshita et al., 2012; Su et al., 2013; Ruiz et al., 2021). This result also proves that stereochemistry does not influence the Tm°. The values of ΔScyc = −2 J/kg.K and σe ∼ 13 to 15 mJ/m2 (linear) and 12 to 13 mJ/m2 (cyclic) were obtained (Zaldua et al., 2018).
Zaldua et al. (2018) plotted the final SSA heating using the lamellar thickness l instead of temperature in Figure 4B. The transformation of the x-axis from temperature to l was performed using the Thompson-Gibbs equation, correlating the Tm,SSA of each fraction with its l values. As shown in Eqs 1, 2, Thomson-Gibbs consider the Tm°, which is different (164°C (cyclic) vs. 159°C (linear)) for cyclic and linear PLLA. As a result, in Figure 4B, Fractions 1 and 2 are in the same range of l (20 to 30 nm) due to the different supercooling, ΔT. The vertical lines in Figure 4B indicate the calculated value of the extended linear chain ∼ 41 nm, and the cyclic one, one-half of the linear, ∼ 20.5 nm. The extended vs. folded chains are illustrated with cartoons in Figure 4C. According to these limits, Fraction 1 for cyclic samples reaches the limit of 20.5 nm, indicating that these chains may crystallize with extended chains (note that Fraction 1 is between 20 to 30 nm). On the other hand, those linear chains in Fraction 2 (highest fraction for linear PLLA) do not reach the extended chain, ∼ 41 nm, indicating that they crystallized at least one-fold, unable to extend fully. Thus, this interesting analysis suggests that the full extension of cyclic chains is facilitated by the lower density of entanglements, in line with previous works (Pérez-Camargo et al., 2017; Zaldua et al., 2018).
2.1.3.1 Topology effects: Threading effect provoked by small amounts of linear chains in cyclic/linear polymer blends
We have included the cyclic/linear polymers blends in this section, on the one hand, for comparison purposes and on the other hand, because cyclic polymers might be contaminated with linear traces when the purification process is not efficient enough. Blending cyclic polymers with small amounts of linear ones generates the so-called threading effect. The cartoon in Figure 4D illustrates the threading effect: “threading refers to the action of linear chains that can reptate and thread through cyclic ones, thereby joining several chains together thus affecting diffusion and relaxation times” (Ruiz et al., 2021). This hinders or limits the nucleation and diffusion of the chains. It is worth noting that such threading effect is not limited to purposely prepared cyclic/linear blends. It can even affect cyclic polymers that have not been purified (removing linear traces) efficiently (Pérez-Camargo et al., 2017; Haque and Grayson, 2020; Liénard et al., 2020; Tezuka, 2020); thus, as the below results indicate, the purity of cyclic chains is essential. The threading effect was firstly reported by Kapnistos et al. (2008) in blends of cyclic/linear polystyrene, PS. Later, threading effects have been found in c-PCL/MWCNT-g-l-PCL (Pérez et al., 2014b), c-PCL/l-PCL (López et al., 2016), and c-PLLA/l-PLLA blends (Ruiz et al., 2021). In all the cases, the most significant threading effect was found with a small amount of cyclic chains. From these studies, López et al. (2016) performed SSA experiments. These authors prepared c-PCL/l-PCL blends in solution with 95/5, 90/10, and 80/20 compositions and two sets of Mn (3 and 12 kg/mol). It is worth noting that the cyclic samples were carefully synthesized by click chemistry in previous works (see references (Laurent and Grayson, 2006; Hoskins and Grayson, 2009)). López et al. (2016) found that these blends do not follow a simple rule of mixing in their crystallization properties, and instead display a strong negative deviation for a small amount of linear chains, i.e., 5 and 10 wt%, and then a recovery of such deviation for a higher amount of linear chains, i.e., 20 wt%. The negative deviation is reflected in a decrease of Tc and Tm, crystallinity degree, spherulitic growth, and overall crystallization rates compared with the neat c-PCL, independent of Mn. The SSA behavior is shown in Figures 4D,E.
Figure 4E shows that the annealing capacity of the c-PCL is remarkably higher than that of the l-PCL. Note that a fractionation profile up to Fraction 1 is produced in the c-PCL, whereas only up to Fraction 3 is produced for l-PCL. But when 10 wt% of l-PCL is added to the c-PCL, the Fraction 1 (produced by T1) is suppressed, due to the threading effect (see cartoon into Figure 4E and Scheme in Figure 4D). The reported threading effect causes this reduced annealing capacity (see illustration in Figure 4D). It can be hypothesized that linear chains thread through cyclic ones, creating extra entanglement points (incrementing the entanglement density of the c-PCL chains) that hinder the nucleation and diffusion of the chains (Ruiz et al., 2021). As a result, the new entanglements limit the annealing capacity of the c-PCL in the blend. Probably the threading effect affects, in the same way, the SSA fractionation of other reported cyclic/linear polymer blends (Kapnistos et al., 2008; Pérez et al., 2014b; Zaldua et al., 2018; Ruiz et al., 2021). Overall, the SSA fractionation has been demonstrated to be decisive in unveiling the role of the chain topology.
2.1.3.2 Topology effects: Linear, stars, and comb copolymers
In this section, for illustrative purposes, we show how different topologies (in this case, branching) affect the thermal fractionation of copolymers. Pérez-Camargo et al. (2019) studied poly (ethylene sulfide)-co-(propylene sulfide), PSx-ESy copolymers with x and y, indicating the degree of polymerization (DP). Apart from the DP, the topology was also varied: linear (L), stars (S), and combs (C) with a different number of arms. The C_(PS15-ES15)10 denotes a comb copolymer with 10 arms, in which both segments have a DP = 15. In all the studied copolymers, the ES segment is crystallizable, and the PS one cannot crystallize. As shown in Figures 5A,B, the analysis of non-isothermal DSC scans is complicated for these systems due to the broadness of the exothermic and endothermic peaks. By applying the SSA protocol, on the one hand, sharp peaks are obtained, allowing to gain further information on the thermal behavior of these materials. On the other hand, as shown in Figure 5C, the various topologies and DP differences greatly affect the SSA profiles. For these materials, the authors employed the highest Ts, ideal = 111°C (linear sample (La) with DP = 30), ΔTs =10°C, ts = 5 min, and scanning rates of 20°C/min.
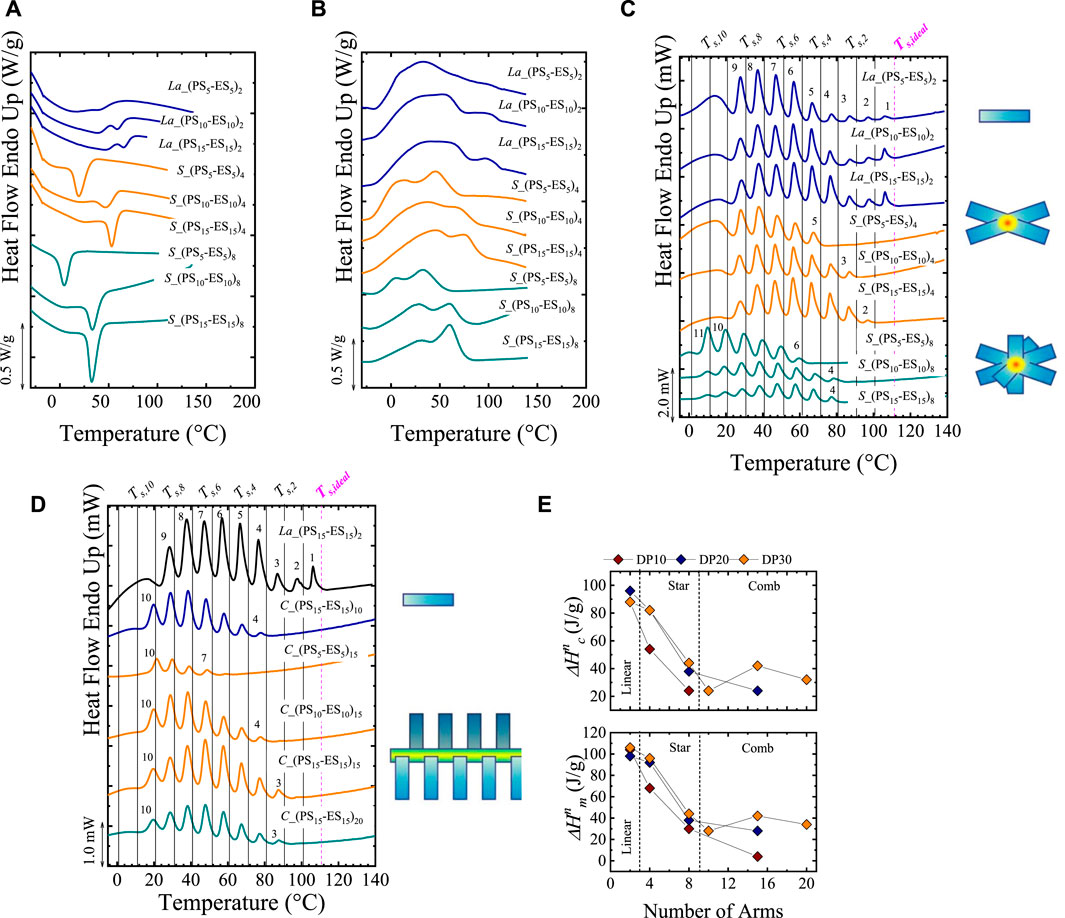
FIGURE 5. (A) Cooling and (B) Second heating DSC scans for linear (La), Star (S) and comb (C) copolymers. In (C) the SSA profiles of L, S and C copolymers are plotted. In (D) SSA profile for linear (L) and comb (C) copolymers; At the right of (C,D), the different topologies are represented by cartoons. The vertical lines in (C,D) represented the employed Ts. (E) Normalized crystallization and melting enthalpies (extracted from non-isothermal DSC scans) for linear, star, and comb copolymers, as a function of the number of arms. Figure 5 Adapted from (Pérez-Camargo et al., 2019).
Figure 5C compares the final heating runs after SSA for linear copolymers with the star copolymers with 4 and 8 arms. For the three systems (linear, 4-arm star, and 8-arm star), the DP varies from 10 to 30 per arm. The linear polymers are free of topological restrictions; thus, the polymer chain size is the main factor affecting crystallization. In the SSA results, it is observed that the number of fractions is independent of DP (note that the highest fraction (i.e., fraction 1) is present in all the cases). However, as DP increases, the areas under the highest fractions increase, indicating that the longest crystallizable sequences of the ES segments (fractions 1–3) are more abundant with increasing DP. For the stars, the crystallization can only occur at the side chains: their main chain is atactic. As a result, the arms represent topological restrictions since there is a “convergent crowding” around branching points. This crowding limits “the conformational freedom of the chains, reducing their flexibility and diffusion, and hence decrease their ability to crystallize compared to linear analogous.” The topological restriction inherent to stars is evident in the SSA profile, in which the highest fraction 1 disappears. In principle, the linear and star copolymers have the same primary structure. As expected, as the number of arms increases, the topological restrictions should be maximum at the junction points, increasing confinement and thus, hindering the ES segment’s crystallization. As a result, by comparing linear, 4- and 8-arm stars with the same DP = 30, it is observed that the highest fraction is the number 1 for the linear copolymers, whereas the highest fractions for the stars are fractions 2 and 4 for the 4- and 8-arm stars, respectively. Finally, in the stars, the DP affects fractionation differently than in linear copolymers. Figure 5C clearly shows that some higher melting point fractions are recovered upon increasing DP. Upon increasing arm length, the topological constraints are gradually released, allowing the crystallization of longer ES segments and thus the generation of higher Tm, SSA (i.e., highest fraction).
Figure 5D compares the SSA profile for linear and comb copolymers. In the combs, similarly to the stars, crystallization occurs in the side chains. The comb with 10 arms behaves like the stars. But, in the combs with 15 and 20 arms, as reflected in Figure 5E, a higher crystallinity (compared with star copolymers) is obtained, explained by the different packing densities of the side chains. Pérez-Camargo et al. (2019) argue that the side chains in the combs experience a “parallel crowding” which allows the chains to gain some order facilitating the intramolecular crystallization. These differences in chain packing explain how at high DP, e.g., DP = 30, the highest fraction increases as the number of arms increases in the combs, instead of decreasing as in the stars. On the contrary, at low DP, e.g., DP = 10, as the number of arms increases, the crystallinity decreases, in analogy with the stars. Through the SSA analysis, Pérez-Camargo et al. (2019) demonstrated how the topology (i.e., branching) influences the assembly of these copolymers.
2.2 Nanocomposites: Super-nucleation, anti-nucleation, and pre-freezing effects
The interactions between the nanofiller and the polymeric matrix in nanocomposites can have different effects on the crystallization kinetics and on the melting behavior, as recently reviewed (Altorbaq et al., 2022). Often, the fillers will nucleate the polymer matrix as evidenced by the higher nucleation density, higher Tc, and faster crystallization kinetics (compared to the neat polymer) without affecting its melting behavior. In a few cases, the filler can nucleate the polymer matrix beyond its own capacity (i.e., Tc higher than that generated at Ts, ideal) due to a supernucleation effect. For the supernucleating agents, in some cases, more stable crystals are formed, leading to higher melting temperatures. SSA detected more stable crystals in the past in HDPE/Multi-Walled Carbon NanoTubes (MWCNT) (Müller et al., 2015). In contrast, due to “unfavorable” interactions, the fillers can generate an anti-nucleating effect. Below, we show how these contrasting effects affect the thermal fractionation of the samples.
2.2.1 Supernucleation effect: Fractionated peaks vs. unfractionated peaks
Colonna et al. (2017) prepared nanocomposites based on poly (butylene terephthalate), pCBT, through the ring open polymerization of cyclic butylene terephthalate in the presence of 10 wt% reduced graphene oxide (RGO), i.e., pCBT + 10% RGO. An annealed RGO at 1700°C for 1 h was also employed, i.e., pCBT + 10% RGO_1700. The authors found that the inclusion of RGO acts as a supernucleating agent for the pCBT, and nucleation efficiencies (NE) (see equation derivation in (Fillon et al., 1993; Fillon et al., 1994)) up to 270% were obtained, increasing pCBT crystallization rate and shifting its Tc to significantly higher values. In addition, they found the formation of thick α-crystalline form pCBT lamellae, evidenced by the appearance of a melting peak located at circa 250°C, close to Tm°. These authors performed SSA experiments to study the nature of this remarkably high Tm value. They obtained a Ts, ideal = 227°C for the “standard” pCBT. Next, to investigate the high Tm, they performed the fractionation from 252°C down to 197°C (note that the Ts = 252°C is obtained by adding five steps at Ts above the Ts, ideal = 227°C) and using a ΔTs = 5°C, and ts = 1 min to limit the thermal degradation. The SSA reveals that the high Tm (covered by Ts = 252°C to 242°C) and standard Tm (covered by Ts = 227°C to 197°C) can be fractionated, as shown in Figures 6A,B. The fractionation of the high Tm (see Figure 6B) proves that the nature of this crystalline population is related to real crystals that can thus be annealed and fractionated. WAXS experiments in pCBT + 10%RGO_1700 reveal the persistence of the main signal of the pCBT at temperatures higher than the standard melting of the pCBT. This WAXS signal corresponds to the most stable peaks of the pCBT α-form. Colonna et al. (2017) roughly converted the temperature (from the SSA fractionation) to lamellar thickness using the Thomson-Gibbs (Strobl et al., 2007) equation (see Eq. 1). It was found that the lamellar thickness of the high-temperature peaks reaches ∼ 20 to 32 nm, corresponding to the completely extended chain (L= 32 nm). These values are 4 to 6 higher than those calculated (3 and 6 nm) from the “standard” fractionation of the pCBT. Thus, Colonna et al. (2017) claimed that RGO nanoflakes could nucleate and “induce a very regular arrangement of chains into highly stable crystals, most likely starting their organization from the polymer/nanofiller interface.”
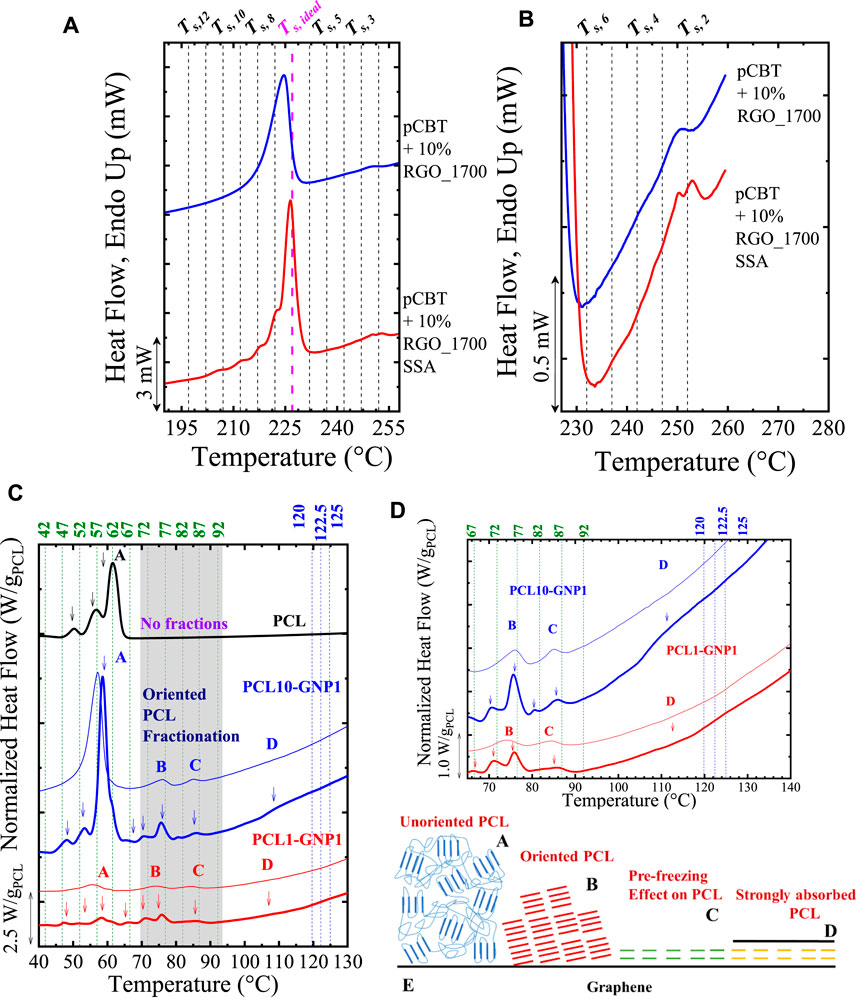
FIGURE 6. (A) SSA profile vs. standard second heating scan for the pCBT + 10%RGO_1700. In (B), the fractionated region at high temperatures is zoom-in, evidencing the obtainment of fractions at high temperatures. In (C) SSA profile of PCL, PCL10-GNP1, and PCL1-GNP1. The fractionation at high temperatures and with ΔTs = 2.5°C is indicated with blue lines, whereas the second fractionation at lower temperatures and ΔTs = 5°C is indicated with green lines. The vertical lines in (A–D) indicated the Ts employed (see the top of the Figures). The peaks have been labeled with the letters A, B, C, and D, depending on its nature (see (C–E). In (D), a zoom of the SSA profile for Peaks B to (D) In both (C,D) the thinner lines indicate the DSC traces of unfractionated samples. In (E) is presented an illustration of the possible origin of Peaks A to (D) Note that the weight of the PCL normalized all the curves (C,D) of each sample. Figures 6A and B Adapted from (Colonna et al., 2017), and Figures 6C to E Reproduced from (Li et al., 2021b).
Interestingly, Li et al. (2021b) found a contrasting behavior in a different system since high Tm peaks do not correspond to the fully extended chain. These authors prepared nanopapers based on graphite nanoplates (GNP) using polycaprolactone, PCL, as a binder: PCL/GNP nanopapers. The PCL adhesion is excellent, and the GNP flakes have strong nucleation on the PCL, reflecting the shift in Tc of ∼ 20°C in the PCL/GNP (Tc = 46.9°C) compared with the neat PCL (Tc = 27.9°C) in non-isothermal DSC experiments. Besides the nucleation effect, the GNP promotes different PCL organization levels on the GNP surface, reflected in different exothermic and endothermic signals. These signals, from low to high temperatures, were arbitrarily named Peak A, B, C, and D. The displayed signals are: Tc = 46.9°C, Tm = 57.3°C (Peak A), Tc = 58.4°C, Tm =74.8°C (Peak B), Tc = 76.4°C, Tm = 84.5°C (Peak C), and Tc = 115°C, Tm = 120°C (Peak D). Endothermic peaks B to D are remarkably high, similar to or even higher than the reported Tm° for PCL (Li et al., 2021b). In most of the cases, Tm° is in the range of 59.8 to 80°C (Pérez-Camargo et al., 2017), and only few works have reported Tm° values as high as 80 or 98°C (Strobl, 1999; Shin et al., 2011; Su et al., 2013).
The nature of each peak was elucidated by its fractionation capacity under SSA experiments. With this aim, the fractionation was focused on Peaks D to B, and a combined protocol was employed. First, the fractionation for peak D starts at Ts = Tm, end = 127°C, using ΔTs = 2.5°C covering the narrow range area of the peak D transition. Next, the peaks at lower temperatures were fractionated, using Ts = Tm, end (peak C) = 92°C, with a ΔTs = 5°C, and covering the range of 92 °C to 42°C (see more details in Reference (Li et al., 2021b)). As shown in Figures 6C–E, the peaks A to D behaves differently.
Figure 6C shows the SSA profile for neat PCL and the PCL10-GNP1 (10:1 PCL:GNP ratio; estimated PCL content (TGA) ∼ 20 wt%) and PCL1-GNP1 (1:1 PCL:GNP ratio, estimated PCL content (TGA) ∼ 6 wt%). The peak positions are similar for the PCL10-GNP1 and PCL1-GNP1, but each fraction’s area is lower for the PCL1-GNP1 due to the lower PCL content and probably a higher confinement effect (Lorenzo et al., 2006). Independently of the composition, Figure 6C shows that Peak A can be fractionated in its highest fractions, at Ts < 67°C. The well fractionated Peak A corresponds to the standard fractionation of PCL crystals (note that the same fractions are observed for neat PCL). The Ts encompassing Peak B (∼75°C) can generate thermal fractions corresponding to PCL crystals that reach large lamellar thickness due to the GNP surface. Interestingly, the highest Tm, SSA caused by the thermal fractionation of Peak B, comes at a value of ∼78°C, comparable to the upper limit of the Tm° range for PCL reported in the literature.
Peak B represents the melting of crystals with a certain level of orientation induced by the GNP surface, as revealed by wide-angle X-ray scattering (WAXS) experiments. At room temperature, all the different organizational levels taken by the PCL (see Figure 6E) coexist, which is observable in the WAXS patterns. The reflections commonly reported in the literature correspond to the unoriented PCL crystals (that melt in Peak A): (Pérez et al., 2014b) (q = 15 nm−1) and (200) (q = 16.5 nm−1) planes (Bittiger et al., 1970; Chatani et al., 1970; Hu and Dorset, 1990). Interestingly, other reflections (not commonly reported) appear and are associated with oriented PCL crystals (that melt in Peak B). These reflections corresponds to: (Kitahara et al., 2011)/(003) (q = 11 nm−1) and (Takeshita et al., 2012) (q = 13.6 nm−1) PCL planes, and they are more visible when the unoriented PCL melts, and hence its reflections disappears (Bittiger et al., 1970; Chatani et al., 1970; Hu and Dorset, 1990). Further understanding of these uncommon reflections was obtained by WAXS experiments under transmission configuration, revealing an azimuthal profile for PCL10-GNP1, confirming the orientation on the PCL related to Peak B.
Melting peaks C (Ts ∼ 85°C) and D (Ts ∼ 120°C) cannot be fractionated. The absence of fractionation indicates that these transitions do not correspond to crystals that can be annealed. Fina et al. (Li et al., 2021b) found that Peak C corresponds to the pre-freezing phenomena, understood as “the formation of crystalline prewetting layer occurring under equilibrium condition above Tm” (Flieger et al., 2018). This phenomenon depends on the interfacial energy differences between the substrate, melt, and crystals (Tournier and Ojovan, 2021). The pre-freezing phenomena were reported before by Thurn-Albrecht et al. (Flieger et al., 2018; Tariq et al., 2020) in monolayer PCL on substrates of fleshly cleaved highly oriented pyrolytic graphite (HOPG) (Flieger et al., 2018) and onto molybdenum disulfide (MoS2) (Tariq et al., 2020), obtaining melting peaks for PCL at 84 °C (HOPG) and 80°C (MoS2), in line with melting Peak C. Peak D might have its origin in the pre-freezing phenomena between graphite layers, increasing the substrate-polymer interactions and hence the Tm, or in a strongly absorbed layer of PCL on the GNP surface that forces PCL crystallization in extended chain conformation, thus, explaining the absence of fractionation. In both cases (Peaks C and D) the diffraction volume was insufficient to generate reflections in the WAXS studies. Probably the signals for these peaks were overlapped by the ones of Peak A and B with higher diffraction volumes.
The key message of the works of Colonna et al. (2017) and Li et al. (2021b) is that the strong interactions between filler-polymer can derive in: 1) highly stable crystals with Tm, SSA values approaching Tm° that can be fractionated, or 2) other transitions such as pre-freezing phenomena or significantly absorbed material on the surface reflected in Tm, SSA > Tm° and the absence of fractionation.
2.2.2 Antinucleation effect: Specific interactions
In some cases, filler-polymer interactions lead to antinucleation effects, which could be reflected in the fractionation capacity of the material under the SSA protocol. Pérez–Camargo et al. (2015) studied lignin-grafted-PCL (lignin-g-PCL) copolymers, varying the lignin content (2 to 37 wt%) and the average arm length (AAL). The prepared materials have the following terminology: PCLxy, where the subscript x refers to the approximate lignin content, and the superscript y to the approximate AAL of the multiple PCL grafted chains. The effect of increasing the AAL is in line with the increase of the molar mass. For the same AAL, it was found that lignin behaves as an excellent nucleating agent, with NE close to 100%, or reaching, at low lignin contents (2 to 5%), NE > 100%, thus, acting as a supernucleating agent. Low lignin contents (< 18 wt%) increase Tc and Tm and accelerate the overall crystallization rates. But at lignin contents > 18 wt%, the opposite behavior was found, with the appearance of an antinucleation effect (NE < 0%). The antinucleation effect decreases Tc and Tm, reduces crystallinity degree, and retards the overall crystallization kinetics.
The evaluation of the SSA final heating scans revealed opposite behaviors, as illustrated in Figures 7A,B. Pérez–Camargo et al. (2015) performed SSA experiments in all the materials using the highest Ts, ideal (Ts, ideal = 56°C) among all the materials as starting Ts for all the tests (criteria suggested by Müller et al. (2015)), ts = 5 min, ΔTs = 5°C and using 6 different Ts, i.e., 6 SSA steps. The 6 SSA steps generated 5 fractions since the starting Ts does not generate any annealing.
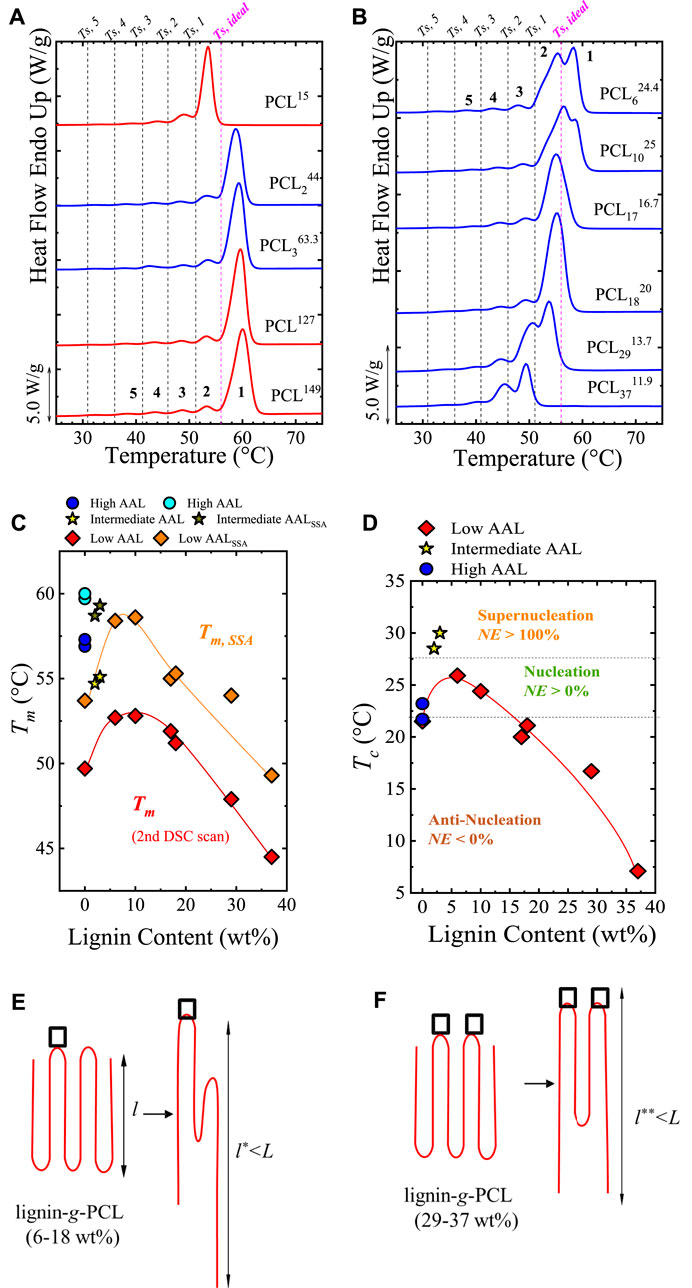
FIGURE 7. SSA profile for (A) neat PCLs and PCL244, PCL363.3 (low lignin content), and (B) lignin-g-PCL with lignin contents > 3 wt%. The vertical lines in (A,B) represent the Ts employed, and the generated fractions are labeled. The neat PCLs are indicated with red color, and the lignin-g-PCL materials in blue color. In (C), the Tm obtained after SSA (Tm,SSA) and before SSA (Tm) are compared, and the trend with lignin content is displayed. The trend in (C) is in line with the Tc vs. lignin content represented in (D), in which dashed horizontal lines are employed to indicate the supernucleation, nucleation, and antinucleation effects. In (E,F), it is schematically illustrated one possible way for PCL chains in lignin-g-PCL to undergo thickening during annealing. The not–to–scale square represents hydrogen bonding between PCL and lignin. Acting like physical crosslinks, they prevent chain segments around them from entering PCL crystals: (E) intermediate lignin contents with a low density of hydrogen bonds and (F) high lignin contents with a higher density of hydrogen bonds. Figure 7 is adapted from (Pérez–Camargo et al., 2015).
Figure 7A compares the lignin-g-PCL copolymers with lower lignin content (PCL244 and PCL363.3) with PCL with different AAL. For the PCLs, it is observed that fraction 1 disappears for the PCL15, due to its much lower average molar mass but remains in the PCL149 and PCL127. The fractionation for the PCL244 and PCL363.3 is similar to the PCL149 and PCL127. The supernucleating effect, in this case, of the lignin in the PCL does not generate highly stable crystals or other transitions as reported above in pCBT-RGO (Colonna et al., 2017) and PCL/GNPs (Li et al., 2021b), respectively.
Figure 7B shows that for lignin content of 6–37 wt%, progressive depletion of the highest melting fraction (fraction 1) is observed as lignin content increases until the fraction disappears at 17–18 wt%. For lignin content of 29 wt%, fraction 2 is the most important in terms of area; then, for lignin content of 37 wt%, even fraction 2 disappears, leaving fraction 3 as the dominant one. For clarity, Figure 7C plots the Tm vs. Lignin content, comparing Tm, SSA and Tm, summarizing the trend explained above. The differences between Tm and Tm, SSA is caused by the annealing induced by the SSA process. The trend in Figure 7C is in line with other properties, e.g., Tc, and 1/τ50%, as illustrated in Figure 7D, with Tc vs. lignin content plot. In Figure 7D, the limits of the supernucleation, nucleation, and anti-nucleation are indicated. Pérez–Camargo et al. (2015) explained the antinucleation effect through the formation, at high lignin contents (29 and 37 wt%), of intermolecular hydrogen bonding between carbonyl groups of PCL and phenolic and aliphatic hydroxyl groups of lignin, as found by Laurichesse and Averous (Laurichesse and Avérous, 2013) in FT-IR experiments. Furthermore, these authors also found strong interactions resembling cross-linked-like polymers for these samples with rheological measurements (Laurichesse and Avérous, 2013). Thus, during the SSA experiments, at intermediate and high lignin content, the hydrogen bonds can act as a physical crosslinking that limits lamellar thickening [see cartoon in Figure 7E (intermediate lignin content) and Figure 7F (high lignin content)]; interestingly these hydrogen bonds can survive after successive annealings. Similar limitations have been found due to the threading effect in cyclic/linear PCL blends (López et al., 2016) (see Section 2.1.3.1). It is worth noting that another minor factor that might contribute to this behavior is the steric effect present near the PCL grafted to lignin, which also tends to increase as lignin content increases. This effect is reported for different chain topologies (linear, stars, and combs copolymers) (Pérez-Camargo et al., 2019), as illustrated in Section 2.1.3.2. In addition, despite the confinement effect at high lignin contents can have its influence, in this case, its effect is minor due to the absence of a reduction in the Avrami index upon crystallization. The different trends related to the Avrami index can be found in Reference (Pérez-Camargo et al., 2022).
Overall, the evolution of the crystallization behavior with lignin content results from the competition between nucleation and intermolecular hydrogen bonding formation. The nucleation effect predominates at low lignin content, reaching a saturation around 5 wt%. Next, the intermolecular interactions increase as lignin content increases, generating an antinucleation effect, in which the hydrogen bonds limit nucleation and chain diffusion.
2.3 Copolymers: Random copolymers, block copolymers, and triblock terpolymers
2.3.1 Random copolymers
Recently, SSA experiments have been used as a complementary tool to elucidate the crystallization mode in random and multi-block copolymers. Random copolymers can crystallize with three modes: isomorphism, isodimorphism, and comonomer exclusion. These crystallization modes depend on the copolymer’s comonomer exclusion/inclusion balance. Scheme 3A shows how these crystallization modes behave in temperature vs. comonomer content plots (considering a P(A-ran-B) copolymer as an example).
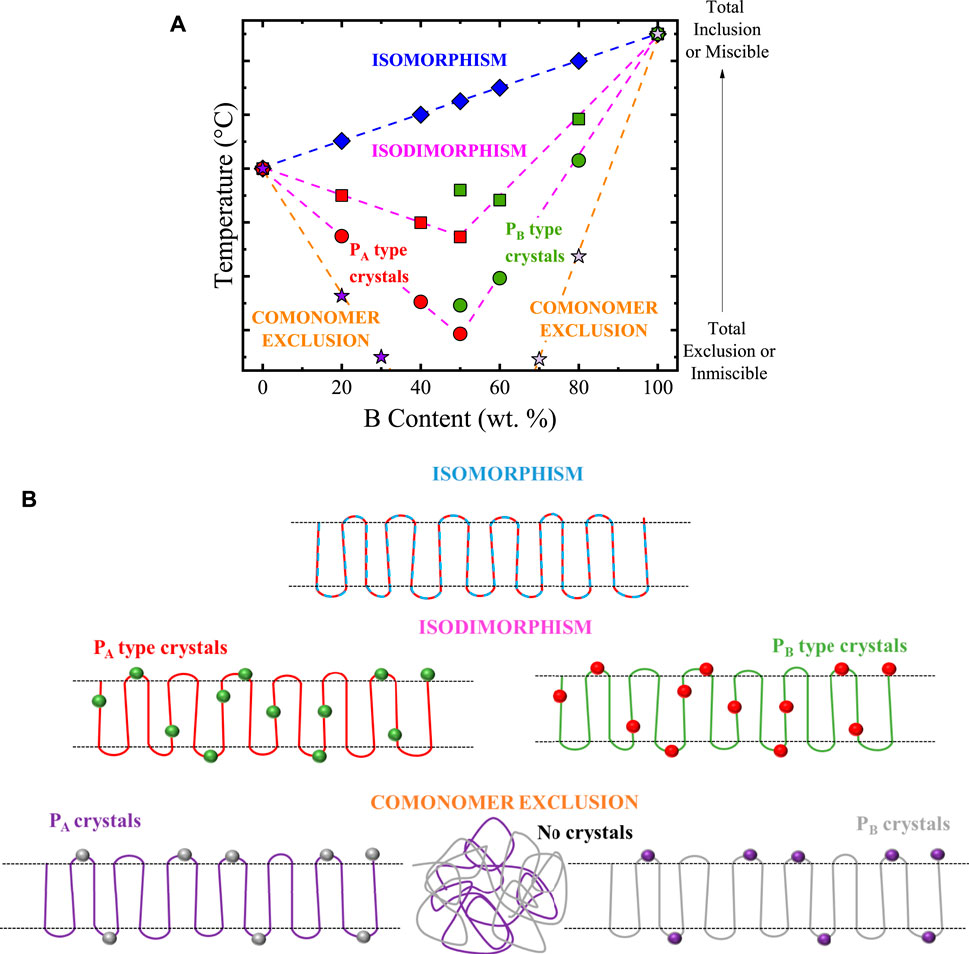
SCHEME 3. (A) Melting (or crystallization) temperature vs. comonomer content for different possible crystallization modes in random copolymers. From top to bottom, four cases are represented: isomorphic behavior, isodimorphic behavior for copolymers with a small amount of comonomer exclusion, isodimorphic behavior with a large amount of comonomer exclusion, copolymers with total exclusion of the second comonomer. All the cases in (A) are illustrated with cartoons in (B). Scheme 3 is adapted from (Pérez-Camargo et al., 2018).
Scheme 3A,B illustrate the different crystallization modes depending on the crystalline phase’s comonomer exclusion/inclusion balance. To define the different crystallization modes, let us consider a random copolymer, P(A-ran-B). In Scheme 3A a linear increase in temperature as B content increases is obtained for the isomorphic case. A single unit cell is obtained for isomorphic copolymers due to comonomer A crystals allowing the total inclusion of comonomer B co-units (i.e., co-crystallization), as illustrated on the top part of Scheme 3B. This occurs only under specific conditions, as reviewed by Pan and Inoue (Pan and Inoue, 2009). The opposite case (illustrated at the bottom part of Scheme 3B) is observed when the crystals of comonomer A (PA crystals) do not allow the entrance of B co-units and vice-versa. The co-units expelled (to the amorphous region) will progressively hinder the crystallization until they prevent it completely (see No crystals in Scheme 3B). This is reflected in a rapid crystallization temperature decrease as the comonomer content increases (see Scheme 3A).
Isodimorphism can be regarded as a combination of isomorphism and comonomer exclusion since both comonomer inclusion and exclusion coexist. The excluded comonomer is responsible for decreasing the transition temperature, whereas the included one allows the material crystallization. This makes the temperature vs. comonomer content curve fall closer to the isomorphic case (more inclusion) curve or the comonomer exclusion (less inclusion) one, depending on the comonomer exclusion/inclusion balance (see Scheme 3A). In terms of crystallization, at compositions rich in comonomer A, the copolymer crystallizes as PA type crystals with B-co-units inclusion. In contrast, the opposite occurs in compositions rich in comonomer B, as illustrated in the middle part of Scheme 3B). There is a minimum point at which both crystalline structures can co-exist. This point is called the pseudo-eutectic point, and its position seems to depend on the chemical structure of the parent components, although further research is required.
2.3.1.1 SSA in isodimorphic random copolymers
So far, the SSA fractionation of some isodimorphic random copolymers has been analyzed. When the SSA profiles of the parent components and the isodimorphic random copolymers are compared, it is expected that the SSA profile of the latter display more fractions due to the interruptions of the crystallization sequences by the excluded comonomer, which act as a defect. In addition, at the pseudo-eutectic point, the presence of a bimodal profile might be expected.
Arandia et al. (2016) applied the SSA protocol to poly (butylene succinate-ran-butylene azelate), BSxBAzy copolymers. These copolymers were synthesized by a two-step melt polycondensation reaction (reference (Mincheva et al., 2013) for more details). The SSA protocol was designed considering the highest Ts, ideal = 116°C (Ts, ideal of the PBS) as starting Ts for all the materials. The number of cycles was set accordingly to the melting range of each material, and ΔTs = 5°C was selected. For instance, for the PBS, 10 cycles were employed (Ts between 116 to 71°C) whereas, for the BS58BAz42, 14 cycles were used (Ts between 76°C to 11°C). For the parent components, PBS and PBAz, fractionation is less effective because they are linear homopolymers; thus, only molecular segregation based on chain length differences and their intermolecular interactions (Section 2.1.1) are able to induce fractionation. The copolymers’ situation is different and depends on the crystallization mode. In principle, if both comonomers are equally incorporated inside the crystal lamellae (e.g., isomorphism), the SSA cannot fractionate the copolymers to a more significant extent (in terms of quality of the fractionation and relative amount of each fraction) than the homopolymers. But, if any molecular unit (e.g., excluded comonomer) interrupts the linear sequence of the crystallizable chain, then this change will be detected by the SSA protocol.
Figures 8A,B shows the SSA final heating scans for all the samples, including the parent components.
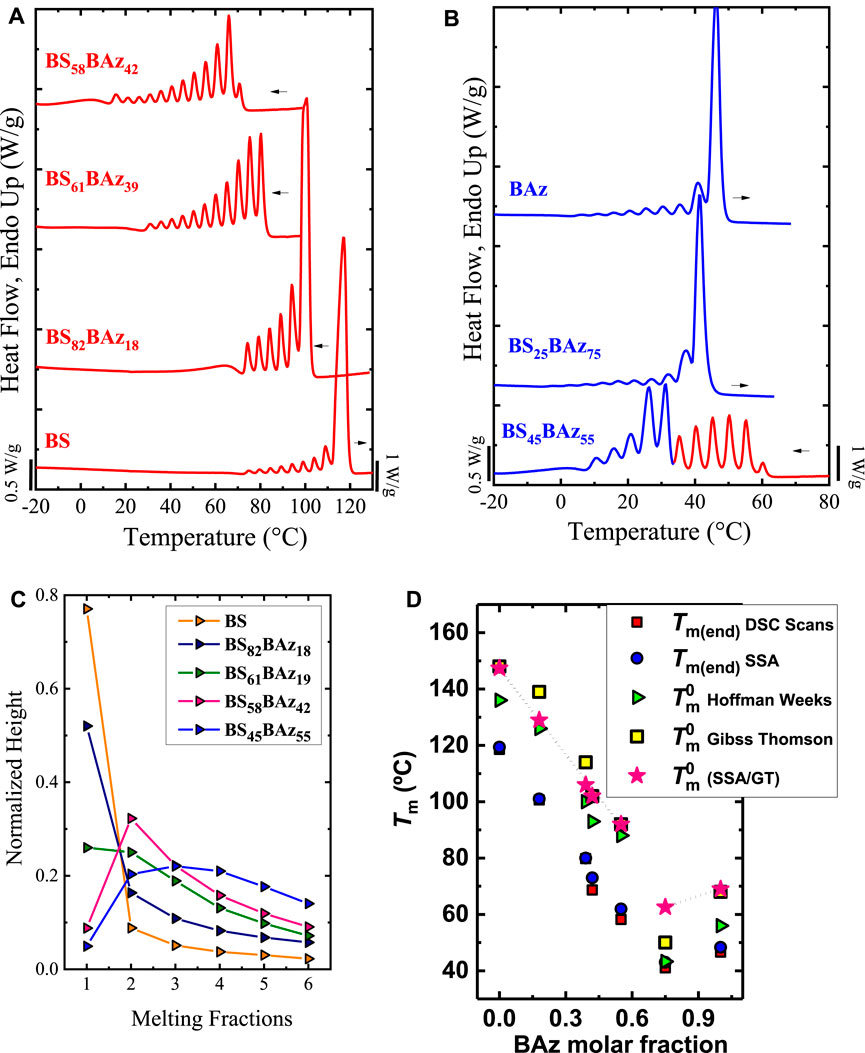
FIGURE 8. SSA profiles for (A) neat PBS and BS-rich compositions; (B) neat PBAz and BAz-rich compositions; and in (C) the evolution of normalized height vs. melting fractions is plotted for all BS-rich copolymers. In (D) Experimentally obtained end melting temperatures after SSA, Tm(end)SSA and equilibrium melting temperatures, Tm°, versus BAz content. The modified Tm(end)SSA values, see the text, are included and named Tm°(SSA/GT). Figures 8A to C are adapted from (Arandia et al., 2016). Figure 8D is reproduced from (Arandia et al., 2019).
Figures 8A,B shows that the BSxBAzy copolymers can be fractionated much more than the parent PBS and PBAz components. This indicates that when the PBS-rich phase crystallizes, it excludes many BAz co-units (and vice-versa) from growing crystals, generating molecular fractionation (see Figures 8A,B for BS and BAz-rich copolymers). It is well-known that chains with similar crystallizable chain lengths form each fraction. Thus, the higher Tm, the longer the crystallizable sequence length, and the larger the average lamellar thickness in the crystal belonging to the thermal fraction (see Figure 1D). With that in mind, it is observed that as the comonomer content increases, the Tm,SSA decreases due to the interruption of the crystallizable sequence. In addition, Arandia et al. (2016) measured the relative height of each fraction, which was normalized. They found that as the BS content decreases, the dominant fraction (at the highest Tm,SSA) loses importance, reducing its height at the expense of the other fractions. Thus, the dominant fraction gradually changes from high (fraction 1) to lower temperatures (e.g., fraction 2) as the comonomer composition change (see Figure 8C). These results evidence how the comonomer composition affects the SSA profile.
For the BS45BAz55, which corresponds to the pseudo-eutectic point, the SSA profile displayed a bimodal distribution of the melting points of the fractions (see Figure 8B). Those at the lowest Tm correspond to the Baz rich phase, whereas those at the highest temperature correspond to the BS rich phase. The bimodal profile is expected due to the ability of both components to crystallize. The crystallization at the pseudo-eutectic point can only be explained by a certain degree of comonomer inclusion. Otherwise, a high comonomer exclusion should lead to an amorphous copolymer, especially in a nearly 50:50 composition. WAXS/SAXS measurements supported all the findings of Arandia et al. (2016), concluding that the comonomer exclusion drives the fractionation ability of the samples in SSA experiments, and, considering that SSA promotes the segregation, the prevalence of isodimorphism indicates that it is relatively independent of kinetics factors.
The SSA technique has also been applied to other isodimorphic random copolymers, such as the poly (butylene succinate-ran-butylene adipate), BSxBAy copolymers. Pérez-Camargo et al. (2020a) found similar results as described above, with the BS40BA60 exhibiting a bimodal profile. Interestingly, for the BSxBAy copolymers, the comonomer exclusion/inclusion balance depends on the composition and crystallization conditions. For instance, Pérez-Camargo et al. (2020a) crystallized the BSxBAy copolymers under non-isothermal and isothermal conditions and employed SSA fractionation as an intermediate condition (note that SSA combines non-isothermal and isothermal steps). Focusing on the BS50BA50, the authors found that both crystal structures can crystallize only during non-isothermal crystallization, whereas for the BS40BA60, both structures can crystallize in all conditions. The authors also qualitatively proved by the normalized d-spacing that a higher inclusion occurred in non-isothermal conditions, the lowest inclusion at isothermal ones, while the SSA test represented an intermediate condition (Pérez-Camargo et al., 2020a). Thus, in this case, the SSA experiments also help in regulating the comonomer exclusion/inclusion balance in isodimorphic random copolymers.
2.3.1.2 Equilibrium melting point temperature (Tm°) alternative
The improvements in morphology and lamellar thickness provided by SSA and crystal refinement have been used to roughly estimate the Tm° of random copolymers. Arandia et al. (2019) evaluated the Tm° of the parent components (PBS and PBAz) and their BSxBAzy copolymers with the Hoffman-Weeks (HW) (Hoffman and Weeks, 1962) and Gibbs-Thomson (GT) (Hoffman, 1964; Gedde and Hedenqvist, 2019) extrapolations. The authors found that these methods display a significant scattering of the data for the copolymers (see Figure 8D) as a consequence of both experimental and extrapolation errors. Arandia et al. (2019) modified the end melting temperature after an SSA treatment, Tm(end)SSA, as an alternative to getting a smoother trend in the copolymers. This Tm(end)SSA represents the melt of thick lamellae promoted by the successive annealings. The modification consists of adding a constant value to the Tm(end)SSA. Considering the reliability of the Tm°GT values of the parent components (148°C (PBS) and 68°C (PBAz) the difference between the Tm° (parent components) and Tm(end)SSA of the copolymers was added to the corresponding phase (BS vs. BAz-rich phase): 29°C for the BS-rich copolymers and 20 C for the BAz-rich copolymers. The obtained values were named Tm°(SSA/GT) and plotted versus BAz content in Figure 8D.
Figure 8D shows a smoother trend (copolymer region) for the calculated Tm°(SSA/GT). Moreover, the Tm°(SSA/GT) values fall between the Tm° values extrapolated with the HW and GT models. The Tm°(SSA/GT) were employed to apply different comonomer exclusion/inclusion models: Flory (1955), Baur (1966), Sanchez and Eby (1975), and Wendling and Suter (1998). Using these models it was possible to determine that in the BS-rich copolymers, only a small inclusion of BAz-co-units into PBS crystals is possible. On the contrary, a more significant inclusion of BS-co-units is possible in the PBAz crystals of BAz-rich copolymers. Employing Tm°(SSA/GT) was crucial for such a conclusion, demonstrating the versatility of the SSA technique.
2.3.2 Isomorphic vs. isodimorphic copolymers
As shown in Scheme 3, an isomorphic copolymer should display a linear temperature increase as the comonomer content increases. It also should possess a single type of unit cell. However, these two characteristics might not be enough to define an isomorphic behavior.
Zhang et al. (2021) revised the crystallization behavior of poly (hexamethylene carbonate-co-hexamethylene urethane), PHCxUy, segmented block copolymers, which crystallization mode was previously (Shen et al., 2018) defined as isomorphic. In the first evaluation of these copolymers, single Tc and Tm values were obtained, displaying a linear increase with the composition, as shown in Figures 9A,B. Moreover, the WAXS and SAXS results do not reveal clear evidence of HC crystallization, indicating that all the compositions crystallize in a HU unit cell (see WAXS patterns in Figure 9C).

FIGURE 9. (A) Tc, and (B) Tm values versus [HU] content for PHCU copolymers. The scanning rates were 1 and 10°C/min; (C) 1D WAXS profile of PHCU copolymers cooled from the melt at 10°C/min and then measured at RT. The WAXS pattern of the PCDL was taken from reference (Shen et al., 2018). In (D) DSC heating scans for SSA fractionated PHCU copolymers and PUDL oligomer at 10°C/min. The shadowed region indicates the PC fractions. Figure 9 is adapted from (Zhang et al., 2021).
To revise the crystallization behavior, Zhang et al. (2021) designed an SSA protocol with ΔTs = 5°C, ts = 5 min, a scanning rate of 10°C/min, and the highest Ts, ideal = 158°C (PU) as starting Ts for all the materials. As shown in Figure 9D, the authors found that as the HU content decreases, the number of fractions increases, becoming sharper, which is not in line with isomorphism. Also, as the HU decreases up to 40%, a bimodal profile starts to be present. This is evident at the lowest HU contents, where the PC fractions at the lowest temperatures begin to be the dominant ones. Thanks to the SSA fractionation, the authors concluded that the PHCU copolymers are not isomorphic nor isodimorphic (e.g., they do not exhibit a pseudo-eutectic point), and instead, they exhibited complex co-crystallization behavior (Zhang et al., 2021). Such a complex crystallization behavior is related to a different chain distribution compared with random copolymers. In multiblock copolymers, as in olefin-based multiblock copolymers (OMBCs), the topological confinement and diluent effect (partial miscibility of hard and soft segments) influence the SSA profile, as recently found by Urciuoli et al. (2022).
As far as the authors are aware, the SSA protocol has not been applied in isomorphic random copolymers; thus, this topic needs further study. However, according to our experience, the SSA profile of the copolymer should be similar to that of the parent components. For instance, in precision polymers, ‘small’ defects can be incorporated into the unit cell without altering the thermal fractionation. This was found by Appiah et al. (2017), who studied precision polymers prepared by ADMET and subsequent hydrogenation, containing (cis/trans)-azo-benzene as defects within a polyethylene chain. The defects, bearing either o,o-dihydrogen (H-azo) or an o,o-difluorinated-azo (F-azo) moiety, were placed after 18 CH2 units. These moieties can photo-chemically switch between cis/trans configurations. Appiah et al. (2017) designed an SSA protocol, using ts = 5 min and ΔTs =10°C. The starting Ts were selected as the lower Ts in Domain I (Ts = 154°C) because these materials exhibited a direct Domain I to Domain III transition. A significant fractionation was not observed in the SSA profile, revealing that the defects are included within the lamellar regions of the sample. In addition, the Tm, SSA increases compared with the neat material, evidencing the defects inclusion. We can speculate that similar behavior might be observed for isomorphic crystallization, still, this topic needs further studies.
2.3.3 Triblock terpolymers
The molecular segregation capacity of the SSA technique has been crucial to elucidating the thermal behavior of triblock terpolymers. Palacios et al. (2019) studied PEO-b-PCL-b-PLLA triblock terpolymers. After crystallizing the terpolymer from the melt at a slow rate, 1°C/min, the subsequent heating DSC scan, at 20°C/min, reveals that the melting of the PLLA block takes place at around 120°C. The PCL and PEO crystals melt at lower temperatures at approximately 40 to 60°C. However, separating each block’s signal is impossible with the standard DSC cooling and heating scans. Hence, SSA experiments were carried out.
Palacios et al. (2019) designed the SSA protocol by using the Ts, ideal of the block that melts at the highest temperature, Ts, ideal = 143°C (PLLA), ts = 5 min, ΔTs = 5°C, and scanning rates of 20°C/min. The obtained SSA profile for the selected materials is shown in Figure 10.
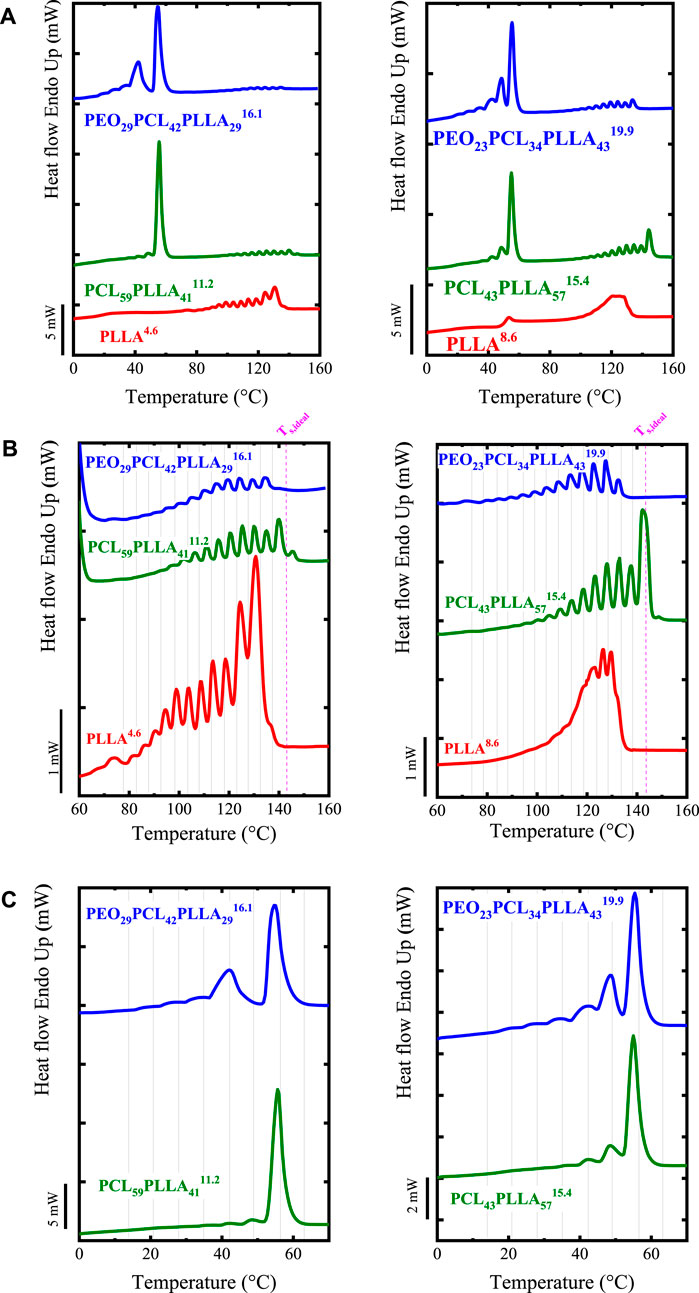
FIGURE 10. (A) SSA profiles for PEO-b-PCL-b-PLLA triblock terpolymers, PCL-b-PLLA diblock copolymers, and PLLA homopolymer; (B) Zoom of the PLLA fractionated zone; and (C) Zoom of the PEO-PCL and PCL fractionated zone. Figure 10 is adapted from (Palacios et al., 2019).
Figure 10 shows that the SSA technique can fractionate all the blocks. In the PLLA block, the fractions are more evident at higher PLLA content. The analysis of the PLLA block reveals that the Tm,SSA values are higher in the copolymers than in the neat PLLA due to the improved PLLA crystallizability caused by the PCL and PEO molten chains. In Figure 10C, the SSA treatment can separate the melting peaks of the PEO and PCL block in the terpolymer. In the range of 40 to 60°C, the peaks above 50°C are clearly due to the melting of the PCL crystals. By following in-situ the final SSA heating through WAXS experiments, it was found that the WAXS patterns of the PEO disappear first, followed by the PCL crystals, confirming the DSC/SSA findings. Thus, Palacios et al. (2019) found that the SSA technique was adequate in properly fractionating very complex systems, such as the three blocks in triple crystalline PEO-b-PCL-b-PLLA triblock terpolymers, revealing important information on the crystallization order.
2.4 Improving thermal transition signals: Solid-solid transitions and polyurethanes
The SSA experiments’ crystal thickening ability has also been exploited to study solid-solid transitions and the crystalline structure of polyurethanes, as illustrated below.
2.4.1 Solid-solid transitions
The solid-solid transitions have been a widely studied topic. Recently, Pérez-Camargo et al. (2021a), Pérez-Camargo et al. (2021b) found the δ to α transition in poly (hexamethylene carbonate) (PC6) and poly (octamethylene carbonate) (PC8). The DSC signal of this transition is weak under standard conditions. Thus, these authors applied alternative protocols (i.e., isothermal followed by non-isothermal scans (Pérez-Camargo et al., 2021b), and SSA protocol (Pérez-Camargo et al., 2021a)) to magnify and understand the nature of this transition. In a first work, Pérez-Camargo et al. (2021b) employed an isothermal test followed by a non-isothermal scan, detecting the α to δ transition during cooling, and δ to α transition during heating, at low temperatures (below RT) for both PC6 and PC8 samples. In the PC8 samples, the previously reported α to β transition (resembling a Brill-like transition) (Zhao et al., 2015) was confirmed. The obtained α to δ (and δ to α) transitions were attributed to a reversible change between ordered to disordered conformation. At low temperatures, the δ phase exhibited a more efficient packing than the α one.
Pérez-Camargo et al. (2021a) obtained a further understanding of the δ to α transition by using SSA experiments for the first time to detect a solid-solid transition. These authors employed the Ts, ideal of each material (Ts, ideal = 56°C (PC6) and Ts, ideal = 58°C (PC8)), and ΔTs = 5°C, as shown in Figure 11. Figure 11 compared the second heating DSC scan and the SSA final heating.
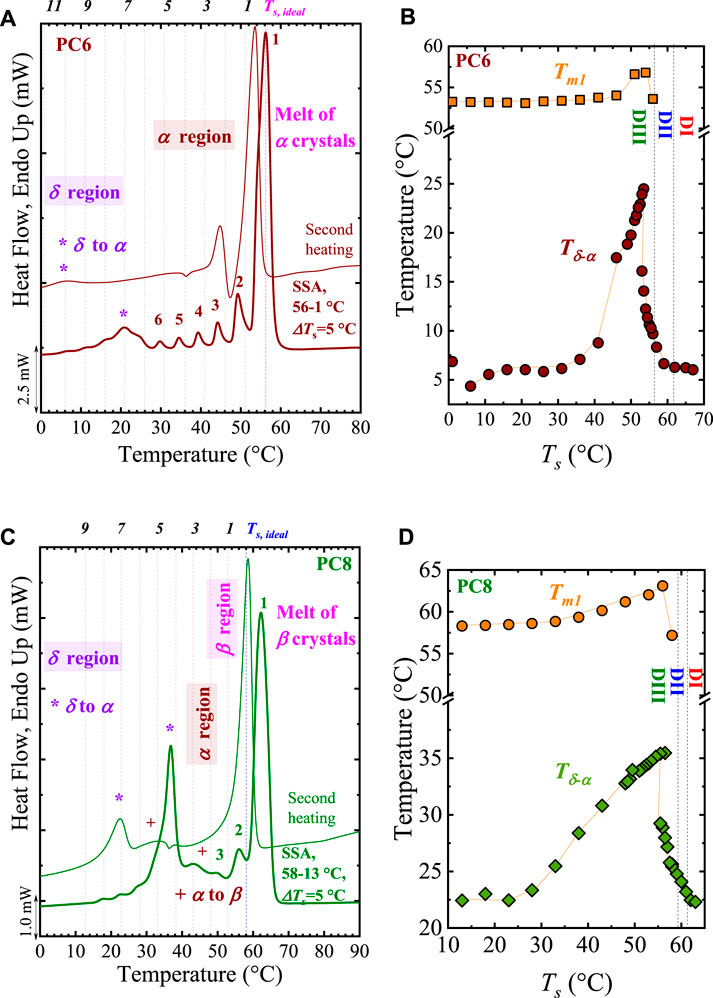
FIGURE 11. Comparison of second heating DSC scan and SSA profile for (A) PC6 and (C) PC8. The vertical lines in (A,C) indicate the used Ts, and the generated fractions and the position of the δ to α transition is labeled. (B,D) show the evolution of the endothermic δ to α transition, Tδ-α, and the highest melting point, Tm1, as a function of Ts, for (B) PC6, and (D) PC8. The Tδ-α and Tm1 values were obtained from SN experiments at selected Ts, including those used in SSA experiments. The vertical dashed line separates Domains I, II, and III. For clarity, the plotted Tm1 data corresponds to selected Ts values. Figure 11 is adapted from (Pérez-Camargo et al., 2021a).
Figures 11A,C show that the PC6 and PC8 samples can be fractionated due to MW distribution and intermolecular interactions. The PC6 displayed 6 fractions generated by lamellar thickness distribution in the α phase, in which fraction number 6 is produced by Ts, 6 = 26°C. Similarly, for the PC8 (Figure 11C), only three fractions are generated, in the β phase, by Ts = 53 to 43°C. In both materials, at ∼ 20°C (PC6) and ∼ 35°C (PC8), two prominent and mostly unfractionated peaks corresponding to the δ to α transition are detected. The unfractionated nature and increased area, at low temperatures, of these peaks indicate that they correspond to δ to α transition instead of a melting process. This result was corroborated by WAXS studies. Note that the unfractionated nature helped to detect a pre-freezing phenomenon (Li et al., 2021b) (see Section 2.2.1). It is worth noting that in the PC8, as expected, the α phase (below 55°C) cannot be fractionated due to the α to β transition. The δ to α transition peaks are shifted to a higher temperature, around 14°C, compared with the second DSC scan, and its signals are, in terms of enthalpy, ∼ two (PC6) and three (PC8) times larger than the standard second heating scan. The δ to α signal obtained by SSA experiments is significantly enhanced compared with the isothermal followed by the non-isothermal scan protocol employed in the previous work, evidencing the influence of the crystallization conditions and the effectiveness of the SSA protocol on strengthening the signal of the solid-solid transition.
Pérez-Camargo et al. (2021a) demonstrated by varying the SSA conditions, e.g., changing the starting Ts, ΔTs (5°C vs. 10°C), and the number of steps, that the solid-solid transition is affected by the most stable crystals. From the different SSA initial conditions, higher ΔTs provoke a shift in the transition to lower temperatures. The reduction of its area due to a ΔTs of 10°C involves lower crystal stability. Single SN tests in a wide range of Ts, including those employed in the SSA experiment, were used to prove this point. The evolution of the highest melting point, Tm1, and the transition Tδ-α as a function of Ts is plotted in Figure 11B (PC6) and D (PC8). It was found that Tm1 and Tδ-α follow the same evolution with Ts. Domain I and II do not produce crystal stability changes and, therefore, do not affect the δ to α transition. When Domain III starts, Tm1 increases, reaching a maximum. In this region, it can be noticed that annealing on the thicker crystals produces the most significant changes on Tδ-α, corroborating that this transition depends on the crystal stability. After the maximum in Tm1, there is a progressive decrease. At the lowest Ts values, i.e., annealing of the thinner crystals, the changes in Tm1 are minor or inexistent, and the solid-solid transition is not significantly affected.
The different protocols were reproduced in WAXS and FT-IR experiments, obtaining a sharper signal compared to other crystallization conditions. This helped to corroborate that the origin of the transition is related to a transformation of ordered (δ phase) to disordered (α phase) methylene conformations, enabling a more efficient (δ phase) to less efficient (α phase) chain packaging in the crystals. These results demonstrated that some solid-solid transitions could be sensitive to crystal stability change and, therefore, can be significantly enhanced by the SSA protocol. Other transitions, such as the Brill transition (Lotz, 2021a; Lotz, 2021b) in polyamides, seem insensitive to the crystal stability.
2.4.2 Polyurethanes
Fernández-d’Arlas et al. (2021) applied the SSA technique to thermoplastic polyurethanes (TPU) for the first time. These authors employed TPUs with different methylene diphenyl diisocyanate (MDI) and 1,4-butanediol (BD) contents as hard phases and polyols (adipic polyester or polytetrahydrofuran (polyether)) as soft segments: PUeth30, PUest33, PUeth43. The PUeth30 is a TPU with 30% of MDI-BD segments (hard segment) and 70% of polyether (soft segment). The SSA experiments were designed with the highest Ts, ideal = 210°C (PUeth43) as starting Ts, and ΔTs = 10°C to cover the temperature range of 210 to 120°C. A ts = 1 min was employed (with prior verification through SN experiments) to prevent degradation. Comparisons of the second heating DSC and the final SSA heating are shown in Figures 12A,B.
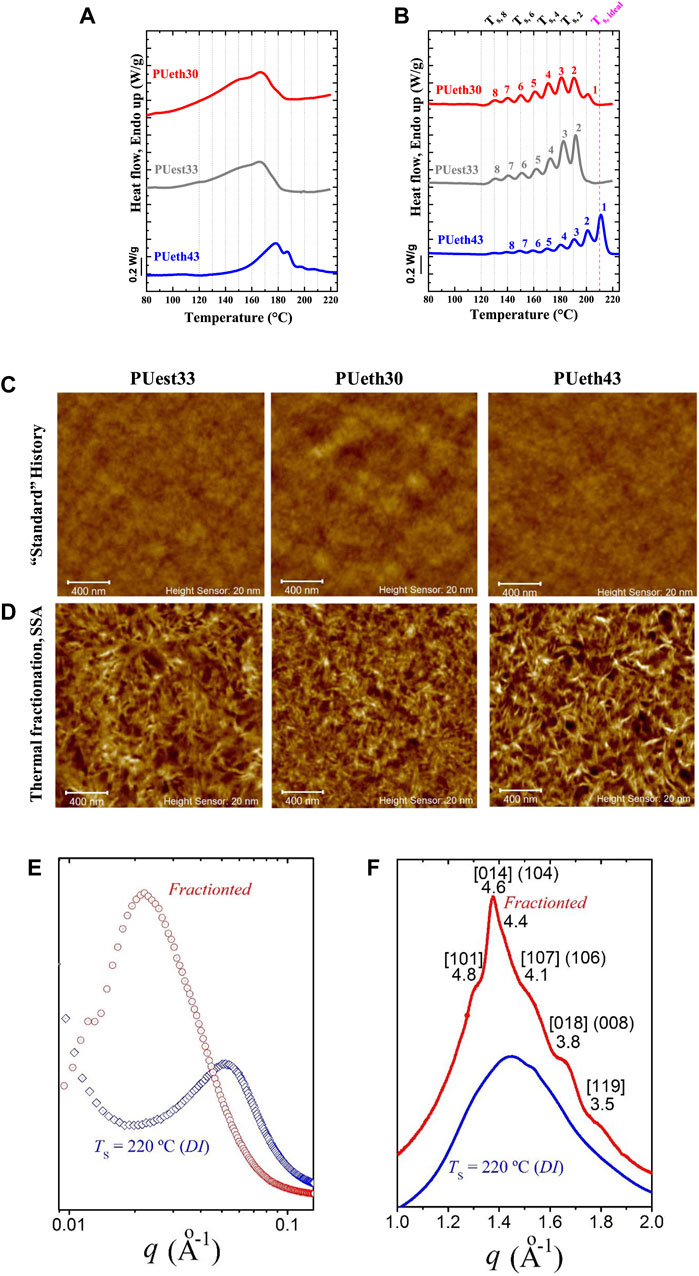
FIGURE 12. Comparison of unfractionated and fractionated samples through different experiments: DSC measurements (A) Second heating DSC scans and (B) SSA profiles; AFM topography images of (C) unfractionated samples and (D) fractionated samples (SSA protocol was applied without the final heating); (E) WAXS and (F) SAXS of PUeth30 before and after fractionation. In (A–) all the materials are compared. In (A), the vertical lines indicate the different Ts used, and the fractions are labeled through numbers. Figure 12 is adapted from (Fernández-d'Arlas et al., 2021).
Figure 12B shows that all the samples can be well fractionated by SSA. By comparing PUeth30 and PUest33, it is noticed a different SSA profile, as reflected in the peak area of fraction 2 (more intense for PUest33) and fraction 3 (more intense for PUeth30). The polyol provokes these differences between PUeth30 and PUest33 since the MDI-BD content is similar. Employing polyether and polyester polyols creates a different trend toward phase separation between the hard phase and soft phase. These differences are barely noticed in the standard second heating DSC scans (see Figure 12A).
With the SSA technique, also used for AFM and WAXS/SAXS measurements, the authors were able to introduce significant variations of the lamellar morphology by promoting the annealing and stabilization of the thermal fractions and refining the crystals. These variations lead to thicker lamellae, facilitating the measurements of lamellar thickness with different techniques, which were impossible before fractionation. In a recent article (Fernández-d’Arlas Bidegain et al., 2022), fractionating TPUs copolymers samples facilitates its structural characterization.
Figures 12C,D show the topography AFM images of unfractionated (Figure 12C) and fractionated (Figure 12D) samples, in which the fractionated ones have a much better-defined morphology provoked by the thicker lamellae. The changes introduced by the SSA also generate much better-defined WAXS signals related to MDI-BD crystals, which were difficult to detect before fractionating (see Figure 12F), allowing calculating the crystallinity by WAXS, and the lamellar thickness with SAXS measurements (see Figure 12E). In summary, the SSA technique can enhance the TPU crystallinity and refine its morphology, significantly facilitating its characterization.
2.5 Evaluating polymer blends by SSA experiments
The SSA fractionation allows for evaluating miscibility and co-crystallization between the phases of a blend. Using the SSA allows for studying the relationship between morphology, molecular structure, and crystallization, as demonstrated by different works in blends of polyethylene (Drummond et al., 2000; Arnal et al., 2001; Chen et al., 2001) and other materials. To evaluate the blend behavior, the SSA profile of the blend, “blend-curve,” is often compared with a “sum-curve” created from the simple summation of the SSA profiles of the single components, measured alone, weighted according to their respective presence in the blend (Carmeli et al., 2020). With this approach, if differences arise in the “blend-curve” vs. “sum-curve,” it means co-crystallization or other interactions among the phases, e.g., dilution of the higher crystallizable phase, etc., occurred during crystallization of the blended components (Carmeli et al., 2020). In this section, we bring several examples that illustrate the use of SSA to study blends and a novel method to determine the chemical composition in PP/PE blends.
2.5.1 PE/wax blends: Diluent effect and co-crystallization
Gumede et al. (2016) blended LLDPE with wax, using the following compositions: 95/5, 90/10, 80/20, 70/30, and 60/40 w/w. They found that a single phase is formed in the melt. In contrast, two separated phases (LLDPE-rich (at high temperatures) and wax-rich phases (at low temperatures)) are formed in the solid state, as in the HDPE/wax blends studied by Hato and Luyt (2007), and the different polyethylene/wax blends reviewed by Gumede (2021). SSA experiments were designed with ts = 5 min, ΔTs = 5°C, Ts, ideal = 123°C (as starting Ts for all the blends). Scanning rates of 20°C/min revealed further information about the blends. A fractionation of 9 steps was performed, covering the high-temperature range (LLDPE phase), 123 to 88°C; additionally, a fractionation of 14 steps was also performed to cover the low-temperature range (wax phase): 93–28°C.
Figure 13A shows the SSA profiles obtained after applying the high-temperature protocol. The 9 steps protocol generated 8 fractions of the LLDPE phase because the LLDPE is a copolymer of ethylene/α-olefin, in which the α-olefin act as defects that interrupt the crystallizable sequences with short-branches. On the contrary, the wax phase remains unfractionated, even when applying a low-temperature protocol. The behavior of the wax is explained by its linear, low molar mass, narrow molecular weight distribution (dispersity of 1.11) and apolar nature (with very weak intermolecular interactions). Furthermore, with X-ray experiments, Gumede et al. (2016) show that the wax crystallizes in an extended chain conformation (a long period of 3.9 nm comparable to the calculated extended chain with 3.7 nm); hence, annealing is impossible.
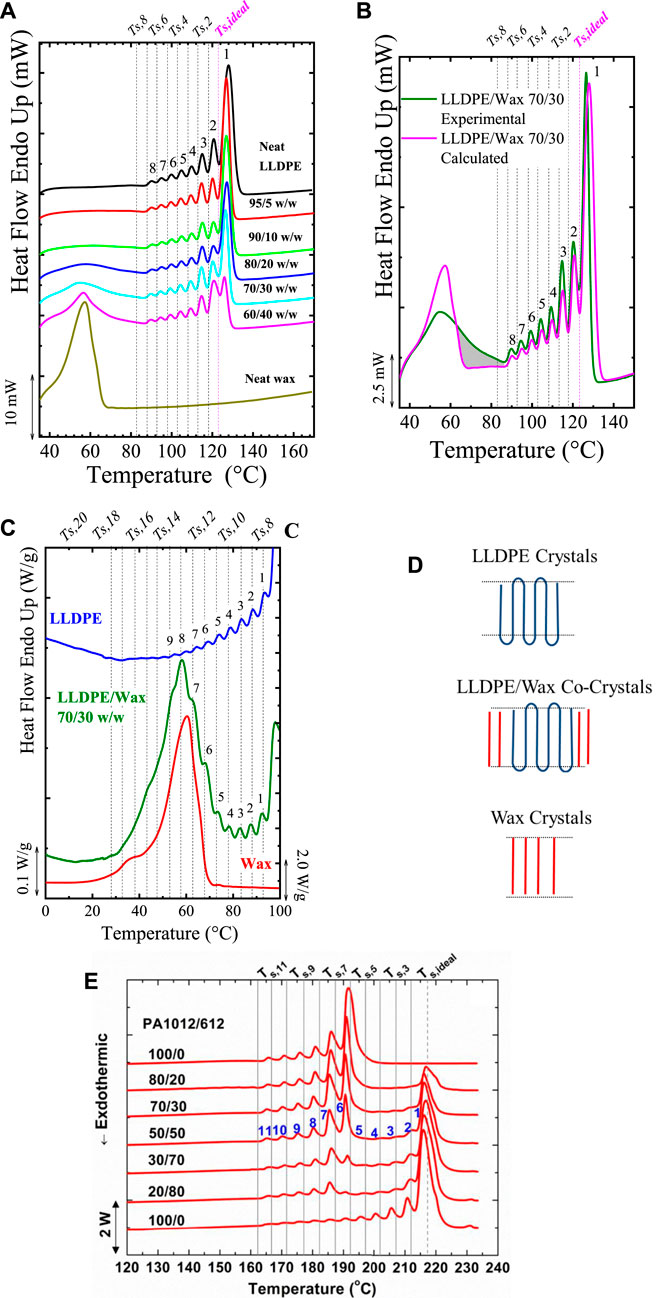
FIGURE 13. SSA profiles after applying the high-temperature protocol (Ts range: 123 to 88°C) for (A) LLDPE, wax, and their blends; (B) 70/30 LLDPE/wax blend (blend curve vs. sum curve). In (C) the SSA profiles correspond to the application of the low-temperature protocol (Ts range: 93 to 28°C) in LLDPE, wax, and 70/30 LLDPE/wax blends. In (D) a schematic representation of the different kinds of crystals is presented. In (E) DSC heating runs after SSA fractionation for neat PA1012 and PA612 and their blends. For (A–C,E) the vertical lines indicated the employed Ts values. Figures 13A–D are adapted from (Gumede et al., 2016). Figure 13E is reproduced from (Wang et al., 2017).
Analyzing the LLDPE-phase, two effects can be observed: 1) the fractions at the highest Tm, SSA are slightly shifted to lower temperatures as the wax content in the blend increases, and 2) the relative importance of Fraction 1 decreases (its area and height decrease) in comparison with Fractions 2 and 3 as the wax content increases. The melting point depression is provoked by the molten wax acting as a solvent (diluent effect) for the unmolten LLDPE crystals at temperatures above 80°C. Such melting point depression has been described by the Flory-Huggins theory (Flory, 1949). The variations in melting points due to the diluent effect also affect the relative areas of the different fractions, e.g., Fraction 1. It is worth noting that in the cooling DSC scans, Gumede et al. (2016) found that the wax plasticizes the LLDPE-phase, increasing its chain mobility and thus, decreasing its crystallization temperature.
The miscibility and co-crystallization effects can be detected by comparing the blend curve vs. sum curve. Figure 13B compares the blend vs. sum SSA curves for the 70/30 LLDPE/wax. The SSA profiles of the blend and sum curves (see Figure 13B) are similar, except for the Tm,SSA depression on the LLDPE-phase explained above. For the wax phase, it is clear, in the blend curve, a broadening of the wax melting peak, with a clear tail at high temperatures (the shadowed region between 70 to 80°C) that is not visible in the sum curve. This behavior is provoked by co-crystallization, as demonstrated by the fractionation in a low-temperature range, i.e., 93 to 28°C. Figure 13C shows that during the fractionation at a low-temperature range, the melting range of the components overlaps.
Figure 13C reports the SSA profiles after applying the low-temperature protocol for neat LLDPE and wax and the 70/30 LLDPE/wax blend. The LLDPE can be fractionated even in such a low-temperature range, since the higher short chain branch content generates very thin lamellae (small methylene sequences) that melt at low temperatures. These fractions’ melting points overlap with the neat wax’s melting points. On the contrary, as previously mentioned, the wax cannot be fractionated due to extended chain lamellar crystals formed (see bottom of Figure 13D). However, in the 70/30 LLDPE/wax, the wax phase can undergo fractionation due to co-crystallization. Fractions 4 to 7 (see Figure 13C) indicate the co-crystallization between the wax and small amounts of LLDPE, generating the high temperature (higher than the end melting temperature of the wax) tail, see Figure 13B. In SAXS experiments, a peak with a long period of 7.0 nm associated with a wax-rich phase was detected. Gumede et al. (2016) explained that the reason for co-crystallization between LLPDE (in which chains are folded, see the top of Figure 13D) and wax is the similarity in the length of the extended chains of the wax and the lamellar thickness formed by these short linear segments of highly branched LLDPE chains. This situation is illustrated in the middle of Figure 13D. Gumede et al. (2016) show two essential effects in these blends: diluent effect and co-crystallization.
2.5.2 Polyamides blends: Immiscible blends behavior
As an illustration of how immiscible blends behave under SSA fractionation, we selected the work of Wang et al. (2017), who blended PA1012 and PA612 using various compositions (80/20, 70/30, 50/50, 30/70, and 20/80 PA1012/PA612 blends). For the SSA experiments, Wang et al. (2017) used the Ts, ideal = 217°C (PA612) of the neat component with the highest melting point as starting Ts, a 12-step protocol, ts = 5 min, ΔTs = 5°C, and scanning rate of 20°C/min.
Figure 13E shows the obtained SSA profiles for all the blends. Figure 13E shows multiple fractions on the neat materials, which are linear, generated by differences in chain lengths. In the blends, 11 fractions are generated since Ts, ideal does not provoke annealing peaks. All the Tm, SSA position remains practically constant with the blend composition, indicating the immiscible character of the blend. In addition, Wang et al. (2017) found that if the total SSA melting enthalpies are normalized by composition, they are approximately constant, a behavior typically found in immiscible blends.
2.5.3 Determining the composition of recycled blended materials
Carmeli et al. (2020) studied for the first time, utilizing thermal fractionation, PE/PP blends, preparing “model” blends, and using commercial blends obtained by recycling. Characterizing these blends is essential, considering that PP is often contaminated with PE and vice-versa (Góra et al., 2022), and both can be found in recycled products. Aiming to study PE/PP blends, Carmeli et al. (2020) validated a novel SSA method that not only allows fractionating PP and PE with the same temperature program, but also allows determining the chemical composition of PE/PP blends derived from recycling.
For the study of PE/PP blends, Carmeli et al. (2020) prepared “model blends” of PP homopolymer (indicated as homo) or heterophasic PP (marked as het) with rubber inclusions, with LDPE (density of 0.923 g/cm3) and an HDPE (density 0.945 g/cm3). The selected compositions were 60/40 and 40/60, in which the PE phase is formed by equal proportions of HDPE and LDPE. The authors also employed two commercial recycled blends from different feedstocks streams, i.e., post-consumer recycling (PCR1 and PCR2) and post-industrial recycling (PIR1 and PIR2). For the latter, the composition, roughly estimated by FT-IR, was reported by the provider: 40/60 PE/PP (PCR1) and 10/90 PE/PP (PIR1), whereas for PCR2 and PIR2, the composition was unknown.
For all the blends, coupled SN and SSA protocols, see Figures 14A,B, respectively, were employed, whereas for the parent components of the blends, the standard SN and SSA protocols, as shown in Schemes 2A,B, were employed.
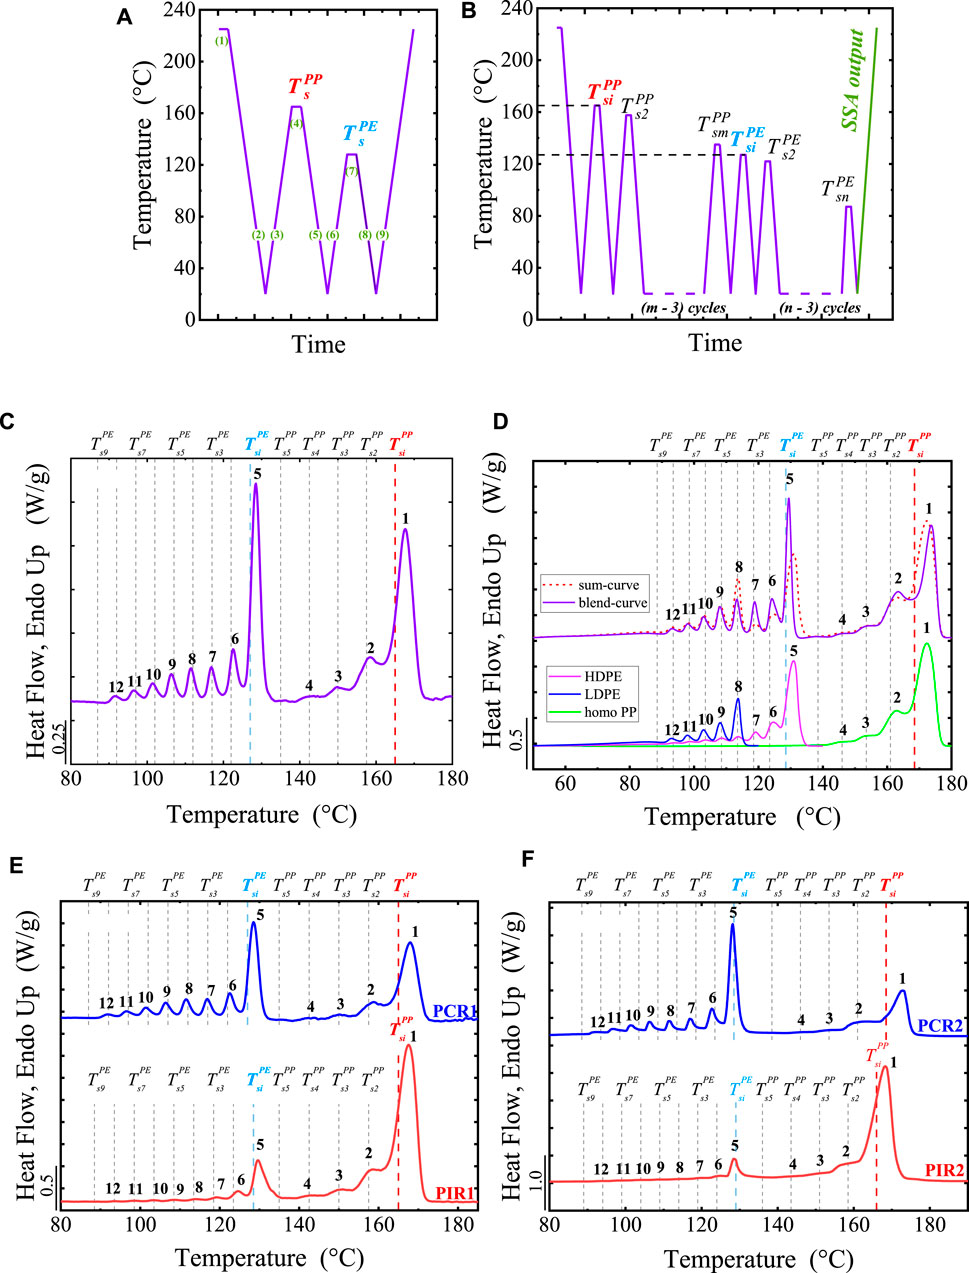
FIGURE 14. Coupled (A) SN and (B) SSA protocol designed for (A) self-nucleated and (B) fractionated blends of PE and PP. In (C) Final heating scan of the couple SSA protocol applied to PCR1, using ΔTsPE = 5°C and ΔTsPP = 7.5°C. (D) Comparison between the blend-curve and the sum-curve for the 40/60homo and SSA final DSC heating scans measured for each model component, scaled with their specific concentration in the blend. In (E,F) Final heating scan after couple SSA fractionation of (E) PCR1 and PIR1 and (F) PCR2 and PIR2. In (C–F), the dashed vertical lines correspond to the employed values of Tsi and Ts for each phase. Numbers 1 to 4 and 5 to 12 are assigned to the PP and PE fractions. The Ts lines for individual components (HDPE, LDPE, homo PP) are not shown. Figure 14 is adapted from (Carmeli et al., 2020).
In Figure 14A, Steps 1 to 5 for the PP are the same as the standard protocol (Scheme 2A). In Step 6, instead of performing the final heating, the protocol is coupled to the SN of the PE (Steps 3 to 5 of the standard protocol, and Steps 6 to 8 on Figure 14A). In this way, Step 5 (cooling) of the PP serves to define the standard crystalline state of the PE crystalline phase, which includes the SN of the PP. After fractionating the PE phase, Step 9 (final heating) of the coupled protocol will reflect the information on PE and PP. For this protocol, the authors employed scanning rates of 10°C/min and ts = 5 min; the highest temperature was 225°C (erasing the thermal history of the PP), and the lowest (creating a standard state) was 20°C. By testing different Ts, the Ts, ideal of each material was determined and employed in the coupled SSA experiments.
The principle of the couple SSA experiments is the same as the coupled SN; this means the sequential fractionation of the two phases. The first steps correspond to the PP’s standard SSA protocol (Scheme 2B); then, instead of the final SSA heating, the protocol continues with the fractionation steps for the PE (Figure 14B). The PE fractionation starts with the standard state of the PE (cooling scan after thermal treatment at the lowest seeding temperature used for fractionating the PP phase) rather than being determined during cooling from the initial temperature. After PE fractionation, the final heating is performed, showing the effect of the accumulation of self-nucleation and annealing steps for both PP and PE phases.
It is worth noting that the coupled SN and SSA protocols can be performed in PP/PE blends due to the large difference in melting point between the two polymers. This difference makes it possible to SN the PP when the PE is molten and SN the PE without having a meaningful effect on PP. For instance, the highest Ts of the PE is too low to produce any annealing effect on the PP crystals formed at TsPP. In this case, the Ts for PP are necessarily located above the Domain I to Domain II transition for PE, ca. 130°C; still, the selected Ts span the whole melting range of the PP phase. According to the authors (Carmeli et al., 2020), performing the coupled SN protocol reduces the analysis time by around 30%, and replicates the conditions in the couple SSA experiments.
The SSA conditions were optimized using the PCR1 sample (see Figure 14C), obtaining a TsiPP = 165°C and TsiPE = 127°C. Then, it was found that the ΔTs that provide the best compromise between high resolution of the single fractions and an acceptable number of fractions are ΔTsPE = 5°C and ΔTsPP = 7.5°C. In this way, the Ts = 165, 157.5, 150, 142.5, and 135°C were employed for PP, generating 4 fractions, labeled as 1 to 4, since TsiPP = 165°C only self-nucleated the PP. For PE, the Ts = 127, 122, 117, 112, 107, 102, 97, 92 and 87°C were employed, generating 8 fractions, labelled as 5 to 12, since TsiPE = 127°C only self-nucleated the sample. The coupled SSA protocols include 14 steps: 5 cycles for PP and 9 cycles for PE. This combination of steps and ΔTs was maintained for all the samples, only varying Tsi. The generated fractions are clearly observed in the SSA profiles in Figure 14C.
Figure 14D shows the final SSA profile for the 40/60homo blend. The TsiPP and TsiPE do not generate any fractions since they are only self-nucleation temperatures. The SSA profile clearly shows that the fractions (1–4) at the highest melting points correspond to the PP phase fractionation and the fractions (5–12) at the lowest melting points to the PE phase fractionation. On the PP phase side, Ts1PP generates fraction 1, Ts2PP generates fraction 2, and so on, while on the PE side, Ts1PE generates fraction 1, Ts2PE generates fraction 2, and so on. By comparing the “blend-curve” (fractionation of the blend) and the “sum-curve” (sum of the SSA of the neat materials considering their weight fraction in the blend), it is possible to obtain further information on the blend, as illustrated in Figure 14D for the 40/60homo blend. For this blend, the TsiPE = 128.5°C and TsiPP = 168.5°C were employed for comparison purposes. These Tsi are the highest in between the neat components. Figure 14D shows that fractions 1 to 4 correspond to PP, 5 to 7 to HDPE, and 8 to 12 to LDPE. Fractions 9 to 12 follow a simple mixing rule since no significant differences can be detected among the “blend-curve” and “sum-curve.” Fractions 5 to 8 display meaningful differences, reflected in a deviation between the blend curve and sum curve. The variations in fractions 6 to 8 are attributed to co-crystallization between LDPE segments, forming crystals belonging to fraction 8 in neat LDPE and the HDPE segments of peaks 6 and 7 of HDPE. The decrease of the Tm, SSA of peaks 6 to 8 is attributed to miscibility and co-crystallization. For peak 5 the decrease of Tm, SSA is larger and attributed to a diluent effect of the LDPE on the HDPE. In this case, at Ts5 = 123.5°C the concentration of molten LDPE chains is the highest possible, leading to a more substantial diluent effect by crystallizing HDPE longest segments. On the contrary, for Ts6 = 118.5°C, the undercooling is high enough to allow co-crystallization of the longest linear segments of LDPE and, consequently, a lower amount of LDPE chain act as a diluent. The differences in PP fractions (blend vs. sum curve) are attributed to the differences in Ts, ideal reported for the blend (163.5°C) and the neat PP (168.5°C).
With the blend vs. sum curve analysis, including the miscibility and co-crystallization phenomenon, Carmeli et al. (2020) make the following assumption: “the relative amount of crystals generating peak 5 in the blend is the same as that generating the peak in neat HDPE. This means that the ratio between the area of peak 5 in the blend and the area of peak 5 in the as-measured (not scaled) SSA curve of neat HDPE is related to the amount of this component in the blend.” According to the above assumption, the HDPE weight percentage (see Eq. 3) in a blend can be calculated as:
where A5blend is the area of peak 5 in the blend curve, and A5HDPE is the area of peak 5 in the as-measured SSA curve of the neat HDPE. The authors estimate a relative uncertainty of WHDPE = 12.7% (see more details in Reference (Carmeli et al., 2020)). Similarly, the WPP can be estimated (see Eq. 4). For this case, the authors pointed out that no co-crystallization can occur between PP and PE components; thus, no variation of the PP melting peaks is possible. Assuming this, the ratio of the total area under the four endothermic peaks of PP for the blend curve and the sum curve should be similar. Thus, to reduce the calculation errors, the authors considered the total area instead of the area of one peak, obtaining the following expression:
where APPtotblend is the PP total area in the blend curve, and APPtotPP is the PP total area in the as-measured SSA curve for neat PP. For this case, the authors assumed a relative uncertainty of 12.7%, as estimated in the WHDPE. By considering WPP and WHDPE, Carmeli et al. (2020) could estimate the composition of real recyclable materials such as PCR1 and PIR1. Their SSA profiles are displayed in Figures 14E,F.
Given that the real recycled materials possess a complex mixture of PEs, it can be considered that the HDPE corresponds to the high melting/highly linear component (HDPE-like) and the LDPE to the low melting component (LDPE-like) of the PE phase. Thus, from Figure 14E, it can be qualitatively deduced that the PCR1 possesses a higher content of LDPE (see the sharper fractions 7 to 12 in the PCR1 vs. PIR1) than the PIR1 given the amount of low melting point fractions observed in the PE phase. In fact, according to Eq. 3, the WHDPE is 21% (PCR1) and 11% (PIR1). Thus, by considering the total percentage of the PE phase (40% PCR1 vs. 10% PIR1) is possible to estimate that the PE in the PIR1 is almost exclusively HDPE, while in PCR1, only about half of the PE phase corresponds to HDPE. The same procedure was applied in all the blends, and the average difference for the nominal compositions is equal to ± 2.1% for PP and ±1.8% for HDPE.
Figure 14F shows the SSA profiles for the recycled materials with unknown compositions: PCR2 and PIR2. As with the PCR1 and PIR1, the visual exploration evidence that PCR2 displays a higher content of HDPE-like phase. By applying Eqs 3, 4, the PP phase corresponds to 41% (PCR2) and 84% (PIR2), while the HDPE-like phase to 30% (PCR2) and 7% (PIR2). The sum of the remaining components: 29% (PCR2) and 9% (PIR2), can be either low melting components of the PE phase or fillers, solubles, or rubber parts, which do not contribute to the DSC melting trace. Detecting the remaining components requires coupling the SSA method with other techniques like TGA or xylene solubles. Carmeli et al. (2020) performed TREF measurements for comparison purposes, obtaining comparable results (SSA vs. TREF), as displayed in Table 2.
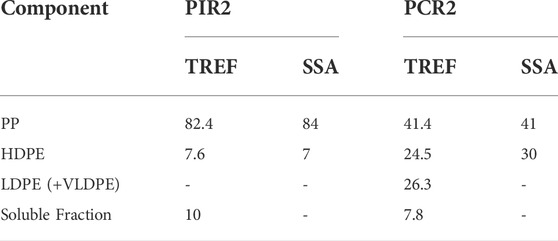
TABLE 2. Composition of PIR2 and PCR2 determined by TREF and DSC/SSA. The values are weight percentages. Table based on reference (Carmeli et al., 2020).
The results obtained by Carmeli et al. (2020) evidence that the proposed method using DSC/SSA is an easy and inexpensive tool for daily investigations and can be coupled with techniques sensitive to the presence of filler or solubles that thermal methods cannot detect.
Recently, Góra et al. (2022) enhanced the coupled SSA method by using faster rates and fewer cycles. The 14 cycles-protocol (5 cycles for PP + 9 cycles for PE) employed (multi-fraction protocol) by Carmeli et al. (2020), was reduced to 4 cycles (2 cycles for PP + 2 cycles for PE), single-fraction protocol, as shown in Figures 15A,B. The single fraction protocol creates only one fraction for each material under consideration. In this case, the fractions generated, Fraction 1 (PP) and Fraction 5 (HDPE), are the ones used for WPP and WHDPE calculations (see Eqs 3, 4).

FIGURE 15. (A) Fractionation program (multi-fraction protocol) implemented and designed by Carmeli et al. (2020), which uses 14 cycles to obtain 8 fractions for PE part and 4 fractions for PP phase (B) Fractionation program (single-fraction protocol) designed for the calculation of the main types of the polyolefins: HDPE and PP, which uses 4 cycles of temperature treatments and results in 2 fractions, one for the PP part and the second one for HDPE. In (C) Comparison of the outcome of the two SSA fractionation protocols for m-PE65PP35: the DSC curve in red corresponds to the single-fraction and the one in black to the multi-fraction protocol. (D) Fractionation output run results for the investigated materials: The content of PP decreases from top to bottom, while that of PE correspondingly increases in the same direction. Figure 15 is adapted from (Góra et al., 2002).
The fractionation of Figure 15B was employed in 5 different PE/PP blends and the neat PP, HDPE, and LDPE. Figure 15C compares the SSA profiles of the 65/35 PE/PP blend generated by: multi-fraction (Figure 15A) and single-fraction (Figure 5B) protocols. The multi-fraction protocol developed 8-well-defined melting peaks for the PE, and 4 melting peaks for the PP, as expected. For the single-fraction protocol, the sharp peak at around 125 to 132°C corresponds to the thermal fractionation at Ts1PE. The other sharp peak at about 160 to 172°C corresponds to PP’s thermal fractionation at Ts1PP. The single broad peak at 80 to 125°C and the tail at 136 to 160°C corresponds to the unfractionated part of the PE and PP phases. By comparing the sharpest peaks, Peak 1 (PP) and Peak 5 (PE), it can be noticed that they are substantially independent of the applied protocol (multi vs. single-fraction protocol); therefore, a single-fraction protocol can be employed to estimate the composition of the blends in a reduced time. In addition, Góra et al. (2022) demonstrated that the scanning rate of the single-fraction protocol could be increased from 10°C/min to 30°C/min if the mass is compensated, e.g., 2.92 mg for 10°C/min and 1.30 mg for 30°C/min. Using the single-fractionation protocol at 30°C/min, Góra et al. (2022) compared the different blends in Figure 15D.
Figure 15D clearly shows that the PE phase peak increases as the PE content increases, and the PP phase peak increase as the PP content increases. The WPP and WHDPE were calculated and compared with TREF measurements using these peaks. The results demonstrated a comparable precision with TREF measurements but significantly shorter times. Góra et al. (2022) reported that a complete fractionation (coupled multi-fraction SSA protocol) at 10°C/min takes about 420 min, whereas the single fractionation protocol at 30°C/min lasts about 75 min.
2.6 Evaluating synthesis conditions
This section shows how synthesis conditions influence the chain’s primary structure and thus impact the final SSA profiles. In this case, we offer two examples, one related to the post-polymerization reactions in polyamides and the other to how the monomer addition protocols affect the final SSA profile. It is worth noting that the influence of catalyst, and stereo defects, among other synthesis variables, have also been studied, as shown in Table 1.
2.6.1 Post-polymerization reactions in polyamides
Li et al. (2021c) studied the structural evolution of long-chain polyamide (LCPA), PA1012, and their self-assembly into crystals occurring during post-polymerization reactions caused by selected thermal treatments. Due to the polymerization nature, residual end groups in LCPAs are still active and might lead to structural changes above the glass transition temperature, Tg. Solid-state polymerization (SSP) occurs via reaction of the chain end groups of the LCPAs at temperatures between Tg and the Tm, onset, resulting in a further increase of the molar mass. Li et al. (2021c) employed thermal treatments combining SSA and isothermal experiments at selected temperatures at various times (0 h to 14 h) to promote post-polymerization reactions. The maximum time of 14 h was divided into 7 individual isothermal steps of 2 h. For instance, the SSA + isothermal step for 4 h corresponds to: SSA + isothermal step for 2 h + SSA + isothermal step for 2 h + SSA. The isothermal temperatures selected, kept constant for each protocol, were set as 140, 170, 190, 210, 230, and 250°C. Each SSA revealed the fractionation of the sample after the cumulative isothermal treatment time. For the SSA, the parameters selected were: Ts, ideal = 191°C, ts = 5 min, ΔTs = 5°C. The thermal history was erased at 220°C (for 3 min), and the standard crystalline state was created at 100°C after cooling from the melt at 20°C/min (scanning rate for both cooling and heating).
Figures 16A,B displays the final SSA heating after the isothermal treatment at 170 and 250°C at different treatment times.
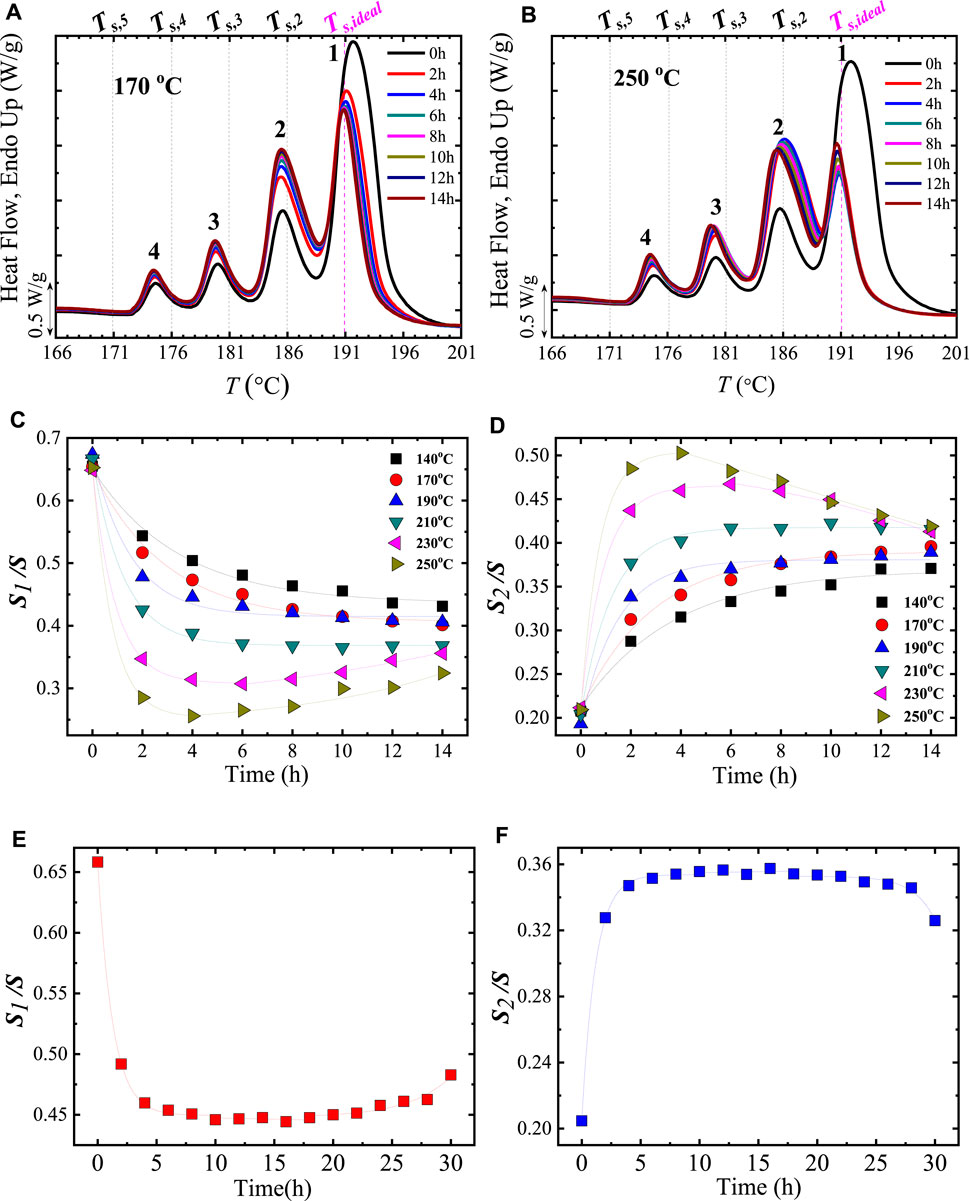
FIGURE 16. Final SSA heating runs after cumulative isothermal heat treatment times at (A) 170 and (B) 250°C. The thermal fractions are numbered from 1 to 4 on top of each melting peak, and the vertical lines indicate the used Ts. In (C,D) ratio of the integrated area of the (C) first (S1/S) or (D) second (S2/S) thermal fraction by the total integrated area (S) versus isothermal time at 140, 170, 190, 210, 230, and 250 °C. In (E,F) the S1/S and S2/S, at 190 °C, versus time (up to 30 h) is represented. The dashed lines show the fit on top of the experimental data. Figure 16 is adapted from (Li et al., 2021c).
Li et al. (2021c) named the highest temperature fraction as fraction 1, and the lowest as fraction 4. They found that Tm, SSA of fraction 1 is shifted to lower temperatures as the isothermal treatment time increases. These results are unexpected since the thermal treatment at high temperatures (170 and 250°C) should have increased the molar mass, which should increase the lamellar thickness corresponding to the first fraction. Still, the actual results varied in the opposite direction. The degradative process might explain this behavior, but they were discarded through TGA experiments. Instead, evidence of crosslinking at high temperatures was obtained with rheological measurements. The rheological measurements of the cyclic oscillation frequency sweep at 250°C, revealed a deviation of the elasticity modulus from the scaling law in the terminal region and the development of a plateau at low frequencies. Further evidence of the presence of such crosslinking was obtained through different experiments: by a solubility test, the authors noticed that the samples were not soluble, probing the presence of chemically crosslinked structures which increased with increasing heat treatment time. Next, the authors noted that Tg values increase with increasing the isothermal treatment time, proving the formation of crosslinked structures since they hinder the long-range motion of the polyamide chains. Finally, isothermal experiments of the samples treated at 250°C were performed, revealing a decrease in the overall crystallization rate as the time of the treatment at 250°C increased. The authors claimed that this change is consistent with an increase in the molar mass (by chain extension or crosslinking). In addition, it was found that with the increase of the time spent at 250°C, Tc and Tm decreased, a result attributed to a change from linear to a crosslinked structure. It is worth noting that any interruption in linear crystallizable sequence causes depression in melting temperatures as it limits the achievable lamellar thickness.
Li et al. (20211c) claimed that linear growth competing reactions also occur besides the crosslinking. This factor was considered by analyzing each SSA fraction’s area. The ratio of the integrated area of the fraction 1 (S1) or 2 (S2) and the total integrated area (S) was calculated and plotted versus time in Figures 16 C, D.
Opposite trends of S1/S and S2/S are observed at lower temperatures and with increasing time: S1/S decreased, and S2/S increased. In addition, both curves exhibit a minimum or a maximum, depending on the temperature. The slope of the curve became larger, meaning that the reaction rate increases as the temperature increases. The changes caused by the thermal treatments depend on the time and the temperature (see Figures 16C–F). To explore the time-temperature equivalence, Li et al. (2021c) selected the isothermal temperature of 190°C and extended the treatment time to 30 h, as shown in Figures 16E,F. The observed behavior in Figure 16E indicates that the crosslinking reactions dominate at shorter times, making the fraction 1 area smaller (decreasing S1/S). But, as time increases (longer than 15 h) the chain extension reactions are more important, leading to a recovery of the fraction 1 area (increasing S1/S). Since fraction 2 grows at the expense of the decrease of fraction 1, Figure 16F is a mirror image of Figure 16E. Because of the crosslinking and linear chain growth (chain extension) competition occurring in the temperature range of 140 to 250°C, Figures 16C–F reflects that the maximum/minimum in the peak area ratios could be reached by increasing temperature or prolonging the time.
The time-temperature equivalence was further investigated by constructing a master curve (the curves at different temperatures were shifted and superposed) along the time axis for a reference temperature T0 = 190°C, as shown in Figure 17A. The superposition formula is indicated in Figure 17A. In addition, the main curve was fit and divided into three stages, displayed below the curve, and explained below.
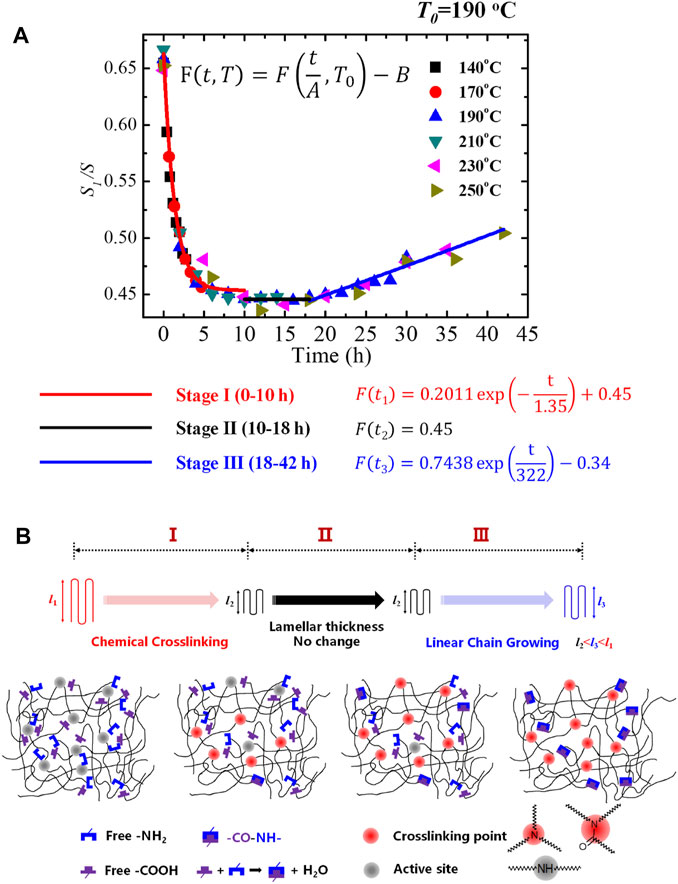
FIGURE 17. (A) Fit of the “time-temperature equivalence” main curve. The reference temperature (T0) was 190°C. The fitting equations are indicated in the Figure. In (B) Schematic representation of the Mechanism for the Evolution of Lamellar Thickness in PA1012 Induced by Linear Chain Growth and Chemical Crosslinking in the Main Curve at a Reference Temperature (T0) of 190°C. Figure 17 Reproduced from (Li et al., 2021c).
The master curve in Figure 17A is divided into three stages depending on the time interval. These stages are illustrated in Figure 17B and described below. First, it should be considered the reactive nature of the amide groups of PA1012 in which secondary amines (active sites) and end groups of the macromolecules (amine and carboxylic end groups) coexist. The reaction of the active sites with end groups leads to crosslinking and the reactions between end groups to chain extension. During the thermal treatment, new active sites and molecular groups are generated due to the broken molecular chains of polyamides. According to the dominant process, i.e., crosslinking vs. chain extension, three stages can be highlighted at different times, as shown in Figure 17B and described below.
Stage I (0–10 h at T0): Chemical crosslinking. There are few end groups initially, and the chemical environment is dominated by active sites, facilitating crosslinking reactions.
Stage II (10–18 h at T0): No change in lamellar thickness. In this stage, the number of end groups increases with the thermal treatment time. As a result, linear chain growth (the amidation reaction between carboxylic end groups and amine end groups resulted in linear chain growth) and crosslinking reactions can coincide. Since the contribution of each process to the lamellar thickness is opposite, no changes are reported when they are in balance.
Stage III (18 to 42 h at T0): Linear chain growing. In this later stage, linear chain growth mainly occurred via reactions of chain-end groups.
Li et al. (2021c) also found that the structural changes during the applied thermal treatments enhanced the polymers’ mechanical properties and heat resistance. Overall, in this case, the SSA technique represents a tool for studying the chemical changes produced by post-polymerization reactions in LCPA.
2.6.2 Influence of comonomer addition protocol in copolymers
Pérez-Camargo et al. (2019) prepared the PS-co-ES copolymers, discussed in Section 2.1.3.2, by two different protocols of anionic ring-opening copolymerization that provide different primary structures. The protocols varied the monomer addition. In Protocol a, La, a one-shot addition of all monomers to the initiators was used, leading to gradient (blocky) structures (due to the higher reactivity ratio of ES with respect to PS). In Protocol b, Lb, repeated additions of the monomer mixture were employed, producing shorter gradients along the chain. Due to the shorter homosequences of the crystallizable unit in Lb, the copolymer should exhibit a lower tendency to crystallize. Figure 18 shows how the protocol addition influences the non-isothermal (Figures 18A,B) and SSA (Figure 18C) experiments.
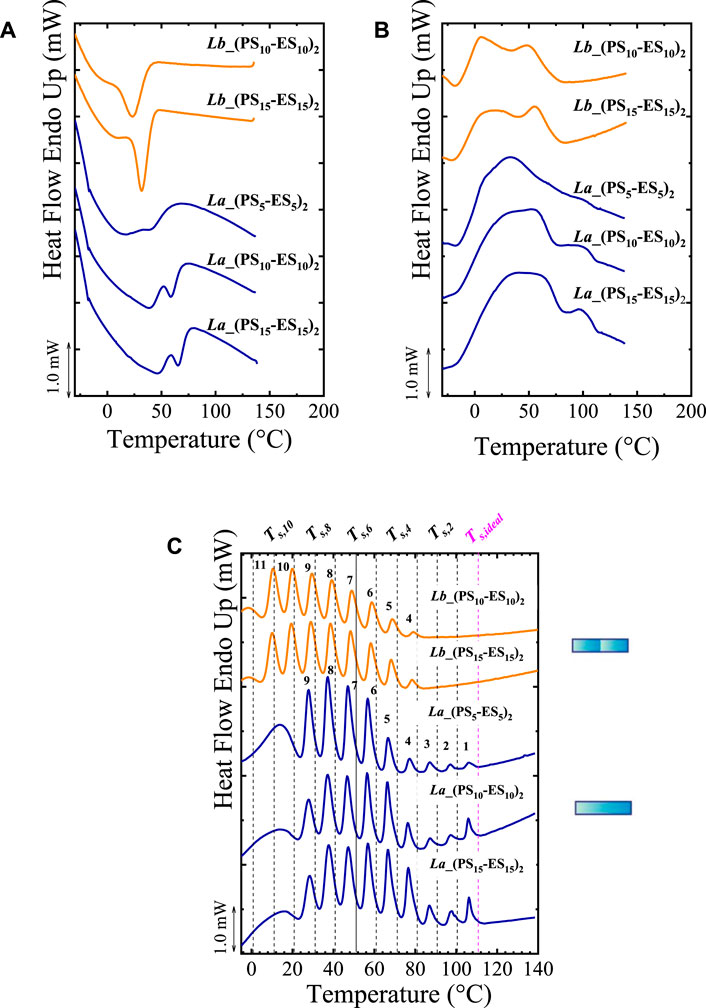
FIGURE 18. DSC (A) cooling and (B) heating scan for La and Lb samples with different DP DP of 10, 20 and 30. In (C) the SSA profiles for the samples of (A,B) are displayed. The vertical lines indicate the employed Ts, and the fraction number is labeled. The cartoons at the right illustrate the differences between La and Lb. Figure 18 is adapted from (Pérez-Camargo et al., 2019).
Figures 18A,B show the non-isothermal DSC scans. Independently of the addition protocol (La vs. Lb) a bimodal distribution of exotherms and endotherms is obtained. For La, characterized by longer gradients, much broader crystallization and melting range are observable compared with Lb (sequential addition). This longer gradient copolymer (La) combines longer crystallizable sequences (on average), forming thicker lamellae that melt at higher Tm, and shorter crystallizable units that crystallize and melt at lower temperatures. This combination leads to a broad distribution of crystal sizes, explaining the wide exothermic and endothermic signals. On the contrary, for shorter gradients (Lb), the average crystallizable sequence lengths are shorter, leading to narrow exotherms and endotherms at lower temperatures. For both protocols, the increase in DP is equivalent to increasing the molar mass; thus, an increase in the thermal transition is recorded in La and Lb samples as DP increases. But the molar mass effect on the first-order transitions is saturated for DP > 10, leading to negligible differences in Tc and Tm above that DP value.
Figure 18C shows the SSA profiles for both La and Lb samples. The fractionation reflects the chain primary structure, which is affected by the impossibility of PS to crystallize, promoting the fractionation, and the differences between the synthetic protocols. The SSA profiles provide a much clearer curve compared with non-isothermal DSC scans, evidencing the ability of the SSA fractionation to magnify the small differences among the samples. The La samples possess longer ES sequences that melt at the highest temperatures (fractions 1–3) and shorter ES sequences that melt at lower temperatures, creating a bimodal profile. On the contrary, in the Lb samples, Ts1 to Ts3 did not produce any detectable thermal fraction due to the shorter gradient producing only shorter ES sequences that melt at lower temperatures. The changes in DP do not create changes in the Tm,SSA positions but modify each fraction’s peak area. As DP increases, the crystallinity increases; thus, the fraction peak area increases. As in the non-isothermal DSC experiments, the molar mass effects are saturated at DP > 10. Here the SSA technique allows understanding materials with broad endothermic signals in a significantly greater depth than standard DSC alone.
2.7 Using FSC in SSA studies
The FSC allows studying the crystallization phenomena with rates that resemble those employed in industrial processing. This can reduce the testing time and allow studying the early stages of the annealing process, as illustrated in the following cases.
2.7.1 Varying Ts and scanning rates
One of the significant advantages of the SSA technique is its efficiency since it can generate relevant results in much less time than other techniques. Moreover, the testing time can be reduced without losing resolution. Initially, the standard scanning rate for SSA experiments was 10°C/min. Still, Müller and Arnal (2005), following the Pijpers et al. (2002) recommendations, introduce the mass/rate compensation principle, in which sample mass is reduced to compensate for scanning rate increments. This principle allows using a rate as fast as 50°C/min and still achieving a good resolution (comparable with the one obtained at 10°C/min). In terms of time, Müller and Arnal found that by increasing the heating rate, the fractionation time can be reduced from 5.9 h (using a scanning rate of 5°C/min) to 1.3 h (using a scanning rate of 50°C/min) (Müller and Arnal, 2005).
The efforts to speed up the SSA process have continued with Pijpers and Mathot (2008), who found good peak resolution at a heating rate of 200°C/min using a High-Performance DSC. Next, Mathot et al. (2011) demonstrated the feasibility of using a commercial chip-based calorimeter (Flash DSC), by fractionating ethylene-propylene copolymers with a scanning rate of 100°C/s (6,000°C/min).
Cavallo et al. (2016) took advantage of the scanning rate of Flash DSC instruments by using a heating rate of 100°C/s and also varied the ts in a range of 0.001 to 10 s to study the early stages of the thermal fractionation process. These authors fractionated an LLDPE containing circa 4 mol% of 1-octene comonomer. They designed an SSA protocol with Ts, ideal = 105°C as starting Ts, ΔTs = 5°C to cover the temperature range from 105 to 65°C (with a 9-step protocol), and keep a variable ts. Figure 19 shows the final SSA heating obtained by Flash DSC versus the fractionation generated by conventional DSC.
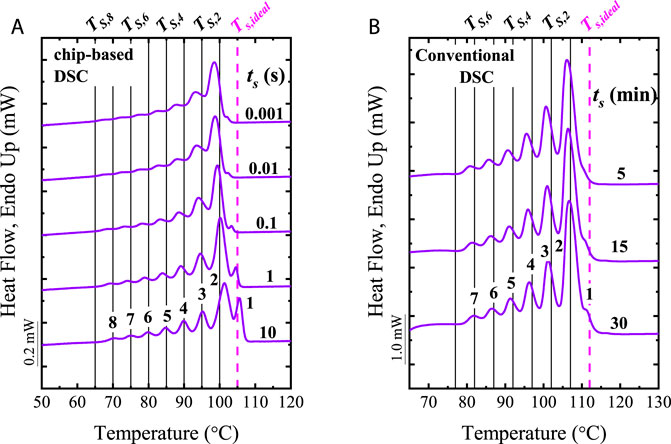
FIGURE 19. SSA profiles recorded by (A) Flash DSC, and (B) Standard DSC with the indicated ts. The vertical lines indicated the employed Ts (including the Ts, ideal with a dash vertical line). Heating rates of 100°C/s and 10°C/min are used with FSC and conventional DSC, respectively. Figure 19 is adapted from (Cavallo et al., 2016).
Figure 19A shows that the SSA by Flash DSC can generate melting traces even at ts as low as 0.001 s, in which the high-temperature traces are discernible. The fractionation quality improves gradually as ts increases, reaching comparable results with the conventional DSC when ts = 10 s. The main difference between the fractionation generated by the Flash DSC and the conventional DSC (see Figure 19B) is the temperature axis: shifting around 5–10°C. Cavallo et al. (2016) attributed this difference to the “standard” semicrystalline state created in each instrument. As expected, there is a significant difference in the cooling conditions from the melt: 0.16°C/s (conventional DSC) vs. 100°C/s (Flash DSC), affecting the thermal stability of the crystals. This is reflected in the Ts, ideal, which depends on the instrument: 105°C (Flash DSC) vs. 112°C (conventional DSC) due to the kinetic nature of the SN process.
Cavallo et al. (2016) systematically evaluated the influence of the ts on the melting temperature, Tm, SSA, the peak area of each fraction, and the ratio of peak height/valley height. The Tm, SSA increases as the ts increase with a non-negligible difference of 2 to 3.5°C depending on the melting fraction and is largest for the crystals annealed at the higher Ts, see Ts, 2 in Figure 19A. This is in line with the expected thickening of the crystals as the annealing time increases. A linear increase of the Tm, SSA vs. log(ts) was found for all the fractions. Thus, the fractionation times are insufficient for the crystals to reach their equilibrium thicknesses, as in the case of conventional DSC with minimum variations of the Tm, SSA (see Figure 19B) with ts = 5 to 30 min. The peak height/valley height ratio increase is equivalent to a better-resolved peak. The resolution increases with ts, reaching at ts = 10 s a similar value to ts = 300 s (obtained by conventional DSC).
Regarding the peak areas, Cavallo et al. (2016) found different relationships with the time depending on the fraction (highest vs. lowest temperature). The peak generated by the highest Ts increases its area as ts increases. For instance, the peak generated at Ts = 100°C (Ts,2 in Figure 19A) rises its area at 0.1 s, whereas the peak at Ts = 95°C (Ts,3 in Figure 19A) starts to increase at shorter times: 0.03 s. The authors attributed this difference to the undercooling-dependent behavior of the crystallization kinetics of LLDPE (Zhuravlev et al., 2016). For “intermediate fractions,” e.g., generated at Ts = 90°C (Ts,4 in Figure 19A), an opposite behavior was observed since the peak area decreased with ts increases. In this case, the molten crystals at Ts = 90°C contribute to the development of more crystals of the fraction generated at Ts = 95°C, leading to a decrease in the peak area. Finally, for the lowest fractions, Ts < Ts,4 (see Figure 19A), the peak area does not vary with ts increases. Therefore, these fractions either reach the maximum attainable crystallinity or the crystallization at high supercooling is extremely fast, needing times < 1 ms for its completion; thus, the employed ts are not enough to resolve the trend. In summary, Cavallo et al. (2016), using Flash DSC were able to reach a thermal fractionation similar to the one obtained by conventional DSC, and also to investigate an unexplored time scale in molecular fractionation, revealing that there are changes in the thermal fractions that can occur at extremely short annealing period, opening a new avenue of research.
2.7.2 Melt memory effect
The melt memory effect has attracted much attention recently, especially by introducing FSC measurements, in which scanning rates and ts can be widely varied. The variation of these variables was studied by Sangroniz et al. (2020a) These authors studied the melt memory effect on PBS as a function of ts (0.1 to 300 s), scanning rate (5 to 500 K/s) and previous standard state.
The study of ts was focused on Domain II, instead of studying the erasing of all the self-nuclei (“dissolution” of self-nuclei or self-seeds) at Ts close to Domain I using long ts. By focusing on Domain II, Sangroniz et al. (2020a) found that the width of Domain II, IIa, and IIb vary with ts. The width of Domain II is reduced with the time spent at Ts due to the transition temperature shift between Domain II and III. The width of Domain II varied from 11°C (ts = 0.1 s) to 7°C (ts = 300 s).
It is expected that at high cooling rates, the self-nuclei lose their effectiveness, and that lower Ts temperatures are needed, i.e., a higher number of self-nuclei is required to induce an increase in Tc. After the step at Ts and the subsequent cooling, the melting enthalpy was used to account for the effect of the cooling rates. It was found that the effectiveness of self-nuclei depends on the applied cooling rate. “When only some self-nuclei were left, at a temperature within Domain II but close to Domain I the results were the same as the sample cooled down from Domain I. When more self-nuclei and probably self-seeds were left at low temperatures within Domain II, the melting enthalpy increased compared to the sample cooled from a homogeneous melt state. From these results, it can be concluded that a high density of self-nuclei and self-seeds was required to increase melting enthalpy significantly”.
Sangroniz et al. (2020a) varied the cooling and heating rates in the creation of the standard state before self-nucleation; thus, in this way, they modified the kinetic character of the self-nucleation process. The authors considered that the critical parameter determining Domain II width is the melting enthalpy, i.e., crystallinity level, obtained during the subsequent heating to the Ts temperature. Thus, it was decided to employ the same scanning rates (cooling and heating rates). By doing this, it was found that the transition temperatures between Domains were reduced as the scanning rates were increased. In addition, the Domain II width and the melting enthalpy, proportional to the crystallinity level, displayed a drastic reduction as the scanning rates increased. The authors pointed out the importance of the melting enthalpy at Ts on the width of the self-nucleation domains.
Intending to increase the crystallinity level, Sangroniz et al. (2020a) applied the SSA protocol before the SN (see Schematic Representation in Figure 20A). Thus, each time that a new Ts was analyzed, the SSA protocol was applied before. Figure 20B shows the superposition of the Tc vs. Ts data on the DSC heating scan of the sample submitted to SSA followed by SN; the Domains are also indicated. In Figure 20C Sangroniz et al. (2020a) compared the influence of a single SN (keeping the sample for ts = 0.1 s at Ts) with the SSA + SN process on Tc and the different Domains. It was found that when SSA is applied, the self-nuclei survive until higher temperatures (120°C (SSA + SN) vs. 117°C (SN)), this result was explained by considering that SSA induced the formation of thicker crystals, which therefore require higher temperatures to transform into the isotropic melt state. The annealing of the crystals, i.e., Domain III, was also observed at higher temperatures (114°C (SSA + SN) vs. 106 (SN)) due to the fact that thicker crystals could anneal at higher temperatures. Finally, as expected, the melting enthalpies of the final melting endotherms are higher for the SSA + SN (1.65x10⁻² mJ) than with only SN (7.67x10⁻³ mJ). By applying the Thomson-Gibbs equation, Sangroniz et al. (2020a) found that the shifts of the Domains to higher temperatures for the sample that had undergone the SSA procedure before SN correspond to an increment of the lamellar thickness (4.9 nm (SSA + SN) vs. 3.4 nm (SN)) and also to an increase in the degree of crystallinity.
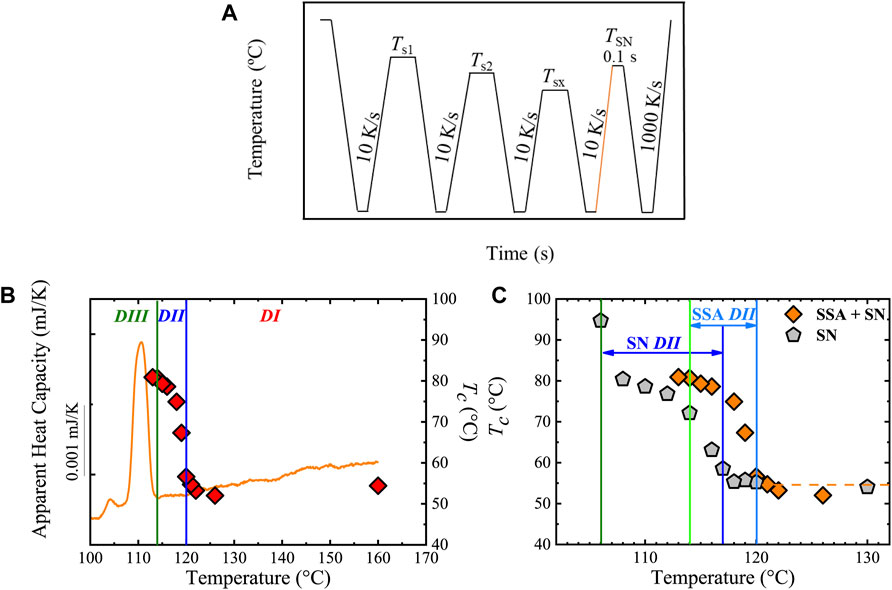
FIGURE 20. (A) Schematic representation of the SSA followed by SN protocol employed to thicken the samples. The thermal history was erased at 160 °C for 30 s, and the standard state (before Ts1) was created at -50°C for 0.1 s; ts = 0.1 s were employed at each Ts. (B) DSC heating scan after the protocol in (A) and the Tc vs. Ts data; (C) Tc vs. Ts data for the single SN and SSA + SN protocols. The vertical lines correspond to the transition temperatures between Domains. Figure 20 is adapted from (Sangroniz et al., 2020a).
Sangroniz et al. (2020a) studied the different parameters that affect the memory effect and, indirectly, the SSA process. In particular, the authors employed the SSA technique to thicken the crystals and increase the crystallinity degree.
3 Conclusions
This paper focuses on reviewing the recent applications (from 2015 to 2022) of the SSA thermal fractionation technique (see Table 1) to show how the process has become a powerful method for studying the distribution of defects affecting crystallization in semi-crystalline polymers and several other aspects of polymer crystallization. First, the SN and SSA principles were briefly reviewed, showing how the Ts, ideal, ΔTs, ts, and scanning rates are crucial parameters to correctly design an SSA protocol. Next, selected applications, beyond those employed in polyolefins analysis, have been grouped into different topics, revealing the most novel applications of the last decade.
The studied material influences the SSA fractionation. In homopolymers, the intermolecular interactions and topological effects (cyclic vs. linear topology, degree of branching, threading effects) impact the Tm, SSA position (e.g., topological restrictions decrease the Tm, SSA), and the number of fractions (e.g., the intermolecular interactions act as defects that interrupt the linear sequences). In nanocomposites, the supernucleation effects could generate high melting fractions (that can be fractionated), which correspond to the most stable crystals. Still, at the same time, even higher melting fractions, without fractionation capacity, do not correspond to ordinary crystals but to special crystals of different nature, e.g., formed during pre-freezing phenomena. On the contrary, for antinucleating effects, strong interactions such as hydrogen bondings and threading effects act as crosslinking points that significantly reduce the material annealing capacity. For copolymers, the crystallization modes in random copolymers generate characteristic SSA profiles, e.g., bimodal vs. unimodal profiles, helping their identification. Refinement of the crystals caused by the SSA help to identify each phase of complex systems as tri-block terpolymers and provide a smooth trend of Tm, SSA vs. composition that allows estimating the equilibrium melting temperatures.
The refining capacity of the SSA has become a tool to 1) enhance the morphology and study both solid-solid transitions and characterize complex materials, such as polyurethanes, and 2) study blends; not only their miscibility but also a method has been proposed to determine the weight fraction of the components in fractionated blends. This work also demonstrated that the SSA had become a tool to evaluate synthesis conditions. The SSA profiles help analyze crosslinking vs. chain extension reactions in polyamides and identify the comonomer addition protocols employed in the synthesis of gradient copolymers.
All the above-mentioned applications can be boosted, reducing the time requirement, or changing SSA parameters by using FSC. Moreover, the FSC opens a new research venue by studying the early stages of fractionation. The SSA technique has been a helpful method in the polyolefins fields, becoming a quality control tool in industry. In the last decades, its applications have been extended to many other materials, covering complex systems, revealing helpful information, and providing further understanding of the different phenomena. The introduction of the fastest testing rates with both conventional DSC and FSC has reduced the testing times and improved the SSA technique even more. In addition, the ability to use the SSA fractionation coupled with other characterization techniques such as WAXS/SAXS, and FT-IR, among others, increments its versatility and potentiality to continue growing and become a characterization technique able to provide novel insights into the crystallization and structure of all kinds of polymeric semi-crystalline materials.
Author contributions
All authors listed have made a substantial, direct, and intellectual contribution to the work and approved it for publication.
Funding
This work has received funding from the Basque Government through grant IT1503-22 and from MICINN (PID 2020-113045GB-C21). We would also like to acknowledge the financial support from the BIODEST and the REPOL projects; these projects have received funding from the European Union’s Horizon 2020 research and innovation program under the Marie Skłodowska-Curie grant agreements No. 778092 and No. 860221. It has also been supported by the National Natural Science Foundation of China (51820105005, 52050410327).
Acknowledgments
RAP-C is thankful for financial support from the National Natural Science Foundation of China. AJM is thankful for financial support from the Basque Government, the European Union’s Horizon 2020 research and innovation program.
Conflict of interest
The authors declare that the research was conducted in the absence of any commercial or financial relationships that could be construed as a potential conflict of interest.
Publisher’s note
All claims expressed in this article are solely those of the authors and do not necessarily represent those of their affiliated organizations, or those of the publisher, the editors and the reviewers. Any product that may be evaluated in this article, or claim that may be made by its manufacturer, is not guaranteed or endorsed by the publisher.
References
Abedini, A., Shafiei, M., Jamjah, R., and Ghasemi, I. (2021). In situ polymerization of ethylene in the presence of graphene by α-diimine Nickel (II)/MAO catalyst system: Thermal and rheological study. Appl. Organomet. Chem. 35 (7), e6244. doi:10.1002/aoc.6244
Ahmadjo, S., Avar, S., Jafaraian, H., Galland, G. B., Mortazavi, S. M. M., and Zahmaty, M. (2017). Microstructural study of synthesized polyethylenes by homogeneous and heterogeneous nickel α-diimine catalysts. Iran. Polym. J. 26 (3), 221–228. doi:10.1007/s13726-017-0514-4
Altorbaq, A. S., Krauskopf, A. A., Wen, X., Pérez-Camargo, R. A., Su, Y., Wang, D., et al. (2022). Crystallization kinetics and nanoparticle ordering in semicrystalline polymer nanocomposites. Prog. Polym. Sci. 128, 101527. doi:10.1016/j.progpolymsci.2022.101527
Appiah, C., Woltersdorf, G., Pérez-Camargo, R. A., Müller, A. J., and Binder, W. H. (2017). Crystallization behavior of precision polymers containing azobenzene defects. Eur. Polym. J. 97, 299–307. doi:10.1016/j.eurpolymj.2017.10.023
Arandia, I., Mugica, A., Zubitur, M., Arbe, A., Liu, G., Wang, D., et al. (2015). How composition determines the properties of isodimorphic poly(butylene succinate-ran-butylene azelate) random biobased copolymers: From single to double crystalline random copolymers. Macromolecules 48 (1), 43–57. doi:10.1021/ma5023567
Arandia, I., Mugica, A., Zubitur, M., Iturrospe, A., Arbe, A., Liu, G., et al. (2016). Application of SSA thermal fractionation and X-ray diffraction to elucidate comonomer inclusion or exclusion from the crystalline phases in poly(butylene succinate-ran-butylene azelate) random copolymers. J. Polym. Sci. Part B Polym. Phys. 54 (22), 2346–2358. doi:10.1002/polb.24146
Arandia, I., Zaldua, N., Maiz, J., Pérez-Camargo, R. A., Mugica, A., Zubitur, M., et al. (2019). Tailoring the isothermal crystallization kinetics of isodimorphic poly (butylene succinate-ran-butylene azelate) random copolymers by changing composition. Polymer 183, 121863. doi:10.1016/j.polymer.2019.121863
Arnal, M. L., Sánchez, J. J., and Müller, A. J. (2001). Miscibility of linear and branched polyethylene blends by thermal fractionation: Use of the successive self-nucleation and annealing (SSA) technique. Polymer 42 (16), 6877–6890. doi:10.1016/S0032-3861(01)00177-X
Arráez, F. J., Arnal, M. L., and Müller, A. J. (2018). Thermal and UV degradation of polypropylene with pro-oxidant. Abiotic characterization. J. Appl. Polym. Sci. 135 (14), 46088. doi:10.1002/app.46088
Atiqullah, M., Cibulková, Z., Černá, A., Šimon, P., Hussain, I., Al-Harthi, M. A., et al. (2015). Effects of supported metallocene catalyst active center multiplicity on antioxidant-stabilized ethylene homo- and copolymers. J. Therm. Anal. Calorim. 119 (1), 581–595. doi:10.1007/s10973-014-4167-7
Baur, V. H. (1966). Einfluß der sequenzlängenverteilung auf das schmelz-ende von copolymeren. Makromol. Chem. 98 (1), 297–301. doi:10.1002/macp.1966.020980130
Bittiger, H., Marchessault, R. H., and Niegisch, W. D. (1970). Crystal structure of poly-ε-caprolactone. Acta Crystallogr. Sect. B 26 (12), 1923–1927. doi:10.1107/S0567740870005198
Canetti, M., Leone, G., Ricci, G., and Bertini, F. (2015). Structure and thermal properties of ethylene/4-methyl-1-pentene copolymers: Effect of comonomer and monomer sequence distribution. Eur. Polym. J. 73, 423–432. doi:10.1016/j.eurpolymj.2015.10.035
Carmeli, E., Tranchida, D., Albrecht, A., Müller, A. J., and Cavallo, D. (2020). A tailor-made Successive Self-nucleation and Annealing protocol for the characterization of recycled polyolefin blends. Polymer 203, 122791. doi:10.1016/j.polymer.2020.122791
Cavallo, D., Lorenzo, A. T., and Müller, A. J. (2016). Probing the early stages of thermal fractionation by successive self-nucleation and annealing performed with fast scanning chip-calorimetry. J. Polym. Sci. Part B Polym. Phys. 54 (21), 2200–2209. doi:10.1002/polb.24129
Chatani, Y., Okita, Y., Tadokoro, H., and Yamashita, Y. (1970). Structural studies of polyesters. III. Crystal structure of poly-ε-caprolactone. Polym. J. 1 (5), 555–562. doi:10.1295/polymj.1.555
Chen, F., Shanks, R. A., and Amarasinghe, G. (2001). Crystallisation of single-site polyethylene blends investigated by thermal fractionation techniques. Polymer 42 (10), 4579–4587. doi:10.1016/S0032-3861(00)00859-4
Colonna, S., Pérez-Camargo, R. A., Chen, H., Liu, G., Wang, D., Müller, A. J., et al. (2017). Supernucleation and orientation of poly(butylene terephthalate) crystals in nanocomposites containing highly reduced graphene oxide. Macromolecules 50 (23), 9380–9393. doi:10.1021/acs.macromol.7b01865
Denisova, Y. I., Shandryuk, G. A., Arinina, M. P., Levin, I. S., Zhigarev, V. A., Gringolts, M. L., et al. (2021). Multiblock copolymers of norbornene and cyclododecene: Chain structure and properties. Polymers 13 (11), 1756. doi:10.3390/polym13111756
Ding, C., Zhang, G., Gu, J., Cao, F., and Zheng, X. (2017). Application of the correct design of successive self-nucleation and annealing (SSA) to study the stereo-defects and its distribution of homo- and co-polypropylene. RSC Adv. 7 (40), 24870–24877. doi:10.1039/C7RA03301J
Drummond, K. M., Hopewell, J. L., and Shanks, R. A. (2000). Crystallization of low-density polyethylene- and linear low-density polyethylene-rich blends. J. Appl. Polym. Sci. 78 (5), 1009–1016. doi:10.1002/1097-4628(20001031)78:5<1009::AID-APP100>3.0.CO;2-2
Eselem Bungu, P., Pflug, K., and Pasch, H. (2020). Selectivity of thermal analysis in the branching analysis of low density polyethylene. Macromol. Chem. Phys. 221 (12), 2000095. doi:10.1002/macp.202000095
Eselem Bungu, P. S., and Pasch, H. (2019). Bivariate molecular structure distribution of randomly branched polyethylene by orthogonal preparative fractionation. Polym. Chem. 10 (19), 2484–2494. doi:10.1039/C9PY00343F
Eselem Bungu, P. S., Pflug, K., and Pasch, H. (2018). Combination of preparative and two-dimensional chromatographic fractionation with thermal analysis for the branching analysis of polyethylene. Polym. Chem. 9 (22), 3142–3157. doi:10.1039/C8PY00522B
Eselem Bungu, P. S., Zentel, K., Hintenlang, S., Busch, M., and Pasch, H. (2020). Comprehensive analysis of polyethylene graft copolymers by preparative fractionation, interaction chromatography, and thermal analysis. ACS Appl. Polym. Mat. 2 (12), 5864–5877. doi:10.1021/acsapm.0c01094
Fernández-d'Arlas, B., Maiz, J., Pérez-Camargo, R. A., Baumann, R-P., Pöselt, E., Dabbous, R., et al. (2021). SSA fractionation of thermoplastic polyurethanes. Polym. Cryst. 4 (1), e10148. doi:10.1002/pcr2.10148
Fernández-d’Arlas Bidegain, B., Pérez-Camargo, R. A., Palacios, J. K., and Müller, A. J. (2022). Copolímeros hidrosolubles con alta densidad de uretano. Rev. Latinoam. De. Metal. Y Mater.
Fillon, B., Thierry, A., Lotz, B., and Wittmann, J. C. (1994). Efficiency scale for polymer nucleating agents. J. Therm. analysis 42 (4), 721–731. doi:10.1007/BF02546745
Fillon, B., Wittmann, J. C., Lotz, B., and Thierry, A. (1993). Self‐nucleation and recrystallization of isotactic polypropylene (α phase) investigated by differential scanning calorimetry. J. Polym. Sci. B. Polym. Phys. 31 (10), 1383–1393. doi:10.1002/polb.1993.090311013
Flieger, A-K., Schulz, M., and Thurn-Albrecht, T. (2018). Interface-induced crystallization of polycaprolactone on graphite via first-order prewetting of the crystalline phase. Macromolecules 51 (1), 189–194. doi:10.1021/acs.macromol.7b02113
Flores, I., Pérez-Camargo, R. A., Gabirondo, E., Caputo, M. R., Liu, G., Wang, D., et al. (2022). Unexpected structural properties in the saturation region of the odd–even effects in aliphatic polyethers: Influence of crystallization conditions. Macromolecules 55 (2), 584–594. doi:10.1021/acs.macromol.1c02235
Flory, P. J. (1955). Theory of crystallization in copolymers. Trans. Faraday Soc. 51 (0), 848–857. doi:10.1039/TF9555100848
Flory, P. J. (1949). Thermodynamics of crystallization in high polymers. IV. A theory of crystalline states and fusion in polymers, copolymers, and their mixtures with diluents. J. Chem. Phys. 17 (3), 223–240. doi:10.1063/1.1747230
Franco-Urquiza, E. A., Santana, O., and Maspoch, M. L. (2021). Influence of the melt extrusion process on the mechanical behavior and the thermal properties of ethylene vinyl alcohol copolymer by applying the successive self-nucleation and annealing thermal fractionation. Fibers Polym. 22 (7), 1822–1829. doi:10.1007/s12221-021-0386-2
Gedde, U. W., and Hedenqvist, M. S. (2019). Fundamental polymer science. Cham: Springer International Publishing, 327–386.Crystallization kinetics
Ghasemi Hamedani, N., Arabi, H., and Poorsank, F. (2020). Towards the design of a mixture of diether and succinate as an internal donor in a MgCl2-supported Ziegler–Natta catalyst. New J. Chem. 44 (36), 15758–15768. doi:10.1039/D0NJ02676J
Gholami, F., Pircheraghi, G., Rashedi, R., and Sepahi, A. (2019). Correlation between isothermal crystallization properties and slow crack growth resistance of polyethylene pipe materials. Polym. Test. 80, 106128. doi:10.1016/j.polymertesting.2019.106128
Góra, M., Tranchida, D., Albrecht, A., Müller, A. J., and Cavallo, D. Fast successive self-nucleation and annealing (SSA) thermal fractionation protocol for the characterization of polyolefin blends from mechanical recycling. J. Polym. Sci. doi:10.1002/pol.20220104
Groch, P., Bihun-Kisiel, A., Piontek, A., and Ochędzan-Siodłak, W. (2020). Structural and thermal properties of ethylene-norbornene copolymers obtained using vanadium homogeneous and SIL catalysts. Polymers 12 (11), 2433. doi:10.3390/polym12112433
Gumede, T. P., Luyt, A. S., Pérez-Camargo, R. A., Iturrospe, A., Arbe, A., Zubitur, M., et al. (2016). Plasticization and cocrystallization in LLDPE/wax blends. J. Polym. Sci. Part B Polym. Phys. 54 (15), 1469–1482. doi:10.1002/polb.24039
Gumede, T. P. (2021). The overall crystallization behavior of polyethylene/wax blends as phase change materials for thermal energy storage: A mini review. J. Vinyl Addit. Technol. 27 (3), 469–484. doi:10.1002/vnl.21836
Hakim, S., Nekoomanesh, M., and Shahrokhinia, A. (2019). The relationship among changes in microstructure, active sites behavior and properties in the propylene polymerization with a 4th generation Ziegler-Natta catalyst. Polyolefins J. 6 (2), 139–150. doi:10.22063/poj.2019.2337.1127
Haque, F. M., and Grayson, S. M. (2020). The synthesis, properties and potential applications of cyclic polymers. Nat. Chem. 12 (5), 433–444. doi:10.1038/s41557-020-0440-5
Hato, M. J., and Luyt, A. S. (2007). Thermal fractionation and properties of different polyethylene/wax blends. J. Appl. Polym. Sci. 104 (4), 2225–2236. doi:10.1002/app.25494
Hoffman, J. D. (1964). Theoretical aspects of polymer crystallization with chain folds: Bulk polymers. Polym. Eng. Sci. 4 (4), 315–362. doi:10.1002/pen.760040413
Hoffman, J. D., and Weeks, J. J. (1962). Melting process and the equilibrium melting temperature of polychlorotrifluoroethylene. J. Res. Natl. Bur. Stand Sect. A 66A (1), 13–28. doi:10.6028/jres.066A.003
Hoskins, J. N., and Grayson, S. M. (2009). Synthesis and degradation behavior of cyclic poly(ε-caprolactone). Macromolecules 42 (17), 6406–6413. doi:10.1021/ma9011076
Hu, H., and Dorset, D. L. (1990). Crystal structure of poly(iε-caprolactone). Macromolecules 23 (21), 4604–4607. doi:10.1021/ma00223a017
Huang, R., Zhang, Y., Xiang, A., Ma, S., Tian, H., Ouyang, Y., et al. (2022). Crystallization behavior of polyvinyl alcohol with inorganic nucleating agent talc and regulation mechanism analysis. J. Polym. Environ. 30, 3163–3173. doi:10.1007/s10924-022-02408-2
Kang, J., Peng, H., Wang, B., Chen, J., Yang, F., Cao, Y., et al. (2015). Investigation on the self-nucleation behavior of controlled-rheology polypropylene. J. Macromol. Sci. Part B 54 (2), 127–142. doi:10.1080/00222348.2014.982481
Kapnistos, M., Lang, M., Vlassopoulos, D., Pyckhout-Hintzen, W., Richter, D., Cho, D., et al. (2008). Unexpected power-law stress relaxation of entangled ring polymers. Nat. Mat. 7 (12), 997–1002. doi:10.1038/nmat2292
Keating, M. Y., and McCord, E. F. (1994). Evaluation of the comonomer distribution in ethylene copolymers using DSC fractionation. Thermochim. Acta 243 (2), 129–145. doi:10.1016/0040-6031(94)85048-8
Khoshsefat, M., Dechal, A., Ahmadjo, S., Mortazavi, S. M. M., Zohuri, G., and Soares, J. B. P. (2019). Cooperative effect through different bridges in nickel catalysts for polymerization of ethylene. Appl. Organomet. Chem. 33 (6), e4929. doi:10.1002/aoc.4929
Kitahara, T., Yamazaki, S., and Kimura, K. (2011). Effects of topological constraint and knot entanglement on the crystal growth of polymers proved by growth rate of spherulite of cyclic polyethylene. KOBUNSHI RONBUNSHU 68 (10), 694–701. doi:10.1295/koron.68.694
Laurent, B. A., and Grayson, S. M. (2006). An efficient route to well-defined macrocyclic polymers via “click” cyclization. J. Am. Chem. Soc. 128 (13), 4238–4239. doi:10.1021/ja0585836
Laurichesse, S., and Avérous, L. (2013). Synthesis, thermal properties, rheological and mechanical behaviors of lignins-grafted-poly(ε-caprolactone). Polymer 54 (15), 3882–3890. doi:10.1016/j.polymer.2013.05.054
Leone, G., Canetti, M., Pierro, I., Zanchin, G., De Rosa, C., Ricci, G., et al. (2019). (Micro)structure, thermal behavior and mechanical properties of ethylene–propylene–1-octadecene terpolymers from chain-walking polymerization of 1-octadecene. Polymer 166, 27–37. doi:10.1016/j.polymer.2019.01.029
Létoffé, A., García-Rodríguez, S. M., Hoppe, S., Canilho, N., Godard, O., Pasc, A., et al. (2019). Switching from brittle to ductile isotactic polypropylene-g-maleic anhydride by crosslinking with capped-end polyether diamine. Polymer 164, 67–78. doi:10.1016/j.polymer.2019.01.015
Létoffé, A., Hoppe, S., Lainé, R., Canilho, N., Pasc, A., Rouxel, D., et al. (2019). Resilience improvement of an isotactic polypropylene-g-maleic anhydride by crosslinking using polyether triamine agents. Polymer 179, 121655. doi:10.1016/j.polymer.2019.121655
Li, J., Wang, Y., Wang, X., and Wu, D. (2019). Crystalline characteristics, mechanical properties, thermal degradation kinetics and hydration behavior of biodegradable fibers melt-spun from polyoxymethylene/poly(l-lactic acid) blends. Polymers 11 (11), 1753. doi:10.3390/polym11111753
Li, K., Battegazzore, D., Pérez-Camargo, R. A., Liu, G., Monticelli, O., Müller, A. J., et al. (2021). Polycaprolactone adsorption and nucleation onto graphite nanoplates for highly flexible, thermally conductive, and thermomechanically stiff nanopapers. ACS Appl. Mat. Interfaces 13 (49), 59206–59220. doi:10.1021/acsami.1c16201
Li, L., Zhong, L., Zhang, K., Gao, J., Xu, M., and Wang, Y. (2018). New insight on improving electrical strength and toughness of polyethylene blends: Turning point of supramolecular structure. AIP Adv. 8 (12), 125127. doi:10.1063/1.5053416
Li, P., Xue, Y., Liu, W., Sun, G., and Ji, X. (2019). Chain structure comparison of two low density polyethylene resins fractionated by temperature rising elution fractionation and thermal fractionation. J. Polym. Res. 26 (3), 56. doi:10.1007/s10965-019-1715-7
Li, P., Xue, Y., Wu, X., Sun, G., Ji, X., and Bo, S. (2018). Microstructure characterization of one high-speed extrusion coating polyethylene resin fractionated by solvent gradient fractionation. J. Polym. Res. 25 (5), 113. doi:10.1007/s10965-018-1480-z
Li, X., Wang, L., Wang, D., Müller, A. J., and Dong, X. (2021). Competition between chain extension and crosslinking in polyamide 1012 during high-temperature thermal treatments as revealed by successive self-nucleation and annealing fractionation. Macromolecules 54, 7552–7563. doi:10.1021/acs.macromol.1c01252
Li, Y., Jiang, B., Li, W., Wang, J., and Yang, Y. (2021). The chain microstructure and condensed structure of polyethylene resin used for Biaxially stretched film. J. Appl. Polym. Sci. 138 (2), 49652. doi:10.1002/app.49652
Liénard, R., De Winter, J., and Coulembier, O. (2020). Cyclic polymers: Advances in their synthesis, properties, and biomedical applications. J. Polym. Sci. 58 (11), 1481–1502. doi:10.1002/pol.20200236
Liu, Q., Liu, S., Lv, Y., Huang, Y., Kong, M., Yang, Q., et al. (2020). Photo-degradation of polyethylene under stress: A successive self-nucleation and annealing (SSA) study. Polym. Degrad. Stab. 172, 109060. doi:10.1016/j.polymdegradstab.2019.109060
Liu, X., Wang, Y., Wang, Z., Cavallo, D., Müller, A. J., Zhu, P., et al. (2020). The origin of memory effects in the crystallization of polyamides: Role of hydrogen bonding. Polymer 188, 122117. doi:10.1016/j.polymer.2019.122117
Liu, Y., Zhang, R., Ren, H., Liu, Y., Ling, S., Zhang, H., et al. (2020). CrV bimetallic phillips catalyst prepared by citric acid-assisted impregnation on ethylene polymerization. Macromol. Chem. Phys. 221 (10), 2000010. doi:10.1002/macp.202000010
López, J. V., Pérez-Camargo, R. A., Zhang, B., Grayson, S. M., and Müller, A. J. (2016). The influence of small amounts of linear polycaprolactone chains on the crystallization of cyclic analogue molecules. RSC Adv. 6 (53), 48049–48063. doi:10.1039/c6ra04823d
Lorenzo, A. T., Arnal, M. L., Müller, A. J., Boschetti de Fierro, A., and Abetz, V. (2006). Confinement effects on the crystallization and SSA thermal fractionation of the PE block within PE-b-PS diblock copolymers. Eur. Polym. J. 42 (3), 516–533. doi:10.1016/j.eurpolymj.2005.09.001
Lotz, B. (2021). Brill transition in nylons: The structural scenario. Macromolecules 54 (2), 565–583. doi:10.1021/acs.macromol.0c02409
Lotz, B. (2021). Original crystal structures of even–even polyamides made of pleated and rippled sheets. Macromolecules 54 (2), 551–564. doi:10.1021/acs.macromol.0c02404
Luyt, A. S., and Gasmi, S. (2016). Influence of blending and blend morphology on the thermal properties and crystallization behaviour of PLA and PCL in PLA/PCL blends. J. Mat. Sci. 51 (9), 4670–4681. doi:10.1007/s10853-016-9784-z
Ma, Y., Cheng, R., Li, J., Zhong, L., Liu, Z., He, X., et al. (2015). Effect of Mo-modification over Phillips CrOx/SiO2 catalyst for ethylene polymerization. J. Organomet. Chem. 791, 311–321. doi:10.1016/j.jorganchem.2015.05.058
Mathot, V., Pyda, M., Pijpers, T., Vanden Poel, G., van de Kerkhof, E., van Herwaarden, S., et al. (2011). The Flash DSC 1, a power compensation twin-type, chip-based fast scanning calorimeter (FSC): First findings on polymers. Thermochim. Acta 522 (1), 36–45. doi:10.1016/j.tca.2011.02.031
Meunier, D. M., Wade, J. H., Janco, M., Cong, R., Gao, W., Li, Y., et al. (2021). Recent advances in separation-based techniques for synthetic polymer characterization. Anal. Chem. 93 (1), 273–294. doi:10.1021/acs.analchem.0c04352
Michell, R. M., Mugica, A., Zubitur, M., and Müller, A. J. (2017). “Self-nucleation of crystalline phases within homopolymers, polymer blends, copolymers, and nanocomposites,” in Polymer crystallization I: From chain microstructure to processing. Editors F. Auriemma, G. C. Alfonso, and C. de Rosa (Cham: Springer International Publishing), 215–256.
Mincheva, R., Delangre, A., Raquez, J-M., Narayan, R., and Dubois, P. (2013). Biobased polyesters with composition-dependent thermomechanical properties: Synthesis and characterization of poly(butylene succinate-co-butylene azelate). Biomacromolecules 14 (3), 890–899. doi:10.1021/bm301965h
Müller, A. J., and Arnal, M. L. (2005). Thermal fractionation of polymers. Prog. Polym. Sci. 30 (5), 559–603. doi:10.1016/j.progpolymsci.2005.03.001
Müller, A. J., Hernández, Z. H., Arnal, M. L., and Sánchez, J. J. (1997). Successive self-nucleation/annealing (SSA): A novel technique to study molecular segregation during crystallization. Polym. Bull. 39 (4), 465–472. doi:10.1007/s002890050174
Müller, A. J., Michell, R. M., Pérez, R. A., and Lorenzo, A. T. (2015). Successive Self-nucleation and Annealing (SSA): Correct design of thermal protocol and applications. Eur. Polym. J. 65, 132–154. doi:10.1016/j.eurpolymj.2015.01.015
Ogier, S., Vidal, C., Chapron, D., Bourson, P., Royaud, I., Ponçot, M., et al. (2017). A comparative study of calorimetric methods to determine the crosslinking degree of the ethylene-Co-vinyl acetate polymer used as a photovoltaic encapsulant. J. Polym. Sci. Part B Polym. Phys. 55 (11), 866–876. doi:10.1002/polb.24335
Palacios, J. K., Liu, G., Wang, D., Hadjichristidis, N., and Müller, A. J. (2019). Generating triple crystalline superstructures in melt miscible PEO-b-PCL-b-PLLA triblock terpolymers by controlling thermal history and sequential crystallization. Macromol. Chem. Phys. 220 (20), 1900292. doi:10.1002/macp.201900292
Pan, P., and Inoue, Y. (2009). Polymorphism and isomorphism in biodegradable polyesters. Prog. Polym. Sci. 34 (7), 605–640. doi:10.1016/j.progpolymsci.2009.01.003
Pérez, R. A., Córdova, M. E., López, J. V., Hoskins, J. N., Zhang, B., Grayson, S. M., et al. (2014). Nucleation, crystallization, self-nucleation and thermal fractionation of cyclic and linear poly(ε-caprolactone)s. React. Funct. Polym. 80, 71–82. doi:10.1016/j.reactfunctpolym.2013.10.013
Pérez, R. A., López, J. V., Hoskins, J. N., Zhang, B., Grayson, S. M., Casas, M. T., et al. (2014). Nucleation and antinucleation effects of functionalized carbon nanotubes on cyclic and linear poly(ε-caprolactones). Macromolecules 47 (11), 3553–3566. doi:10.1021/ma5005869
Pérez-Camargo, R. A., Arandia, I., Safari, M., Cavallo, D., Lotti, N., Soccio, M., et al. (2018). Crystallization of isodimorphic aliphatic random copolyesters: Pseudo-eutectic behavior and double-crystalline materials. Eur. Polym. J. 101, 233–247. doi:10.1016/j.eurpolymj.2018.02.037
Pérez-Camargo, R. A., d’Arcy, R., Iturrospe, A., Arbe, A., Tirelli, N., and Müller, A. J. (2019). Influence of chain primary structure and topology (branching) on crystallization and thermal properties: The case of polysulfides. Macromolecules 52 (5), 2093–2104. doi:10.1021/acs.macromol.8b02659
Pérez-Camargo, R. A., Liu, G., Cavallo, D., Wang, D., and Müller, A. J. (2020). Effect of the crystallization conditions on the exclusion/inclusion balance in biodegradable poly(butylene succinate-ran-butylene adipate) copolymers. Biomacromolecules 21 (8), 3420–3435. doi:10.1021/acs.biomac.0c00847
Pérez-Camargo, R. A., Liu, G., Meabe, L., Zhao, Y., Sardon, H., Müller, A. J., et al. (2021). Using successive self-nucleation and annealing to detect the solid–solid transitions in poly(hexamethylene carbonate) and poly(octamethylene carbonate). Macromolecules 54 (20), 9670–9680. doi:10.1021/acs.macromol.1c01856
Pérez-Camargo, R. A., Liu, G., Meabe, L., Zhao, Y., Sardon, H., Wang, D., et al. (2021). Solid–solid crystal transitions (δ to α) in poly(hexamethylene carbonate) and poly(octamethylene carbonate). Macromolecules 54 (15), 7258–7268. doi:10.1021/acs.macromol.1c01188
Pérez-Camargo, R. A., Liu, G-M., Wang, D-J., and Müller, A. J. (2022). Experimental and data fitting guidelines for the determination of polymer crystallization kinetics. Chin. J. Polym. Sci. 40 (6), 658–691. doi:10.1007/s10118-022-2724-2
Pérez-Camargo, R. A., Meabe, L., Liu, G., Sardon, H., Zhao, Y., Wang, D., et al. (2020). Even–odd effect in aliphatic polycarbonates with different chain lengths: From poly (hexamethylene carbonate) to poly (dodecamethylene carbonate). Macromolecules 54 (1), 259–271. doi:10.1021/acs.macromol.0c02374
Pérez-Camargo, R. A., Mugica, A., Zubitur, M., and Müller, A. J. (2017). “Crystallization of cyclic polymers,” in Polymer crystallization I: From chain microstructure to processing. Editors F. Auriemma, G. C. Alfonso, and C. de Rosa (Cham: Springer International Publishing), 93–132.
Pérez–Camargo, R. A., Saenz, G., Laurichesse, S., Casas, M. T., Puiggalí, J., Avérous, L., et al. (2015). Nucleation, crystallization, and thermal fractionation of poly (ε-Caprolactone)-Grafted-Lignin: Effects of grafted chains length and lignin content. J. Polym. Sci. Part B Polym. Phys. 53 (24), 1736–1750. doi:10.1002/polb.23897
Pijpers, M. F. J., and Mathot, V. B. F. (2008). Optimization of instrument response and resolution of standard- and high-speed power compensation DSC. J. Therm. Anal. Calorim. 93 (1), 319–327. doi:10.1007/s10973-007-8924-8
Pijpers, T. F. J., Mathot, V. B. F., Goderis, B., Scherrenberg, R. L., and van der Vegte, E. W. (2002). High-speed calorimetry for the study of the kinetics of (De)vitrification, crystallization, and melting of macromolecules. Macromolecules 35 (9), 3601–3613. doi:10.1021/ma011122u
Rahmatiyan, S., Bahri-Laleh, N., Hanifpour, A., and Nekoomanesh-Haghighi, M. (2019). Different behaviors of metallocene and Ziegler–Natta catalysts in ethylene/1, 5-hexadiene copolymerization. Polym. Int. 68 (1), 94–101. doi:10.1002/pi.5700
Rashedi, R., and Sharif, F. (2015). Variation of comonomer content in LLDPE particles with different sizes from an industrial fluidized bed reactor. Ind. Eng. Chem. Res. 54 (40), 9870–9876. doi:10.1021/acs.iecr.5b02186
Ruiz, M. B., Pérez-Camargo, R. A., López, J. V., Penott-Chang, E., Múgica, A., Coulembier, O., et al. (2021). Accelerating the crystallization kinetics of linear polylactides by adding cyclic poly ( -lactide): Nucleation, plasticization and topological effects. Int. J. Biol. Macromol. 186, 255–267. doi:10.1016/j.ijbiomac.2021.07.028
Sanchez, I. C., and Eby, R. K. (1975). Thermodynamics and crystallization of random copolymers. Macromolecules 8 (5), 638–641. doi:10.1021/ma60047a012
Sangroniz, L., Alamo, R. G., Cavallo, D., Santamaría, A., Müller, A. J., and Alegría, A. (2018). Differences between isotropic and self-nucleated PCL melts detected by dielectric experiments. Macromolecules 51 (10), 3663–3671. doi:10.1021/acs.macromol.8b00708
Sangroniz, L., Cavallo, D., and Müller, A. J. (2020). Self-nucleation effects on polymer crystallization. Macromolecules 53 (12), 4581–4604. doi:10.1021/acs.macromol.0c00223
Sangroniz, L., Jang, Y-J., Hillmyer, M. A., and Müller, A. J. (2022). The role of intermolecular interactions on melt memory and thermal fractionation of semicrystalline polymers. J. Chem. Phys. 156 (14), 144902. doi:10.1063/5.0087782
Sangroniz, L., Ocando, C., Cavallo, D., and Müller, A. J. (2020). Melt memory effects in poly(butylene succinate) studied by differential fast scanning calorimetry. Polymers 12 (12), 2796. doi:10.3390/polym12122796
Satti, A. J., Andreucetti, N. A., Vallés, E. M., Carella, J. M., and Pérez, C. J. (2016). Use of SSA to detect structural changes in metallocenic ethylene/α-olefin copolymers and their free radical post-reactor modifications. Polym. Degrad. Stab. 125, 43–48. doi:10.1016/j.polymdegradstab.2016.01.001
Shandryuk, G. A., Denisova, Y. I., Gringolts, M. L., Krentsel, L. B., Litmanovich, A. D., Finkelshtein, E. S., et al. (2017). Peculiarities of crystallization in the multiblock copolymers of norbornene and cyclooctene. Eur. Polym. J. 86, 143–153. doi:10.1016/j.eurpolymj.2016.11.025
Shanks, R. A., and Amarasinghe, G. (2000). Crystallisation of blends of LLDPE with branched VLDPE. Polymer 41 (12), 4579–4587. doi:10.1016/S0032-3861(99)00678-3
Shen, Z., Zhang, J., Zhu, W., Zheng, L., Li, C., Xiao, Y., et al. (2018). A solvent-free route to non-isocyanate poly(carbonate urethane) with high molecular weight and competitive mechanical properties. Eur. Polym. J. 107, 258–266. doi:10.1016/j.eurpolymj.2018.08.006
Shin, E. J., Jeong, W., Brown, H. A., Koo, B. J., Hedrick, J. L., and Waymouth, R. M. (2011). Crystallization of cyclic polymers: Synthesis and crystallization behavior of high molecular weight cyclic poly(ε-caprolactone)s. Macromolecules 44 (8), 2773–2779. doi:10.1021/ma102970m
Strobl, B. H. T. H. M. I. E. S. (1999). Steps in the transition of an entangled polymer melt to the partially crystalline state. New J. Phys. 1, 17. doi:10.1088/1367-2630/1/1/317
Strobl, G. (2007). “A multiphase model describing polymer crystallization and melting,” in Progress in understanding of polymer crystallization. Editors G. Reiter, and G. R. Strobl (Berlin, Heidelberg: Springer Berlin Heidelberg), 481–502.
Su, H-H., Chen, H-L., Díaz, A., Casas, M. T., Puiggalí, J., Hoskins, J. N., et al. (2013). New insights on the crystallization and melting of cyclic PCL chains on the basis of a modified Thomson–Gibbs equation. Polymer 54 (2), 846–859. doi:10.1016/j.polymer.2012.11.066
Takeshita, H., Poovarodom, M., Kiya, T., Arai, F., Takenaka, K., Miya, M., et al. (2012). Crystallization behavior and chain folding manner of cyclic, star and linear poly(tetrahydrofuran)s. Polymer 53 (23), 5375–5384. doi:10.1016/j.polymer.2012.09.019
Tanasi, P., Asensio, M., Herrero, M., Núñez, K., Cañibano, E., and Merino, J. C. (2020). Control of branches distribution in linear PE copolymers using fibrillar nanoclay as support of catalyst system. Polymer 202, 122707. doi:10.1016/j.polymer.2020.122707
Tariq, M., Dolynchuk, O., and Thurn-Albrecht, T. (2020). Independent variation of transition temperature and prefrozen layer thickness at the prefreezing transition. J. Phys. Chem. C 124 (48), 26184–26192. doi:10.1021/acs.jpcc.0c05760
Tezuka, Y. (2020). Cyclic and topological polymers: Ongoing innovations and upcoming breakthroughs. React. Funct. Polym. 148, 104489. doi:10.1016/j.reactfunctpolym.2020.104489
Tezuka, Y., Ohtsuka, T., Adachi, K., Komiya, R., Ohno, N., and Okui, N. (2008). A defect-free ring polymer: Size-controlled cyclic poly(tetrahydrofuran) consisting exclusively of the monomer unit. Macromol. Rapid Commun. 29 (14), 1237–1241. doi:10.1002/marc.200800103
Tong, Z-Z., Huang, Y., Xu, J-T., Fu, Z-S., and Fan, Z-Q. (2015). Chain structure, aggregation state structure, and tensile behavior of segmented ethylene–propylene copolymers produced by an oscillating unbridged metallocene catalyst. J. Phys. Chem. B 119 (19), 6050–6061. doi:10.1021/acs.jpcb.5b01845
Tournier, R. F., and Ojovan, M. I. (2021). Dewetting temperatures of prefrozen and grafted layers in solid ultrathin films viewed as melt-memory effects. Phys. B Condens. Matter 611, 412796. doi:10.1016/j.physb.2020.412796
Urciuoli, G., Ruiz de Ballesteros, O., Cipullo, R., Trifuoggi, M., Giarra, A., and Auriemma, F. (2022). Thermal fractionation of ethylene/1-octene multiblock copolymers from chain shuttling polymerization. Macromolecules 55, 5656–5668. doi:10.1021/acs.macromol.2c00773
Vaezi, J., Nekoomanesh, M., Khonakdar, H-A., Jafari, S. H., and Nejabat, G-R. (2017). Thermal analysis and successive self-nucleation and annealing (SSA) treatment of synthesized bimodal polypropylene (BPP) reactor blends using homogeneous binary metallocene catalyst. J. Therm. Anal. Calorim. 130 (2), 985–995. doi:10.1007/s10973-017-6415-0
Wang, L., Dong, X., Huang, M., Müller, A. J., and Wang, D. (2017). Self-associated polyamide alloys with tailored polymorphism transition and lamellar thickening for advanced mechanical application. ACS Appl. Mat. Interfaces 9 (22), 19238–19247. doi:10.1021/acsami.7b04691
Wang, M., Yang, F., Xiang, M., Yang, F., and Wu, T. (2022). Design of molecular structure for commercial polyethylene100 pipe. J. Polym. Res. 29 (3), 84. doi:10.1007/s10965-022-02888-9
Wang, S., Wu, R., Zhang, J., Leng, Y., and Li, Q. (2021). PLA/PEG/MWCNT composites with improved processability and mechanical properties. Polymer-Plastics Technol. Mater. 60 (4), 430–439. doi:10.1080/25740881.2020.1811324
Wang, W., Li, X., Li, J., Xin, S., and Jiang, S. (2022). Crystallization behavior and structure of metallocene polyethylene with long-chain branch. Colloid Polym. Sci. 300 (5), 521–530. doi:10.1007/s00396-021-04925-3
Wang, X., Yi, J., Wang, L., and Feng, J. (2021). Comparison of the melt memory effects in matched fractions segregated from Ziegler-Natta and metallocene-made isotactic polypropylene with similar total defect content. Polymer 230, 124060. doi:10.1016/j.polymer.2021.124060
Weijiao, J., Song, Y., Song, X., Zhang, Y., Hu, B., Liang, Z., et al. (2020). Influences of molecular structure on the non-isothermal crystallization behavior of β-nucleated isotactic polypropylene. Polym. Sci. Ser. A 62 (6), 616–629. doi:10.1134/S0965545X20330032
Wendling, J., and Suter, U. W. (1998). A new model describing the cocrystallization behavior of random copolymers. Macromolecules 31 (8), 2516–2520. doi:10.1021/ma971506d
Xue, Y., Bo, S., and Ji, X. (2015). Molecular chain heterogeneity of a branched polyethylene resin using cross-fractionation techniques. J. Polym. Res. 22 (8), 160. doi:10.1007/s10965-015-0809-0
Xue, Y-h., Bo, S-q., and Ji, X-l. (2015). Calibration curve establishment and fractionation temperature selection of polyethylene for preparative temperature rising elution fractionation. Chin. J. Polym. Sci. 33 (7), 1000–1008. doi:10.1007/s10118-015-1648-5
Xue, Y-h., Bo, S-q., and Ji, X-l. (2015). Comparison of chain structures between high-speed extrusion coating polyethylene resins by preparative temperature rising elution fractionation and cross-fractionation. Chin. J. Polym. Sci. 33 (11), 1586–1597. doi:10.1007/s10118-015-1709-9
Xue, Y-H., Bo, X-Q., and Ji, X. L. (2015). Parameters optimization of successive self-nucleation/annealing thermal fractionation experiments for polyethylene resin and comparison with step crystallization. Acta Polym. Sin. (3), 326–330. doi:10.11777/j.issn1000-3304.2015.14281
Xue, Y-h., Fan, Y-d., Bo, S-q., and Ji, X-l. (2015). Microstructure characterization of a complex branched low-density polyethylene. Chin. J. Polym. Sci. 33 (3), 508–522. doi:10.1007/s10118-015-1609-z
Yu, X., Tian, H., Lv, C., Xiang, A., and Wu, H. (2021). Analysis of poly(vinyl alcohol) crystallizability: The hindering effect of octa(γ-chloropropyl) POSS. J. Polym. Res. 28 (12), 476. doi:10.1007/s10965-021-02834-1
Yue, Y., Sha, X., Wang, F., Gao, Y., Zhang, L., Zhu, Y., et al. (2021). Non-negligible effect of additives in the application of successive self-nucleation and annealing fractionation for microstructure characterization of matrix resin in additive-containing samples. ACS Appl. Polym. Mat. 3 (9), 4634–4644. doi:10.1021/acsapm.1c00742
Zaldua, N., Liénard, R., Josse, T., Zubitur, M., Mugica, A., Iturrospe, A., et al. (2018). Influence of chain topology (cyclic versus linear) on the nucleation and isothermal crystallization of poly(l-lactide) and poly(d-lactide). Macromolecules 51 (5), 1718–1732. doi:10.1021/acs.macromol.7b02638
Zanchin, G., Bertini, F., Vendier, L., Ricci, G., Lorber, C., and Leone, G. (2019). Copolymerization of ethylene with propylene and higher α-olefins catalyzed by (imido)vanadium(iv) dichloride complexes. Polym. Chem. 10 (45), 6200–6216. doi:10.1039/C9PY01415B
Zentel, K. M., Eselem Bungu, P. S., Pasch, H., and Busch, M. (2021). Linking molecular structure to plant conditions: Advanced analysis of a systematic set of mini-plant scale low density polyethylenes. Polym. Chem. 12 (20), 3026–3041. doi:10.1039/D1PY00089F
Zhang, C., Pérez-Camargo, R. A., Zheng, L., Zhao, Y., Liu, G., Wang, L., et al. (2021). Crystallization of poly(hexamethylene carbonate)-co-poly(hexamethylene urethane) segmental block copolymers: From single to double crystalline phases. Polymer 222, 123675. doi:10.1016/j.polymer.2021.123675
Zhang, X., Zuo, X., Ortmann, P., Mecking, S., and Alamo, R. G. (2019). Crystallization of long-spaced precision polyacetals I: Melting and recrystallization of rapidly formed crystallites. Macromolecules 52 (13), 4934–4948. doi:10.1021/acs.macromol.9b00922
Zhao, T-P., Ren, X-K., Zhu, W-X., Liang, Y-R., Li, C-C., Men, Y-F., et al. (2015). Brill transition” shown by green material poly(octamethylene carbonate). ACS Macro Lett. 4 (3), 317–321. doi:10.1021/acsmacrolett.5b00045
Zhao, X-T., and Men, Y-F. (2022). Fractionation of polyolefin elastomer by a modified SSA technique. Chin. J. Polym. Sci. doi:10.1007/s10118-022-2740-2
Zheng, H., Zeng, F., Chen, Z., Kang, J., Chen, J., Cao, Y., et al. (2017). Exploring the roles of molecular structure on the β-crystallization of polypropylene random copolymer. J. Polym. Res. 24 (12), 225. doi:10.1007/s10965-017-1358-5
Zheng, T., Zhou, Q., Li, Q., Li, H., Zhang, L., and Hu, Y. (2015). Application of successive self-nucleation and annealing (SSA) to poly(1-butene) prepared by Ziegler–Natta catalysts with different external donors. RSC Adv. 5 (13), 9328–9336. doi:10.1039/C4RA10215K
Zhou, C., Wei, Z., Yu, Y., Shao, S., Leng, X., Wang, Y., et al. (2019). Biobased long-chain aliphatic polyesters of 1, 12-dodecanedioic acid with a variety of diols: Odd-even effect and mechanical properties. Mater. Today Commun. 19, 450–458. doi:10.1016/j.mtcomm.2019.05.005
Zhuravlev, E., Madhavi, V., Lustiger, A., Androsch, R., and Schick, C. (2016). Crystallization of polyethylene at large undercooling. ACS Macro Lett. 5 (3), 365–370. doi:10.1021/acsmacrolett.5b00889
Keywords: self-nucleation, successive self-nucleation and annealing (SSA), SSA applications, thermal fractionation, conventional DSC, fast scanning calorimetry
Citation: Pérez-Camargo RA, Cavallo D and Müller AJ (2022) Recent applications of the Successive Self-nucleation and Annealing thermal fractionation technique. Front. Soft. Matter 2:1003500. doi: 10.3389/frsfm.2022.1003500
Received: 26 July 2022; Accepted: 11 August 2022;
Published: 28 September 2022.
Edited by:
Finizia Auriemma, University of Naples Federico II, ItalyReviewed by:
Markus Gahleitner, Borealis Polyolefine GmbH, AustriaWenbing Hu, Nanjing University, China
Copyright © 2022 Pérez-Camargo, Cavallo and Müller. This is an open-access article distributed under the terms of the Creative Commons Attribution License (CC BY). The use, distribution or reproduction in other forums is permitted, provided the original author(s) and the copyright owner(s) are credited and that the original publication in this journal is cited, in accordance with accepted academic practice. No use, distribution or reproduction is permitted which does not comply with these terms.
*Correspondence: Ricardo A. Pérez-Camargo, cmljYXJkbzUwN0BpY2Nhcy5hYy5jbg==; Dario Cavallo, ZGFyaW8uY2F2YWxsb0B1bmlnZS5pdA==; Alejandro J. Müller, YWxlamFuZHJvamVzdXMubXVsbGVyQGVodS5lcw==