- Research Center for Advanced Science and Technology, The University of Tokyo, Tokyo, Japan
The automotive industry is a key industry in Japan; however, the worker shortage has affected transportation in the ports and harbors, including that of automobile shipping. Automobiles are shipped using roll-on/roll-off (Ro-Ro) ships. When many Ro-Ro ships dock at the same time, problems related to the shortage of workers and limited storage space for automobiles are exacerbated, decreasing transportation efficiency. The spatial resolution and temporal frequency of satellite imagery have improved with Planet Labs satellite constellations making daily observations of the Earth’s surface. Moreover, the field of remote sensing is seeing an increasing number of logistic applications. As such, this study aimed to evaluate the Planet constellation’s daily coverage for estimating the actual usage of seaport automobile terminals by counting the number of vessels in each image. Here, we focused on Daikoku Pier automobile terminals in the Port of Yokohama, Japan, from 2018 to 2023. Images were classified by visual interpretation into three categories: data available for analysis, data not available for analysis due to cloud, and lack of data. Over the 6-year period, 37.1% of the data were classified as data available for analysis; 21.2%, data not available for analysis due to cloud; and 41.8%, lack of data. The visual inspection survey was conducted twice, with an agreement rate of 90.5% between the two surveys. The number of vessels were then counted two times from “data available for analysis” class, and the discrepancies were corrected. This result was compared to the actual schedule information and the accuracy was 89.0%. The number of vessels docked at the same time tended to be lower in August than in other months. The days from the 25th to 31st tended to have a higher number of vessels than other days, regardless of the month. It seems difficult to use Planet constellation for daily site progress management because data was sometimes available 1 day per month. Planet constellation can be useful in estimating the actual usage through long-term monitoring. We expect that the results of this study will be helpful to those interested in using daily satellite imagery for improving work conditions and efficiencies.
1 Introduction
The automotive industry is a key industry in Japan, and the tremendous amount of automobile production and sales contribute significantly to the economy (Shigeta and Hosseini, 2020). However, the shortage of workers in ports and harbors has a significant impact on port logistics (Ports and Harbours Bureau, Ministry of Land, Infrastructure, Transport and Tourism, 2021), including that related to automobile shipping. Automobiles are shipped using roll-on/roll-off (Ro-Ro) ships; thus, many workers such as stevedores are needed to load and unload automobiles in the seaport automobile terminal. When many Ro-Ro ships dock at the same time, the shortage of workers and storage space for automobiles is exacerbated, decreasing transportation efficiency. A few studies have reported on automobile terminal issues, such as the berth allocation, storage location optimization, and planning and scheduling (e.g., Chen et al., 2021; Dkhil et al., 2021; Mattfeld and Kopfer, 2003) in an effort to improve efficiency. However, more information on the actual daily port usage around automobile terminals is necessary, but lacking to date. This information will help to provide better policies for sustainable logistics and support to the automotive industry for improving work conditions and efficiencies.
Satellite remote sensing is widely applied in environmental monitoring fields such as agriculture, forestry, oceans, coastal waters, and disaster prevention (e.g., Carter et al., 2024; Li et al., 2022; Murata et al., 2021; Sakuma et al., 2021; Shevyrnogov et al., 2021; Yonezawa et al., 2012). As the spatial resolution of satellite images has improved considerably, remote sensing efforts have extended to logistics applications. Satellite imagery has been used to study maritime logistics in relation to container terminals (e.g., Murata et al., 2023; Yasuda et al., 2024; Yu et al., 2023); automobile detection in seaport automobile terminals (e.g., Hamamoto et al., 2021); and vessel detection (e.g., Ping et al., 2021; Reggiannini et al., 2024; Štepec et al., 2019; Xie et al., 2022). Satellite observation has the advantage of covering a large area at once, allowing vessels and cargo, such as containers and automobiles stored in terminals, to be detected simultaneously. However, to date, this approach has been limited by the frequency of observation data.
The temporal frequency of satellite image observation has recently improved. Planet Labs (San Francisco, CA, USA) has built Planet satellite constellations for daily observation of the Earth’s surface. Planet Dove and Dove-R satellites observe 4-band (blue, green, red, and near-infrared) and SuperDove satellites observe 8-band (coastal blue, blue, green 1, green, yellow, red, red-edge, and near-infrared) spectral bands (Planet. PlanetScope, 2024). The ground sample distance is approximately 3.7 m and the revisit time is daily in nadir (Tanya, 2024). In 2018, +100 Planet Dove satellites were in the orbit fleet (Planet, 2018). Since then, new satellites have been launched. Recently, Planet Labs launched 48 SuperDove satellites on 24 January 2021, 44 SuperDove satellites on 13 January 2022, and 36 SuperDove satellites on 2 January 2023. About 200 Dove/SuperDove satellites are currently in orbit (Planet, 2021; Planet, 2022; Planet, 2023). Thus, the number of satellites and the temporal frequency have increased from 2018 to 2023. Frazier and Hemingway (2021) reported that Planet images present challenges with regard to geometric and radiometric quality that the remote sensing community has come to expect from ‘analysis ready’ datasets (i.e., Landsat, MODIS, etc.). On the other hand, the Planet constellation has an advantage with regard to temporal frequency of image observations. However, the optical sensors cannot observe under cloud; thus, even if data are acquired, analysis may not be possible. Roy et al. (2021) analyzed the temporal availability of the Planet constellation in global. They mentioned that more detailed analysis at the local and regional scales should be performed for the cloud availability of the Planet constellation.
Cloud coverage varies by region. It is important to evaluate the daily coverage in satellite imagery, to assess the applicability of the data for logistics studies. As such, in this study, we evaluated the daily coverage of the Planet constellation in a local area, specifically, Daikoku Pier in the Port of Yokohama, Japan, from 2018 to 2023. Satellite imagery was used to estimate the actual usage of seaport automobile terminals by counting the number of vessels.
2 Study site and methods
2.1 Study site
This study examined the Daikoku Pier in the Port of Yokohama, Japan (Figure 1). At Daikoku Pier, T1, T2, C1–4, P3, and T3–8 terminals are currently used as seaport automobile terminals. The terminals have gradually been converted from container terminals to automobile terminals. A maximum of 11 Ro-Ro ships can dock at the same time (City of Yokohama, 2022). The terminals that have recently been renovated or reopened as automobile terminals include C3 on 4 August 2020; C4 on 1 April 2022; and P3 on 15 April 2022 (Yokohama Kawasaki International Port Corporation, 2020; Yokohama Port Corporation, 2022; City of Yokohama, 2022). P3 and T3–T6 have been used as both automobile terminals and cruise ship terminals (Keihin Port Office, Kanto Regional Development Bureau, Ministry of Land, Infrastructure, Transport and Tourism, 2022).
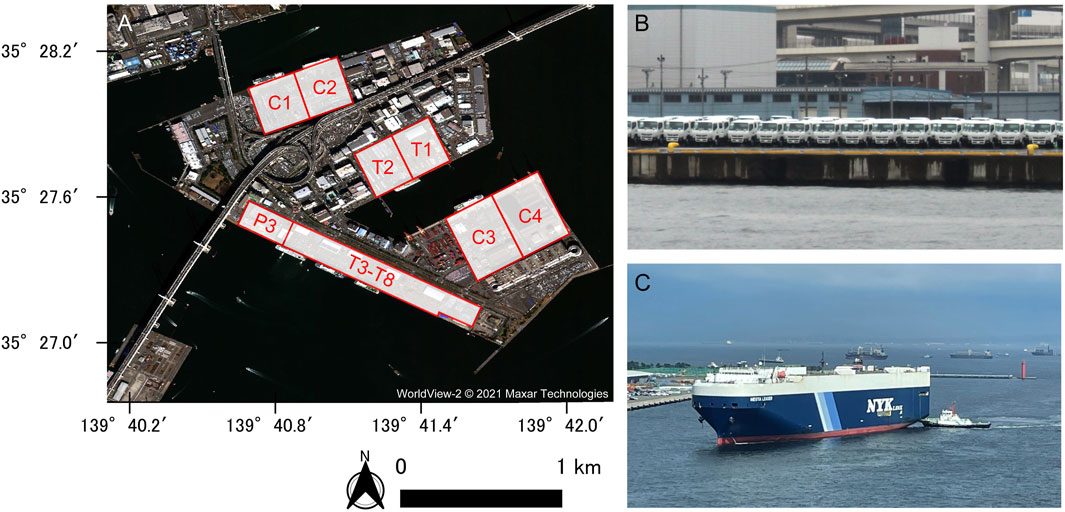
Figure 1. Map of the study site Daikoku Pier, Port of Yokohama, Japan (A). The red polygons indicate the seaport automobile terminals. Photos of stored automobiles (B) and roll-on/roll-off (Ro-Ro) ship (C).
2.2 Methods
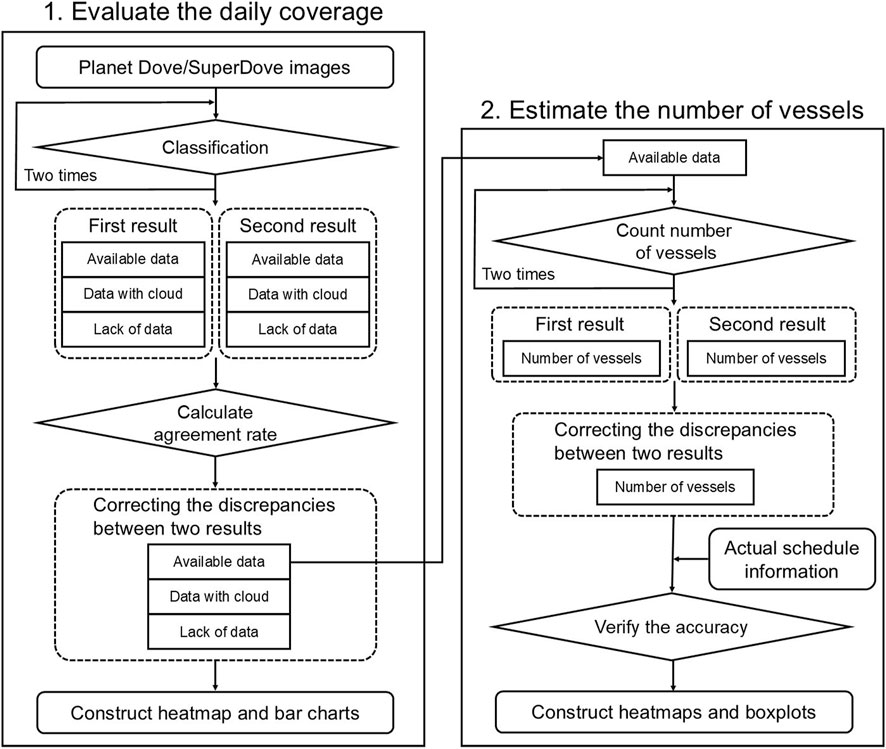
The flowchart of the analysis procedure is shown in Figure 2. Planet Dove/SuperDove images (Planet Team, 2017) are commercial data. Planet Explorer, a platform that subscribers can use to search and download images, was used to evaluate the daily coverage and to estimate the number of vessels.
First, we searched all images of the study site from 2018 to 2023 and classified the imagery via visual interpretation into three categories: (1) data available for analysis (available data), (2) data not available for analysis due to cloud (data with cloud), and (3) lack of data. The standard for visual interpretation was based on whether the automobile terminals, as well as vessels, were visible in the images. Even when the data were with cloud, if the automobile terminals and vessels were visible then the images were classified as available data. Our survey was conducted twice for confirmation. We evaluated the agreement rate between the two surveys; then any discrepancies were corrected.
Second, we counted the number of vessels at automobile terminals from corrected ‘available data’ using Planet Explorer. Although it was possible that vessels other than Ro-Ro ships (non-Ro-Ro ships) may call at the automobile terminals, this was not considered to be the majority, so no distinction was made. We counted the number of vessels two times, and then the discrepancies were corrected. This result was compared to the actual schedule information provided by the Yokohama Port Information System at the time of Planet Dove/SuperDove images observed to verify the visual interpretation accuracy. This schedule information was publicly available on the website and included the name of the vessel, type of vessel, and arrival and departure times by terminal in Japanese. However, the container vessels in C3–4 terminals, before being in service as automobile terminals, and the cruise ships in P3 and T3–T6, were excluded because it was not directly related to the automobile terminals targeted in this study. The length of the cruise ships that call at Daikoku Pier range from 290 to 315 m (e.g., Cunard, 2024; Princess Cruise, 2024; MSC, 2024); notably, these cruise ships are much longer than the standard-size Ro-Ro ship of ∼200 m (e.g., K-Line, 2024; NYK Line, 2024; Wallenius Wilhelmsen, 2024).
Finally, the number of vessels counted by Planet constellation were used to analyze the actual usage of the study site. R version 4.22 (R Development Core Team, 2019) was used to construct a heatmap, bar charts, and boxplots of our findings.
3 Results
3.1 Daily coverage results obtained from the Planet constellation
Planet Dove/SuperDove images were classified into three classes: available data (Figures 3A, B), data with cloud (Figures 3C, D), and lack of data (Figures 3E, F). As a supplement, Figure 3B was classified as available data due to the absence of cloud cover of the automobile terminals, while Figure 3C was classified as data with cloud due to cloud cover over T1, C3 and C4 terminals. The daily results are presented as a heatmap in Figure 4A and bar charts aggregated by year in Figure 4B. The agreement rate between the first and second visual interpretation was 90.5%. The number of days in a year for the three data classes were 105–155 for available data, 67–86 for data with cloud, and 124–194 for lack of data, from 2018 to 2023. The results over the 6-year period showed the following percentages for the class types: 37.1% available data, 21.2% data with cloud, and 41.8% lack of data. The overall available data ranged from 1 to 22 days per month. There was a period of up to 11 consecutive days with available data from February 3–13, 2018, and a period of up to 29 days without available data from June 27–25 July 2019. On average, the available data was available once every 2.7 days.
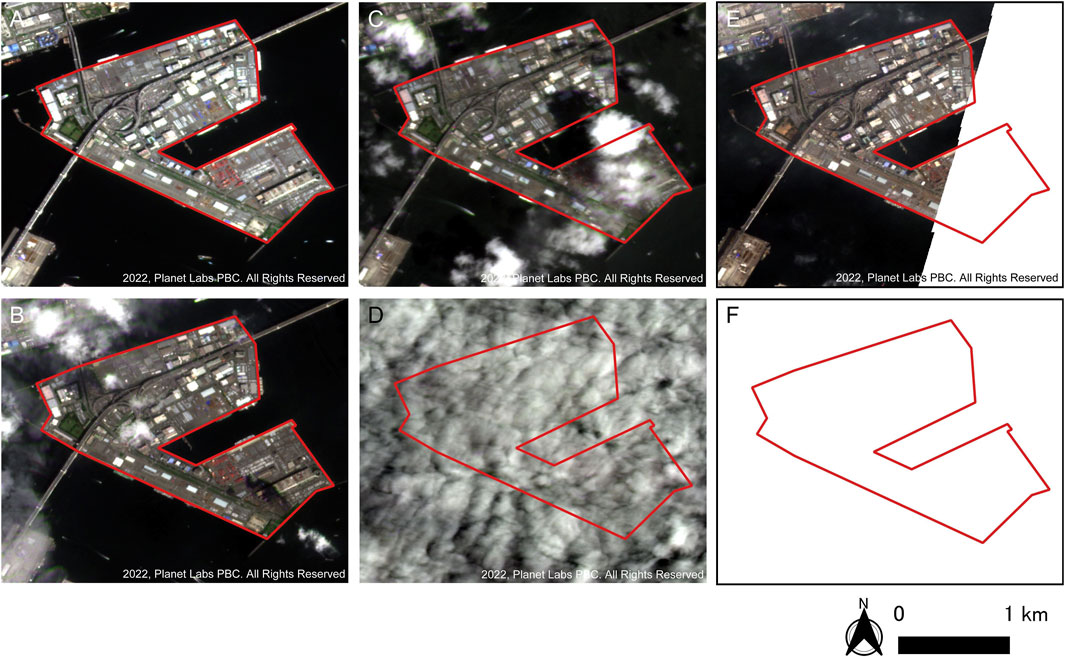
Figure 3. Planet constellation images; available data (A, B), data with cloud (C, D), and lack of data (E, F). The red polygon indicates the edge of Daikoku Pier.
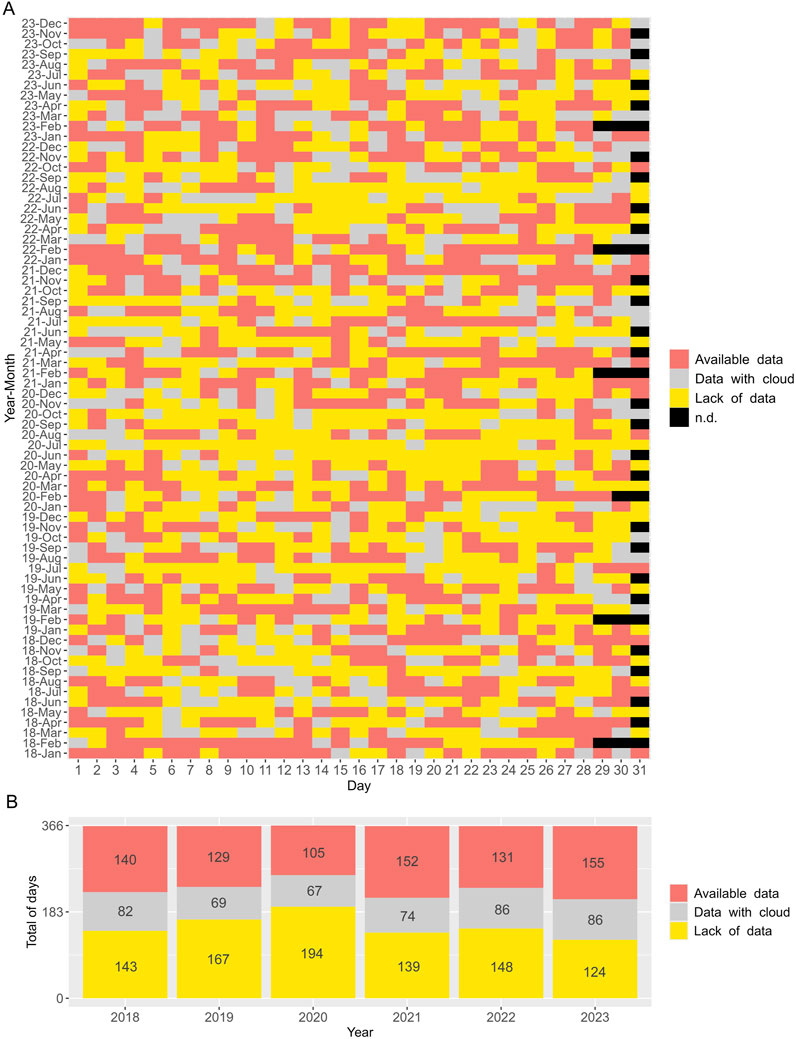
Figure 4. Heatmap of the results classified into three categories: available data, data with cloud, and lack of data (A) and the bar charts aggregated by year (B).
3.2 Verifying the accuracy of the vessels count by visual interpretation
The daily number of vessels counted from available data is shown as a heatmap in Figure 5A. The agreement compared to the actual schedule information is shown as heatmap in Figure 5B, and the accuracy was 89.0%. The remaining 11.0% mismatch were due to misses in visual interpretation, as some general cargo vessels were not counted due to their small size. From the actual schedule information, non-Ro-Ro ships such as general cargo vessels, work vessels, cement carriers, tugboats, and container vessels were sometimes called at the Daikoku Pier’s automobile terminals. Hence, this visual interpretation result of the number of vessels include non-Ro-Ro ships as well as Ro-Ro ships. In a few other cases, the visual interpretation results were considered more accurate than the actual schedule information.
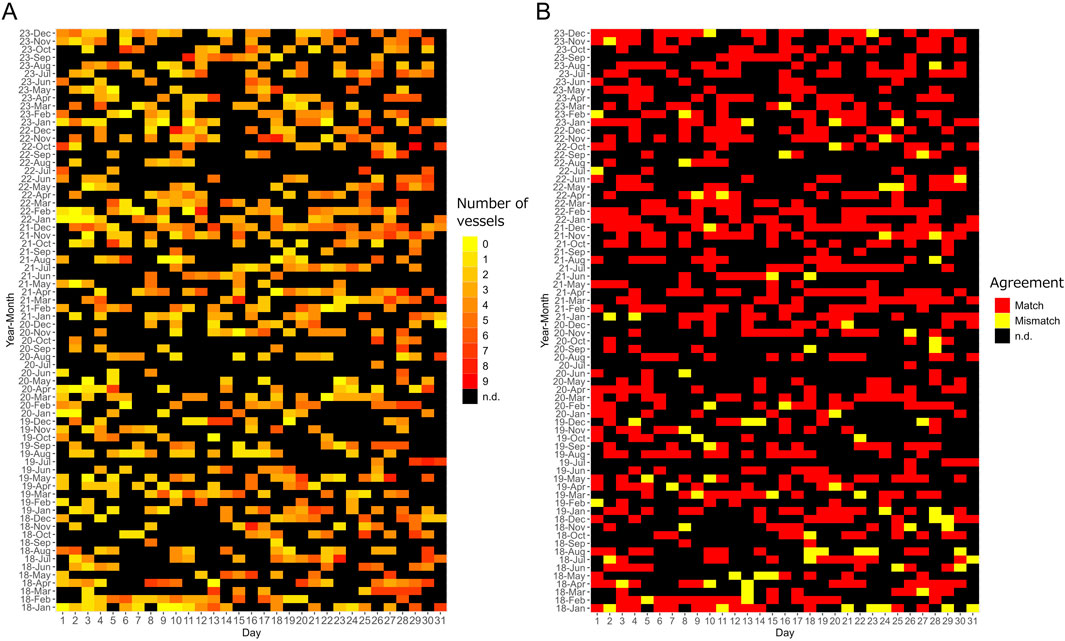
Figure 5. The results of daily counts of vessels from 2018 to 2023 Planet Dove/SuperDove images by visual interpretation (A) and the agreement between visual interpretation results and actual schedule information (B).
3.3 Estimating the actual usage of daikoku pier automobile terminals from daily Planet satellite images
The number of vessels were counted from the available data of Planet Dove/SuperDove imagery from 2018 to 2023 at Daikoku Pier in the Port of Yokohama, Japan. While these numbers include Ro-Ro ships, non-Ro-Ro ships and a few mistakes, the analysis was generally good and accurate reflected the actual situation. We investigated how these results could be used for actual daily port usage of automobile terminals.
The boxplots of the number of vessels by month and by day are shown in Figures 6A, B, respectively. The number of vessels ranged from 0 to 9. The median number of vessels was three–four per month. The interquartile range was smaller in August than in other months. The average number of vessels by month was low in August, January, and May (in the order of 2.8, 2.9, and 3.3, respectively) and high in July, June, and September (4.1, 4.0, and 4.0, respectively). In terms of the number of vessels per day, the average tended to be higher from the 25th to the 31st of the month, compared to other days. The average number was particularly high from the 28th onwards. The average for the 1st–24th was 1.9–4.1; for the 25th–27th, 4.4–4.6; and for the 28th–31st, 4.7–5.3. These results suggest that many vessels were docked in automobile terminals at the same time toward the end of the month, regardless of the actual month.
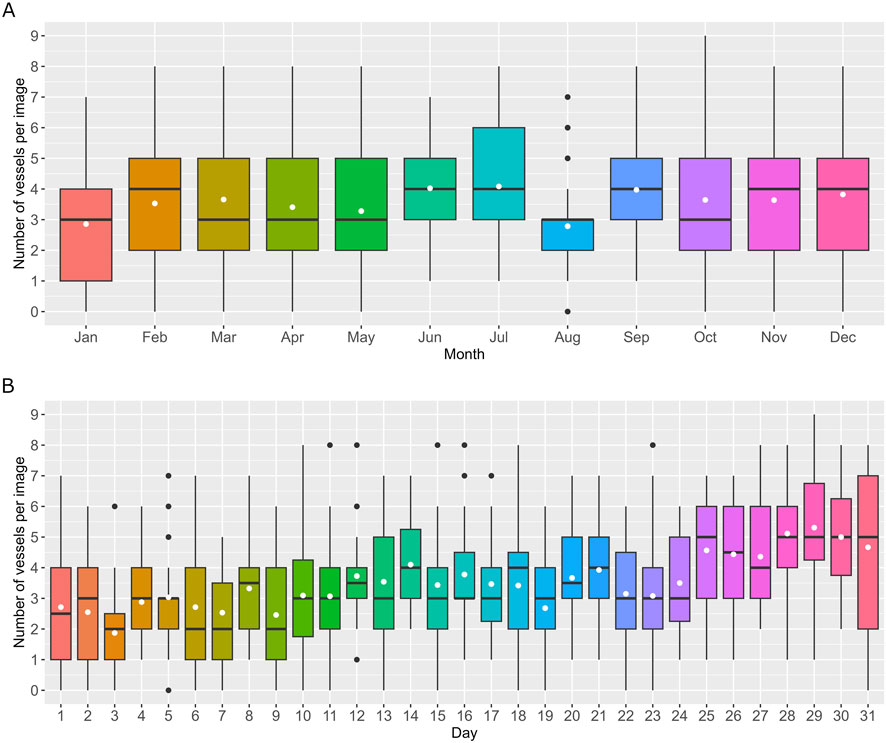
Figure 6. Boxplots of the number of vessels counted by Planet constellation images per month (A) and per day (B) from 2018 to 2023.
4 Discussion
4.1 The assessment of the daily coverage of the Planet satellite constellation
The Planet constellation was not able to observe the same location once a day. The number given for the ‘lack of data’ class increased from 2018 to 2020, whereas it dropped in 2021 and remained at the same level until 2023, despite the increase in the number of launched satellites every year since 2021 (Planet, 2021; Planet, 2022; Planet, 2023). However, 41.8% of the days lacked data over the 6-year survey period. Thus, improving the daily coverage remains a challenge for the satellite constellation. The ‘data with cloud’ ranged from 67 to 86 days in 2018–2023. The effect of cloud is unavoidable due to the characteristics of the optical sensors onboard. When searching images in Planet Explorer, the cloud cover filter can be set to any percentage. However, even if some part of the image is covered by cloud, the region of interest (in this study, automobile terminals) may not be covered by cloud. Filtering by percentage may exclude data available for analysis. In this study, we examined each image individually, so we considered we have evaluated the available data to the maximum extent possible. However, since the analysis was done by visual interpretation, the results may vary slightly depending on the analyst. Especially when the terminal is covered with thin cloud, the decision will be highly dependent on the analyst. It is desirable to develop a method to check this objectively in order to maximize the use of available data.
More than one Planet satellite image existed per month; however, data were missing for up to a maximum of 29 consecutive days in some cases, as mentioned earlier. Thus, it is necessary to understand the limitations of optical satellite constellations affected by cloud. For applications requiring more stable temporal frequency observations, the synthetic aperture radar (SAR) constellation (i.e., Synspective; iQPS) that provides high-resolution, weather-independent images day and night (Moreira et al., 2013) may be more appropriate and will become more readily available in the near future. There have been many vessel detection studies (Li et al., 2024; Yasir et al., 2023) and several maritime logistics studies using SAR data (e.g., Hamamoto et al., 2021; Johnsen, 2011; Li et al., 2022).
4.2 Accuracy of counting the number of vessels by visual interpretation
We counted the number of vessels by visual interpretation from Planet constellation’s imagery. The results showed good accuracy with the actual schedule information. The discrepancies were mostly a visual misinterpretation. The result of visual interpretation may differ among analysts. On the other hand, nowadays, satellite images are used not only for researchers who analyze satellite images, but also on a daily basis such as in the press (e.g., BBC, 2020). Therefore, it is also important to evaluate how much estimation can be done by visual interpretation. We evaluated the accuracy of the visual interpretation in this study was good. However, it was not a perfect match. Sometimes general cargo vessels were not counted because of their small size. Also, achieving perfect match may be difficult, as in some cases the visual interpretation results seem more accurate than the actual schedule information. It seems that some vessels were not properly registered in the Yokohama Port Information System. Hence, visual interpretation might be more in line with the actual usage in cases.
It is labor-intensive to conduct additional surveys over a wider area. Many methods have been proposed to detect vessels using optical satellite imagery (Kanjir et al., 2018) that may allow for a more efficient count. Alternatively, a vessel’s automatic identification system (AIS) that transmits the position information of vessels may be sufficient for counting the number of vessels in ports and harbors. The real-time and historical AIS data provide insights into shipping-derived impacts and conservation planning at multiple spatial and temporal scales (March et al., 2021). However, satellite imagery offers the advantage of detecting cargo such as automobiles stored in terminals with vessels.
4.3 Daily/monthly changes of the number of vessels in automobile terminals
The number of Ro-Ro ships was not constant and, in general, depended on both the day of the month and the month of the year. Satellite images were taken at certain times of the day, so not all vessels docked in Daikoku Pier automobile terminals were estimated; however, our results had some notable findings. The interquartile range of the number of vessels in August was smaller than that of other months. Notably, August is the Obon holiday period in Japan; companies including maritime logistics offices close temporarily during this time. The average number of vessels was slightly higher in June, July, and September due to the transport of automobiles before and after the terminals closed in August. At Daikoku Pier, the number of vessels increased at the end of month, regardless of the month. Automobiles are transported by car carrier from car factories located inland to Daikoku Pier; increasing traffic on the inland roads may be an issue. Additionally, leveling the number of Ro-Ro ships to call in port at the same time may help to mitigate the shortage of workers and storage space. Moreover, the 6-year period was affected by the 2019 Coronavirus (COVID-19) pandemic. The cruise ship, the Diamond Princess, reached the Port of Yokohama on the evening of 3 February 2020 (Jimi and Hashimoto, 2020; Yamagishi et al., 2020) and then anchored at Daikoku Pier P3 to T3. COVID-19 caused an unprecedented drop in maritime mobility, across all categories of commercial shipping worldwide (Millefiori et al., 2021).
5 Conclusion
We evaluated the daily coverage of Planet constellation at Daikoku Pier automobile terminals, Port of Yokohama, Japan from 2018 to 2023. The result of classification showed that the number of ‘lack of data’ class was greater than that of ‘available data’ class. While the effect of cloud is inevitable, improving daily coverage remains a challenge for satellite constellation. From available data, the daily number of vessels were counted by visual interpretation and the accuracy was 89.0% compared to the actual schedule information. The visual interpretation results showed near accuracy to the actual schedule information, although a few misses in the interpretation remained.
Planet constellation was able to identify the changes of number of vessels on a daily and monthly basis. We found that many vessels were called in automobile terminals at the same time toward the end of the month. The actual schedule information at the study site was publicly available but in local language. Hence, satellite imagery would be useful to estimate the actual status of automobile terminals regardless of language. It seems difficult to use Planet satellite images for daily site progress management because data was sometimes available 1 day per month. Rather, the Planet constellation can be useful in estimating the actual conditions through long-term monitoring as demonstrated.
In this study, we did not focus on the analysis of automobiles in terminals, as this is a topic for future work. Cheng et al. (2016) proposed a deep learning algorithm rotation-invariant convolutional neural networks to detect objects including vehicles in very high resolution optical remote sensing images. Ragab et al. (2023) proposed the improved deep learning-based vehicle detection for urban applications. In addition to these studies, many other studies reported methods to detect automobiles using high resolution images (e.g., Bouguettaya et al., 2021; Koga et al., 2020). Hence, further research is needed to detect automobiles from Planet Dove/SuperDove images which are medium resolution (ground sample distance of 3.7 m). Özkan et al. (2016) analyzed the capacity of Ro-Ro terminals and concluded that the number of trucks arriving to terminals mostly affects to the terminal capacity. It may be possible to estimate this from satellite images based on the number of automobiles stored in the terminal. Although further research is needed, the Planet Dove/SuperDove images may be sufficient for resolving the stored area of automotive vehicles at the terminals. Additionally, renovations involving the conversion of container terminals to automobile terminals were confirmed in the collected data. Thus, Planet constellation can be used to monitor the progress of civil construction projects, in addition to maritime logistics, for a variety of stakeholders in port and harbor areas.
Data availability statement
Publicly available datasets were analyzed in this study. This data can be found here: https://www.planet.com/ Planet Labs (commercial data).
Author contributions
HM: Conceptualization, Data curation, Formal Analysis, Investigation, Methodology, Validation, Visualization, Writing–original draft, Writing–review and editing. NI: Project administration, Writing–review and editing. KN: Funding acquisition, Project administration, Writing–review and editing.
Funding
The author(s) declare that no financial support was received for the research, authorship, and/or publication of this article.
Acknowledgments
The Planet Dove/SuperDove satellite images were provided under the Education and Research Program of Planet Labs. We are grateful to Planet Labs for making this program available to the academic community.
Conflict of interest
The authors declare that the research was conducted in the absence of any commercial or financial relationships that could be construed as a potential conflict of interest.
Publisher’s note
All claims expressed in this article are solely those of the authors and do not necessarily represent those of their affiliated organizations, or those of the publisher, the editors and the reviewers. Any product that may be evaluated in this article, or claim that may be made by its manufacturer, is not guaranteed or endorsed by the publisher.
References
BBC (2020). Antarctica's big new iceberg: up close with B49. Available at: https://www.bbc.com/news/science-environment-51479329 (Accessed September 8, 2024).
Bouguettaya, A., Zarzour, H., Kechida, A., and Taberkit, A. M. (2021). Vehicle detection from UAV imagery with deep learning: a review. IEEE Trans. Neural Netw. Learn. Syst. 33 (11), 6047–6067. doi:10.1109/TNNLS.2021.3080276
Carter, G., Wagner, F. H., Dalagnol, R., Roberts, S., Ritz, A. L., and Saatchi, S. (2024). Detection of forest disturbance across California using deep-learning on PlanetScope imagery. Front. Remote Sens. 5, 1409400. doi:10.3389/frsen.2024.1409400
Chen, X., Li, F., Jia, B., Wu, J., Gao, Z., and Liu, R. (2021). Optimizing storage location assignment in an automotive Ro-Ro terminal. Transp. Res. Part B Methodol. 143, 249–281. doi:10.1016/j.trb.2020.10.009
Cheng, G., Zhou, P., and Han, J. (2016). Learning rotation-invariant convolutional neural networks for object detection in VHR optical remote sensing images. IEEE Trans. geoscience remote Sens. 54 (12), 7405–7415. doi:10.1109/TGRS.2016.2601622
City of Yokohama (2022). Kanagawa Prefecture, Japan: Press release. Available at: https://www.city.yokohama.lg.jp/city-info/koho-kocho/press/kowan/2022/0412daikoku.files/220412daikoku.pdf (Accessed July 17, 2024).
Cunard (2024). Queen elizabeth. Available at: https://www.cunard.com/ja-jp/cruise-ships/queen-elizabeth/7 (Accessed July 22, 2024).
Dkhil, H., Diarrassouba, I., Benmansour, S., and Yassine, A. (2021). Modelling and solving a berth allocation problem in an automotive transshipment terminal. J. Operational Res. Soc. 72 (3), 580–593. doi:10.1080/01605682.2019.1685361
Frazier, A. E., and Hemingway, B. L. (2021). A technical review of Planet smallsat data: practical considerations for processing and using planetscope imagery. Remote Sens. 13 (19), 3930. doi:10.3390/rs13193930
Hamamoto, K., Kuze, A., Tadono, T., Sobue, S., Ishizawa, J., Ohyoshi, K., et al. (2021). “JAXA’s Earth observation data analysis on COVID-19,” in Proceedings of the 2021 IEEE international geoscience and remote sensing symposium IGARSS (Brussels, Belgium), 1362–1365. doi:10.1109/IGARSS47720.2021.9554593S
Jimi, H., and Hashimoto, G. (2020). Challenges of COVID-19 outbreak on the cruise ship Diamond Princess docked at Yokohama, Japan: a real-world story. Glob. Health and Med. 2 (2), 63–65. doi:10.35772/ghm.2020.01038
Johnsen, T. (2011). “Coherent change detection in SAR images of harbors with emphasis on findings from container backscattering,” in 2011 IEEE RadarCon (RADAR) (IEEE), 118–123. doi:10.1109/RADAR.2011.5960512
Kanjir, U., Greidanus, H., and Oštir, K. (2018). Vessel detection and classification from spaceborne optical images: a literature survey. Remote Sens. Environ. 207, 1–26. doi:10.1016/j.rse.2017.12.033
Keihin Port Office, Kanto Regional Development Bureau, Ministry of Land, Infrastructure, Transport and Tourism (2022). Kanagawa Prefecture, Japan: Press release. Available at: https://www.ktr.mlit.go.jp/ktr_content/content/000828319.pdf (Accessed July 17, 2024).
K-Line (2024). “K” Line global RORO service. Tokyo, Japan: Car carrier and roro. Available at: https://www.klineglobalroro.com/carcarrier.html (Accessed July 22, 2024).
Koga, Y., Miyazaki, H., and Shibasaki, R. (2020). A method for vehicle detection in high-resolution satellite images that uses a region-based object detector and unsupervised domain adaptation. Remote Sens. 12 (3), 575. doi:10.3390/rs12030575
Li, C., Yue, C., Li, H., and Wang, Z. (2024). Context-aware SAR image ship detection and recognition network. Front. Neurorobotics 18, 1293992. doi:10.3389/fnbot.2024.1293992
Li, J., Carlson, R. R., Knapp, D. E., and Asner, G. P. (2022). Shallow coastal water turbidity monitoring using Planet Dove satellites. Remote Sens. Ecol. Conservation 8 (4), 521–535. doi:10.1002/rse2.259
Li, J., Xu, C., Su, H., Gao, L., and Wang, T. (2022). Deep learning for SAR ship detection: past, present and future. Remote Sens. 14 (11), 2712. doi:10.3390/rs14112712
March, D., Metcalfe, K., Tintoré, J., and Godley, B. J. (2021). Tracking the global reduction of marine traffic during the COVID-19 pandemic. Nat. Commun. 12 (1), 1–12. doi:10.1038/s41467-021-22423-6
Mattfeld, D. C., and Kopfer, H. (2003). Terminal operations management in vehicle transshipment. Transp. Res. Part A Policy Pract. 37 (5), 435–452. doi:10.1016/S0965-8564(02)00035-6
Millefiori, L. M., Braca, P., Zissis, D., Spiliopoulos, G., Marano, S., Willett, P. K., et al. (2021). COVID-19 impact on global maritime mobility. Sci. Rep. 11 (1), 18039. doi:10.1038/s41598-021-97461-7
Moreira, A., Prats-Iraola, P., Younis, M., Krieger, G., Hajnsek, I., and Papathanassiou, K. P. (2013). A tutorial on synthetic aperture radar. IEEE Geoscience Remote Sens. Mag. 1 (1), 6–43. doi:10.1109/MGRS.2013.2248301
MSC (2024). Cruise. MSC BELLISSIMA. Available at: https://www.msccruises.com/int/our-cruises/ships/msc-bellissima (Accessed July 22, 2024).
Murata, H., Hara, M., Yonezawa, C., and Komatsu, T. (2021). Monitoring oyster culture rafts and seagrass meadows in Nagatsura-ura Lagoon, Sanriku Coast, Japan before and after the 2011 tsunami by remote sensing: their recoveries implying the sustainable development of coastal waters. PeerJ 9, e10727. doi:10.7717/peerj.10727
Murata, H., Shibasaki, R., Imura, N., and Nishinari, K. (2023). Identifying the operational status of container terminals from high-resolution nighttime-light satellite image for global supply chain network optimization. Front. Remote Sens. 4, 1229745. doi:10.3389/frsen.2023.1229745
NYK Line (2024). Nyk roro service. Available at: https://www.nykroro.com/wp-content/uploads/2022/11/RORO-Pamphlet.pdf (Accessed July 22, 2024).
Özkan, E. D., Nas, S., and Güler, N. (2016). Capacity analysis of Ro-Ro terminals by using simulation modeling method. Asian J. Shipp. Logist. 32 (3), 139–147. doi:10.1016/j.ajsl.2016.09.002
Ping, Y., Zhao, J., Shi, H., Zhang, Q., and Xiang, B. (2021). An approximate system for evaluating real-time port operations based on remote sensing images. Int. J. Remote Sens. 42 (3), 783–793. doi:10.1080/2150704X.2020.1820612
Planet (2018). 16 more doves successfully launch on ISRO’s PSLV C-43 rocket. Available at: https://www.planet.com/pulse/16-more-doves-successfully-launch-on-isros-pslv-c-43-rocket/(Accessed July 17, 2024).
Planet (2021). 48 SuperDoves join planet’s constellation to deliver global daily data. Available at: https://www.planet.com/pulse/48-superdoves-join-planets-constellation-to-deliver-global-daily-data/(Accessed July 17, 2024).
Planet (2022). 44 SuperDove satellites successfully launch on SpaceX falcon 9 rocket. Available at: https://www.planet.com/pulse/44-superdove-satellites-successfully-launch-on-spacex-falcon-9-rocket/(Accessed July 17, 2024).
Planet (2023). 36 Planet SuperDoves successfully launch on SpaceX’s falcon 9 rocket. Available at: https://www.planet.com/pulse/36-planet-superdoves-successfully-launch-on-spacexs-falcon-9-rocket/(Accessed July 17, 2024).
Planet. PlanetScope (2024). Understanding PlanetScope instruments. Available at: https://developers.planet.com/docs/data/planetscope/(Accessed July 22, 2024).
Planet Team (2017). Planet application program interface: in space for life on Earth. San Francisco, CA. Available at: https://api.planet.com.
Ports and Harbours Bureau, Ministry of Land, Infrastructure, Transport and Tourism (2021). Survey on port worker shortage in FY2020. Available at: https://www.mlit.go.jp/report/press/content/001405656.pdf (Accessed July 22, 2024).
Princess Cruise (2024). Diamond princess fact sheet. Available at: https://www.princess.com/en-int/news/backgrounders-and-fact-sheets/diamond-princess-fact-sheet (Accessed July 22, 2024).
Ragab, M., Abdushkour, H. A., Khadidos, A. O., Alshareef, A. M., Alyoubi, K. H., and Khadidos, A. O. (2023). Improved deep learning-based vehicle detection for urban applications using remote sensing imagery. Remote Sens. 15 (19), 4747. doi:10.3390/rs15194747
R Development Core Team (2019). R: a language and environment for statistical computing. Vienna, Austria: R Foundation for Statistical Computing.
Reggiannini, M., Salerno, E., Bacciu, C., D’Errico, A., Lo Duca, A., Marchetti, A., et al. (2024). Remote sensing for maritime traffic understanding. Remote Sens. 16 (3), 557. doi:10.3390/rs16030557
Roy, D. P., Huang, H., Houborg, R., and Martins, V. S. (2021). A global analysis of the temporal availability of PlanetScope high spatial resolution multi-spectral imagery. Remote Sens. Environ. 264, 112586. doi:10.1016/j.rse.2021.112586
Sakuma, A., Abe, H., and Yamano, H. (2021). Short-term sediment plume event in the coral reef area of a small island captured by the Planet Dove satellite constellation. Remote Sens. Lett. 12 (10), 1038–1048. doi:10.1080/2150704X.2021.1962574
Shevyrnogov, A. P., Emelyanov, D. V., Malchikov, N. O., Demyanenko, T. N., Ivchenko, V. K., and Botvich, I. Y. (2021). Early forecasting of crop yields based on PlanetScope Dove satellite data. Biophysics 66 (6), 992–997. doi:10.1134/S0006350921060166
Shigeta, N., and Hosseini, S. E. (2020). Sustainable development of the automobile industry in the United States, Europe, and Japan with special focus on the vehicles’ power sources. Energies 14 (1), 78. doi:10.3390/en14010078
Štepec, D., Martinčič, T., and Skočaj, D. (2019) “1–10. Automated system for ship detection from medium resolution satellite optical imagery,” in IEEE, proceedings of the OCEANS 2019. Seattle, WA, USA: MTS/IEEE SEATTLE. doi:10.23919/OCEANS40490.2019.8962707
Tanya, N. H. (2024). Introduction to the Planet constellations of satellites and imagery. Available at: https://assets.planet.com/docs/Planet101-NASA_Goddard_Brown_Bag_Presentation.pdf (Accessed October 23, 2024).
Wallenius Wilhelmsen (2024). Our vessels. Available at: https://www.walleniuswilhelmsen.com/what-we-do/ocean-transportation/our-vessels (Accessed July 22, 2024).
Xie, X., Li, L., An, Z., Lu, G., and Zhou, Z. (2022). Small ship detection based on hybrid anchor structure and feature super-resolution. Remote Sens. 14 (15), 3530. doi:10.3390/rs14153530
Yamagishi, T., Kamiya, H., Kakimoto, K., Suzuki, M., and Wakita, T. (2020). Descriptive study of COVID-19 outbreak among passengers and crew on Diamond Princess cruise ship, Yokohama Port, Japan, 20 January to 9 February 2020. Eurosurveillance 25 (23), 2000272. doi:10.2807/1560-7917.ES.2020.25.23.2000272
Yasir, M., Shanwei, L., Mingming, X., Hui, S., Hossain, M. S., Colak, A. T. I., et al. (2023). Multi-scale ship target detection using SAR images based on improved Yolov5. Front. Mar. Sci. 9, 1086140. doi:10.3389/fmars.2022.1086140
Yasuda, K., Shibasaki, R., Yasuda, R., and Murata, H. (2024). Terminal congestion analysis of container ports using satellite images and AIS. Remote Sens. 16 (6), 1082. doi:10.3390/rs16061082
Yokohama Kawasaki International Port Corporation (2020). Daikoku Pier C3 terminal was renewed as a car terminal and the first ship arrived on August 4. Available at: https://www.ykip.co.jp/wordpress/wp-content/uploads/2020/08/739b2e0ffa33469670584c49d03642cf.pdf (Accessed July 17, 2024).
Yokohama Port Corporation (2022). Conversion of Daikoku C4 terminal to an automobile terminal and lessee. Available at: https://yokohamaport.co.jp/wp/wp-content/uploads/2024/03/220221_doc_01.pdf (Accessed July 17, 2024).
Yonezawa, C., Watanabe, M., and Saito, G. (2012). Polarimetric decomposition analysis of ALOS PALSAR observation data before and after a landslide event. Remote Sens. 4 (8), 2314–2328. doi:10.3390/rs4082314
Keywords: finished vehicle, Planet Dove/SuperDove satellites, port and harbor, pure car carrier, seaport automobile terminal, remote sensing
Citation: Murata H, Imura N and Nishinari K (2024) Evaluation of the Planet constellation’s daily coverage for estimating the number of vessels at Daikoku Pier automobile terminals, Port of Yokohama, Japan. Front. Remote Sens. 5:1474468. doi: 10.3389/frsen.2024.1474468
Received: 01 August 2024; Accepted: 19 November 2024;
Published: 05 December 2024.
Edited by:
Erick Lansard, Nanyang Technological University, SingaporeReviewed by:
Weizhen Hou, Harvard University, United StatesMuhammad Hasif Bin Azami, MARA University of Technology, Malaysia
Copyright © 2024 Murata, Imura and Nishinari. This is an open-access article distributed under the terms of the Creative Commons Attribution License (CC BY). The use, distribution or reproduction in other forums is permitted, provided the original author(s) and the copyright owner(s) are credited and that the original publication in this journal is cited, in accordance with accepted academic practice. No use, distribution or reproduction is permitted which does not comply with these terms.
*Correspondence: Hiroki Murata, bXVyYXRhLnlraG1AZ21haWwuY29t
 Hiroki Murata
 Naoto Imura