 R. N. Mgohele
 B. H. J. Massawe2
 M. M. Omar
- 1Tanzania Agricultural Research Institute (TARI), Mlingano Centre, Tanga, Tanzania
- 2Department of Soil and Geological Sciences, Sokoine University of Agriculture, Morogoro, Tanzania
Soil particle size fractions play a critical role in determining soil health attributes, including soil aeration, water infiltration and retention capacity, nutrients, and organic matter dynamics. Traditional soil mapping methods rely predominantly on ground-based surveys and laboratory analysis which are reported to be time-consuming and expensive. To address these challenges, there has been a global shift towards digital soil mapping (DSM) techniques that utilize remote sensing data. This review, conducted according to the Preferred Reporting Items for Systematic Reviews and Meta-Analyses (PRISMA) 2020 guideline, aims to provide a comprehensive synthesis of the current state of soil texture prediction using remote sensing data. In particular, the review extract and synthesizes the satellite images used, identify the derived environmental covariates and their relative importance, and assesses the prediction models/algorithms used in the prediction of soil texture. Synthesis and analysis of 70 articles show that clay content is the most predicted of the three soil particle fractions accounting for 37% of the reviewed studies predominantly from topsoil layer (74.29%). Sentinel 2 and Landsat 8 are reported as the most frequently used satellite images. Among the covariates derived from these images, NDVI (80.4%) and SAVI (60.8%) are by far the most derived band ratios (indices). Red (37.3%), NIR (35.3%), Green (33.3%), Blue (33.3%), and SW2 (29.4%) bands were the five most incorporated as covariates for soil texture prediction amongst individual satellite bands. Regarding the DSM algorithms, Random Forest (RF) appeared in most reviewed articles followed by Support Vector Machines (SVM), and Quantile Regression Forest (QRF). The comparative model performance analysis showed that RF and Artificial neural network (ANN) had a good trade-off across validation metrics indicating their best performance in the prediction of both clay, sand, and silt. The RF performance showed a decreasing trend with increasing depth interval for clay and sand prediction and inconsistent for silt prediction.
1 Introduction
A soil’s texture determines a number of its physical, chemical, and biological properties. It is the summation of the proportion of clay, silt, and sand particle size fractions (PSF) (Zheng et al., 2023). PSFs influence key soil health attributes including soil aeration, water infiltration and retention capacity, nutrients, and organic matter dynamics (Azizi et al., 2023; Li et al., 2023). These properties in turn affect the soil’s ability to support plant growth, development, productivity, and quality (Amirian-Chakan et al., 2019; Mirzaeitalarposhti et al., 2022; Swain et al., 2021). Accurate and reliable information on soil conditions, soil texture inclusive, is critical for increasing agricultural productivity and meeting escalating global demand for food and agricultural raw materials (FAO, 2022). The impetus of this information extends to sustainable use and management of land resources (Keshavarzi et al., 2022; Li et al., 2023; Zeraatpisheh et al., 2019).
Relying on intensive field surveys and laboratory analyses, traditional mapping of soils and soil properties including soil texture is reported to be time-consuming, expensive, and affected by uncertainty particularly when mapping soil at national, regional, or global scales (Dharumarajan and Hegde, 2022; Dhiman et al., 2023; Dornik et al., 2022; Mallah et al., 2022). To offset these challenges, soil surveying practices have largely transitioned towards the use of digital soil mapping (DSM) approaches globally taking advantage of advancements in remote sensing, machine learning, and geographical information systems (Mallah et al., 2022). Remote sensing data including satellite images provide valuable information about the spatial and temporal variations in soil properties (Hosseini et al., 2023; Rengma et al., 2023; Saygın et al., 2023). DSM combines field observations, and laboratory analyses with environmental variables derived from RS data to create a geo-based soil information system (Dharumarajan and Hegde, 2022; Mirzaeitalarposhti et al., 2022; Mousavi et al., 2023). DSM applies different model structures spanning from geostatistical, and machine learning to hybrid, ensemble, and model averaging to predict soil properties.
Numerous studies have reported the usefulness of satellite imageries in the prediction of soil texture with varying accuracy and uncertainty depending on satellite image sources, environmental covariates derived and models applied (Loiseau et al., 2019; Mirzaeitalarposhti et al., 2022; Saygın et al., 2023; Yuzugullu et al., 2020). However, to the best of the authors’ knowledge, the literature lacks comprehensive documentation and comparison of soil texture prediction findings utilizing satellite imagery. Several reviews document the use of remote sensing data in agriculture including prediction of soil properties over the past decade. In 2017 the review by Zhang et al. (2017) provided an overview of the major progress made in digital soil mapping detailing history and turning points in the decade leading up to 2017. Lamichhane et al. (2019) reviewed research and applications of various DSM techniques in soil organic carbon (SOC) concentration and stock mapping. Sishodia et al. (2020) offered an overview of remote sensing systems, techniques, and vegetation indices applications in precision agriculture between 2015 and 2020. Machine learning techniques for processing RS data to estimate soil quality indicators were reviewed by Diaz-Gonzalez et al. (2022). Centered at a broad scale (spatial extent greater than 10,000 km2), Chen et al. (2022) provided a broad view of the progress made and suggested further applications and developments in broadscale DSM of the 12 mandatory GlobalSoilMap properties from 244 articles between 2003 and 2021. Pouladi et al. (2023) provide a quantitative insight into 14 years of trends of SOC digital mapping using remote sensing technology while suggesting some directions for future development from 2010.
These reviews have tended to cover a wide range of soil properties, providing a broad overview of each property but often with a level of generalization that limits their comprehensiveness, particularly in the context of soil texture prediction. This gap underscores the need for a systematic review that synthesizes existing studies and identifies trends, discrepancies, and areas for improvement in the application of satellite imagery for soil texture prediction. Such a review could serve as a valuable resource for guiding future research and enhancing the reliability and precision of soil texture predictions. Addressing these gaps would contribute to advancing the understanding and utilization of satellite imagery in soil science research. Therefore, this review aimed to contribute to filling these gaps by conducting a systematic analysis of soil texture prediction using remote sensing data, with a focus on satellite images. The review primarily provides a comprehensive synthesis of existing studies that investigate the application of satellite imagery for soil texture prediction. This involves identifying and collating relevant peer-reviewed literature from 2014 to 2023, evaluating the methodologies employed, types of satellite data, covariates derived, and predictive models’ performances, reliability, and limitations to enhance the effectiveness and applicability of satellite imagery in soil texture prediction. The focus of the review period was driven by the need to capture the cutting-edge techniques spanning from satellite sensor capabilities, data processing, and prediction models that have enhanced the accuracy of soil texture prediction.
1.1 Rationale of the review
Accurate and reliable prediction of soil texture is important for effective soil management, sustainable land use, and agricultural productivity (Keshavarzi et al., 2022). Traditional, soil mapping methods, which rely on intensive field surveys and laboratory analysis, are time-consuming, costly, and often impractical for large-scale applications. Transitioning to digital soil mapping (DSM) approaches leveraging advances in remote sensing, machine learning, and geographic information systems offers a promising alternative. In particular, satellite imagery provides extensive spatial and temporal data that can be used for the prediction of soil properties, including texture (Dhiman et al., 2023; Li et al., 2023). Although numerous studies highlighted the potential of satellite imagery in predicting soil texture, but differ in the methods used, image sources, preprocessing techniques, and modeling algorithms. This variability leads to different levels of accuracy and uncertainty and requires a comprehensive assessment and synthesis of existing research results. This systematic review on soil texture prediction using satellite imagery is motivated by the need to evaluate and synthesize existing research, address knowledge gaps, assess methodological variability, evaluate accuracy and uncertainty, inform decision-making, and guide future research directions.
2 Systematic review framework
2.1 Articles search
An updated guideline for reporting systematic reviews, The Preferred Reporting Items for Systematic Reviews and Meta-Analyses (PRISMA) 2020 statement, was adopted in conducting the current review. The PRISMA 2020 statement provides updated reporting guidance for systematic reviews that reflect advances in methods to identify, select, appraise, and synthesize studies (Page et al., 2021). The papers were collected from five principal academic search systems as classified by Gusenbauer and Haddaway (2020) which include Web of Science Core Collection, MDPI, PubMed, Science Direct, and EbscoHost covering the 10 years from January 2014 to December 2023. The systematic search was undertaken to choose the fully published journal papers by selecting search strings in such a way that most papers relevant to our review objective would be included. All search expressions were chosen based on the defined keywords query for title, keywords, and abstract. The keywords included “soil texture” OR “clay” OR “sand” OR “silt” “digital soil mapping” OR “soil mapping” OR “prediction”, AND “Remote sensing” OR “satellite image”. The search was limited to English (language), article (document type), agriculture and biological sciences, plant sciences, remote sensing, environmental sciences ecology (subject areas).
2.2 Articles screening
A total of 505 papers were identified in the database searches. 175 duplicate articles were identified and subsequently removed, leaving 330 papers for further evaluation against our inclusion criteria. The inclusion criteria were as follows: (1) studies that predict, estimate, or map soil texture, (2) studies utilizing satellite imagery in soil texture prediction, estimation, or mapping, (3) publications falling within the timeframe of 2014–2023, and (4) papers written exclusively in the English language. Upon rigorous scrutiny of titles and abstracts, 106 articles were selected for a thorough examination, including a full-text review. Finally, 70 articles were found to meet all our criteria after completing a full text and included in this review. Figure 1. Depicts the flow of the review from search sites to the final decision for articles included in this review.
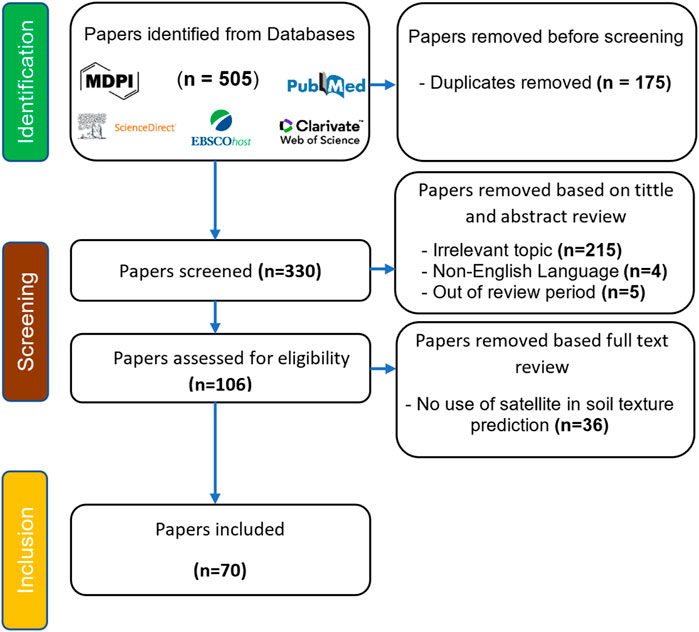
Figure 1. Schematic overview of the screening process applied to the papers included in the review.
2.3 Articles characterization
From the included articles, different criteria and parameters were considered including the year of publication, the predicted parameter, satellite image used and sources, environmental covariates extracted from the satellite image, prediction, and mapping methodologies, model accuracy assessment metrics, and model performance were evaluated, and the findings are reported in the section below. The summary of evaluated parameters is presented in Tables 1, 2.
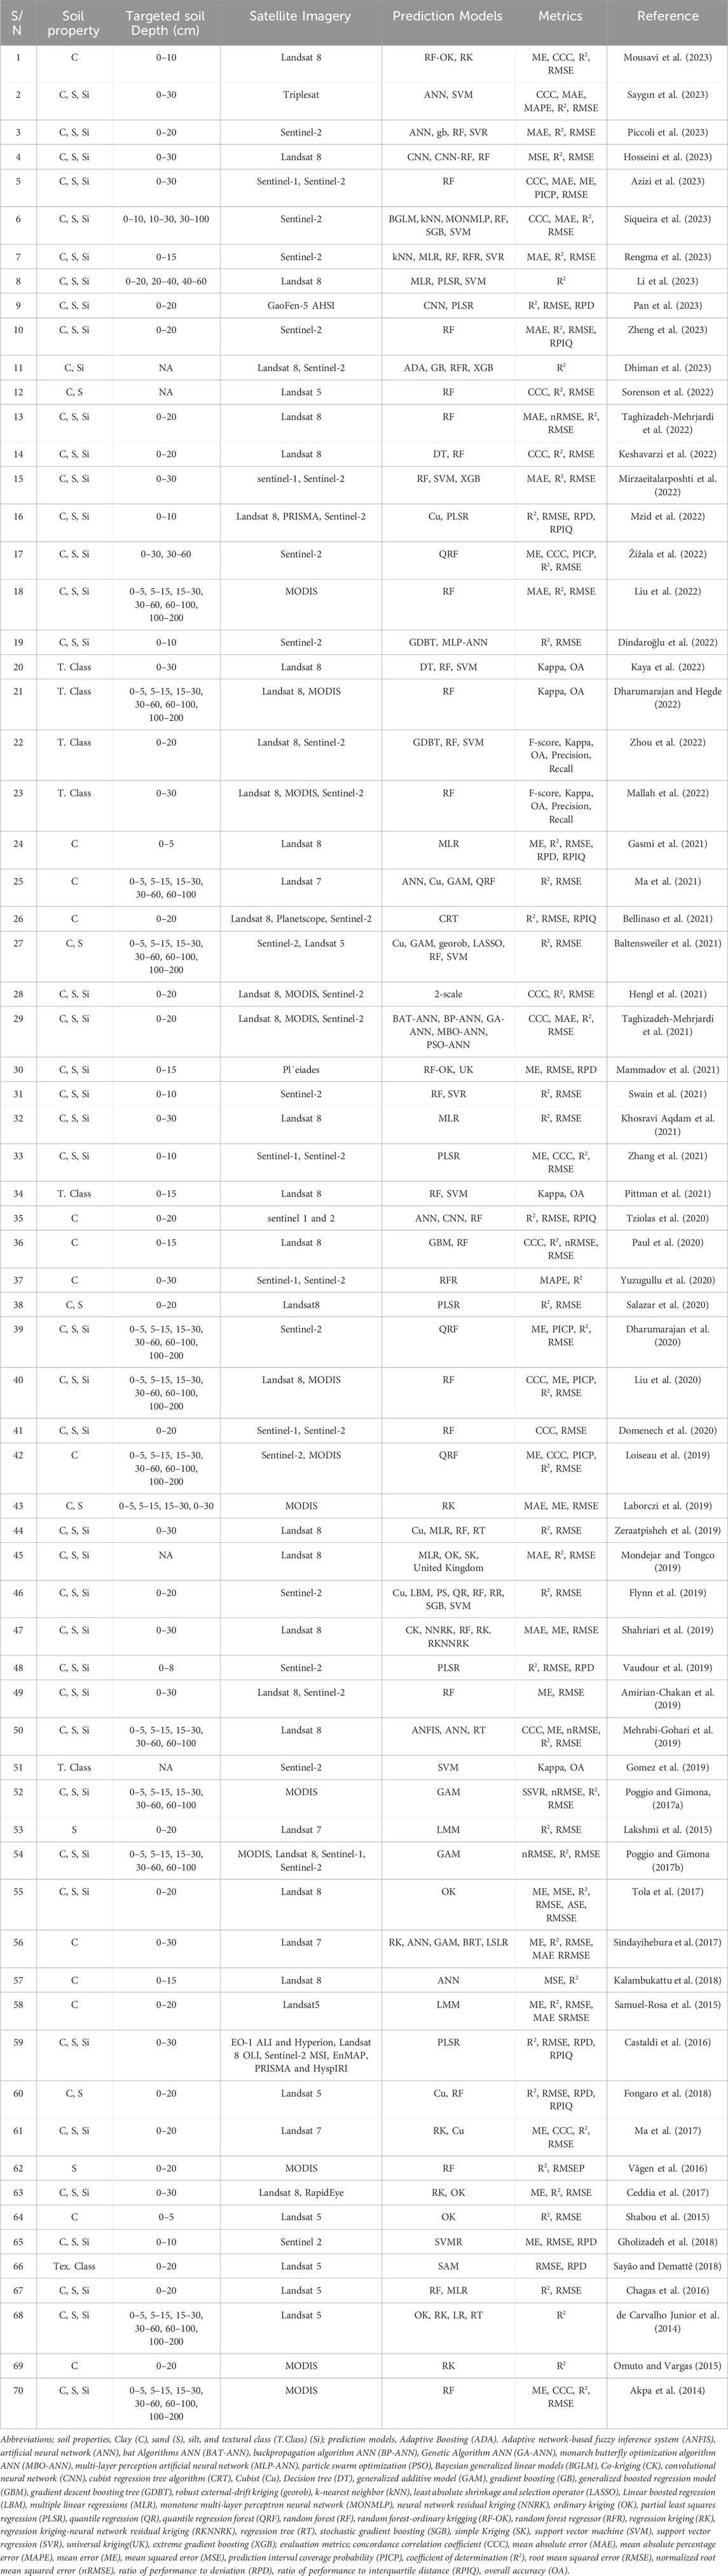
Table 1. Summary of reviewed articles.
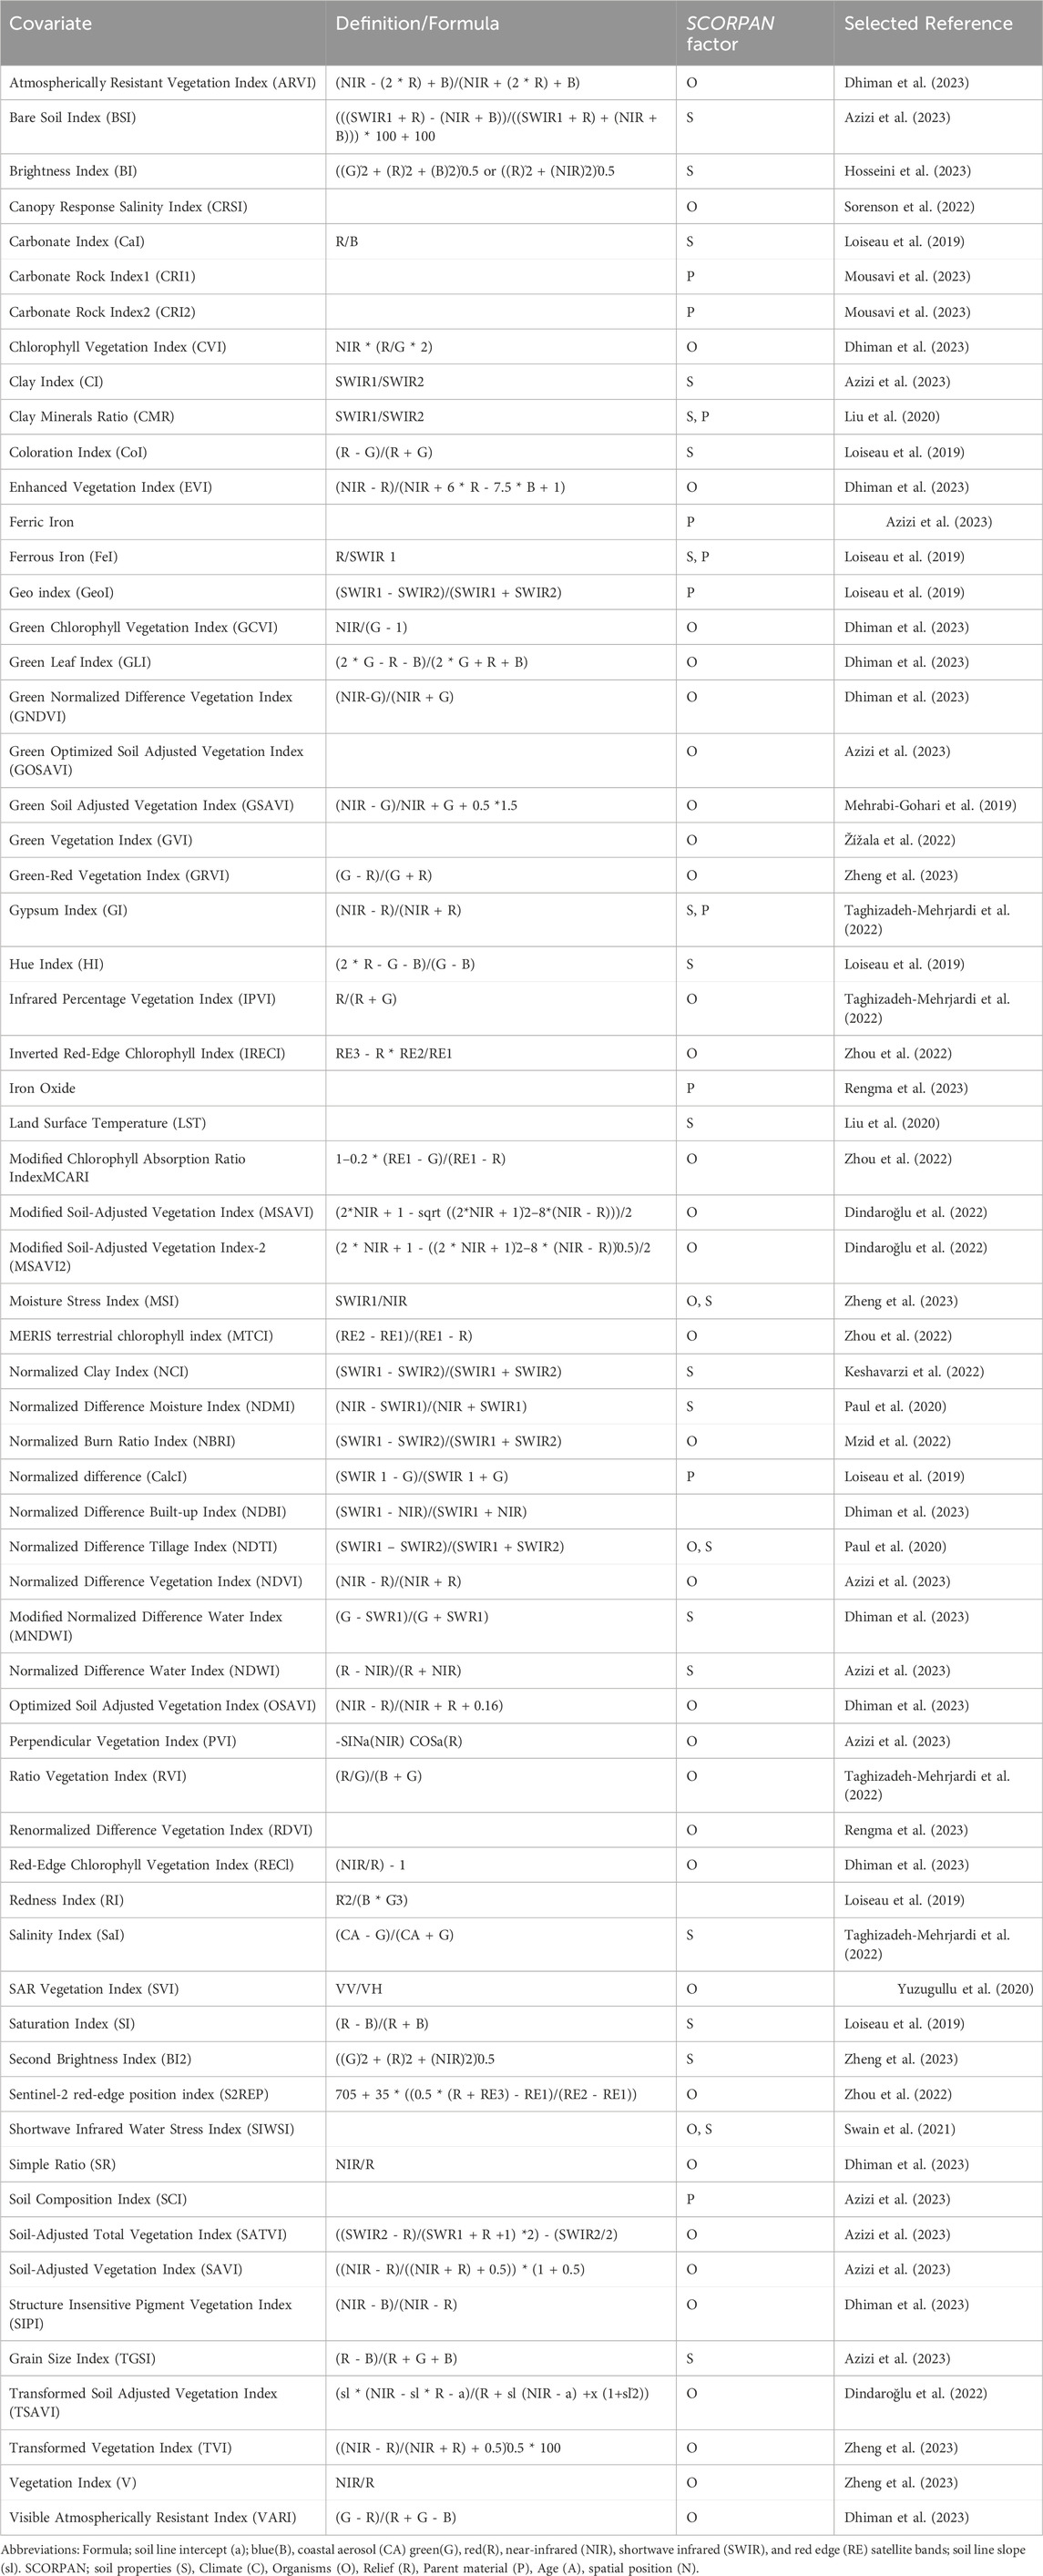
Table 2. Summarized environmental covariates derived from satellite images for prediction of soil texture.
3 Results and discussion
3.1 Overview of the relevant papers
Over the last 10 years, there has been a general growing interest in using optical satellite images to predict soil texture as illustrated by the overall trend of selected publications (Figure 2A). The trend coincides with a growing need for accurate and detailed information about soil texture to decide on soil resource management (Keshavarzi et al., 2022). 42 articles (60% of the analyzed articles) were dedicated to predicting all three major components of soil texture (i.e., clay, sand, and silt) an implication of strong interest in comprehensive soil texture analysis (Figure 2B). 22 (31.43%) articles focused on predicting one class of soil texture i.e 13 (18.57%) clay content, 7 (10%) broad texture classification such as sandy, Clayey, and loamy, and 2 (2.86%) sand. The remaining 6 (8.57%) articles predicted a combination of sand and clay content.
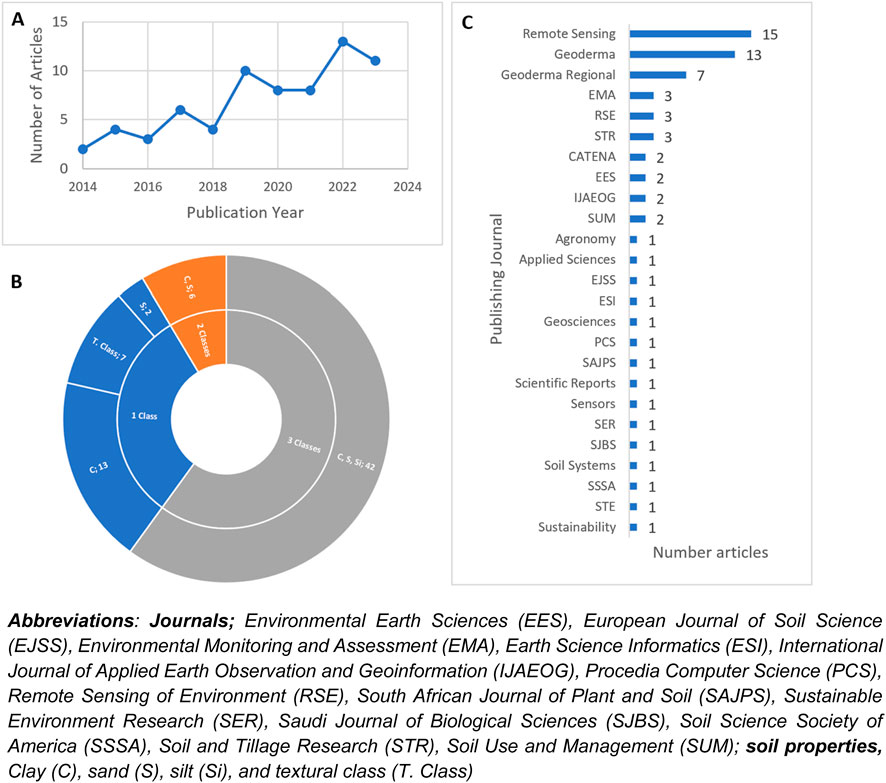
Figure 2. Overview of the included articles: Number of included articles by publishing date (A), Predicted soil texture attribute (attribute(s); number of articles) in the reviewed articles (B), and Number of reviewed articles in publishing journals (C).
Clay content is the most predicted of the three soil particle fractions (87.14%), followed by sand (71.43%) and silt (60%) whereas five (10%) of the articles predicted the soil texture class. Researchers’ interest in clay content prediction may be motivated by the strong relationship between clay and other soil properties and functions such as charge dynamics thus soil reactions, soil carbon, nutrient and water retention, water infiltration, and drainage, amongst others (Bellinaso et al., 2021). The 70 articles considered in the current study were published in 26 different peer-reviewed journals, with Remote Sensing leading the way with fifteen (15) published articles, followed by Geoderma (13), Geoderma Regional (7), and others with one to three publication each (Figure 2C).
The maximum targeted soil depth of the predicted soil texture maps is presented in Figure 3 and Table 1. As indicated, the majority of studies (74.29%) focused on predicting soil texture in the topsoil in the depth range of 0–5, 0–10, 0–15, 0–20, and 0–30 reported in 2.86%, 10.00%, 7.14%, 31.43%, and 22.86% of articles respectively. Fourteen articles (20.00%) focused on the prediction of soil texture to the subsoil depth limit of 60 cm (4.29% of articles), 100 cm (7.14%), and 200 cm (5.71%) using the standard depth interval defined by GlobalSoilMap (Chen et al., 2022). Four articles (5.7%) did not specify the exact soil depth of the predicted maps. Instead, these articles used the generalized term “topsoil”. The dominance of soil texture prediction studies in topsoil can be attributed to the relative importance of the layers for agricultural productivity. The topsoil layer is where most plant feeder roots are located and most nutrient exchange occurs and controls the plant’s available water (Schreiner-McGraw and Baffaut, 2023; Zhou et al., 2024). Additionally, RS is reported to be more effective at capturing properties at the surface or near-surface making the topsoil accessible for studies utilizing RS data including satellite images (Abdulraheem et al., 2023). Studies at 60 cm, 100 cm, and 200 cm indicate an interest in understanding the comprehensive soil profiles.
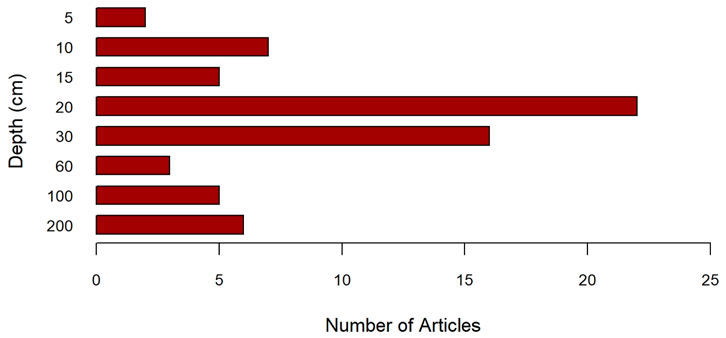
Figure 3. Maximum depth of the predicted soil texture maps using satellite images.
3.2 Satellite images and environmental covariates
3.2.1 Satellite images
Reviewed studies reported the prediction of soil texture using variable satellite images including the Landsat 5, 7, and 8, Sentinel 1 and 2, Moderate Resolution Imaging Spectrometer (MODIS), GaoFen-5 Advanced Hyperspectral Imaging (GF-5 AHSI), PRecursore IperSpettrale della Missione Applicativa (PRISMA), Pleiades, Planetscope, RapidEye, HyspIRI, Hyperion, EnMAP, and Triplesat. Figure 4 illustrates the varied utilization of satellite imagery sources in soil texture prediction in the last 10 years. The figure indicates that Sentinel 2 is the most extensively utilized satellite platform outnumbering Landsat 8 in terms of paper citations. The superior spatial resolution, multi-spectral capabilities, open accessibility, frequent revisits, and global coverage of sentinel 2 makes it an attractive choice for researchers around the world to monitor land surface dynamics in a comprehensive and timely manner (Azizi et al., 2023; Mirzaeitalarposhti et al., 2022; Mzid et al., 2022). The study by Hengl et al. (2021) reported that the use of sentinel 2 derivatives improves the accuracy of soil texture predictions. Evaluating the ability of the PRISMA hyperspectral imager to estimate soil texture in comparison with Sentinel 2 and Landsat 8, Mzid et al. (2022) found that, PRISMA hyperspectral satellite imagery with the Cubist Regression provided the best performance in the prediction of silt, sand, and clay followed by Sentinel 2 and Landsat 8. Furthermore, In a study by Bellinaso et al. (2021), it was found that Sentinel 2 (R2 = 0.68) yielded satisfactory prediction model performance, followed by Landsat 8 (R2 = 0.62) and poor prediction performance of Planetscope satellite image (R2 = 0.26).
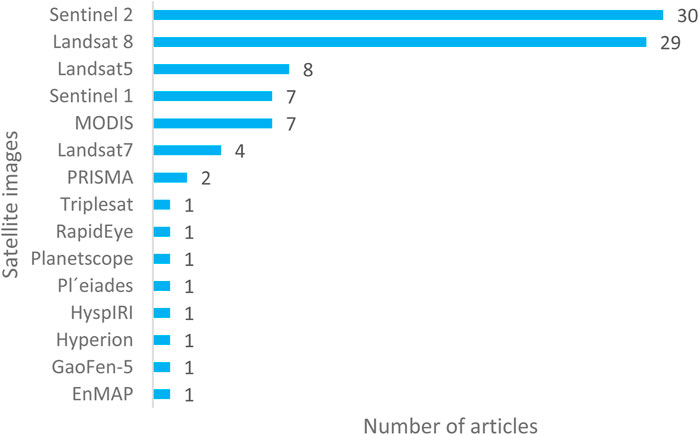
Figure 4. Satellite images used for the prediction of soil texture in the last 10 years.
Thirty-five percent (35%) of the articles reported the multisource use of satellite images with an overall objective of improving prediction accuracy and model performance. The combined usage of satellite images highlights the importance of leveraging complementary satellite imagery sources to achieve higher accuracy in soil texture prediction models.
3.2.2 Environmental covariates derived from satellite images
The conceptual models of soil formation have been used to predict soil texture patterns in the landscape. The McBratney et al. (2003) conceptual model (Sa or Sc = f(SCORPAN), which quantitatively expresses the relationship between soil and soil forming factors termed as environmental covariates has been used as a basis for the selection of environmental covariates in most studies under review. The model conceptualizes soil attribute (Sa) or class (Sc) at a point in space and time, as empirical quantitative function of the soil (S), climate (C), organisms (O), relief (R), parent material (P), age (A), and spatial position (N). In the last 10 years, satellite imageries have been used to derive covariates related to soil properties, Organisms, and parent material as indicated in Table 2 below. These covariates are derived from satellite imagery as individual satellite bands or by a combination of bands known as band ratios (Shahriari et al., 2019).
Figures 5A, B show the percentage frequency of band ratios and individual bands respectively, derived from satellite images as covariates for the prediction of soil texture in the reviewed articles. Figure 4A reveals that NDVI (75.7%), SAVI family of indices (52.9%) (includes TSAVI, MSAVI, MSAVI2, GSAVI, and GOSAVI), BI (18.6%) EVI (17.1%), and CI (14.3%) are the five most prevailing soil texture prediction indices with NDVI on the lead. The high percentage of studies using the NDVI, a measure of the difference between near-infrared (NIR) and red-light reflectance (Loiseau et al., 2019), highlights its dominance in the prediction of soil texture. NDVI has a high degree of correlation to vegetation biomass and chlorophyll content and can subsequently be linked to the aboveground green biomass, vegetation moisture content, and indirectly linked to soil texture (Dindaroğlu et al., 2022; Loiseau et al., 2019). Amongst individual bands used in soil texture prediction (Figure 4B), Red, NIR, Green, Blue, and SW2 bands were the five most prevailing with 28.6%, 27.1%, 25.7%, 25.7%, and 21.4% percent of studies used prediction respectively. Combining individual bands in soil texture prediction has long been reported to increase prediction accuracy (Mallah et al., 2022).
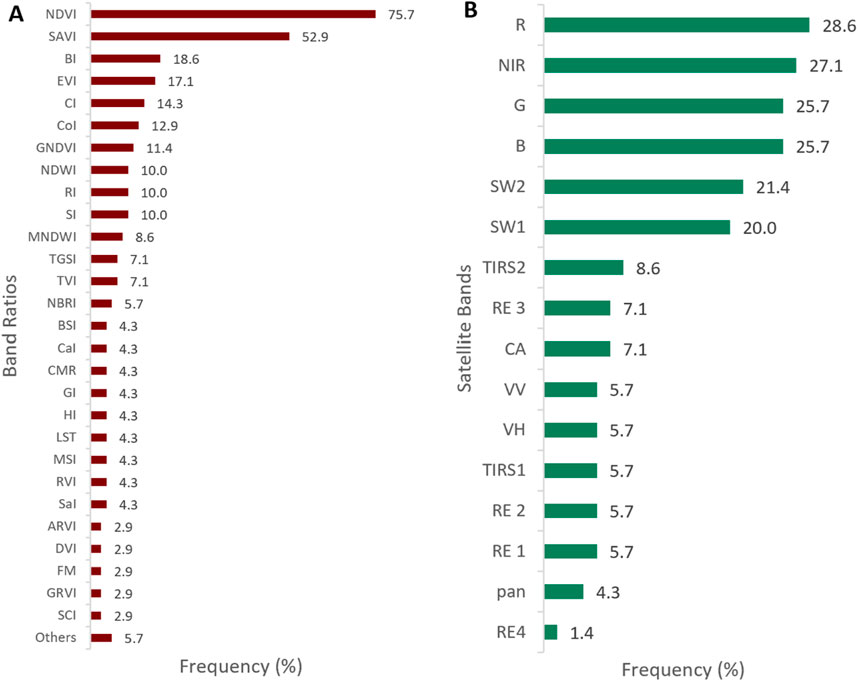
Figure 5. Covariates derived from satellite images; Band ratios/indices (A) and individual satellite bands (B).
3.2.3 Relative importance of environmental covariates
Finding the best covariates for predictive soil mapping is a crucial step that determines the soil mapping accuracy particularly when the number of soil samples is limited and spatial heterogeneity high (Lu et al., 2019; Rengma et al., 2023). Incorporating a wide range of environmental covariates increases the likelihood of finding optimal predictors (Rengma et al., 2023). However, it is essential to investigate the influence of each covariate on soil mapping and employ feature selection techniques to identify informative covariates and exclude those that add more noise or complexity to the predictive models (Duan et al., 2022). Among the reviewed articles, 60.78% reported variable importance analysis employing nine (9) different approaches for selecting covariates important for soil texture prediction. They include Accuracy Based Importance (ABI) (Keshavarzi et al., 2022), genetic algorithms (GA) (Taghizadeh-Mehrjardi et al., 2022), Shapley Addictive Explanation (SHAP) (Zhou et al., 2022), Pearson correlation coefficient and variance inflation factor analysis (PCC-VIF) (Azizi et al., 2023), Spearman correlation and Recursive Feature Elimination (SC-RFE) (Siqueira et al., 2023), minimal depth (MD) (Mallah et al., 2022), explained variance distribution (EVD) (Dindaroğlu et al., 2022), and Boruta feature ranking and selection (BFRS) algorithm (Rengma et al., 2023).
Of the reported variable importance analysis approaches, ABI is the most applied approach (61.29%), followed by all other approaches each reported by 3.23% of the analyzed articles reporting the variable importance analysis (n = 31). ABI is a technique for calculating the prediction error of machine learning models like random forests and boosted decision trees that employ bootstrap aggregating (Shahriari et al., 2019). The variable importance is determined by the change in out-of-bag (OOB) error when a variable is permutated from the set of environmental variables (the higher the value the greater the variable importance) (Kaya et al., 2022). Streamlining the model evaluation process by estimating prediction error efficiently without the need for a separate validation dataset or test set, makes ABI a preferred approach over other methods (Dharumarajan and Hegde, 2022; Liu et al., 2022).
Besides ABI, GA, a computational model with biological inspiration based on evolutionary processes like selection, crossover, and mutation, is designed to determine the functions that best suit the experimental data set (Taghizadeh-Mehrjardi et al., 2022). While SHAP estimates the contribution of the individual variable by comparing the performance of the model with and without this variable using a Shapley value based on the coalitional game theory (Zhou et al., 2022). The PCC-VIF and SC-RFE analysis calculates the correlation between environmental variables and the soil texture followed by the elimination of the multi-collinearity problem between explanatory variables (Azizi et al., 2023), and ranking the importance of each predictor in a full model based on the importance index available for each model (Siqueira et al., 2023; Taghizadeh-Mehrjardi et al., 2021) respectively. MD is based on the decision tree structures, it determines variable importance by the position of the variables in the decision trees (Mallah et al., 2022). EVD calculates the relative importance of each input variable by distributing the explained variance among the estimators, taking into account the weighting coefficients in the input, hidden, and output layers of the common variables (Dindaroğlu et al., 2022). The BFRS algorithm duplicates the dataset and shuffles the predictors column-wise, creating shadow predictors and then comparing them to the shadows, the feature importance (Z score) of each predictor is then evaluated based on the relevant RMSE (Paul et al., 2020).
Figures 6A–C present the analysis of the relative importance of environmental covariates used for predicting the clay, sand, and silt content in the analyzed articles based on Accuracy-Based Importance (ABI). The figures highlight that the NIR band, followed by the SWIR2 band, contributes more to predicting clay content. Conversely, the NDVI, followed by the NIR band, has the greatest influence on predicting sand and silt contents. The NIR band, which typically ranges from 0.7 to 1.0 µm, is particularly sensitive to soil moisture and organic matter content which are closely linked to clay minerals (Hong et al., 2018; Viscarra Rossel et al., 2016). Due to their small size and large surface area, clay particles tend to retain more water, resulting in higher reflectance in the NIR region (El Alem et al., 2022). Additionally, the NIR band is often used to estimate soil moisture content, which indirectly correlates with clay content (Gozukara et al., 2022; Soltani et al., 2019).
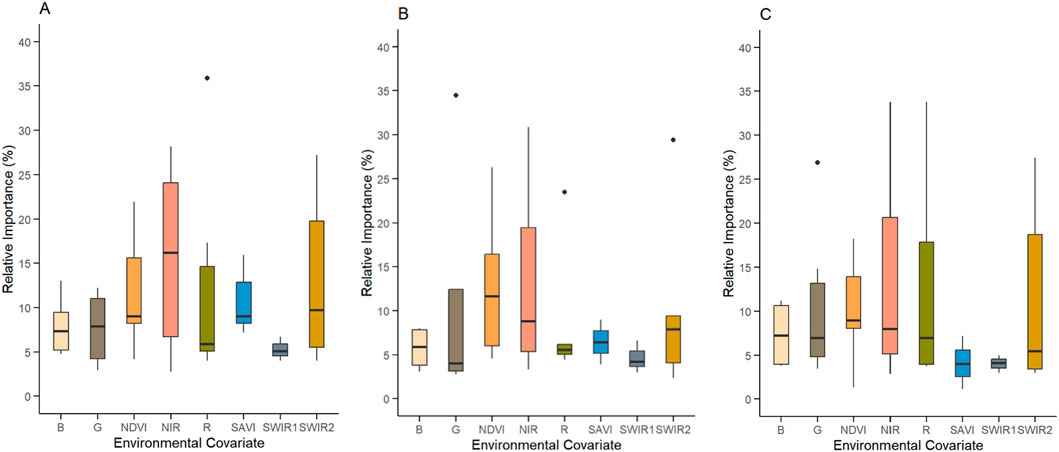
Figure 6. Relative importance of covariates for soil texture prediction: clay (A), sand (B), and silt (C).
SWIR2 covers wavelengths from 1.55 to 2.29 µm and is sensitive to specific absorption characteristics of clay minerals such as kaolinite, montmorillonite, and illite, as well as carbonate content. This makes SWIR2 an essential covariate for the detection of mineralogical composition of soils as reported by Coblinski et al. (2020). NDVI, which ranges from −1 to +1, reflects vegetation density, with higher values indicating denser vegetation cover. Studies by Dindaroğlu et al. (2022) and Loiseau et al. (2019) have shown that dense vegetation is associated with higher organic matter content and improved soil structure properties that are typical of soils with lower sand content and higher silt and clay contents. Thus, the importance of NDVI in predicting sand and silt content highlights the indirect relationship between vegetation cover and soil texture.
3.3 Prediction models and performance assessment
3.3.1 Prediction models used
Recent advances in machine learning and remote sensing technologies have improved soil texture prediction, using satellite images. Selection of a suitable model for digital soil mapping requires consideration of the advantages and disadvantages of different models (Azizi et al., 2023). Forty-three (43) different models have been used to predict soil texture in the last 10 years which can be grouped into machine learning models such as RF, SVM, Cu, ANN, and CNN; statistical models such as PLSR, MLR, GAM, and BGLM, geostatistical models such as RK, UK, CK, OK and SK; and Hybrid models such as RFR, RF-OK, and ANFIS. The current review found the dominance of machine learning models constituting 55.2% of the articles analyzed followed by statistical models used by 12% of the articles whereas Hybrid and geostatistical model models have been reported by 10.4% and 8.0% respectively. The review also found a considerable portion of articles (14.4%) used ensemble and model averaging approaches such as Quantile regression forest and Gradient Boosting. The prominence of machine learning models in soil texture prediction is a shred of evidence of their effectiveness in the prediction of soil texture (Baltensweiler et al., 2021). The application of hybrid and ensemble modeling approaches shed light on the effort to improve prediction accuracy. When multiple learning algorithms are combined, the prediction models are more powerful and robust than when they are used individually (Hengl et al., 2021; Swain et al., 2021). A study by Wang et al. (2024) on finer soil strength mapping using remote sensing images concluded that boosting ensemble learning methods overall perform better in soil properties prediction especially soil moisture.
Figure 7 depicts the predictive models used to predict soil texture prediction in studies reviewed. RF model is by far the most used prediction model (44.3%), indicating that this approach has proven suitable for the prediction of soil texture. RF is an ensemble learning-based assemblage of classifications and regression trees (Liu et al., 2020; Pittman et al., 2021). In the context of large-scale, high-dimensional data, it emerges as the preferred model due to its robustness. Compared to many other prediction models, RF improves prediction accuracy and reduces model overfitting (Dharumarajan and Hegde, 2022). Another advantage of the RF model is that it provides information on the relative importance of environmental covariates in modeling (Mallah et al., 2022). SVM was the second most used (14.3%) followed by ANN, Cu, and RK which was reported in 11.4% of the articles each. SVM is an intelligently constructed supervised machine learning system that uses learning algorithms based on statistical learning and optimization theories (Kaya et al., 2022). Due to its kennel functions, SVM implicitly maps data into high dimensional space, making it effective at handling and modeling non-linear relationships between data. This versatility makes it an excellent choice for predicting soil texture (Li et al., 2023). The PLSR, MLR, and QRF have been used by 10.0% each followed by SVR reported in 5.7% of articles. All other models which include CNN, kNN, DT, CK, and OK, albeit to a lesser extent, have also contributed to soil texture prediction, being reported variably in 1%–4.3% of the articles.
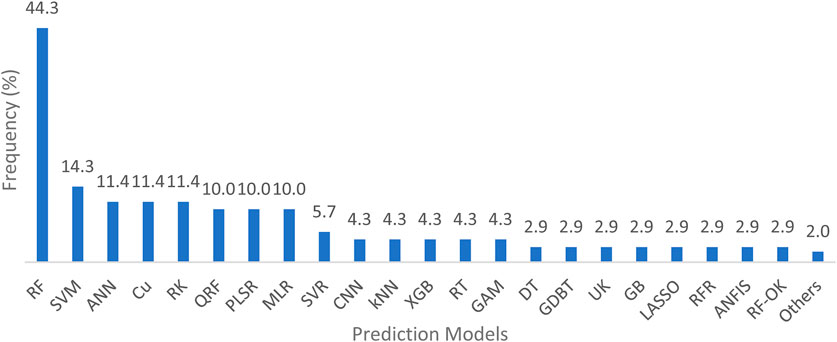
Figure 7. Prediction model used for prediction of soil texture.
3.3.2 Model performance evaluation metrics
Predictive models must be evaluated for effectiveness and reliability before being selected for soil texture prediction. In the reviewed articles, K-fold cross-validation data splitting, and leave-one-out cross-validation (LOOCV) approaches have been used to evaluate the models employing various statistical indices. Figure 8 displays different statistical indices employed to assess the model’s performance in predictions of clay, sand, and silt in the examined articles. The figure shows that root mean square error (RMSE), coefficient of determination (R2), and mean absolute error (MAE) are the most applied metrics to validate model performance in predictions of both Clay (31.0%, 29.2%, and 14.2%), sand (32.8%, 27.8%, and 16.2%), and silt (29.7%, 26.9%, and 17.0%) respectively. Concordance correlation coefficient (CCC) and mean error (ME) are the second most frequently used group of metrics appearing in 10.7%, and 5.3% for clay; 11.6%, and 4.1% for sand; and 11.6%, and 6.67% for silt predictions respectively. RIPQ, RPD, nRMSE, PCIP, MAPE, and MSE are the least frequently applied statistical indices reported in less than 3% of both clay, sand, and silt predictions in the examined articles.
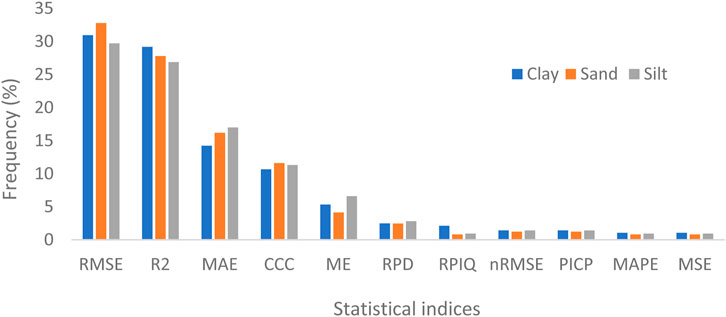
Figure 8. Statistical indices applied in model evaluation for prediction of clay, sand, and silt.
The results are in agreement with the results of Chen et al. (2022). Each statistical metric provides unique insights into model performance, thus choosing indices is crucial to evaluating soil texture predictions (Baltensweiler et al., 2021; Dharumarajan and Hegde, 2022; Siqueira et al., 2023; Sorenson et al., 2022). The preference for RMSE, R2, and MAE in the reviewed articles highlights their effectiveness in capturing the accuracy, reliability, and goodness-of-fit of soil texture models. MAE and RMSE summarize the residuals and describe the absolute accuracy of the models showing how close the predicted values are to the actual values, the closer to zero, the more reliable the prediction becomes (Baltensweiler et al., 2021; Domenech et al., 2020; Laborczi et al., 2019; Siqueira et al., 2023). R2 measures the agreement between measured and predicted data with a good model having values closer to 1 (Domenech et al., 2020). Although less frequently used, CCC assesses the precision and accuracy of predictions by comparing them to observed values (Mehrabi-Gohari et al., 2019) and ME is a useful indicator of model bias (Dharumarajan et al., 2020). RIPQ, RPD, nRMSE, PCIP, MAPE, and MSE albeit less frequency, provide valuable supplementary information on model performance in soil texture prediction studies. RIPQ indicates model reliability (Tziolas et al., 2020), RPD indicates model robustness and reliability (Vaudour et al., 2019), nRMSE facilitates the standardized model accuracy assessment (Mehrabi-Gohari et al., 2019), PCIP is valuable for assessing classification accuracy (Liu et al., 2020; Loiseau et al., 2019), and MAPE is effective in highlighting relative errors (Saygın et al., 2023).
3.3.3 Comparative predictive model performance
The analysis was done to assess the performances of the most frequently used models (reported in more than 10% of the studies) in the prediction of soil texture using the most frequently used statistical indices R2, RMSE, and MAE (Figure 9). The figure reveals that RF performs well across all three soil texture fractions (clay, sand, and silt) with a good trade-off between R2, MAE, and RMSE indicating good model fit and accurate predictions. The ANN also performs consistently for clay, sand, and silt with the lowest RSME and MAE values for silt while PLSR performs satisfactorily for clay and silt with slightly higher RMSE and MAE values for sand.
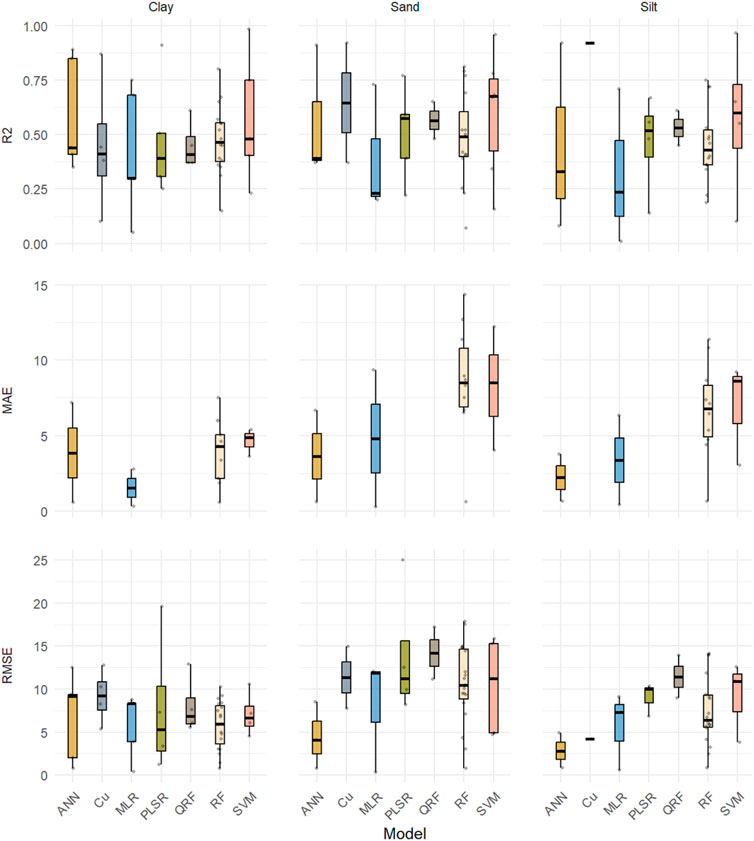
Figure 9. Comparative model performance.
SVM has comparably the highest value of R2 across the soil texture fractions, suggesting it as the best-fit model for soil texture predictions. However, the reported RSME and MAE are also the highest compared to RF and ANN. Cu, QRF, and MLR vary across soil texture fractions. As a result of their trade-off performance across statistical indices, RF and ANN appear to be strong candidates for soil texture prediction. In numerous studies, RF performed best in predicting soil texture (Azizi et al., 2023; Baltensweiler et al., 2021; Dharumarajan et al., 2020; Siqueira et al., 2023). According to Zhang and Shi (2019), RF is relatively robust to overfitting due to the use of an ensemble tree without pruning. A study by Zhang et al. (2021) comparing ANN, ANFIS, and RT reported that ANN being non-significant different from ANFIS, was more efficient in soil clay, sand, and silt than RT. A similar study by Ma et al. (2021) reported that ANN models in 2.5D and 3D modeling provided the best prediction accuracies for clay compared to QRF and Cu. The ANNs’ robustness and performance can be ascribed to their capacity to work on intricate non-linear relationships, manage high-dimensional information, and exhibit adaptability when managing a diverse of data types (Ma et al., 2021; Taghizadeh-Mehrjardi et al., 2021).
Figure 10 presents the performance of the RF model in the prediction of clay, sand, and silt as indicated by the R2 across four different targeted maximum soil depths grouped as 0–30 cm, 30–60 cm, 60–100 cm, and 100–200 cm. The RF performance to predict clay content showed a decreasing trend with increasing depth interval, with median R2 values of 0.49, 0.45, 0.43, and 0.43 respectively. Similarly, sand prediction demonstrated a decrease in RF model performance with median R2 of 0.53, 0.47, 0.47, and 0.45 across the same depth intervals. A similar trend of decreasing model performance of soil properties prediction with increasing soil depth was reported in the review by Chen et al. (2022). This suggests a consistent pattern in the predictive challenges associated with deeper soil layers which can be attributed to high variability in soil moisture content, mineral composition, and less influence of surface processes captured by RS sensors (Abdulraheem et al., 2023; Pavlů et al., 2023; Wang et al., 2024). The RF model performance was inconsistent with silt predictions (median R2 of 0.50, 0.46, 0.48) with increasing depth intervals. Particles-wise, the RF model performance was in the sand > silt > clay indicating the robustness of the RF model in capturing variability in sand content compared to clay and silt across varying soil depths.
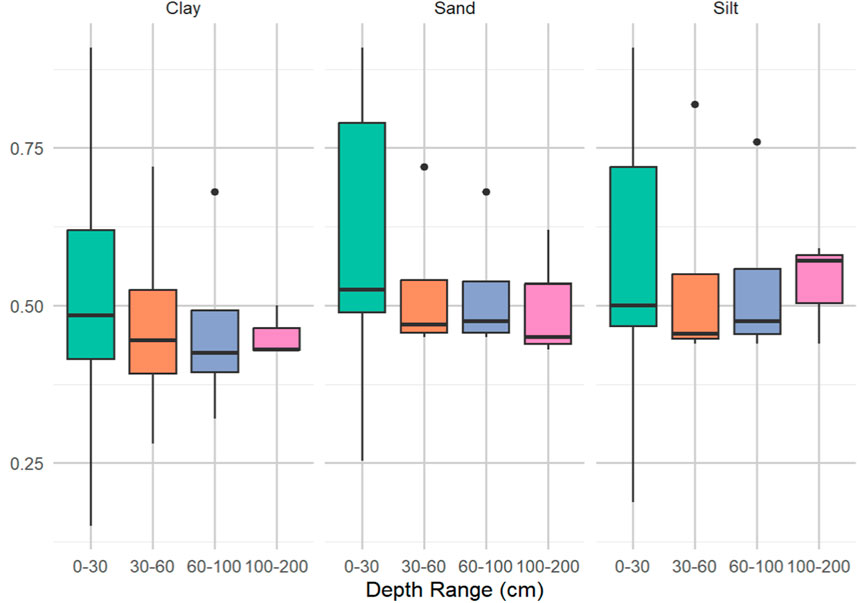
Figure 10. Performance of RF model (R2) for prediction of clay, sand, and silt across four depth intervals.
4 Conclusion
This study conducted a systematic review of soil texture prediction using satellite images and a meta-analysis on the relative importance of environmental covariates and the performance of the prediction models used to predict soil texture. We concluded that among the soil texture attributes, clay was the most predicted than the other particle size fractions. Topsoil layers (0–30 cm) are the most targeted in soil texture prediction studies. Sentinel-2 and Landsat 8 satellite images were by far the most commonly utilized images with the red and NIR individual satellite bands and band ratios, NDVI and SAVI family being the most extensive derived covariates incorporated in soil texture prediction. The Random Forest model is the most favored for soil texture prediction due to its robustness, accuracy, and ability to rank the importance of environmental covariates. Based on the meta-analysis of the relative importance of environmental covariates calculated using the ABI approach, the individual bands NIR and SWIR2 are the most important in the prediction of clay while NDVI and NIR are the most important for the prediction of sand and silt soil particles. Furthermore, the meta-analysis compares the prediction model performance using the most common performance measures used, R2, MAE, and RSME; RF and ANN are pictured as the leading models in the field of soil texture prediction based on their good trade-off across performance measures. RF model stands out for its robustness against overfitting and its consistent performance across all soil texture fractions, making it a preferred choice for soil texture prediction. While ANN models demonstrate strong capabilities in handling complex non-linear relationships and high-dimensional data. The RF performance trend decrease with increase in soil depth interval for clay and sand prediction and inconsistent for silt prediction.
Author contributions
RM: Conceptualization, Data curation, Formal Analysis, Writing–original draft, Writing–review and editing. BM: Writing–review and editing. MS: Writing–review and editing. HS: Writing–review and editing. MO: Writing–review and editing.
Funding
The author(s) declare that no financial support was received for the research, authorship, and/or publication of this article.
Conflict of interest
The authors declare that the research was conducted in the absence of any commercial or financial relationships that could be construed as a potential conflict of interest.
Publisher’s note
All claims expressed in this article are solely those of the authors and do not necessarily represent those of their affiliated organizations, or those of the publisher, the editors and the reviewers. Any product that may be evaluated in this article, or claim that may be made by its manufacturer, is not guaranteed or endorsed by the publisher.
References
Abdulraheem, M. I., Zhang, W., Li, S., Moshayedi, A. J., Farooque, A. A., and Hu, J. (2023). Advancement of remote sensing for soil measurements and applications: a comprehensive review. Sustainability 15 (21), 15444. doi:10.3390/su152115444
Akpa, S. I. C., Odeh, I. O. A., Bishop, T. F. A., and Hartemink, A. E. (2014). Digital mapping of soil particle-size fractions for Nigeria. Soil Sci. Soc. Am. J. 78 (6), 1953–1966. doi:10.2136/sssaj2014.05.0202
Amirian-Chakan, A., Minasny, B., Taghizadeh-Mehrjardi, R., Akbarifazli, R., Darvishpasand, Z., and Khordehbin, S. (2019). Some practical aspects of predicting texture data in digital soil mapping. Soil Tillage Res. 194, 104289. doi:10.1016/j.still.2019.06.006
Azizi, K., Garosi, Y., Ayoubi, S., and Tajik, S. (2023). Integration of Sentinel-1/2 and topographic attributes to predict the spatial distribution of soil texture fractions in some agricultural soils of western Iran. Soil Tillage Res. 229, 105681. doi:10.1016/j.still.2023.105681
Baltensweiler, A., Walthert, L., Hanewinkel, M., Zimmermann, S., and Nussbaum, M. (2021). Machine learning based soil maps for a wide range of soil properties for the forested area of Switzerland. Geoderma Reg. 27, e00437. doi:10.1016/j.geodrs.2021.e00437
Bellinaso, H., Silvero, N. E. Q., Ruiz, L. F. C., Accorsi Amorim, M. T., Rosin, N. A., Mendes, W. de S., et al. (2021). Clay content prediction using spectra data collected from the ground to space platforms in a smallholder tropical area. Geoderma 399, 115116. doi:10.1016/j.geoderma.2021.115116
Castaldi, F., Palombo, A., Santini, F., Pascucci, S., Pignatti, S., and Casa, R. (2016). Evaluation of the potential of the current and forthcoming multispectral and hyperspectral imagers to estimate soil texture and organic carbon. Remote Sens. Environ. 179, 54–65. doi:10.1016/j.rse.2016.03.025
Ceddia, M. B., Gomes, A. S., Vasques, G. M., and Pinheiro, É. F. M. (2017). Soil carbon stock and particle size fractions in the central amazon predicted from remotely sensed relief, multispectral and radar data. Remote Sens. 9 (2), 124. doi:10.3390/rs9020124
Chagas, C. da S., de Carvalho Junior, W., Bhering, S. B., and Calderano Filho, B. (2016). Spatial prediction of soil surface texture in a semiarid region using random forest and multiple linear regressions. CATENA 139, 232–240. doi:10.1016/j.catena.2016.01.001
Chen, S., Arrouays, D., Leatitia Mulder, V., Poggio, L., Minasny, B., Roudier, P., et al. (2022). Digital mapping of GlobalSoilMap soil properties at a broad scale: a review. Geoderma 409, 115567. doi:10.1016/j.geoderma.2021.115567
Coblinski, J. A., Giasson, É., Demattê, J. A. M., Dotto, A. C., Costa, J. J. F., and Vašát, R. (2020). Prediction of soil texture classes through different wavelength regions of reflectance spectroscopy at various soil depths. CATENA 189, 104485. doi:10.1016/j.catena.2020.104485
de Carvalho Junior, W., Lagacherie, P., da Silva Chagas, C., Calderano Filho, B., and Bhering, S. B. (2014). A regional-scale assessment of digital mapping of soil attributes in a tropical hillslope environment. Geoderma 232–234, 479–486. doi:10.1016/j.geoderma.2014.06.007
Dharumarajan, S., and Hegde, R. (2022). Digital mapping of soil texture classes using Random Forest classification algorithm. Soil Use Manag. 38 (1), 135–149. doi:10.1111/sum.12668
Dharumarajan, S., Kalaiselvi, B., Suputhra, A., Lalitha, M., Hegde, R., Singh, S. K., et al. (2020). Digital soil mapping of key GlobalSoilMap properties in Northern Karnataka Plateau. Geoderma Reg. 20, e00250. doi:10.1016/j.geodrs.2019.e00250
Dhiman, G., Bhattacharya, J., and Roy, S. (2023). Soil textures and nutrients estimation using remote sensing data in north India - Punjab region. Procedia Comput. Sci. 218, 2041–2048. doi:10.1016/j.procs.2023.01.180
Diaz-Gonzalez, F. A., Vuelvas, J., Correa, C. A., Vallejo, V. E., and Patino, D. (2022). Machine learning and remote sensing techniques applied to estimate soil indicators – review. Ecol. Indic. 135, 108517. doi:10.1016/j.ecolind.2021.108517
Dindaroğlu, T., Kılıç, M., Günal, E., Gündoğan, R., Akay, A. E., and Seleiman, M. (2022). Multispectral UAV and satellite images for digital soil modeling with gradient descent boosting and artificial neural network. Earth Sci. Inf. 15 (4), 2239–2263. doi:10.1007/s12145-022-00876-7
Domenech, M. B., Amiotti, N. M., Costa, J. L., and Castro-Franco, M. (2020). Prediction of topsoil properties at field-scale by using C-band SAR data. Int. J. Appl. Earth Observation Geoinformation 93, 102197. doi:10.1016/j.jag.2020.102197
Dornik, A., Cheţan, M. A., Drăguţ, L., Dicu, D. D., and Iliuţă, A. (2022). Optimal scaling of predictors for digital mapping of soil properties. Geoderma 405, 115453. doi:10.1016/j.geoderma.2021.115453
Duan, M., Guo, Z., Zhang, X., and Wang, C. (2022). Influences of different environmental covariates on county-scale soil type identification using remote sensing images. Ecol. Indic. 139, 108951. doi:10.1016/j.ecolind.2022.108951
El Alem, A., Hmaissia, A., Chokmani, K., and Cambouris, A. N. (2022). Quantitative study of the effect of water content on soil texture parameters and organic matter using proximal visible—near infrared spectroscopy. Remote Sens. 14 (Issue 15), 3510. doi:10.3390/rs14153510
FAO (2022). The state of the world’s land and water resources for food and agriculture 2021 – systems at breaking point. Rome, Italy: FAO. Available at: https://openknowledge.fao.org/handle/20.500.14283/cb9910en.
Flynn, T., de Clercq, W., Rozanov, A., and Clarke, C. (2019). High-resolution digital soil mapping of multiple soil properties: an alternative to the traditional field survey? South Afr. J. Plant Soil 36 (4), 237–247. doi:10.1080/02571862.2019.1570566
Fongaro, C. T., Demattê, J. A. M., Rizzo, R., Lucas Safanelli, J., Mendes, W. D., Dotto, A. C., et al. (2018). Improvement of clay and sand quantification based on a novel approach with a focus on multispectral satellite images. Remote Sens. 10 (Issue 10), 1555. doi:10.3390/rs10101555
Gasmi, A., Gomez, C., Lagacherie, P., Zouari, H., Laamrani, A., and Chehbouni, A. (2021). Mean spectral reflectance from bare soil pixels along a Landsat-TM time series to increase both the prediction accuracy of soil clay content and mapping coverage. Geoderma 388, 114864. doi:10.1016/j.geoderma.2020.114864
Gholizadeh, A., Žižala, D., Saberioon, M., and Borůvka, L. (2018). Soil organic carbon and texture retrieving and mapping using proximal, airborne and Sentinel-2 spectral imaging. Remote Sens. Environ. 218, 89–103. doi:10.1016/j.rse.2018.09.015
Gomez, C., Dharumarajan, S., Féret, J.-B., Lagacherie, P., Ruiz, L., and Sekhar, M. (2019). Use of sentinel-2 time-series images for classification and uncertainty analysis of inherent biophysical property: case of soil texture mapping. Remote Sens. 11 (Issue 5), 565. doi:10.3390/rs11050565
Gozukara, G., Akça, E., Dengiz, O., Kapur, S., and Adak, A. (2022). Soil particle size prediction using Vis-NIR and pXRF spectra in a semiarid agricultural ecosystem in Central Anatolia of Türkiye. CATENA 217, 106514. doi:10.1016/j.catena.2022.106514
Gusenbauer, M., and Haddaway, N. R. (2020). Which academic search systems are suitable for systematic reviews or meta-analyses? Evaluating retrieval qualities of Google Scholar, PubMed, and 26 other resources. Res. Synthesis Methods 11 (2), 181–217. doi:10.1002/jrsm.1378
Hengl, T., Miller, M. A. E., Križan, J., Shepherd, K. D., Sila, A., Kilibarda, M., et al. (2021). African soil properties and nutrients mapped at 30 m spatial resolution using two-scale ensemble machine learning. Sci. Rep. 11 (1), 6130. doi:10.1038/s41598-021-85639-y
Hong, Y., Yu, L., Chen, Y., Liu, Y., Liu, Y., Liu, Y., et al. (2018). Prediction of soil organic matter by VIS–NIR spectroscopy using normalized soil moisture index as a proxy of soil moisture. Remote Sens. 10 (Issue 1), 28. doi:10.3390/rs10010028
Hosseini, F. S., Seo, M. B., Razavi-Termeh, S. V., Sadeghi-Niaraki, A., Jamshidi, M., and Choi, S.-M. (2023). Geospatial artificial intelligence (GeoAI) and satellite imagery fusion for soil physical property predicting. Sustainability 15 (Issue 19), 14125. doi:10.3390/su151914125
Kalambukattu, J. G., Kumar, S., and Arya Raj, R. (2018). Digital soil mapping in a Himalayan watershed using remote sensing and terrain parameters employing artificial neural network model. Environ. Earth Sci. 77 (5), 203. doi:10.1007/s12665-018-7367-9
Kaya, F., Başayiğit, L., Keshavarzi, A., and Francaviglia, R. (2022). Digital mapping for soil texture class prediction in northwestern Türkiye by different machine learning algorithms. Geoderma Reg. 31, e00584. doi:10.1016/j.geodrs.2022.e00584
Keshavarzi, A., del Árbol, M. Á. S., Kaya, F., Gyasi-Agyei, Y., and Rodrigo-Comino, J. (2022). Digital mapping of soil texture classes for efficient land management in the Piedmont plain of Iran. Soil Use Manag. 38 (4), 1705–1735. doi:10.1111/sum.12833
Khosravi Aqdam, K., Miran, N., Mohammadi Khajelou, Y., Khosravi Aqdam, M., Asadzadeh, F., and Mosleh, Z. (2021). Predicting the spatial distribution of soil mineral particles using OLI sensor in northwest of Iran. Environ. Monit. Assess. 193 (6), 377. doi:10.1007/s10661-021-09163-2
Laborczi, A., Szatmári, G., Kaposi, A. D., and Pásztor, L. (2019). Comparison of soil texture maps synthetized from standard depth layers with directly compiled products. Geoderma 352, 360–372. doi:10.1016/j.geoderma.2018.01.020
Lakshmi, S. V., James, J., Soundariya, S., Vishalini, T., and Pandian, P. K. (2015). A comparison of soil texture distribution and soil moisture mapping of Chennai coast using Landsat ETM+ and IKONOS data. Aquat. Procedia 4, 1452–1460. doi:10.1016/j.aqpro.2015.02.188
Lamichhane, S., Kumar, L., and Wilson, B. (2019). Digital soil mapping algorithms and covariates for soil organic carbon mapping and their implications: a review. Geoderma 352, 395–413. doi:10.1016/j.geoderma.2019.05.031
Li, Q., Hu, Z., Zhang, F., Song, D., Liang, Y., and Yu, Y. (2023). Multispectral remote sensing monitoring of soil particle-size distribution in arid and semi-arid mining areas in the middle and upper reaches of the yellow river basin: a case study of wuhai city, inner Mongolia autonomous region. Remote Sens. 15 (8), 2137. doi:10.3390/rs15082137
Liu, F., Zhang, G.-L., Song, X., Li, D., Zhao, Y., Yang, J., et al. (2020). High-resolution and three-dimensional mapping of soil texture of China. Geoderma 361, 114061. doi:10.1016/j.geoderma.2019.114061
Liu, Y., Wu, X., Wu, T., Zhao, L., Li, R., Li, W., et al. (2022). Soil texture and its relationship with environmental factors on the qinghai–tibet plateau. Remote Sens. 14 (Issue 15), 3797. doi:10.3390/rs14153797
Loiseau, T., Chen, S., Mulder, V. L., Román Dobarco, M., Richer-de-Forges, A. C., Lehmann, S., et al. (2019). Satellite data integration for soil clay content modelling at a national scale. Int. J. Appl. Earth Observation Geoinformation 82, 101905. doi:10.1016/j.jag.2019.101905
Lu, Y., Liu, F., Zhao, Y., Song, X., and Zhang, G. (2019). An integrated method of selecting environmental covariates for predictive soil depth mapping. J. Integr. Agric. 18 (2), 301–315. doi:10.1016/S2095-3119(18)61936-7
Ma, Y., Minasny, B., McBratney, A., Poggio, L., and Fajardo, M. (2021). Predicting soil properties in 3D: should depth be a covariate? Geoderma 383, 114794. doi:10.1016/j.geoderma.2020.114794
Ma, Y., Minasny, B., and Wu, C. (2017). Mapping key soil properties to support agricultural production in Eastern China. Geoderma Reg. 10, 144–153. doi:10.1016/j.geodrs.2017.06.002
Mallah, S., Delsouz Khaki, B., Davatgar, N., Scholten, T., Amirian-Chakan, A., Emadi, M., et al. (2022). Predicting soil textural classes using random forest models: learning from imbalanced dataset. Agronomy 12 (Issue 11), 2613. doi:10.3390/agronomy12112613
Mammadov, E., Nowosad, J., and Glaesser, C. (2021). Estimation and mapping of surface soil properties in the Caucasus Mountains, Azerbaijan using high-resolution remote sensing data. Geoderma Reg. 26, e00411. doi:10.1016/j.geodrs.2021.e00411
McBratney, A. B., Mendonça Santos, M. L., and Minasny, B. (2003). On digital soil mapping. Geoderma 117 (1), 3–52. doi:10.1016/S0016-7061(03)00223-4
Mehrabi-Gohari, E., Matinfar, H. R., Jafari, A., Taghizadeh-Mehrjardi, R., and Triantafilis, J. (2019). The spatial prediction of soil texture fractions in arid regions of Iran. Soil Syst. 3 (Issue 4), 65. doi:10.3390/soilsystems3040065
Mirzaeitalarposhti, R., Shafizadeh-Moghadam, H., Taghizadeh-Mehrjardi, R., and Demyan, M. S. (2022). Digital soil texture mapping and spatial transferability of machine learning models using sentinel-1, sentinel-2, and terrain-derived covariates. Remote Sens. 14 (Issue 23), 5909. doi:10.3390/rs14235909
Mondejar, J. P., and Tongco, A. F. (2019). Estimating topsoil texture fractions by digital soil mapping - a response to the long outdated soil map in the Philippines. Sustain. Environ. Res. 29 (1), 31. doi:10.1186/s42834-019-0032-5
Mousavi, A., Karimi, A., Maleki, S., Safari, T., and Taghizadeh-Mehrjardi, R. (2023). Digital mapping of selected soil properties using machine learning and geostatistical techniques in Mashhad plain, northeastern Iran. Environ. Earth Sci. 82 (9), 234. doi:10.1007/s12665-023-10919-x
Mzid, N., Castaldi, F., Tolomio, M., Pascucci, S., Casa, R., and Pignatti, S. (2022). Evaluation of agricultural bare soil properties retrieval from Landsat 8, sentinel-2 and PRISMA satellite data. Remote Sens. 14 (3), 714. doi:10.3390/rs14030714
Omuto, C. T., and Vargas, R. R. (2015). Re-tooling of regression kriging in R for improved digital mapping of soil properties. Geosciences J. 19 (1), 157–165. doi:10.1007/s12303-014-0023-9
Page, M. J., McKenzie, J. E., Bossuyt, P. M., Boutron, I., Hoffmann, T. C., Mulrow, C. D., et al. (2021). The PRISMA 2020 statement: an updated guideline for reporting systematic reviews. BMJ 372, n71. doi:10.1136/bmj.n71
Pan, B., Cai, S., Zhao, M., Cheng, H., Yu, H., Du, S., et al. (2023). Predicting the surface soil texture of cultivated land via hyperspectral remote sensing and machine learning: a case study in jianghuai hilly area. Appl. Sci. 13 (16), 9321. doi:10.3390/app13169321
Paul, S. S., Coops, N. C., Johnson, M. S., Krzic, M., Chandna, A., and Smukler, S. M. (2020). Mapping soil organic carbon and clay using remote sensing to predict soil workability for enhanced climate change adaptation. Geoderma 363, 114177. doi:10.1016/j.geoderma.2020.114177
Pavlů, L., Zádorová, T., Pavlů, J., Tejnecký, V., Drábek, O., Rojas, J. R., et al. (2023). Prediction of the distribution of soil properties in deep Colluvisols in different pedogeographic regions (Czech Republic) using diffuse reflectance infrared spectroscopy. Soil Tillage Res. 234, 105844. doi:10.1016/j.still.2023.105844
Piccoli, F., Barbato, M. P., Peracchi, M., and Napoletano, P. (2023). Estimation of soil characteristics from multispectral sentinel-3 imagery and DEM derivatives using machine learning. Sensors 23 (Issue 18), 7876. doi:10.3390/s23187876
Pittman, R., Hu, B., and Webster, K. (2021). Improvement of soil property mapping in the Great Clay Belt of northern Ontario using multi-source remotely sensed data. Geoderma 381, 114761. doi:10.1016/j.geoderma.2020.114761
Poggio, L., and Gimona, A. (2017a). 3D mapping of soil texture in Scotland. Geoderma Reg. 9, 5–16. doi:10.1016/j.geodrs.2016.11.003
Poggio, L., and Gimona, A. (2017b). Assimilation of optical and radar remote sensing data in 3D mapping of soil properties over large areas. Sci. Total Environ. 579, 1094–1110. doi:10.1016/j.scitotenv.2016.11.078
Pouladi, N., Gholizadeh, A., Khosravi, V., and Borůvka, L. (2023). Digital mapping of soil organic carbon using remote sensing data: a systematic review. CATENA 232, 107409. doi:10.1016/j.catena.2023.107409
Rengma, N. S., Yadav, M., Kalambukattu, J. G., and Kumar, S. (2023). Machine learning-based digital mapping of soil organic carbon and texture in the mid-Himalayan terrain. Environ. Monit. Assess. 195 (8), 994. doi:10.1007/s10661-023-11608-9
Salazar, D. F. U., Demattê, J. A. M., Vicente, L. E., Guimarães, C. C. B., Sayão, V. M., Cerri, C. E. P., et al. (2020). Emissivity of agricultural soil attributes in southeastern Brazil via terrestrial and satellite sensors. Geoderma 361, 114038. doi:10.1016/j.geoderma.2019.114038
Samuel-Rosa, A., Heuvelink, G. B. M., Vasques, G. M., and Anjos, L. H. C. (2015). Do more detailed environmental covariates deliver more accurate soil maps? Geoderma 243–244, 214–227. doi:10.1016/j.geoderma.2014.12.017
Sayão, V. M., and Demattê, J. A. M. (2018). Soil texture and organic carbon mapping using surface temperature and reflectance spectra in Southeast Brazil. Geoderma Reg. 14, e00174. doi:10.1016/j.geodrs.2018.e00174
Saygın, F., Aksoy, H., Alaboz, P., and Dengiz, O. (2023). Different approaches to estimating soil properties for digital soil map integrated with machine learning and remote sensing techniques in a sub-humid ecosystem. Environ. Monit. Assess. 195 (9), 1061. doi:10.1007/s10661-023-11681-0
Schreiner-McGraw, A. P., and Baffaut, C. (2023). Quantifying links between topsoil depth, plant water use, and yield in a rainfed maize field in the U. S. Midwest. Agric. Water Manag. 290, 108569. doi:10.1016/j.agwat.2023.108569
Shabou, M., Mougenot, B., Chabaane, Z. L., Walter, C., Boulet, G., Aissa, N. B., et al. (2015). Soil clay content mapping using a time series of Landsat TM data in semi-arid lands. Remote Sens. 7 (5), 6059–6078. doi:10.3390/rs70506059
Shahriari, M., Delbari, M., Afrasiab, P., and Pahlavan-Rad, M. R. (2019). Predicting regional spatial distribution of soil texture in floodplains using remote sensing data: a case of southeastern Iran. CATENA 182, 104149. doi:10.1016/j.catena.2019.104149
Sindayihebura, A., Ottoy, S., Dondeyne, S., Van Meirvenne, M., and Van Orshoven, J. (2017). Comparing digital soil mapping techniques for organic carbon and clay content: case study in Burundi’s central plateaus. CATENA 156, 161–175. doi:10.1016/j.catena.2017.04.003
Siqueira, R. G., Moquedace, C. M., Francelino, M. R., Schaefer, C. E. G. R., and Fernandes-Filho, E. I. (2023). Machine learning applied for Antarctic soil mapping: spatial prediction of soil texture for Maritime Antarctica and Northern Antarctic Peninsula. Geoderma 432, 116405. doi:10.1016/j.geoderma.2023.116405
Sishodia, R. P., Ray, R. L., and Singh, S. K. (2020). Applications of remote sensing in precision agriculture: a review. Remote Sens. 12 (Issue 19), 3136. doi:10.3390/rs12193136
Soltani, I., Fouad, Y., Michot, D., Bréger, P., Dubois, R., and Cudennec, C. (2019). A near infrared index to assess effects of soil texture and organic carbon content on soil water content. Eur. J. Soil Sci. 70 (1), 151–161. doi:10.1111/ejss.12725
Sorenson, P. T., Kiss, J., Bedard-Haughn, A. K., and Shirtliffe, S. (2022). Multi-horizon predictive soil mapping of historical soil properties using remote sensing imagery. Remote Sens. 14 (22), 5803. doi:10.3390/rs14225803
Swain, S. R., Chakraborty, P., Panigrahi, N., Vasava, H. B., Reddy, N. N., Roy, S., et al. (2021). Estimation of soil texture using Sentinel-2 multispectral imaging data: an ensemble modeling approach. Soil Tillage Res. 213, 105134. doi:10.1016/j.still.2021.105134
Taghizadeh-Mehrjardi, R., Emadi, M., Cherati, A., Heung, B., Mosavi, A., and Scholten, T. (2021). Bio-inspired hybridization of artificial neural networks: an application for mapping the spatial distribution of soil texture fractions. Remote Sens. 13 (5), 1025. doi:10.3390/rs13051025
Taghizadeh-Mehrjardi, R., Khademi, H., Khayamim, F., Zeraatpisheh, M., Heung, B., and Scholten, T. (2022). A comparison of model averaging techniques to predict the spatial distribution of soil properties. Remote Sens. 14 (Issue 3), 472. doi:10.3390/rs14030472
Tola, E., Al-Gaadi, K. A., Madugundu, R., Zeyada, A. M., Kayad, A. G., and Biradar, C. M. (2017). Characterization of spatial variability of soil physicochemical properties and its impact on Rhodes grass productivity. Saudi J. Biol. Sci. 24 (2), 421–429. doi:10.1016/j.sjbs.2016.04.013
Tziolas, N., Tsakiridis, N., Ben-Dor, E., Theocharis, J., and Zalidis, G. (2020). Employing a multi-input deep convolutional neural network to derive soil clay content from a synergy of multi-temporal optical and radar imagery data. Remote Sens. 12 (Issue 9), 1389. doi:10.3390/rs12091389
Vågen, T.-G., Winowiecki, L. A., Tondoh, J. E., Desta, L. T., and Gumbricht, T. (2016). Mapping of soil properties and land degradation risk in Africa using MODIS reflectance. Geoderma 263, 216–225. doi:10.1016/j.geoderma.2015.06.023
Vaudour, E., Gomez, C., Fouad, Y., and Lagacherie, P. (2019). Sentinel-2 image capacities to predict common topsoil properties of temperate and Mediterranean agroecosystems. Remote Sens. Environ. 223, 21–33. doi:10.1016/j.rse.2019.01.006
Viscarra Rossel, R. A., Behrens, T., Ben-Dor, E., Brown, D. J., Demattê, J. A. M., Shepherd, K. D., et al. (2016). A global spectral library to characterize the world’s soil. Earth-Science Rev. 155, 198–230. doi:10.1016/j.earscirev.2016.01.012
Wang, R., Wan, S., Chen, W., Qin, X., Zhang, G., and Wang, L. (2024). A novel finer soil strength mapping framework based on machine learning and remote sensing images. Comput. and Geosciences 182, 105479. doi:10.1016/j.cageo.2023.105479
Yuzugullu, O., Lorenz, F., Fröhlich, P., and Liebisch, F. (2020). Understanding fields by remote sensing: soil zoning and property mapping. Remote Sens. 12 (7), 1116. doi:10.3390/rs12071116
Zeraatpisheh, M., Ayoubi, S., Jafari, A., Tajik, S., and Finke, P. (2019). Digital mapping of soil properties using multiple machine learning in a semi-arid region, central Iran. Geoderma 338, 445–452. doi:10.1016/j.geoderma.2018.09.006
Zhang, G., Liu, F., and Song, X. (2017). Recent progress and future prospect of digital soil mapping: a review. J. Integr. Agric. 16 (12), 2871–2885. doi:10.1016/S2095-3119(17)61762-3
Zhang, M., and Shi, W. (2019). Systematic comparison of five machine-learning methods in classification and interpolation of soil particle size fractions using different transformed data. Hydrology Earth Syst. Sci. Discuss. 2019, 1–39. doi:10.5194/hess-2018-584
Zhang, Y., Hartemink, A. E., Huang, J., and Townsend, P. A. (2021). Synergistic use of hyperspectral imagery, Sentinel-1 and LiDAR improves mapping of soil physical and geochemical properties at the farm-scale. Eur. J. Soil Sci. 72 (4), 1690–1717. doi:10.1111/ejss.13086
Zheng, M., Wang, X., Li, S., Zhu, B., Hou, J., and Song, K. (2023). Soil texture mapping in songnen plain of China using sentinel-2 imagery. Remote Sens. 15 (Issue 22), 5351. doi:10.3390/rs15225351
Zhou, W., Li, C., Zhao, W., Stringer, L. C., and Fu, B. (2024). Spatial distributions of soil nutrients affected by land use, topography and their interactions, in the Loess Plateau of China. Int. Soil Water Conservation Res. 12 (1), 227–239. doi:10.1016/j.iswcr.2023.02.005
Zhou, Y., Wu, W., and Liu, H. (2022). Exploring the influencing factors in identifying soil texture classes using multitemporal landsat-8 and sentinel-2 data. Remote Sens. 14 (Issue 21), 5571. doi:10.3390/rs14215571
Keywords: digital soil mapping, environmental covariates, machine learning, satellite images, spatial prediction
Citation: Mgohele RN, Massawe BHJ, Shitindi MJ, Sanga HG and Omar MM (2024) Prediction of soil texture using remote sensing data. A systematic review. Front. Remote Sens. 5:1461537. doi: 10.3389/frsen.2024.1461537
Received: 08 July 2024; Accepted: 12 September 2024;
Published: 23 September 2024.
Edited by:
Zenghui Zhang, Shanghai Jiao Tong University, ChinaReviewed by:
Weitao Chen, China University of Geosciences Wuhan, ChinaSongchao Chen, ZJU-Hangzhou Global Scientific and Technological Innovation Center, China
Copyright © 2024 Mgohele, Massawe, Shitindi, Sanga and Omar. This is an open-access article distributed under the terms of the Creative Commons Attribution License (CC BY). The use, distribution or reproduction in other forums is permitted, provided the original author(s) and the copyright owner(s) are credited and that the original publication in this journal is cited, in accordance with accepted academic practice. No use, distribution or reproduction is permitted which does not comply with these terms.
*Correspondence: R. N. Mgohele, cm1nb2hlbGVAZ21haWwuY29t