
95% of researchers rate our articles as excellent or good
Learn more about the work of our research integrity team to safeguard the quality of each article we publish.
Find out more
ORIGINAL RESEARCH article
Front. Remote Sens. , 15 August 2024
Sec. Acoustic Remote Sensing
Volume 5 - 2024 | https://doi.org/10.3389/frsen.2024.1429227
This article is part of the Research Topic Detection and Characterization of Unidentified Underwater Biological Sounds, Their Spatiotemporal Patterns and Possible Sources. View all 10 articles
 Allison E. Noble1,2,3
 Frants H. Jensen4,5,6
 Sierra D. Jarriel4
 Nadege Aoki4
 Sophie R. Ferguson4,7,8
 Matthew D. Hyer6,9
 Amy Apprill10
 T. Aran Mooney4*
Coral reefs are biodiverse marine ecosystems that are undergoing rapid changes, making monitoring vital as we seek to manage and mitigate stressors. Healthy reef soundscapes are rich with sounds, enabling passive acoustic recording and soundscape analyses to emerge as cost-effective, long-term methods for monitoring reef communities. Yet most biological reef sounds have not been identified or described, limiting the effectiveness of acoustic monitoring for diversity assessments. Machine learning offers a solution to scale such analyses but has yet to be successfully applied to characterize the diversity of reef fish sounds. Here we sought to characterize and categorize coral reef fish sounds using unsupervised machine learning methods. Pulsed fish and invertebrate sounds from 480 min of data sampled across 10 days over a 2-month period on a US Virgin Islands reef were manually identified and extracted, then grouped into acoustically similar clusters using unsupervised clustering based on acoustic features. The defining characteristics of these clusters were described and compared to determine the extent of acoustic diversity detected on these reefs. Approximately 55 distinct calls were identified, ranging in centroid frequency from 50 Hz to 1,300 Hz. Within this range, two main sub-bands containing multiple signal types were identified from 100 Hz to 400 Hz and 300 Hz–700 Hz, with a variety of signals outside these two main bands. These methods may be used to seek out acoustic diversity across additional marine habitats. The signals described here, though taken from a limited dataset, speak to the diversity of sounds produced on coral reefs and suggest that there might be more acoustic niche differentiation within soniferous fish communities than has been previously recognized.
Despite occupying only 0.2% of the ocean’s surface area, coral reefs are home to an estimated 35% of all known marine species, with countless yet to be discovered (Reaka-Kudla, 1997; Fisher et al., 2015). Like many marine ecosystems, coral reefs face an array of impending threats from human generated stressors (Cohen and Holcomb, 2009; Andersson and Gledhill, 2013), which cause bleaching events, disease outbreaks, and physical damage that fundamentally alter the structures of reef communities (Aeby and Santavy, 2006; Zaneveld et al., 2016; Hughes et al., 2017). The loss of hard corals and coral-associated biodiversity demands new and diverse solutions (Apprill et al., 2023).
Effective monitoring is crucial for detecting changes in ecosystem processes and biodiversity (Bellwood et al., 2004). Many current methods of monitoring biodiversity in marine systems, such as in situ surveys and video recordings (Caldwell et al., 2016; Facon et al., 2016) are predominantly visual, which comes with limitations; they are often restricted by light availability and can be time-consuming, personnel-intensive, and the surveys themselves can influence detection of certain species (Hill and Wilkinson, 2004).
Passive acoustic monitoring, in which wildlife and environments are observed using sound recorders, can be a valuable complement to these methods (Browning et al., 2017; Staaterman et al., 2017; Mooney et al., 2020). Acoustic monitoring is well-suited for the marine environment due to the rapid and efficient transmission of sound underwater; the large range of vital ecological processes that occur at night or in light-limited environments; the many behaviors that are associated with sound; and the presence of visually cryptic but soniferous species (Mann and Lobel, 1995; Lammers et al., 2008). Acoustic monitoring also provides continuous or near-continuous monitoring that is impossible to obtain with visual surveys.
Community-based acoustic assessments are increasingly sought to be applied to coral reef ecosystems, enabled by the presence and diversity of soniferous reef organisms. Reef associated animals produce sound for a range of biological purposes, including courtship and reproduction, aggression, territory defense (Myrberg 1997; Parmentier et al., 2010; Tricas and Boyle, 2014), and also incidentally as part of some behaviors (e.g., during feeding and swimming) (Tricas and Boyle, 2021; Lillis et al., 2023). Activity and corresponding bioacoustic cues fluctuate on daily (Staaterman et al., 2014; Kaplan et al., 2015), celestial (Staaterman et al., 2014; Parsons et al., 2016) and seasonal scales (Kaplan et al., 2018). These calls may overlap in time and frequency and it has been proposed that animals may utilize different frequency bands and times of day to reduce acoustic competition (Hastings and Širović, 2015). This is a form of niche differentiation, a well-studied phenomenon in some habitats and for some taxa such as bats (Siemers and Schnitzler, 2004) and birds (Luther, 2009), but somewhat less understood on coral reefs.
One challenge to utilizing this acoustic diversity for biological assessments is our limited ability to discriminate and characterize the range of fish and marine invertebrate sounds. While the frequency bands of some taxa have been identified - fish frequently vocalize in the 50–1,500 Hz range and snapping shrimp produce acoustic energy predominantly above 2 kHz (Kaplan et al., 2018; Lyon et al., 2019) - distinct calls have largely not been isolated, with the exception of some very common or soniferous species. To date, coral reef fishes and invertebrate species with identified and archived acoustic signals make up only a small fraction of the thousands of species documented in these ecosystems (Parravicini et al., 2013; Milne and Griffiths, 2014; Looby et al., 2022). To circumvent this limitation, existing studies of acoustic activity on reefs have frequently examined the soundscape as a whole, aiming to associate soundscape parameters with community assemblages (e.g., Staaterman et al., 2014; Staaterman et al., 2017; Kaplan et al., 2015; Kaplan et al., 2018).
Given the apparent abundance and richness of unknown biological sounds, there is increasing emphasis to develop methods which can extract information from the patterns and diversity from the biological sounds themselves (Radford et al., 2010; Radford et al., 2014; Akamatsu et al., 2018; Lamont et al., 2022). Machine learning offers a solution to scale such analyses, but has not been extensively applied to coral reefs on an ecosystem level to characterize the diversity biological sounds (Barroso et al., 2023). Progressive leaps in automated detection and classification have been achieved in terrestrial soundscapes (Seth et al., 2018; Wu et al., 2023) and with marine mammal vocalizations (Thomas et al., 2020; Duan et al., 2022), but lag behind when it comes to complex, acoustically active marine environments, like coral reefs. Other automated clustering methods have been proposed, but currently they only separate 3-4 broader groups of sounds from a soundscape (Lin et al., 2021; Ozanich et al., 2021; Mahale et al., 2023), or are limited to classification within a species or family (Chérubin et al., 2020; Ibrahim et al., 2020). There is a clear need for automated methods to more precisely differentiate and characterize these diverse individual reef sounds. Detailed descriptions of biological sounds will be critical to eventually link community-level soundscapes to assemblages of organisms on coral reefs.
Here, we leverage an ongoing study addressing reef soundscapes to examine the fine-scale composition of biotic sound types on a coral reef in the US Virgin Islands. Individual sounds were identified manually across 10 days of data. Extracted sounds were then clustered based on acoustic characteristics to identify distinct signal types or sound motifs to demonstrate the acoustic diversity in these soundscapes. We then test whether these sound motifs show evidence of acoustic niche differentiation in the spectral and temporal domains.
Sound recordings were collected from Tektite reef in the U.S. Virgin Islands National Park as part of a long-term acoustic monitoring program. The soundscape was recorded using single-channel acoustic recording units (SoundTrap ST300 STD: Ocean Instruments, Auckland, NZ; sensitivity −172.6 dB re 1 μPa/V) with an integrated hydrophone (sample rate: 48 kHz; linear frequency response [ ± 3 dB] 20 Hz to 20 kHz) deployed 0.5 m above the bottom at a depth of 11 m. Tektite reef was selected as the focal site based on the availability of long-term survey data and previous acoustic analysis (Edmunds, 2013; Kaplan et al., 2015; Figure 1) and its relatively healthy condition. This reef consists of a sloping reef face largely dominated by Orbicella annularis but hosts a range of coral species and has a comparatively high degree of coral cover, fish density, and crepuscular sound pressure levels in the low-frequency fish band compared to nearby reefs (Edmunds, 2013; Kaplan et al., 2015; Jarriel et al., 2024; Figure 1).
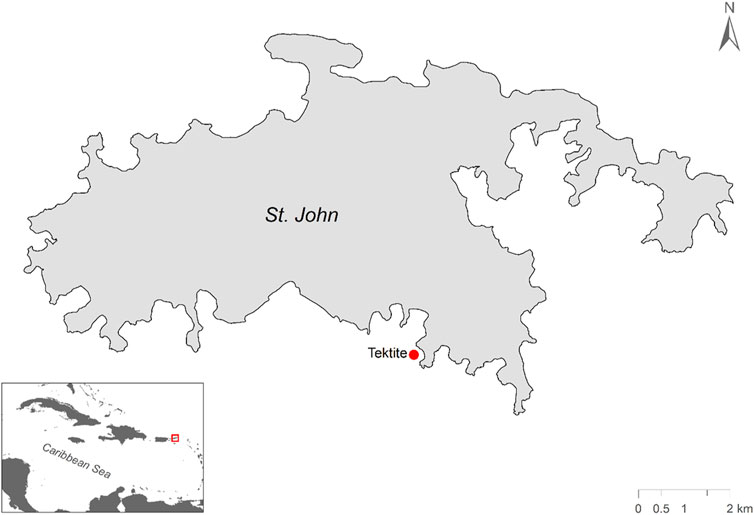
Figure 1. Map of study site on the south side of St. John, US Virgin Islands. Tektite reef is marked with a red dot.
All signal identification and extraction from audio recordings was performed using custom-written sound labelling software in Matlab R2020a (Mathworks, Natick, United States). For the purpose of these analyses, and due to the richness of the soundscape, the acoustic signals were extracted from 10 days of audio recordings, with 1 day of recordings per week over a 6-week period, spanning two and a half lunar cycles in April, May, and June of 2017. For efficiency, only 1 min of recording every 30 min was audited for calls, providing a total of 480 recordings over the 10 days of analyses. The visualization software down-sampled raw audio to 4 kHz to focus on low frequency fish and invertebrates, then plotted spectrograms (128 sample Hamming window, 75% overlap, 512-pt FFT size) and graphs of instantaneous relative sound intensity over time (Figure 2). Each spectrogram was assessed for distinct calls at a temporal resolution of 5 or 10 s depending on the density of calls in each file by trained analysts. Signals were visually identified for further analysis if they stood out above noise floor in the spectrogram, a clear beginning and end could be identified, and if, extrapolating from existing bioacoustic literature and identification, signals appeared biological. Proposed fish and invertebrate signals were then labelled as “pulsed” or “tonal” signals with bounding boxes delimiting start and end time and approximate minimum and maximum frequency (Figure 2). Periods in each recording that contained excessive boat noise were labelled as “vessel noise” and removed from analysis (without replacement), as the noise obscured biological signals. After this filtering removed 58 min of data, approximately 422 min of hand annotated sound remained.
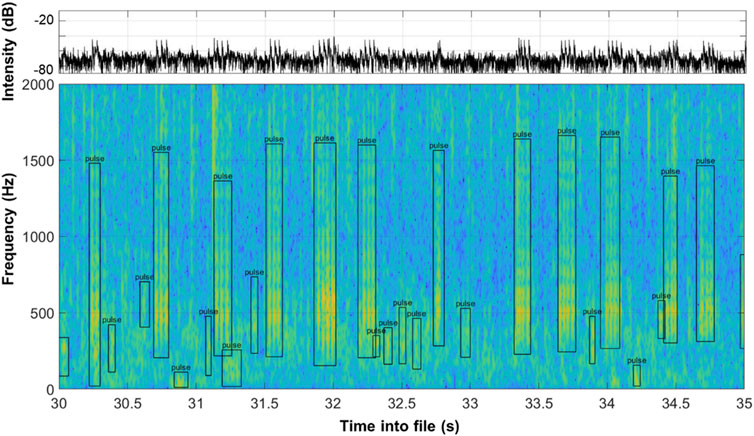
Figure 2. Identification of acoustic signals in a 5 s spectrogram (128 pt, 32 ms Hamming window, 75% overlap, 1,024 pt FFT). Bounding boxes delineate approximate time span and frequency range of each identified signal. The abundance and diversity of signals typical at this site are clear in just a 5-s view.
The time-frequency bounding boxes were used to read in each signal sequentially and extract a range of acoustic features. Each signal was down-sampled to 6,000 Hz to ensure the Nyquist sample rate was higher than the highest frequency of interest (1.5x higher than the maximum frequency in the data labelling software) and filtered with an 8-pole bandpass filter with −3 dB cutoff points given by the manual frequency limits (bounding box limits) before feature extraction. The peak signal-to-noise ratio (PSNR) was calculated as the band-limited peak sound intensity level within the signal compared to the lowest band-limited RMS level within a 0.2 s noise window either preceding or following the signal to decrease risk of having another biological signal within the noise measurement window. A peak detection algorithm (findpeaks function in Matlab, −6 dB threshold) extracted interpulse intervals (IPI) and pulse widths (PW) based on instantaneous sound intensity smoothed over a 4-ms window and normalized relative to the peak intensity within the signal. The signal duration was defined as the difference between the first time and the last time the smoothed intensity crossed the −10 dB point, and the −6 dB duty cycle was estimated as the fraction of that time that the sound intensity was within 6 dB of the peak sound intensity. An average power spectrum was then calculated using Welch’s method using 128-sample windows with 50% overlap, and with an interpolated FFT size of 1,024 points for power spectrum estimation. Standard spectral features were calculated (following Madsen and Wahlberg, 2007; Jensen et al., 2009) and defined as follows: the frequency containing the highest power was defined as the peak frequency (Fp). The frequency separating the power spectrum in two-halves with equal energy was defined as the centroid frequency (Fc). The first and last frequency value containing > −10 dB power were defined as the minimum (Fmin) and maximum (Fmax) frequency, and the intervening range was defined as the −10 dB bandwidth (BW10dB) and used in addition to the RMS bandwidth (BWrms). Comparisons were made between centroid frequencies of neighboring clusters using student’s t-tests with Bonferonni corrections.
For this initial examination of the diversity of pulsed call types on a coral reef, only signals with an PSNR of >12 dB and consisting of more than two detected pulses were considered, since some acoustic features (i.e., interpulse interval) relied on detecting multiple peaks within signal. Single and double transient pulses were ignored, as were longer narrowband (tonal) signals that were more sparse and would require different feature selection or alternative latent space embeddings based on pre-trained deep learning models.
Unsupervised feature-based clustering was conducted based on 7 parameters. Temporal parameters (signal duration, peak width, and interpulse interval) and spectral parameters (centroid frequency, RMS bandwidth and −10 dB bandwidth) were log-transformed prior to clustering, while duty cycle was used without transformation. Uniform manifold approximation and projection (UMAP) was then implemented as a non-linear method to reduce dimensionality of the acoustic feature vector to a 2D space (McInnes et al., 2018); after which a Density-Based Spatial Clustering of Applications with Noise (DBSCAN: Ester et al., 1996) was applied to estimate cluster identities. Both dimensionality reduction and clustering was conducted using a Matlab implementation (Meehan et al., 2020) with 25 nearest neighbors, 500 epochs, 0.1 minimum distance, and very high cluster detail.
Since non-linear clustering techniques have not seen much use in coral reef acoustics and many extracted calls were relatively low amplitude, each cluster was manually validated to remove signals with excessive background noise and assess similarities between clusters. Removal of noisy signals and signals that did not fit with the cluster archetype allowed us to reduce potential over-clustering from the UMAP-DBSCAN clustering method and clearly define cluster archetypes.
We used a principal components analysis (PCA) to compare the validated clusters and determine which features were most critical in forming the final clusters. We then compared the average centroid frequencies of the signals of each cluster to assess frequency differences between sound motifs. To minimize unnecessary statistical comparisons that would elevate the probability of Type 1 errors, clusters were first sorted by mean centroid frequency. Student’s t-tests were then conducted to test for differences between each adjacent pair of clusters, and Bonferroni’s correction for multiple tests (n = 54) was applied to the resulting p-values. Finally, we conducted a linear regression of bandwidth against centroid frequency to assess how these parameters correlated.
We examined differences in temporal occurrence within two frequency groups composed of many different cluster types using a probability density function (PDF). To do this, the time of each vocalization was taken as the start time of the 1-minute source file, ignoring date. The start time was converted to local time by subtracting a 4-hour time difference relative to UTC time. Start times for all calls within each cluster were aggregated, and a probability density function estimated using the ksdensity function in Matlab with a 1-hour Gaussian kernel. To avoid edge of centroid frequency to bandwidth 0–24 h range, data was copied with a +24 and a −24 h offset (Hall and Wehrly, 1991).
A total of 55,740 individual signals were extracted from the audited recordings. Many of these signals had low SNR values and to limit noise influencing analyses, signals that had a PSNR less than 12 dB, or a duration longer than 3 s, were discarded from further analysis in post-processing. From the remaining 29,221 signals, 58 distinct clusters were identified through the original UMAP dimension reduction and DBSCAN clustering process (Figure 3A). Average silhouette score across all clusters was 0.31, suggesting a fair clustering but with significant need for verifying clusters. After validation, three clusters were found to be composites of multiple repeated signals marked within a single bounding box, and these clusters were removed, leaving 55 clusters of stereotyped sound motifs. Within the retained signals, principal component analysis revealed 7 principal component axes that accounted for 99.9% of the variation of acoustic characteristics in the data set (Table 1). The first two principal components, which explained almost 75% of the data variation, were driven by all measured frequency and bandwidth metrics, respectively (Table 1; Figure 3B).
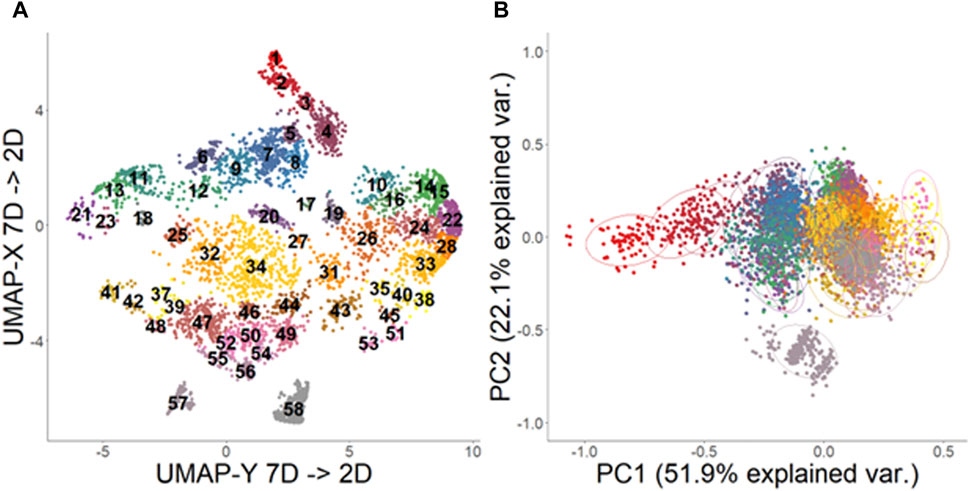
Figure 3. Uniform Manifold Approximation projection (A) and Principal Component Analysis (B) analysis of call types extracted from recordings from the US Virgin Islands. Cluster IDs are labelled on (A) and are represented by color. All acoustic feature data was log-transformed prior to PCA analysis. Ellipses on (B) represent 68% confidence interval of core region of each group.
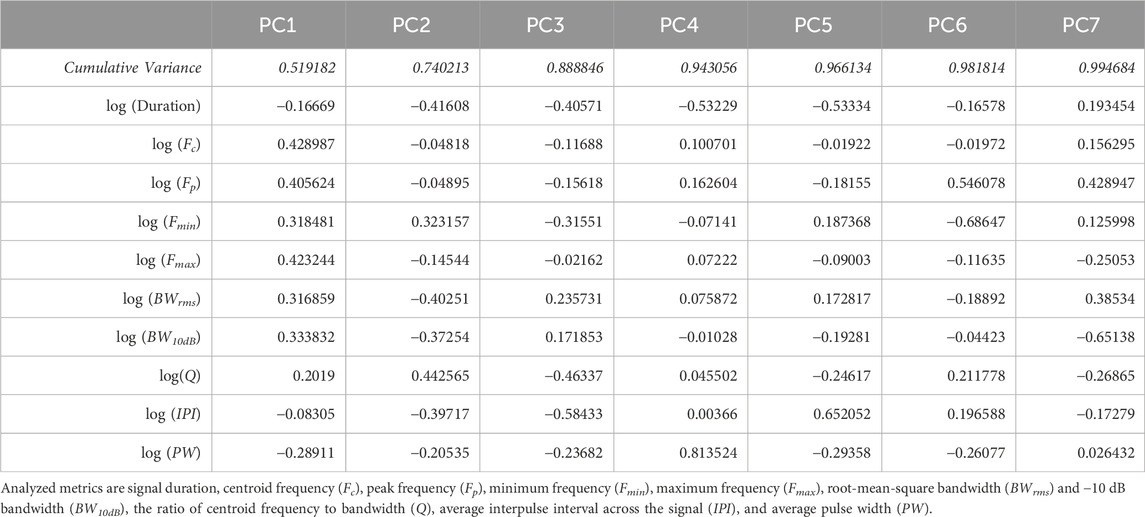
Table 1. PCA table for first 7 primary components used in dimension reduction of recorded acoustic signals. All data was log-transformed prior to analysis.
Some signals displayed characteristics not typical of fish vocalizations. Cluster 57, in particular, did not display the same type of pulsing or distribution of frequencies as other signals, and may not be biological in origin (Figure 5).
There was significant overlap of the acoustic characteristics observed for some clusters (Figure 3B). Principal component analyses coupled with visual inspections of the UMAP results and representative spectrograms from each cluster helped to reveal similarities among the clusters (Figure 4). For example, clusters 7, 8, and 9, which were all low frequency signals (∼100–500 Hz) with many pulses spaced closely together, were continuously located on the UMAP plot, overlapped on the PCA plot, and had visually similar spectrograms. The same concepts applied for many of the clusters which had low pulse counts (∼3) and frequencies between 300 and 700 Hz (e.g., 10, 15, 16, 24, 26, 28, 35), as well as those with typically 4-5 pulses and frequencies between 300 and 900 Hz (e.g., 32, 34, 44, 46, 49, 50, 54, etc.).
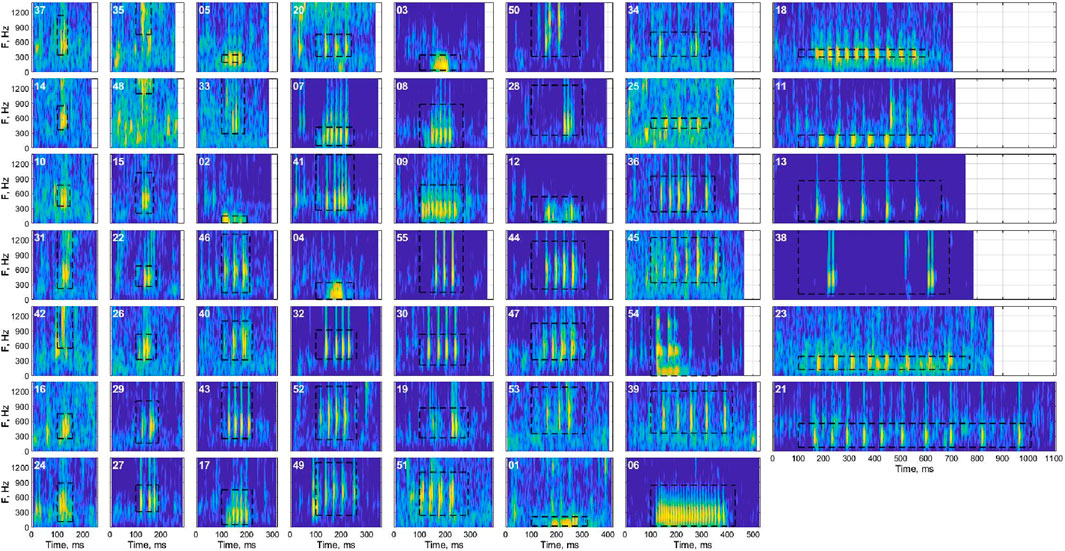
Figure 4. Representative spectrograms (sound energy as a function of time and frequency) of each cluster after validation, showing the time-frequency characteristics of the exemplar within each cluster with the highest signal-to-noise ratio. Black bounding boxes represent the manual annotations for the example signal. Spectrograms are sorted by duration from top to bottom of each column.
Based on the UMAP-assisted and validated clustering of call types, we observed some evidence of acoustic frequency differentiation between different call types. The normalized power spectra for each cluster show several distinct bands of frequencies within the 100–1,500 Hz range of fish calls (Figure 5). These clusters had distinct center and peak frequencies, often differing significantly (Figure 6; Table 2; student’s t-tests with Bonferonni corrections). Bandwidths changed with call types accordingly, and IPI varied with cluster type as well. While very few calls had substantial acoustic power below 100 Hz, there was a large frequency group with calls in the 100–400 Hz range. Another large frequency group emerged with calls that occupied a range from approximately 300 Hz–600 or 700 Hz. The final band was much broader, occupying a range of approximately 400–1,500 Hz. Mean −10 dB bandwidths within clusters were also positively correlated with centroid frequencies (linear regression, t1, 53 = 9.58, p < 0.001, R2 = 0.6339).
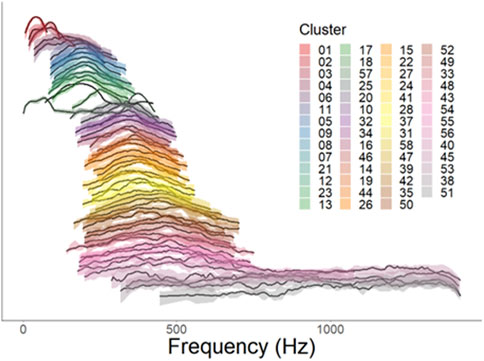
Figure 5. Normalized power spectra for each validated cluster. Individual lines represent distribution of average relative acoustic power (dB) by frequency, with 0 dB as the maximum value and −10 dB as the minimum value. Clusters are arranged in order of increasing centroid frequency Solid line represents the median normalized power as a function of frequency for each cluster, while shaded areas represent the 25th-75th percentiles of normalized power. Color patterns are consistent with those in Figure 3.
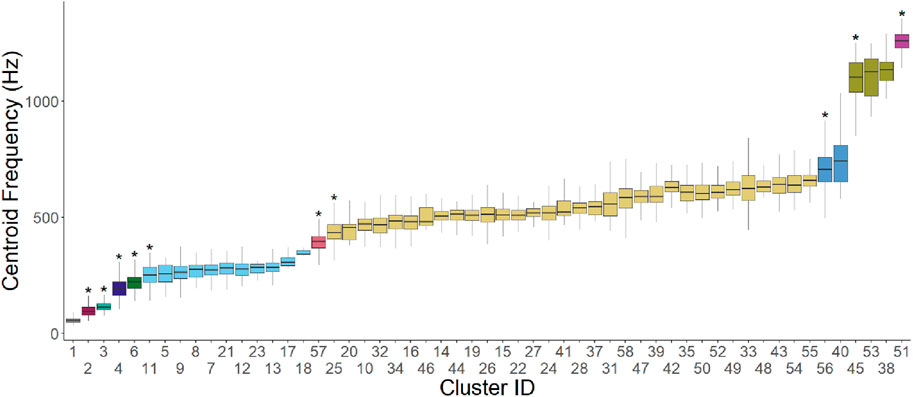
Figure 6. Median, 25th percentile and 75th percentile centroid frequency for each signal cluster, with clusters sorted by ascending median centroid frequency. Asterisks represent a significant (p < 0.05) increase in central frequency compared to the preceding cluster, based on a Student’s t-test with Bonferroni correction for 57 tests. Color represents groups of clusters where there is no significant increase in central frequency.
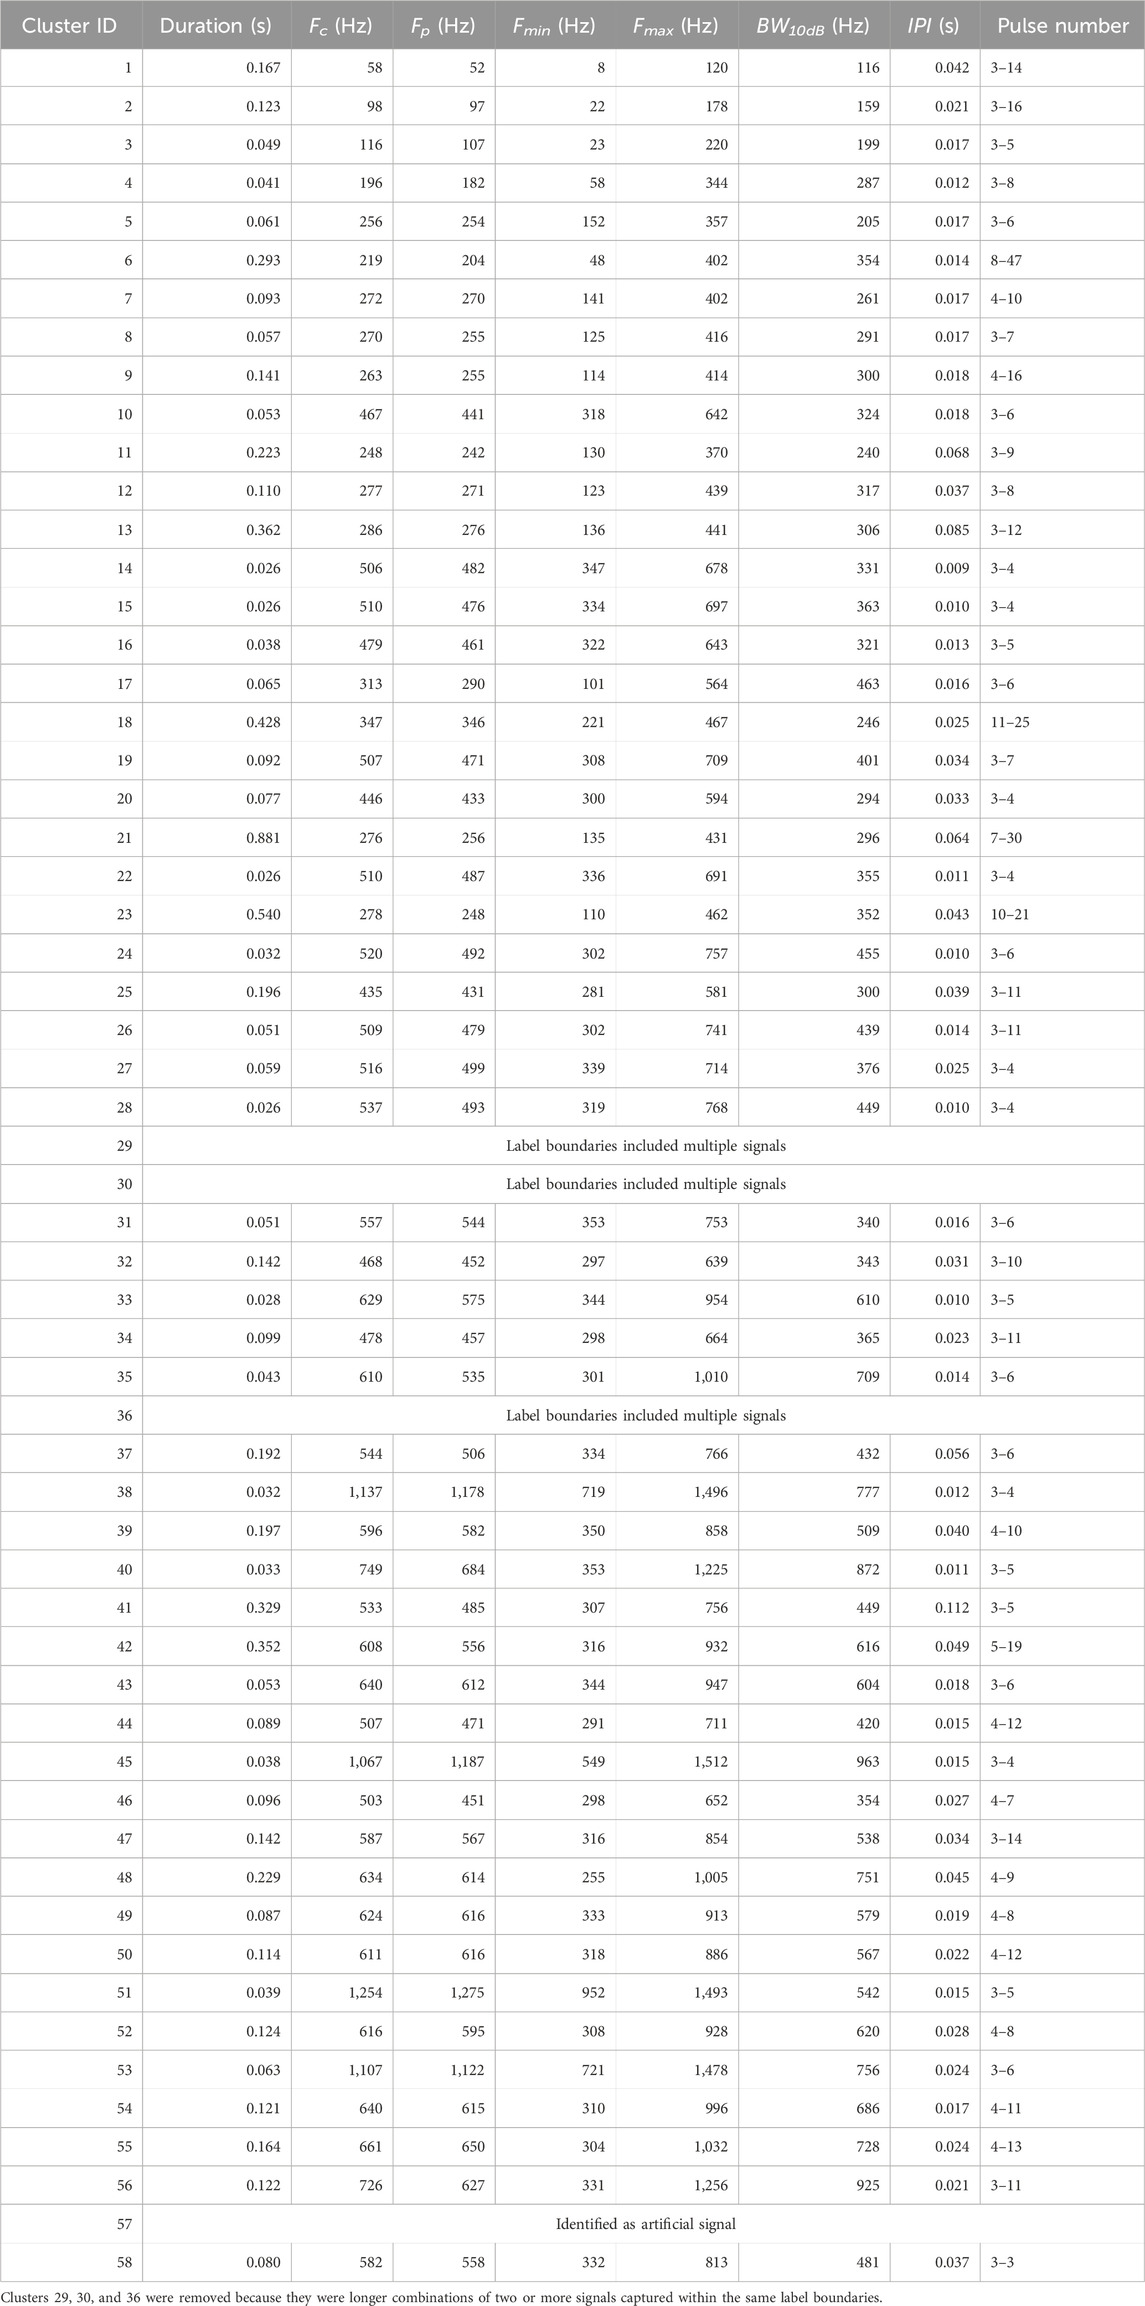
Table 2. Averaged duration, centroid frequency (Fc), peak frequency (Fp), minimum frequency (Fmin), maximum frequency (Fmax), bandwidth above −10 dB (BW10dB), and interpulse interval (IPI), and range of number of pulses for each validated signal cluster.
Direct comparisons of central frequencies between adjacent clusters supported this assessment of frequency differentiation (Figure 6). Eleven distinct groups of frequencies emerged, including two primary frequency groups. The groups were numbered in order of increasing average frequency. The largest group, Group 6, which aligned with the clusters found in the 300–700 Hz range, increased slightly throughout its range but still demonstrated substantial overlap between the frequencies of the lowest and highest cluster. The second largest group, Group 8, aligned with the clusters in the 100–400 Hz range. Smaller groups of similar centroid frequencies were located at the low and high ends of the central frequency range.
The preliminary analysis of temporal variation indicated potential temporal niches among clusters within the large frequency groups as well (Figure 7). In the largest frequency group (Group 8), each cluster of calls was emitted at a different time of day, including a few with distinct spikes at dawn, dusk, and mid-afternoon (Figure 7C). Some of the smaller groups (Groups 9, 10) were similarly variable over time but lacked sufficient sample size to draw conclusions. In contrast, calls in the second-largest frequency group (Group 6) were consistently emitted at night, with little difference among clusters (Figure 7B). The remaining groups consisted of one cluster each and therefore could not be analyzed for temporal differences between clusters.
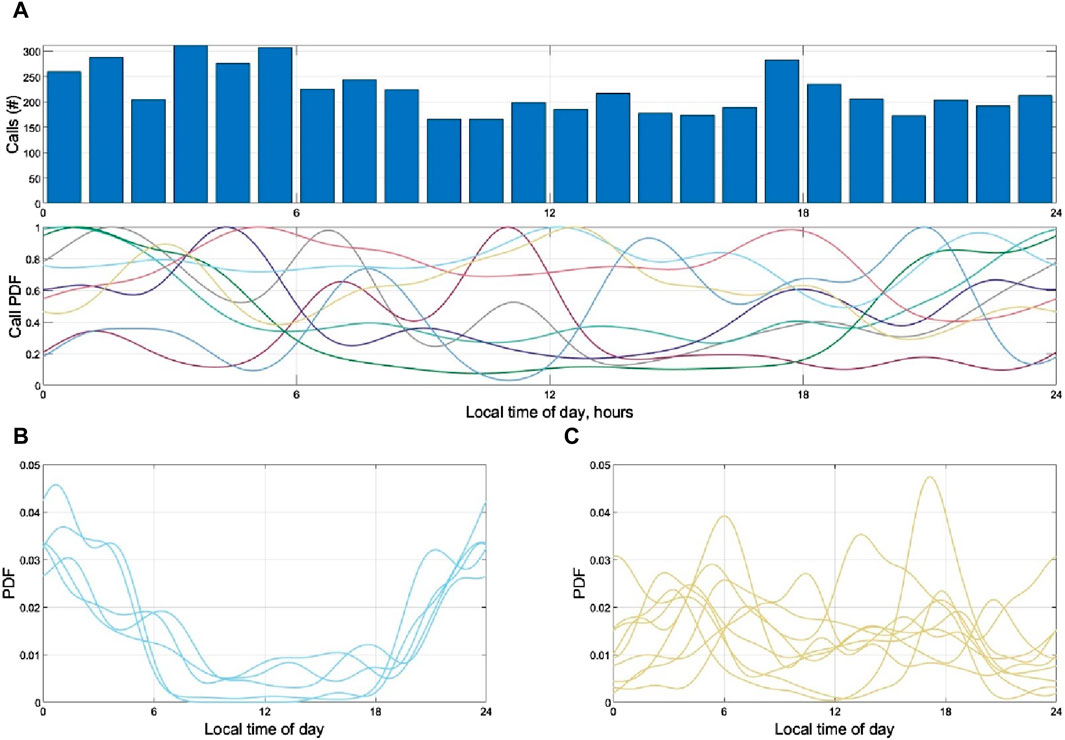
Figure 7. (A) Total calls in hourly bin by local time of day, along with estimated probability density function (PDF: 1-h Gaussian kernel) for each frequency group. Variation in peak number 589 of calls (y-axis) at different times of day (y-axis) are apparent between groups. (B) Call prevalence (PDF) as a function of time of day for each cluster that is part of frequency group 6 (centroid frequencies from 100 to 400 Hz). (C) Call prevalence (PDF) as a function of time of day for each cluster that is part of frequency group 8 (centroid frequencies from 400 to 700 Hz). Within these groups, some call types remained consistent in their temporal use of the acoustic domain (B), in this case showing nighttime increases, while others were highly variable throughout the 8 study days (C). Dawn and dusk were approximately at 6 and 18 h in these plots.
Coral reefs have complex biological soundscapes but the individual call components are rarely categorized. Here we investigated the individual biotic (presumed to be largely fish, but also invertebrate) sound motifs contributing to a coral reef soundscape in an effort to understand the variability and potential acoustic niche differentiation in these biodiverse marine ecosystems. We focused on pulsed calls consisting of 2 or more pulses in short sequence. These calls are typically short, low-intensity sounds (Mann and Lobel, 1997; Ferguson et al., 2022) and consequently may be overlooked when calculating soundscape-level ecoacoustic indices such as overall sound pressure level or the Acoustic Complexity Index (Dimoff et al., 2021; Jarriel et al., 2024).
We found substantial acoustic diversity in the pulsed call types within this coral reef ecosystem, with call types covering the full frequency range that was analyzed, and showing potential evidence of spectral and temporal niche differentiation. Across our subsampled portion of 10 days of recordings, fifty-five different signal types were detected among the multi-pulsed calls, capturing stereotyped differences in peak frequency, central frequency, and bandwidth. The magnitude of variation between signal types varied, with strong divergence between some groups (e.g., 6, 54, 55), but only slight differentiation between other call types (e.g., clusters 7, 8, and 9). Notably, these call types were identified without visual observations of the signaler (e.g., Tricas and Boyle, 2014) thus it is impossible to discern they were produced by distinct species. However, via UMAP analyses, clusters parsed to distinct call types. Of course, cluster neighbors, when aligned by centroid frequency for illustration purposes (Figures 5, 6), showed a gradient between some neighbors that could indicate variation as minor as the size of the organism making the sound (Lobel and Mann, 1995; Tellechea et al., 2010; Parmentier and Fine, 2016; Balebail and Sisneros, 2022). Indeed, t-tests showed some similarity between clusters, but these tests were only comparing neighbors. Thus clusters that appear to have been grouped similarity, such as 25 and 54, had centroid frequencies differed by ca. 200 Hz. Such differences were often statistically different if compared directly (e.g., 11 vs. 6 were both significantly different and separated by ca. 30 Hz). Considering that the calls explored here only encompass 10 days across a few months within the same year and do not include tonal or single-pulse calls, the observed call diversity alludes to the vast biodiversity of coral reefs and the potential for proportionally high acoustic diversity. This finding underscores the potential utility of passive acoustics in documenting and monitoring the substantial biodiversity within a coral reef.
Tektite reef, the location of this study, is known to be an acoustically active reef, with high fish abundance and coral cover compared to nearby reefs (Kaplan et al., 2015; Jarriel et al., 2024). Unsupervised clustering of coral reef sounds is a promising tool for understanding and quantifying call diversity as a proxy for fish and invertebrate biodiversity. The ability to quantify and compare biodiversity of soniferous animals on coral reefs, even without knowing their identity, would significantly advance passive acoustic monitoring for effective coral reef management.
Acoustic analyses have often utilized the energy produced in the 50–1,500 Hz range as a proxy for fish abundance (Kaplan et al., 2015; Lyon et al., 2019). The calls described here demonstrate that on a Caribbean reef there are distinct subgroups that occupy different frequency bands within this broader range. The most notable subdivisions of the previously recognized “fish band” were the bands of 100–400 Hz and 300–700 Hz, which contained most of the identified clusters. However, other call types occupied frequencies both below and above these two dominant bands. Therefore, while the previously established band can certainly still serve as a method for detecting fish sounds at large, there is finer differentiation of individual calls that may serve important ecological functions. Determining and better understanding frequency bands of high sonic activity for different regions may assist in more effective monitoring.
The separation of frequencies described above may promote effective communication by stratifying the total frequency range, enabling individuals to better identify conspecifics and communicate concurrently with other species. Similar phenomena have been observed in the echolocation signals of different species of bats occupying the same territory (Siemers and Schnitzler, 2004), as well as in both insects and mammals native to the rainforest, an acoustically dense environment (Schneider et al., 2008; Schmidt et al., 2013), although these niches are often spread across a broader frequency band. In fish communities, on which far less work has been done, it has been suggested that acoustic niche partitioning is more prominent at night, when visual cues are reduced and overall acoustic activity tends to increase (Ruppé et al., 2015; Bertucci et al., 2020). On a seasonal scale, related species are predicted to partition frequency bands based on overlapping spawning seasons in order to reduce signaling confusion (Luczkovich and Sprague, 2011).
The observation of spectral and temporal niches of coral reef fishes opens the door for further inquiry into the communication strategies of reef animals. Increased bandwidth of higher frequency signals and temporal partitioning are other reported strategies in the animal kingdom for avoiding acoustic interference (Romer and Lewald, 1992; Bertucci et al., 2020). We observed a positive correlation between bandwidth and central frequency, lending support to the hypothesis that fish may also employ this first strategy. With the reduced frequency range available to most fish, temporal partitioning, such as was observed here, may be even more valuable for effective communication and to avoid acoustic masking. Similar partitioning has been observed in other reef environments (Bertucci et al., 2020).
In addition to ecological applications, the methodology outlined here can be expanded upon to become more comprehensive and generalizable for coral reef fish calls and other marine habitats such as estuaries, mangroves, and the deep sea (Lin et al., 2019; Mueller et al., 2020). The next steps in improving this dataset and applying techniques to other datasets should consist of expansion to include single-pulse and tonal calls, i.e., identify meaningful acoustic features that can capture diversity in these types of calls and increase size of the dataset by feeding in more acoustic detections from the same site and nearby sites. Increasing the number and diversity of calls within each cluster will not only make the model more generalizable to similar sites, but also begin to build toward the large training sets required by artificial intelligence (AI). Databases can facilitate the curation and categorization of these large sets of unknown sounds to build AI detectors (Parsons et al., 2022), as new methods emerge to identify them (Mouy et al., 2018; Jensen et al., 2020). Such detectors will be invaluable to enhancing monitoring efforts in ecosystems that are difficult to measure through visual methods, such as estuarine and mangrove habitats with high turbidity, and delicate ecosystems such as sponge reefs and coral reefs. Further exploration into the application of deep clustering and neural networks, such as is used in human speech and singing separation, could also potentially improve the performance and generalizability of this work (Luo et al., 2017).
These call discrimination results provide a foundation for future bioacoustics studies of coral reef acoustic diversity and soundscape analyses. An impressive number of clusters was gleaned from a sub-sampling of only 10 days of acoustic recordings on a single coral reef in the U.S. Virgin Islands. There is almost certainly more acoustic diversity to reveal, and such analyses will support and inform biodiversity assessments and soniferous animal behavior. Despite the potential utility of acoustic property clustering, scaling up remains a challenge. While the clustering methods used in this study were automated with machine learning, the initial step of signal detection and extraction and later validation of clusters was manual, requiring trained analysts and considerable amounts of time. With the current rapid advances in AI, future work should focus on automated signal detection, including deep learning methods, for feature clustering, as well as potential noise reduction to improve the signal-to-noise ratios for these relatively low amplitude calls in a ‘noisy’ environment. Further, following the augmentation of each cluster with more examples, this middle step can be eliminated as detectors are developed for each call type. Progression on these proposed fronts would allow passive acoustic monitoring to proliferate as a tool in reef biodiversity monitoring.
The raw data supporting the conclusions of this article will be made available by the authors, without undue reservation.
AN: Investigation, Methodology, Visualization, Writing–original draft, Writing–review and editing, Formal Analysis. FJ: Conceptualization, Formal Analysis, Investigation, Methodology, Software, Validation, Visualization, Writing–original draft, Writing–review and editing. SJ: Formal Analysis, Writing–review and editing. NA: Formal Analysis, Investigation, Methodology, Writing–review and editing. SF: Data curation, Formal Analysis, Writing–review and editing. MH: Formal Analysis, Writing–review and editing. AA: Funding acquisition, Methodology, Visualization, Writing–review and editing. TM: Conceptualization, Data curation, Funding acquisition, Investigation, Methodology, Resources, Supervision, Visualization, Writing–original draft, Writing–review and editing.
The author(s) declare that financial support was received for the research, authorship, and/or publication of this article. Funding for this work was provided by National Science Foundation grants in Biological Oceanography and the Ocean Technology and Interdisciplinary Coordination (OCE-1536782; 2133029 and 2024077), as well as WHOI’s Reef Solutions and the Lounsbery Foundation.
The research was conducted under National Park Service Scientific Research and Collecting Permits VIIS-2017-SCI-0019 and we thank the Park staff for their support. We also thank the field logistical support provided by the University of the Virgin Islands’ staff and their support of the Virgin Islands Environmental Resource Station on St. John, USVI.
Author SRF was employed by Integrated Statistics Inc.
The remaining authors declare that the research was conducted in the absence of any commercial or financial relationships that could be construed as a potential conflict of interest.
All claims expressed in this article are solely those of the authors and do not necessarily represent those of their affiliated organizations, or those of the publisher, the editors and the reviewers. Any product that may be evaluated in this article, or claim that may be made by its manufacturer, is not guaranteed or endorsed by the publisher.
Aeby, G., and Santavy, D. L. (2006). Factors affecting susceptibility of the coral Montastraea faveolata to black-band disease. Mar. Ecol. Prog. Ser. 318, 103–110. doi:10.3354/meps318103
Akamatsu, T., Lin, T. H., Tsao, Y., Sinniger, F., and Harii, S. (2018). “Coral reef soundscape to measure the species distribution and biodiversity,” in 2018 OCEANS-MTS/IEEE kobe techno-oceans (OTO) (IEEE), 1–4.
Andersson, A. J., and Gledhill, D. (2013). Ocean acidification and coral reefs: effects on breakdown, dissolution, and net ecosystem calcification. Ann. Rev. Mar. Sci. 5, 321–348. doi:10.1146/annurev-marine-121211-172241
Apprill, A., Girdhar, Y., Mooney, T. A., Hansel, C. M., Long, M. H., Liu, Y., et al. (2023). Toward a new era of coral reef monitoring. Environ. Sci. Technol. 57, 5117–5124. doi:10.1021/acs.est.2c05369
Balebail, S., and Sisneros, J. A. (2022). Long duration advertisement calls of nesting male plainfin midshipman fish are honest indicators of size and condition. J. Exp. Biol. 225, jeb243889. doi:10.1242/jeb.243889
Barroso, V. R., Xavier, F. C., and Ferreira, C. E. L. (2023). Applications of machine learning to identify and characterize the sounds produced by fish. ICES J. Mar. Sci. 80 (7), 1854–1867. doi:10.1093/icesjms/fsad126
Bellwood, D. R., Hughes, T. P., Folke, C., and Nyström, M. (2004). Confronting the coral reef crisis. Nature 429, 827–833. doi:10.1038/nature02691
Bertucci, F., Maratrat, K., Berthe, C., Besson, M., Guerra, A. S., Raick, X., et al. (2020). Local sonic activity reveals potential partitioning in a coral reef fish community. Oecologia 193, 125–134. doi:10.1007/s00442-020-04647-3
Browning, E., Gib, R., Glover-Kapfer, P., and Jones, K. E. (2017). Passive acoustic monitoring in ecology and conservation. WWF Conserv. Technol. Ser. 1, 75. doi:10.25607/OBP-876
Caldwell, Z. R., Zgliczynski, B. J., Williams, G. J., and Sandin, S. A. (2016). Reef fish survey techniques: assessing the potential for standardizing methodologies. PLoS One 11, 01530666–e153114. doi:10.1371/journal.pone.0153066
Chérubin, L. M., Dalgleish, F., Ibrahim, A. K., Schärer-Umpierre, M., Nemeth, R. S., Matthews, A., et al. (2020). Fish spawning aggregations dynamics as inferred from a novel, persistent presence robotic approach. Front. Mar. Sci. 6, 779. doi:10.3389/fmars.2019.00779
Cohen, A. L., and Holcomb, M. (2009). Why corals care about ocean acidification uncovering the mechanism. Oceanography 22, 118–127. doi:10.5670/oceanog.2009.102
Dimoff, S. A., Halliday, W. D., Pine, M. K., Tietjen, K. L., Juanes, F., and Baum, J. K. (2021). The utility of different acoustic indicators to describe biological sounds of a coral reef soundscape. Ecol. Indic. 124, 107435. doi:10.1016/j.ecolind.2021.107435
Duan, D., Lü, L. G., Jiang, Y., Liu, Z., Yang, C., Guo, J., et al. (2022). Real-time identification of marine mammal calls based on convolutional neural networks. Appl. Acoust. 192, 108755. doi:10.1016/j.apacoust.2022.108755
Edmunds, P. J. (2013). Decadal-scale changes in the community structure of coral reefs of St. John, US Virgin Islands. Mar. Ecol. Prog. Ser. 489, 107–123. doi:10.3354/meps10424
Ester, M., Kriegel, H. P., Sander, J., and Xu, X. (1996). A density-based algorithm for discovering clusters in large spatial databases with noise. kdd 96 (34), 226–231.
Facon, M., Pinault, M., Obura, D., Pioch, S., Pothin, K., Bigot, L., et al. (2016). A comparative study of the accuracy and effectiveness of Line and Point Intercept Transect methods for coral reef monitoring in the southwestern Indian Ocean islands. Ecol. Indic. 60, 1045–1055. doi:10.1016/j.ecolind.2015.09.005
Ferguson, S. R., Jensen, F. H., Hyer, M. D., Noble, A., Apprill, A., and Mooney, T. A. (2022). Ground-truthing daily and lunar patterns of coral reef fish call rates on a US Virgin Island reef. Aquat. Biol. 31, 77–87. doi:10.3354/ab00755
Fisher, R., O’Leary, R. A., Low-Choy, S., Mengersen, K., Knowlton, N., Brainard, R. E., et al. (2015). Species richness on coral reefs and the pursuit of convergent global estimates. Curr. Biol. 25, 500–505. doi:10.1016/j.cub.2014.12.022
Hall, P., and Wehrly, T. E. (1991). A geometrical method for removing edge effects from kernel-type nonparametric regression estimators. J. Am. Stat. Assoc. 86 (415), 665–672. doi:10.1080/01621459.1991.10475092
Hastings, P. A., and Širović, A. (2015). Soundscapes offer unique opportunities for studies of fish communities. Proc. Natl. Acad. Sci. 112 (19), 5866–5867. doi:10.1073/pnas.1505897112
Hill, J., and Wilkinson, C. (2004). Methods for ecological monitoring of coral reefs. Aust. Inst. Mar. Sci. Townsv. 117.
Hughes, T. P., Kerry, J. T., Álvarez-Noriega, M., Álvarez-Romero, J. G., Anderson, K. D., Baird, A. H., et al. (2017). Global warming and recurrent mass bleaching of corals. Nature 543, 373–377. doi:10.1038/nature21707
Ibrahim, A. K., Zhuang, H., Chérubin, L. M., Schärer-Umpierre, M. T., Nemeth, R. S., Erdol, N., et al. (2020). Transfer learning for efficient classification of grouper sound. J. Acoust. Soc. Am. 148, EL260–EL266. doi:10.1121/10.0001943
Jarriel, S., Formel, N., Ferguson, S., Jensen, F., Apprill, A., and Mooney, T. A. (2024). Unidentified fish sounds as indicators of coral reef health and comparison to other acoustic methods. Front. Remote Sens. 5, 1338586. doi:10.3389/frsen.2024.1338586
Jensen, F., Mann, D., Rice, A., and Mooney, T. (2020). Development and testing of vibration-sensing tags for assessing fish and invertebrate vocalizations.
Jensen, F. H., Bejder, L., Wahlberg, M., Soto, N. A., Johnson, M., and Madsen, P. T. (2009). Vessel noise effects on delphinid communication. Mar. Ecol. Prog. Ser. 395, 161–175. doi:10.3354/meps08204
Kaplan, M., Mooney, T., Partan, J., and Solow, A. (2015). Coral reef species assemblages are associated with ambient soundscapes. Mar. Ecol. Prog. Ser. 533, 93–107. doi:10.3354/meps11382
Kaplan, M. B., Lammers, M. O., Zang, E., and Aran Mooney, T. (2018). Acoustic and biological trends on coral reefs off Maui, Hawaii. Coral Reefs 37, 121–133. doi:10.1007/s00338-017-1638-x
Lammers, M. O., Brainard, R. E., Au, W. W., Mooney, T. A., and Wong, K. B. (2008). An ecological acoustic recorder (EAR) for long-term monitoring of biological and anthropogenic sounds on coral reefs and other marine habitats. J. Acoust. Soc. Am. 123 (3), 1720–1728. doi:10.1121/1.2836780
Lamont, T. A., Williams, B., Chapuis, L., Prasetya, M. E., Seraphim, M. J., Harding, H. R., et al. (2022). The sound of recovery: coral reef restoration success is detectable in the soundscape. J. Appl. Ecol. 59 (3), 742–756. doi:10.1111/1365-2664.14089
Lillis, A., Apprill, A., Armenteros, M., and Mooney, T. A. (2023). “Small-scale variation in the soundscapes of coral reefs,” in The effects of noise on aquatic life: principles and practical considerations (Cham: Springer International Publishing), 1–15.
Lin, T. H., Akamatsu, T., Sinniger, F., and Harii, S. (2021). Exploring coral reef biodiversity via underwater soundscapes. Biol. Conserv. 253, 108901. doi:10.1016/j.biocon.2020.108901
Lin, T. H., Chen, C., Watanabe, H. K., Kawagucci, S., Yamamoto, H., and Akamatsu, T. (2019). Using soundscapes to assess deep-sea benthic ecosystems. Trends Ecol. Evol. 34 (12), 1066–1069. doi:10.1016/j.tree.2019.09.006
Lobel, P. S., and Mann, D. A. (1995). Spawning sounds of the damselfish, Dascyllus albisella (Pomacentridae), and relationship to male size. Bioacoustics 6 (3), 187–198. doi:10.1080/09524622.1995.9753289
Looby, A., Cox, K., Bravo, S., Rountree, R., Juanes, F., Reynolds, L. K., et al. (2022). A quantitative inventory of global soniferous fish diversity. Rev. Fish. Biol. Fish. 32 (2), 581–595. doi:10.1007/s11160-022-09702-1
Luczkovich, J., and Sprague, M. (2011). “Speciation and sounds of fishes: dividing up the bandwidth,” in Proceedings of Meetings on Acoustics, 2433. doi:10.1121/1.3587959AIP Publ.
Luo, Y., Chen, Z., Hershey, J. R., Le Roux, J., and Mesgarani, N. (2017) “Deep clustering and conventional networks for music separation: stronger together,” in 2017 IEEE international conference on acoustics, speech and signal processing (ICASSP), 61–65. doi:10.1109/ICASSP.2017.7952118
Luther, D. (2009). The influence of the acoustic community on songs of birds in a neotropical rain forest. Behav. Ecol. 20 (4), 864–871. doi:10.1093/beheco/arp074
Lyon, R. P., Eggleston, D. B., Bohnenstiehl, D. W. R., Layman, C. A., Ricci, S. W., and Allgeier, J. E. (2019). Fish community structure, habitat complexity, and soundscape characteristics of patch reefs in a tropical, back-reef system. Mar. Ecol. Prog. Ser. 609, 33–48. doi:10.3354/meps12829
Madsen, P. T., and Wahlberg, M. (2007). Recording and quantification of ultrasonic echolocation clicks from free-ranging toothed whales. Deep sea Res. part I Oceanogr. Res. Pap. 54 (8), 1421–1444. doi:10.1016/j.dsr.2007.04.020
Mahale, V. P., Chanda, K., Chakraborty, B., Salkar, T., and Sreekanth, G. B. (2023). Biodiversity assessment using passive acoustic recordings from off-reef location—unsupervised learning to classify fish vocalization. J. Acoust. Soc. Am. 153 (3), 1534–1553. doi:10.1121/10.0017248
Mann, D. A., and Lobel, P. S. (1995). Passive acoustic detection of sounds produced by the damselfish, Dascyllus albisella (Pomacentridae). Bioacoustics 6 (3), 199–213. doi:10.1080/09524622.1995.9753290
Mann, D. A., and Lobel, P. S. (1997). Propagation of damselfish (Pomacentridae) courtship sounds. J. Acoust. Soc. Am. 101 (6), 3783–3791. doi:10.1121/1.418425
McInnes, L., Healy, J., Melville, J., and Großberger, L. (2018). UMAP: Uniform manifold approximation and projection. J. Open Source Softw. 3 (29), 861. doi:10.21105/joss.00861
Meehan, C., Ebrahimian, J., Moore, W., and Meehan, S. (2020). Uniform manifold approximation and projection (UMAP). MATLAB Central File Exchange. Available at: https://www.mathworks.com/matlabcentral/fileexchange/71902.
Milne, R., and Griffiths, C. (2014). Invertebrate biodiversity associated with algal turfs on a coral-dominated reef. Mar. Biodivers. 44, 181–188. doi:10.1007/s12526-013-0199-7
Mooney, T. A., Di Iorio, L., Lammers, M., Lin, T.-H., Nedelec, S. L., Parsons, M., et al. (2020). Listening forward: approaching marine biodiversity assessments using acoustic methods.
Mouy, X., Rountree, R., Juanes, F., and Dosso, S. E. (2018). Cataloging fish sounds in the wild using combined acoustic and video recordings. J. Acoust. Soc. Am. 143, EL333–EL339. doi:10.1121/1.5037359
Mueller, C., Monczak, A., Soueidan, J., McKinney, B., Smott, S., Mills, T., et al. (2020). Sound characterization and fine-scale spatial mapping of an estuarine soundscape in the southeastern USA. Mar. Ecol. Prog. Ser. 645, 1–23. doi:10.3354/meps13373
Myrberg, A. A. (1997). Sound production by a coral reef fish (Pomacentrys Partitus): Evidence for a vocal, territorial “keep-out” signal. Bull. Mar. Sci. 60 (3), 1017–25.
Ozanich, E., Thode, A., Gerstoft, P., Freeman, L. A., and Freeman, S. (2021). Deep embedded clustering of coral reef bioacoustics. J. Acoust. Soc. Am. 149 (4), 2587–2601. doi:10.1121/10.0004221
Parmentier, E., and Fine, M. L. (2016). “Fish sound production: insights,” in Vertebrate sound production and acoustic communication. Editors R. A. Suthers, W. T. Fitch, R. R. Fay, and A. N. Popper, 19–49.
Parmentier, E., Kéver, L., Casadevall, M., and Lecchini, D. (2010). Diversity and complexity in the acoustic behaviour of Dacyllus flavicaudus (Pomacentridae). Mar. Biol. 157, 2317–2327. doi:10.1007/s00227-010-1498-1
Parravicini, V., Kulbicki, M., Bellwood, D. R., Friedlander, A. M., Arias-Gonzalez, J. E., Chabanet, P., et al. (2013). Global patterns and predictors of tropical reef fish species richness. Ecogr. (Cop.) 36, 1254–1262. doi:10.1111/j.1600-0587.2013.00291.x
Parsons, M., Erbe, C., McCauley, R., McWilliam, J., Marley, S., Gavrilov, A., et al. (2016). “Long-term monitoring of soundscapes and deciphering a useable index: examples of fish choruses from Australia,” in Proc. Meet. Acoust. (Melville, NY: AIP Publishing).
Parsons, M. J. G., Lin, T. H., Mooney, T. A., Erbe, C., Juanes, F., Lammers, M., et al. (2022). Sounding the call for a global library of underwater biological sounds. Front. Ecol. Evol. 10, 1–20. doi:10.3389/fevo.2022.810156
Radford, C. A., Stanley, J. A., and Jeffs, A. G. (2014). Adjacent coral reef habitats produce different underwater sound signatures. Mar. Ecol. Prog. Ser. 505, 19–28. doi:10.3354/meps10782
Radford, C. A., Stanley, J. A., Tindle, C. T., Montgomery, J. C., and Jeffs, A. G. (2010). Localised coastal habitats have distinct underwater sound signatures. Mar. Ecol. Prog. Ser. 401, 21–29. doi:10.3354/meps08451
Reaka-Kudla, M. L. (1997). “The global biodiversity of coral reefs: a comparison with rain forests,” in Biodiversity II: understanding and protecting our biological Resources, 83–108.
Romer, H., and Lewald, J. (1992). High-frequency sound transmission in natural habitats: implications for the evolution of insect acoustic communication. Behav. Ecol. Sociobiol. 29, 437–444. doi:10.1007/bf00170174
Ruppé, L., Clément, G., Herrel, A., Ballesta, L., Décamps, T., Kéver, L., et al. (2015). Environmental constraints drive the partitioning of the soundscape in fishes. Proc. Natl. Acad. Sci. U. S. A. 112 (19), 6092–6097. doi:10.1073/pnas.1424667112
Schmidt, A. K. D., Römer, H., and Riede, K. (2013). Spectral niche segregation and community organization in a tropical cricket assemblage. Behav. Ecol. 24, 470–480. doi:10.1093/beheco/ars187
Schneider, C., Hodges, K., Fischer, J., and Hammerschmidt, K. (2008). Acoustic niches of Siberut primates. Int. J. Primatol. 29, 601–613. doi:10.1007/s10764-007-9181-1
Seth, H., Bhatia, R., and Rajan, P. (2018). “Feature learning for bird call clustering,” in 2018 IEEE 13th international conference on industrial and information systems (ICIIS) (IEEE), 72–76.
Siemers, B. M., and Schnitzler, H. U. (2004). Echolocation signals reflect niche differentiation in five sympatric congeneric bat species. Nature 429, 657–661. doi:10.1038/nature02547
Staaterman, E., Ogburn, M. B., Altieri, A. H., Brandl, S. J., Whippo, R., Seemann, J., et al. (2017). Bioacoustic measurements complement visual biodiversity surveys: preliminary evidence from four shallow marine habitats. Mar. Ecol. Prog. Ser. 575, 207–215. doi:10.3354/meps12188
Staaterman, E., Paris, C. B., DeFerrari, H. A., Mann, D. A., Rice, A. N., and D’Alessandro, E. K. (2014). Celestial patterns in marine soundscapes. Mar. Ecol. Prog. Ser. 508, 17–32. doi:10.3354/meps10911
Tellechea, J. S., Martinez, C., Fine, M. L., and Norbis, W. (2010). Sound production in the whitemouth croaker and relationship between fish size and disturbance call characteristics. Environ. Biol. Fishes 89, 163–172. doi:10.1007/s10641-010-9709-7
Thomas, M., Martin, B., Kowarski, K., Gaudet, B., and Matwin, S. (2020). “Marine mammal species classification using convolutional neural networks and a novel acoustic representation,” in Machine learning and knowledge discovery in databases: European conference, ECML PKDD 2019, würzburg, Germany, september 16–20, 2019, proceedings, Part III (Springer International Publishing), 290–305.
Tricas, T. C., and Boyle, K. S. (2014). Acoustic behaviors in Hawaiian coral reef fish communities. Mar. Ecol. Prog. Ser. 511, 1–16. doi:10.3354/meps10930
Tricas, T. C., and Boyle, K. S. (2021). Parrotfish soundscapes: implications for coral reef management. Mar. Ecol. Prog. Ser. 666, 149–169. doi:10.3354/meps13679
Wu, K., Ruan, W., Zhou, D., Chen, Q., Zhang, C., Pan, X., et al. (2023). Syllable clustering analysis-based passive acoustic monitoring technology and its application in bird monitoring. Biodivers. Sci. 31 (1), 22370. doi:10.17520/biods.2022370
Keywords: marine biodiversity, ecosystem monitoring, bioacoustics, soundscape, biodiversity, machine learning, reef fish, niche partitioning
Citation: Noble AE, Jensen FH, Jarriel SD, Aoki N, Ferguson SR, Hyer MD, Apprill A and Mooney TA (2024) Unsupervised clustering reveals acoustic diversity and niche differentiation in pulsed calls from a coral reef ecosystem. Front. Remote Sens. 5:1429227. doi: 10.3389/frsen.2024.1429227
Received: 07 May 2024; Accepted: 31 July 2024;
Published: 15 August 2024.
Edited by:
DelWayne Roger Bohnenstiehl, North Carolina State University, United StatesReviewed by:
David Curnick, Zoological Society of London, United KingdomCopyright © 2024 Noble, Jensen, Jarriel, Aoki, Ferguson, Hyer, Apprill and Mooney. This is an open-access article distributed under the terms of the Creative Commons Attribution License (CC BY). The use, distribution or reproduction in other forums is permitted, provided the original author(s) and the copyright owner(s) are credited and that the original publication in this journal is cited, in accordance with accepted academic practice. No use, distribution or reproduction is permitted which does not comply with these terms.
*Correspondence: T. Aran Mooney, YW1vb25leUB3aG9pLmVkdQ==
Disclaimer: All claims expressed in this article are solely those of the authors and do not necessarily represent those of their affiliated organizations, or those of the publisher, the editors and the reviewers. Any product that may be evaluated in this article or claim that may be made by its manufacturer is not guaranteed or endorsed by the publisher.
Research integrity at Frontiers
Learn more about the work of our research integrity team to safeguard the quality of each article we publish.