 Kevin G. Ruddick1*
 Vittorio E. Brando2
 Alexandre Corizzi3
 Ana I. Dogliotti4
 David Doxaran3Clémence Goyens1
 Joel Kuusk5
 Quinten Vanhellemont1Dieter Vansteenwegen6
 Agnieszka Bialek7
 Pieter De Vis7
 Héloise Lavigne1Matthew Beck1
 Kenneth Flight5Anabel Gammaru1
 Luis González Vilas2
 Kaspars Laizans5
 Francesca Ortenzio1Pablo Perna4
 Estefania Piegari4Lucas Rubinstein4
 Morven Sinclair7
 Dimitry Van der Zande1
- 1Royal Belgian Institute of Natural Sciences (RBINS), Brussels, Belgium
- 2Consiglio Nazionale Delle Ricerche (CNR-ISMAR), Rome, Italy
- 3Laboratoire Océanographique de Villefranche (LOV), UMR7093 CNRS, Sorbonne Université (SU), Villefranche-sur-mer, France
- 4Instituto de Astronomía y Física del Espacio, Consejo Nacional de Investigaciones Científicas y Técnicas (IAFE, CONICET/UBA), Buenos Aires, Argentina
- 5Tartu Observatory, University of Tartu (UT), Tartu, Estonia
- 6Flanders Marine Institute (VLIZ), Oostende, Belgium
- 7National Physical Laboratory (NPL), Teddington, United Kingdom
This paper describes a prototype network of automated in situ measurements of hyperspectral water reflectance suitable for satellite validation and water quality monitoring. Radiometric validation of satellite-derived water reflectance is essential to ensure that only reliable data, e.g., for estimating water quality parameters such as chlorophyll a concentration, reach end-users. Analysis of the differences between satellite and in situ water reflectance measurements, particularly unmasked outliers, can provide recommendations on where satellite data processing algorithms need to be improved. In a massively multi-mission context, including Newspace constellations, hyperspectral missions and missions with broad spectral bands not designed for “water colour”, the advantage of hyperspectral over multispectral in situ measurements is clear. Two hyperspectral measurement systems, PANTHYR (based on the mature TRIOS/RAMSES radiometer) and HYPSTAR® (a newly designed radiometer), have been integrated here in the WATERHYPERNET network with SI-traceable calibration and characterisation. The systems have common data acquisition protocol, data processing and quality control. The choice of validation site and viewing geometry and installation considerations are described in detail. Three demonstration cases are described: 1. PANTHYR data from two sites are used to validate Sentinel-2/MSI (A&B); 2. HYPSTAR® data at six sites are used to validate Sentinel-3/OLCI (A&B); 3. PANTHYR and HYPSTAR® data in Belgian North Sea waters are used to monitor phytoplankton parameters, including Phaeocystis globosa, over two 5 month periods. Conclusion are drawn regarding the quality of Sentinel-2/MSI and Sentinel-3/OLCI data, including indications where improvements could be made. For example, a positive bias (mean difference) is found for ACOLITE_DSF processing of Sentinel-2 in clear waters (Acqua Alta) and clues are provided on how to improve this processing. The utility of these in situ measurements, even without accompanying hyperspectral satellite data, is demonstrated for phytoplankton monitoring. The future evolution of the WATERHYPERNET network is outlined, including geographical expansion, improvements to hardware reliability and to the measurement method (including uncertainty estimation) and plans for daily distribution of near real-time data.
1 Introduction
Spaceborne optical remote sensing from daily 100–1000 m resolution multispectral “water colour” missions such as MODIS (Franz et al., 2005), VIIRS (Wang et al., 2016) and Sentinel-3/OLCI (Garnesson et al., 2019) provides operational data to end-users for applications such as coastal water quality management (eutrophication, sediment transport, etc.). 10–100 m resolution “designed-for-land” missions such as Landsat 8&9 (Pahlevan and Schott, 2013; Vanhellemont and Ruddick, 2014) and Sentinel-2 (Hedley et al., 2018; Vanhellemont, 2019a) have also become popular tools for coastal and inland water monitoring. 1–10 m resolution missions, including large satellites such as the Pléiades series (Vanhellemont and Ruddick, 2018; Luo et al., 2020) and cubesat constellations from Newspace companies such as the PlanetScope Doves (Vanhellemont, 2019b) and SuperDoves (Vanhellemont, 2023), are now emerging, and offer new opportunities for applications inside ports and small lakes, and for monitoring coastal operations (construction, dredging/disposal). This spacescape of low earth orbit missions is supplemented by a new generation of hyperspectral missions, such as DESIS (Alonso et al., 2019), PRISMA (Braga et al., 2022), ENMAP (Kaufmann et al., 2006), EMIT (Thompson et al., 2023) and PACE/OCI (Gorman et al., 2019), which are expected to provide better information on phytoplankton species composition (Dierssen et al., 2020; Lavigne et al., 2022). Finally the multispectral geostationary “water colour” missions, GOCI-1 and GOCI-2 (Ryu et al., 2012), can provide a much higher frequency of data, e.g., for monitoring tidal and diurnal variability, as can the “meteorological” geostationary satellite sensors such as MSG/SEVIRI (Neukermans et al., 2009) and MTG/FCI (Kwiatkowska et al., 2016; Lavigne and Ruddick, 2018) and Himawari-8 (Dorji and Fearns, 2018), albeit with a more challenging signal-to-noise ratio for the latter sensors. A non-exhaustive overview of the present and near-future satellite missions relevant for coastal and inland water quality monitoring can be found in Table 1.
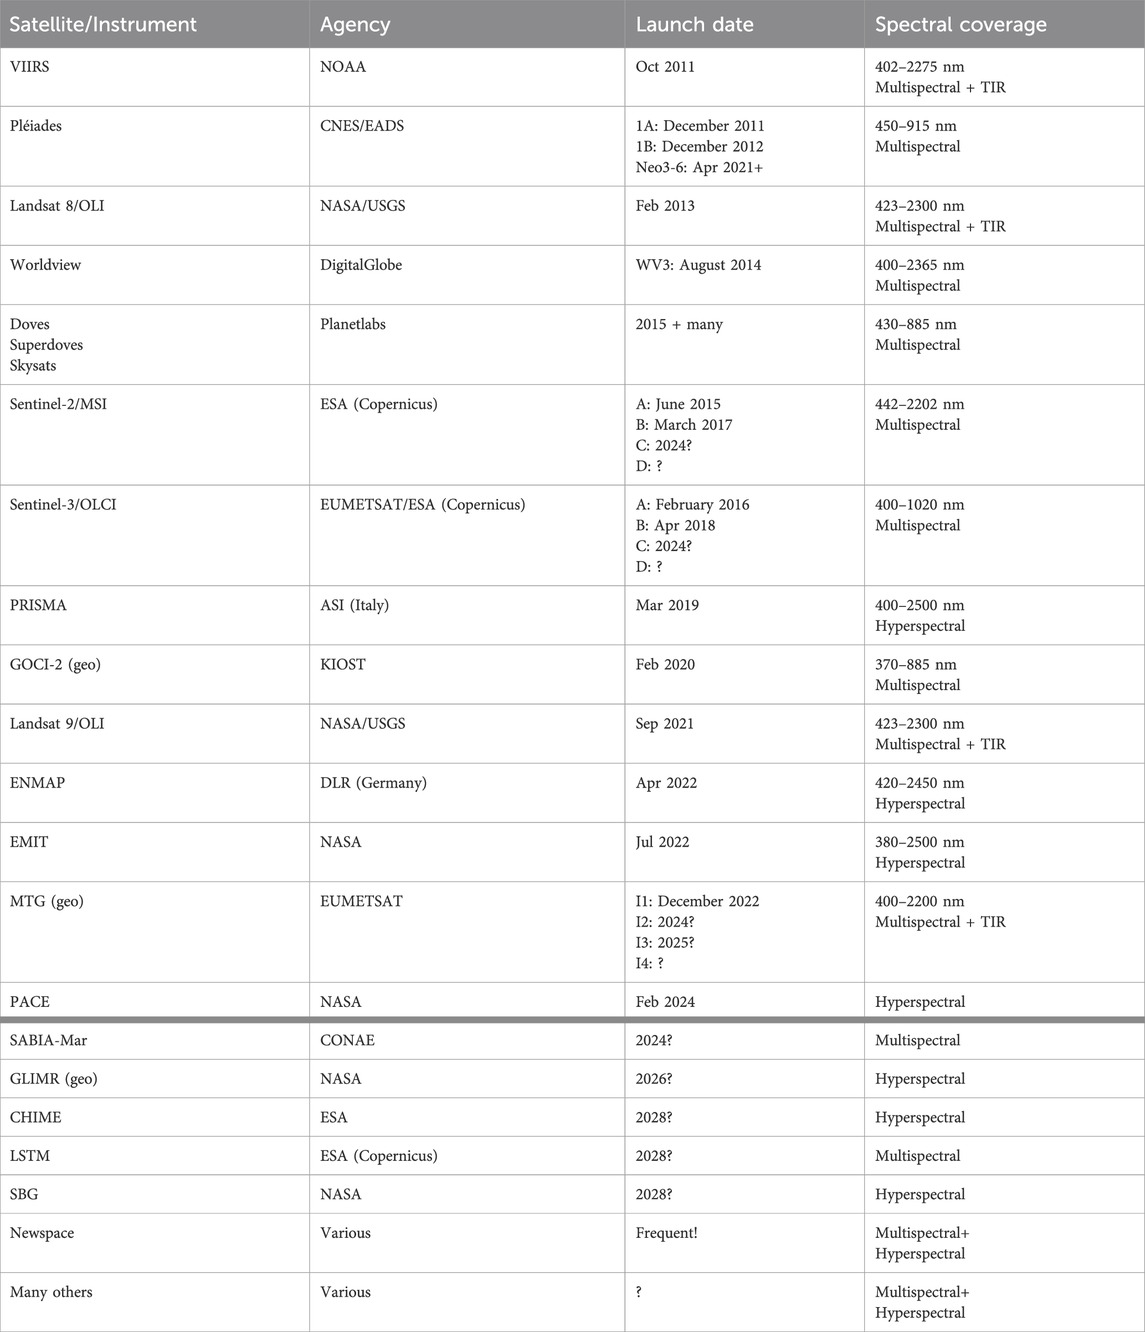
Table 1. Overview of satellite missions used for aquatic applications.
To ensure that the products from all these satellite missions can be trusted by end-users, and particularly to identify any atmospheric correction errors, in situ measurements of water reflectance are needed to validate the satellite data products. The multispectral AERONET-OC network (Zibordi et al., 2009; Zibordi et al., 2021) demonstrated clearly that radiometric validation of satellites is most efficiently achieved by a network of automated radiometers with common data acquisition and processing. In fact, the radiometric validation of the operational Sentinel-3/OLCI mission is currently achieved with only AERONET-OC data (EUMETSAT, 2021; Zibordi et al., 2022). Shipborne and buoy data, from SeaBASS (Werdell et al., 2003), CEFAS Smartbuoys (Mills et al., 2003; Neukermans et al., 2012) and the Atlantic Meridional Transect (Tilstone et al., 2021), are used in the validation context only for inherent optical properties and chlorophyll a concentration, while the single automated MOBY platform data (Brown et al., 2007) are used for system vicarious calibration. Based on the AERONET-OC success, the prototype WATERHYPERNET network has been set up as an international network of sites running automated systems of pointable hyperspectral radiometers with common data acquisition and processing. WATERHYPERNET provides water reflectance validation data at hyperspectral resolution every cloud-free day for sites with diverse water and atmosphere conditions.
The use of hyperspectral radiometers in this massively multi-mission perspective has a clear advantage (Figure 1) for matching in situ data to all satellite data spectral responses (including out-of-band response), and thus avoiding the uncertainties and possible model assumptions associated with band-shifting (Mélin and Sclep, 2015; Pahlevan et al., 2017; Hieronymi, 2019). A disadvantage of the hyperspectral radiometers is the slower integration time, and generally less mature knowledge of instrument characteristics (Vabson et al., 2019; Zibordi et al., 2019).
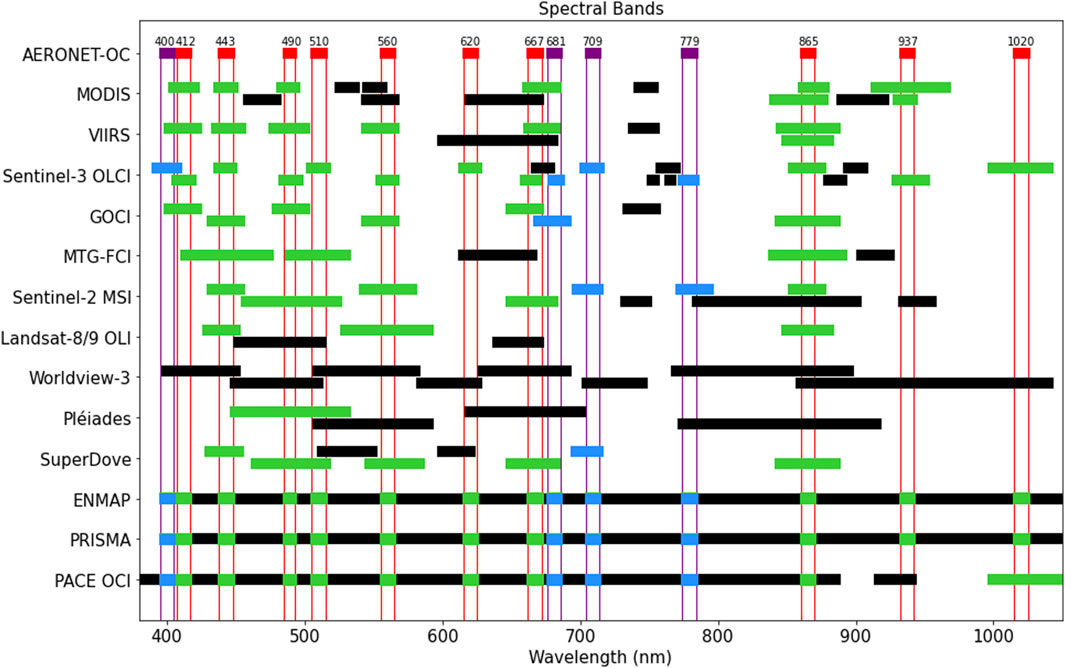
Figure 1. Spectral bands of typical satellite missions to be validated compared with (top row) the CIMEL CE318TV-12 (https://www.cimel.fr/solutions/ce318-t/#specifications) used in AERONET-OC. The two versions of the CE318TV-12 instrument are displayed with common bands in red and optional bands in violet. The variant CE318TV-12-LC (“lake colour”) has bands 681 nm and 709 nm, while the CE318TV-12-OC (“ocean colour”) variant CE318TV-12-OC has bands 400 nm and 779 nm. The CE318-TU12 instrument used for multispectral land surface reflectance measurements (Meygret et al., 2011) has a different set of 9 or 12 spectral bands. Satellite bands with central wavelength falling inside a CE318TV-12 common/optional band are shown in green/blue respectively and those falling outside such bands are shown in black. The latter will be particularly difficult to accurately estimate by band-shifting.
This paper describes the design of the prototype WATERHYPERNET network, including hardware (radiometer and associated system), software (data acquisition, and data processing and distribution by the HYPSTAR® processor (De Vis et al., 2024)) and current validation sites. Examples are given of exploitation of datasets for satellite validation and water quality monitoring, and future perspectives for a long-term operational network are provided.
To facilitate reading of this paper, a table of acronyms is provided in Supplementary Table S1.
2 The WATERHYPERNET network–overview
2.1 Materials and equipment - hyperspectral radiometer systems
Automated abovewater hyperspectral radiometer systems currently or recently used for measurement of water reflectance include: 3-sensor TRIOS/RAMSES with fixed azimuth (Arabi et al., 2018); rotating azimuth TRIOS/RAMSES So-Rad (Simis and Olsson, 2013); rotating azimuth DALEC (Slivkoff, 2014; Brando et al., 2016); 3-sensor Seabird/HyperSAS with rotating azimuth (Carswell et al., 2017); the WispStation with six optical paths at two fixed azimuth directions (Peters et al., 2018); and the OSPREY system (Hooker et al., 2012), which includes both zenith and azimuth pointing and both multispectral and hyperspectral detectors. For the WATERHYPERNET a crucial design choice was to use a pan-tilt unit, allowing both azimuth- and zenith-pointing, in contrast to all prior hyperspectral systems except the OSPREY.
WATERHYPERNET currently accepts two abovewater hardware systems: a) the PANTHYR system based on the mature TRIOS/RAMSES radiometer, and b) the HYPSTAR® system based on a newly-designed radiometer.
The PANTHYR (PAN and Tilt HYperspectral Radiometer) system, shown in Figure 2A, is described in detail by (Vansteenwegen et al., 2019), and consists of two TRIOS/RAMSES radiometers (one irradiance, one radiance with 7° Field of View; 400–900 nm at 10 nm Full Width Half Maximum, FWHM) with external camera mounted on a FLIR PTU-D48 E pan-tilt unit controlled by a single-board Beaglebone Black Industrial computer and associated custom-built electronics.
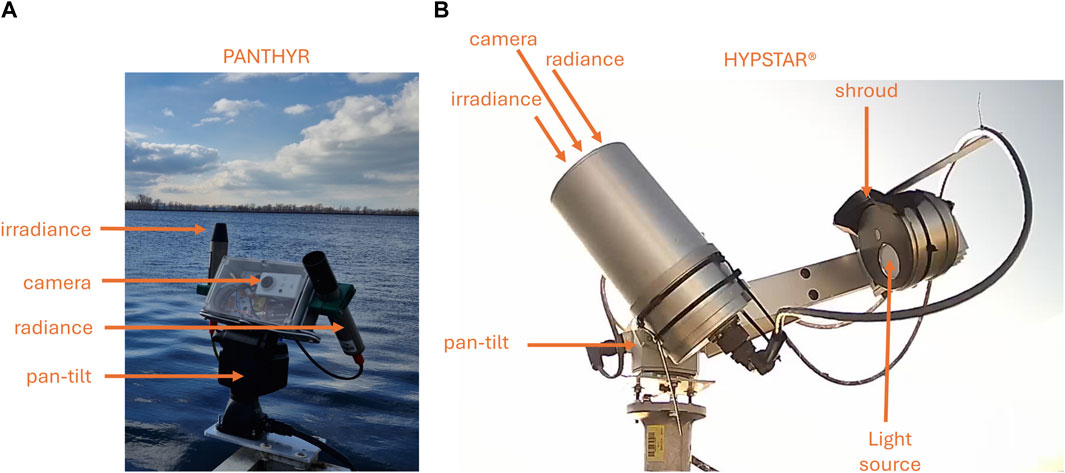
Figure 2. (A) PANTHYR radiometer system including separate irradiance sensor, radiance sensor and camera mounted on a pan-tilt unit; (B) HYPSTAR® radiometer system with integrated radiance and irradiance sensors, camera and calibration monitoring LED source with plastic shroud. Cable tie spikes are used for bird avoidance.
The HYPSTAR® (HYperspectral Pointable System for Terrestrial and Aquatic Radiometry) system, shown in Figure 2B and described in more detail in (Kuusk et al., 2024), consists of a newly-designed hyperspectral radiometer (380–1020 nm at 3 nm FWHM) with integrated radiance and irradiance fore-optics and embedded RGB camera, mounted on a Will-Burt Bowler Rx pan-tilt unit, and controlled by a rugged Cincoze DE-1000 PC. The system has an integrated LED light source for relative calibration monitoring during long deployments–see Figure 2B. This light source is outside the HYPSTAR® system optical path and so monitors not just changes in spectrometer responsivity, but also any contamination of the fore-optics, e.g., from dust or animals (spider webs, bird faeces, etc.).
Both systems include auxiliary sensors for ambient light and rain detection and the HYPSTAR® has an ambient light sensor measuring continuously during radiometry. Power supplies (grid, solar + battery) and data transmission (cabled internet, wifi, 2G/3G/4G) are site dependent.
The systems are programmed to acquire data typically every 20 min during daylight, although site-specific adjustments between 15 and 30 min repeat period and/or limiting to a few hours around local solar noon are possible if justified by scientific needs or power limitations. Both systems follow an abovewater radiometry acquisition protocol based on (Mobley, 1999), termed hereafter M1999. Measurements are acquired at 90° and/or 135° relative azimuth to Sun and potentially both left and right of Sun, when permitted by the local mounting structure and its shadows/reflections. Data are transmitted to land in near real time for automated, centralised processing and quality control. Extension of the processing to generate uncertainty estimates for data value is in progress following the work of the FRM4SOC project (Banks et al., 2020; Ruddick et al., 2019). A data portal is under development to distribute data publicly to users such as satellite mission validation entities and developers of atmospheric correction algorithms. Pending implementation of these developments in an operational processing environment, some prototype datasets have been distributed via ZENODO, and are listed at https://waterhypernet.org/data/.
An important feature of both these systems, also present on the precursor multispectral CIMEL CE318-T-OC (Seaprism) and the hyperspectral OSPREY system but not on other hyperspectral systems, is the use of a pointing system with both pan and tilt possibilities. While many other hyperspectral systems recognise the importance of panning to achieve the desired relative azimuth to Sun, tilting has three important advantages compared to typical fixed zenith/nadir angle systems: 1. Both sky and water radiance measurements can be made with the same radiometer, thus saving on acquisition cost and ensuring identical wavelength scale and radiometer sensitivity and characterisation for both sky and water radiance; 2. When not measuring, the radiometers can be “parked” pointed downwards to reduce fore-optics contamination from atmospheric deposition; 3. It is possible to adopt new pointing scenarios with different zenith/nadir angles from the standard M1999 protocol, e.g., scanning the principal plane into sunglint to better estimate the effective Fresnel reflectance coefficient (Goyens and Ruddick, 2023) or scanning the skydome to check for clouds and/or obstructions or to estimate aerosol properties or Sun/moon pointing for calibration monitoring.
2.2 Validation sites
2.2.1 Choice of validation site
The PANTHYR and HYPSTAR® systems are installed on fixed structures overlooking water enabling a tilt-free, standardised viewing geometry. The network should ideally cover a wide diversity of water, atmosphere and Sun conditions in order to provide validation data everywhere satellite data are used. In contrast to the criteria used for selection of vicarious calibration sites (Zibordi et al., 2015), where optimal water, atmosphere and Sun conditions are preferred, validation data are needed also in the “difficult” or suboptimal conditions including dynamic and patchy waters, waters with bottom reflectance, hazy, variable and partially cloudy atmospheres, very low and very high Sun zenith angles, sites with strong adjacency effects, absorbing aerosols, etc.
Locations close to land are not excluded, since validation data are also needed for the metre-scale satellite missions (Vanhellemont, 2019b) to provide quality control (QC) for their unique applications close to land, e.g., in ports, small lakes and wide rivers, where atmospheric adjacency effects (Reinersman and Carder, 1995; Santer and Schmechtig, 2000), and sensor point spread function effects may be problematic. However, sites close to land will obviously be applicable only to satellite missions with spatial resolution finer than a site-dependent maximum spatial resolution.
Some validation sites in regions of high natural spatial variability are also desirable since users need to understand satellite data quality in such regions, e.g., for dredging/disposal and other sediment transport applications, and for monitoring of patchy phytoplankton distributions. If the natural spatial variability can be characterised, e.g., by analysing satellite data at different spatial resolutions, then appropriate conclusions can be drawn when performing the matchup validation. For example, (Dogliotti et al., 2015) demonstrates for a site close to the front of a coastal current that high spatial resolution sensors will give better agreement than low spatial resolution sensors. If the horizontal patchiness is also variable in time, e.g., because of horizontal advection, then matchup validation results may depend strongly on the time difference between in situ and satellite. When performing the matchup analysis it is therefore important to characterise the natural spatial and temporal variability of the water, and estimate the consequent uncertainty relating to the space and time differences between in situ and satellite measurements.
While natural space and time variability of the water target is not undesirable, since satellite data need to be validated in all conditions, artificial optical variability of the water target, induced by the measurement platform, is clearly to be avoided/minimised. It is obvious that measurements should not be made where the water-viewing sensor field of view includes either the measurement platform itself or the shadow of the measurement platform (including any underwater shadow). More subtle perturbations of the water target by reflection of Sun and skylight from the measurement platform should also be evaluated within the measurement uncertainty budget (Talone and Zibordi, 2019), and minimised as far as possible. This can be understood intuitively by taking (or imagining taking) a fish-eye photo of the Sun/sky hemisphere at the water surface within the water-viewing sensor field of view. Any portions of such a photo where the sky is replaced by the measurement platform/instrument contribute to artificial contamination of the measurement. This contamination will depend on the solid angle of the artificial structure, the difference in colour compared to the replaced sky, and the zenith angle of the obstruction as seen from the water target.
The measurement platform may also induce local hydrodynamic and hence optical variability, e.g., turbid wakes (Vanhellemont and Ruddick, 2014), and will directly impact the satellite measurement itself, especially at metre and decametre spatial resolutions (Vanhellemont and Ruddick, 2015). These are generally undesirable but unavoidable. There is a clear preference for structures which allow water to freely flow underneath, e.g., offshore platforms or piers/jetties supported by underwater wood/steel beams, or slender structures, e.g., single-legged poles, and a preference to avoid structures which block underwater currents, e.g., concrete walls or wooden breakwaters.
While at the level of network organisation, there is a strategic interest to cover a wide range of water, atmosphere and Sun conditions, in practice the choice of validation sites is mainly opportunistic. Long-term operation of a validation site depends on sustained funding, a supportive platform owner and a very dedicated and motivated scientist acting as Principal Investigator. Over the time scale of a decade, there can be many and diverse disruptive events: funding gaps, platform ownership/policy changes, institutional changes, transfer of staff, priority shifts, interpersonal tensions, damage from natural events (esp storms) or accidents, hardware failures, safety issues, etc. It requires considerable determination to keep things running when difficulties arise.
2.2.2 Viewing geometry and installation considerations
The location of the measurement system on the measurement platform is also important, and should take account of platform shadow and its variation over the day and over the year, as well as any underlying obstructions which may contaminate the field of view and hence restrict useable azimuth angles for the water-viewing measurement. In general location on a corner is therefore preferred. The choice of corner will impact the possible measurement times (and hence cover satellites with different overpass times). Both the PANTHYR and HYPSTAR® systems have been designed to allow flexible azimuthal pointing, and can be programmed to measure at 90°, 135°, 225° and/or 270° relative (away from) Sun if the angle is optically acceptable (not pointing at platform or platform shadow and pointing sufficiently far away from optical contamination caused by the platform). The M1999 acquisition protocol recommends a relative azimuth to Sun of 135° or 225° in order to minimise sunglint, particularly for moderate/high wave conditions. While such an azimuth is generally appropriate for measurements from the prow of a ship, which can be oriented for the measurement (Ruddick et al., 2006), measurements from the corner of a fixed platform generally have a more limited range of azimuth angles where platform perturbations are minimal. In the AERONET-OC network (Zibordi et al., 2009) the viewing azimuth of 90° or 270° was therefore adopted with a strict QC filtering restricting measurements typically to wind speed not exceeding 5 m/s (Zibordi et al., 2021). The approach in WATERHYPERNET is to define a “keep-out zone” of absolute azimuthal directions where measurements should not be made because data will be contaminated by the platform either directly or indirectly. When the PANTHYR system wakes up to make a measurement, the four potential azimuth angles are checked against the keep-out zone, and acquisitions may be made for all acceptable azimuth angles. In practice generally only one or two of the four potential angles are acceptable. In the case where two azimuth angles are possible there is considerable value in comparing water reflectance between these two angles–clearly these two measurements should agree to within the estimated measurement uncertainty (after viewing angle correction), and if they do not then there is important information on how the measurement should be improved, possibly relating to the viewing angle correction, the skyglint/sunglint correction or optical contaminations from the platform. At the time of writing the keep-out zone is hard-coded per site as an absolute azimuth range, but repeated measurements at different azimuth angles are being analysed to build up a better understanding on a site-by-site basis of data quality as a function of Sun zenith and azimuth angle and viewing azimuth angle relative to Sun.
Both the PANTHYR and HYPSTAR® systems measure downwelling irradiance directly, and hence require an unobstructed Sun/sky hemisphere (as opposed to the CIMEL/SeaPRISM system which estimates downwelling irradiance from a direct Sun measurement, and only requires an unobstructed direct Sun view). This means that the system should therefore ideally be located above all other artificial structures (Mueller et al., 2003). Unfortunately this requirement is almost never possible in practice for offshore structures because of the safety requirements for masts with lights for navigation and for lightning protection rods. The system should therefore be located as high as possible and horizontally distanced from such masts, minimising the impact on the downwelling irradiance measurement. The associated residual uncertainty can be modelled, e.g., (Castagna et al., 2019).
2.2.3 Existing and planned sites
Since the WATERHYPERNET network is at a prototype stage, the location of validation sites may vary considerably in the coming years as funding from the driving projects ceases, and as the network expands with new partners from more diverse funding sources. Despite this long-term (∼10 years) and even medium-term (∼3 years) uncertainty, the validation managers for many of the missions listed in Table 1 are already looking to WATERHYPERNET as a major source of radiometric validation data, both during the commissioning phases and during routine operations. The existing WATERHYPERNET sites are therefore provided in Table 2, and will be updated continuously via the web site www.waterhypernet.org.
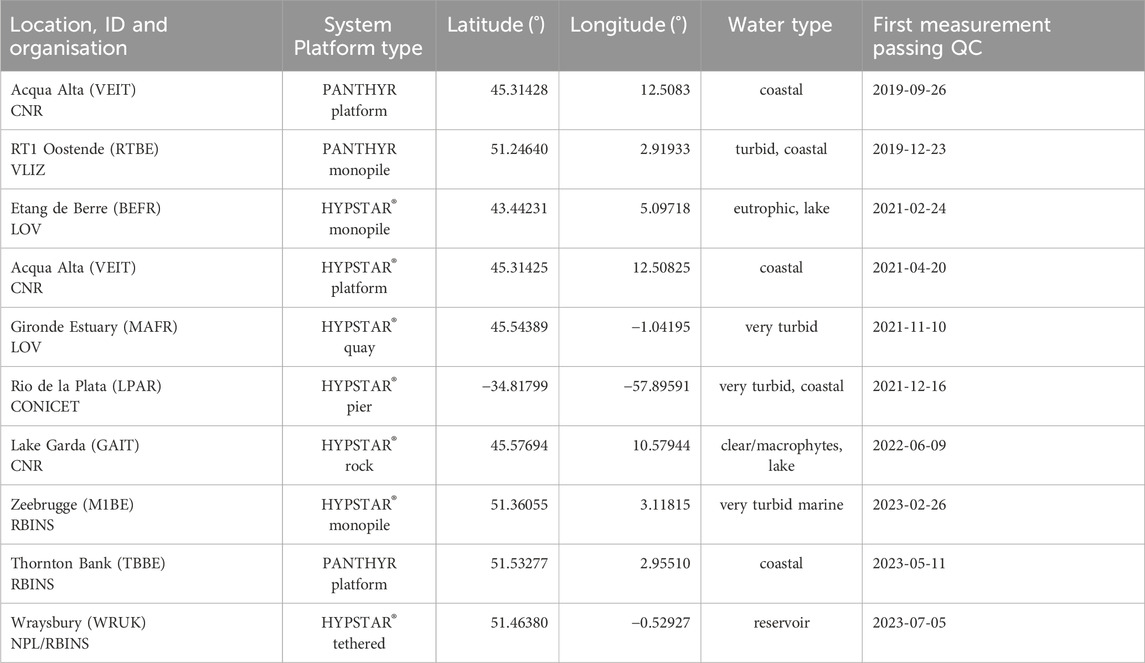
Table 2. Overview of the first WATERHYPERNET validation sites. Each site has a 4 letter code (“ID”).
The latitude and longitude provided in Table 2 refers to the location of the instrument. When data are used for satellite validation studies it is typical to extract satellite data for a macropixel “doughnut” around the measurement location (Pahlevan et al., 2021) or for a reference pixel horizontally shifted from the measurement platform (Vanhellemont, 2019a). This choice is the responsibility of the validation scientist using WATERHYPERNET data, and will generally be a function of the spatial resolution of the satellite sensor, as well as its viewing geometry and geolocation accuracy (including orthorectification) and site characteristics.
2.3 Demonstration in situ datasets
Following the successful AERONET-OC approach, and in the interests of reducing costs and achieving a high degree of standardisation, the WATERHYPERNET data acquisition, transmission, processing and distribution is fully automated in Near Real-Time (NRT, <24 h between data acquisition and data availability), at least for the data using pre-deployment radiometer calibration and default wind speed. Data distribution is foreseen from the www.waterhypernet.org data portal, but, during the current prototype phase, where the automated quality control does not yet meet the desired long-term standard, public release of the NRT data is not yet implemented. Despite this prototype status, while the data currently acquired and processed lack some of the features that will be implemented (full measurement uncertainty estimation, better characterisation of optical perturbations from the platforms, links to spectral convolution and BRDF correction tools), these data are already considered to be very valuable for assessing the quality of satellite data for wavelengths or geographical regions not covered by AERONET-OC.
The WATERHYPERNET v0 data are, for example, probably superior in quality to many shipborne reflectance measurements, because they are less subject to tilt, and certainly provide many more hyperspectral matchups per year than shipborne validation data sources. The WATERHYPERNET data should ideally have arrived at maturity at least 7 years ago, e.g., to support the validation of Sentinel-2 and Landsat 8, and are critically needed now for the validation of hyperspectral missions such as PRISMA, EnMAP, EMIT and PACE. Faced with this dilemma of having v0 prototype data that are considered useful but not of the final quality that is expected for routine operations in 2 years time, the current approach is to publicly release limited datasets via www.zenodo.org with appropriate disclaimers on quality and without the “WATERHYPERNET” branding.
In the present paper examples are given of prototype datasets and their application, for both PANTHYR and HYPSTAR® systems.
3 Methods - WATERHYPERNET
3.1 Data acquisition protocol
For both the PANTHYR and the HYPSTAR® system the data acquisition protocol is based closely on the M1999 measurement method. For each azimuth angle,
During the above-mentioned sequence a simple ambient light sensor measures continuously and can be used for identifying any variation in illumination during the sequential radiometric measurements.
3.2 Data processing and quality control
The primary radiometric measurand produced by WATERHYPERNET is the (directional) water-leaving radiance reflectance as represented by
where
The wind speed is retrieved from the 0.25° gridded, 6-hourly nowcast wind speed provided by the National Centers for Environmental Prediction (NCEP) GDAS (https://rda.ucar.edu/datasets/ds083.3/citation/).
For clear and moderately turbid, but not extremely turbid, water sites, a wavelength-independent “NIR Similarity Spectrum (SimSpec)” correction is applied, following (Ruddick et al., 2005), using the expected constant
3.2.1 PANTHYR data processing
Measurements are converted from digital counts to (ir)radiance using two laboratory instrument characterisations performed by Tartu Observatory (Estonia) before and after each deployment period. Calibration data for a specific scan are obtained from linear interpolation in time between pre-deployment and post-deployment instrument characterisation. The calibrated scan data are linearly interpolated from the instrument specific wavelengths to a common wavelength grid (355–900 nm, every 2.5 nm). Individual calibrated scans are subjected to quality control as in (Ruddick et al., 2006), i.e., scans differing >25% at 550 nm from their neighbouring scans are rejected. For the
If sufficient calibrated scans are available in the cycle, i.e.,
Data are provided both with and without (“nosc” suffix in distributed datasets) the SimSpec correction, since the latter is expected to improve data for clear and moderately turbid waters but is expected to be inappropriate for extremely turbid waters – see (Ruddick et al., 2006; Doron et al., 2011). The SimSpec-corrected data are currently recommended for Acqua Alta (VEIT) and Thornton Bank (TBBE) PANTHYR sites but not Oostende (O1BE).
The
1.
2. Variability (coefficient of variation) of
3.
4.
5. Bright water spectra (average VIS
6.
An example of PANTHYR spectra for measured
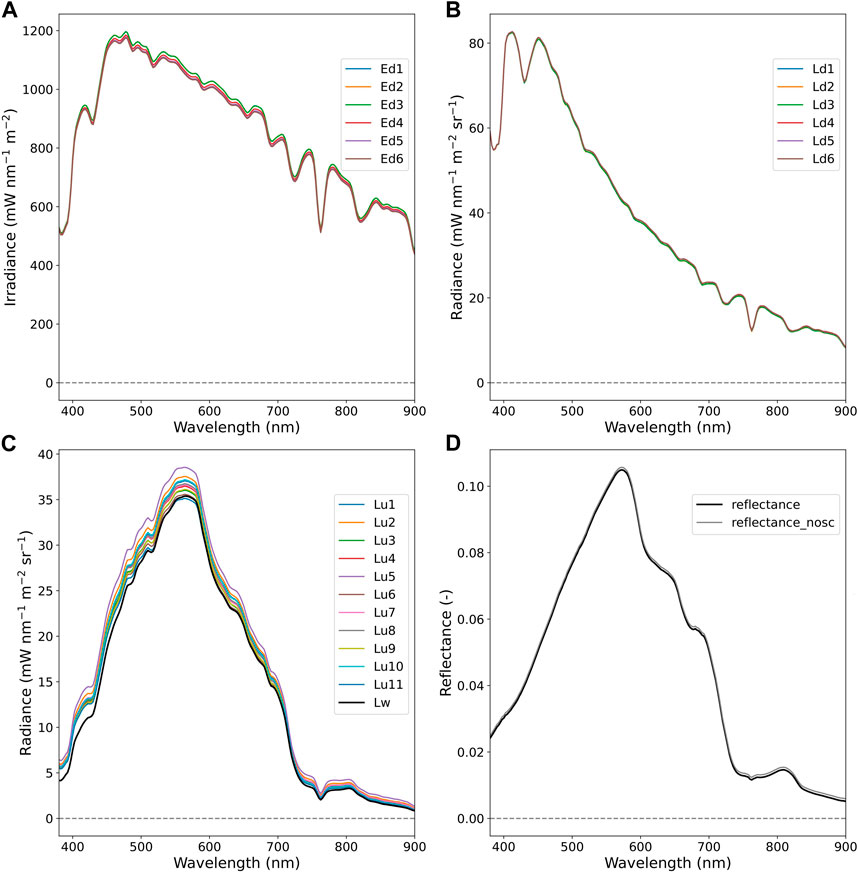
Figure 3. Example of processing from PANTHYR data acquired at the Oostende (O1BE) site on 2023-04-29 at 14:40 UTC. (A) six scans of downwelling irradiance,
3.2.2 HYPSTAR® data processing
In the HYPSTAR® data processing, the following steps are performed.
1. The processing scheduler starts processing when a new sequence has been transmitted to the server. It first inspects, and reads the raw spectra and calibration data.
2. Raw spectra are then corrected for darks before they are calibrated to irradiance and radiance scans using pre-deployment calibration coefficients (post-deployment calibration coefficients are not yet available).
3. Next, since the irradiance and radiance measurements have a slight shift in wavelength, spectral interpolation is performed for the irradiance scans to fit the radiance wavelength scale.
4.
5.
6. Finally, the NIR Similarity Spectrum correction is applied, where appropriate, and
The random uncertainties (from the standard deviation between scans) and the systematic uncertainties (from the instrument calibration) are propagated through each of the processing steps listed above using the Monte Carlo method implemented in the CoMet toolkit (www.comet-toolkit.org). Multiple uncertainty components as well as associated error-correlation information are provided in each of the HYPSTAR® products. Although implemented, these uncertainty products are not yet fully tested and will be released in the next version of the processing.
Throughout the abovementioned processing steps, several quality checks are performed to ensure that only high quality data are distributed. These include: 0) Pointing accuracy is checked and measurements with pointing errors >3° are rejected, 1) Raw spectra considered as outliers and/or presenting saturated counts or missing data, are discarded from further processing. Outliers are determined as any spectra for which the spectrally-integrated signal deviates more than three sigma or 25% (whichever is largest) from the mean; 2) After averaging over the scans, the
Full data processing and default quality checks are described in (De Vis et al., 2024). The HYPSTAR® processor is fully accessible via (https://github.com/HYPERNETS/hypernets_processor, accessed on 20 October 2023).
An example of HYPSTAR® spectra for measured
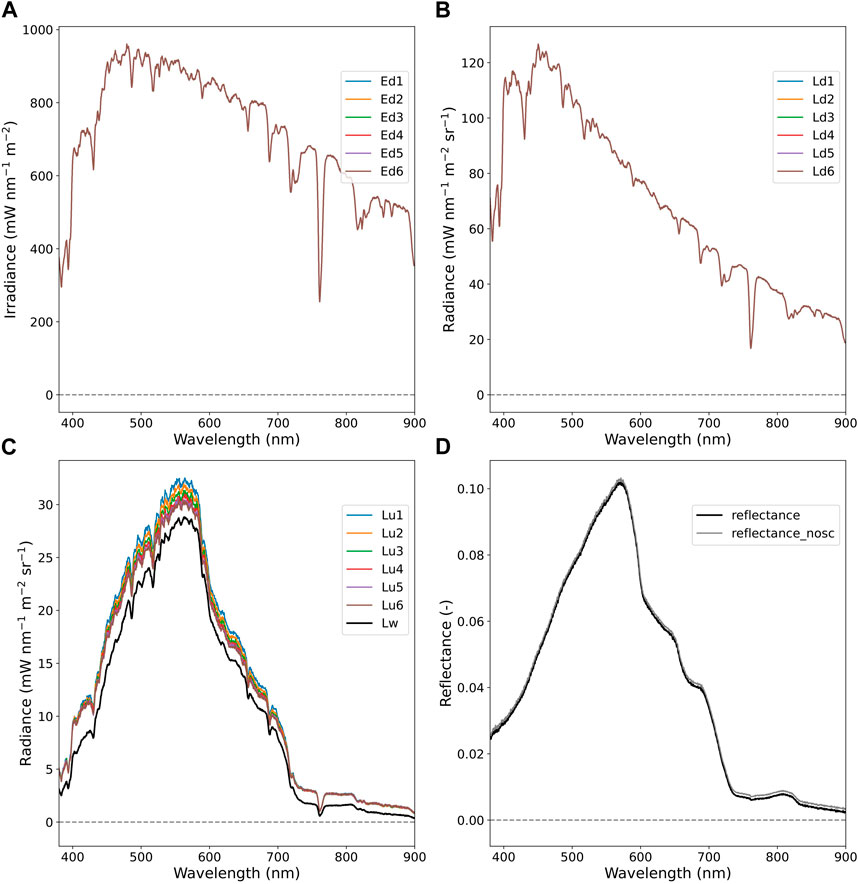
Figure 4. Example of processing from HYPSTAR® data acquired at the Zeebrugge (M1BE) site on 2023-04-09 at 13:01 UTC. (A) six scans of downwelling irradiance,
4 Methods–demonstration cases
Three examples are shown here to demonstrate the usefulness of the WATERHYPERNET data. The corresponding satellite and/or in situ data processing is described in the following subsections.
4.1 Sentinel-2 validation–satellite data and matchup procedure
As a follow-up to the study of (Vanhellemont, 2020), Sentinel-2 (A&B) (S2) data are compared to PANTHYR data for the Acqua Alta and Oostende sites.
The S2 satellites have onboard a 13 band MultiSpectral Instrument (MSI) spanning the VSWIR with four bands at 10 m, six bands at 20 m and three bands at 60 m spatial resolution. MSI has two bands that are not processed to surface reflectance, one at 945 nm for estimation of water vapour, and one at 1.3 µm for the detection of cirrus clouds.
S2 satellite data for both sites were collected as top-of-atmosphere reflectance (
Imagery was processed to water-leaving radiance reflectance (
1. ACOLITE/DSF with AOT estimated from VNIR bands (no SWIR) (termed “ACOLITE_DSF”)
2. ACOLITE/DSF with AOT estimated from VNIR bands (no SWIR) and optional per-pixel SWIR based glint correction (termed “ACOLITE_DSF_GC”)
Other processor options (including ancillary datasets for pressure, ozone and water vapour) are used according to the defaults documented in (Vanhellemont, 2020).
Matchups with PANTHYR (using only 225° relative azimuth) were made using a 60 min full width window (i.e., +/-30 min around overpass time), linearly interpolated to the overpass time if possible, i.e., when two bounding measurements are available. PANTHYR data are spectrally convoluted to the Sentinel-2 (A&B) bands in reflectance space with spectral response functions S2-SRF_COPE-GSEG-EOPG-TN-15-0007_3.0 (dated 2018-01).
Satellite data are mean averaged over 11 × 11 10 m pixels centred on a reference location. The reference location used for extraction is located as specified in (Vanhellemont, 2020) for Oostende, i.e., 90 m East of the platform, and for Acqua Alta by (Vanhellemont, 2019a, Supplementary Material S2) avoiding platform and near platform pixels. Quality control was made using a threshold on the 95th percentile (P95) of the 11 × 11 pixel box, rejecting matchups where in this box P95
In situ and satellite matchup data are provided in Supplementary Data Sheet S2.
Reduced Major Axis (RMA) regression lines and squared correlation coefficients,
4.2 Sentinel-3/OLCI validation - satellite data
Sentinel-3_OLCI/A&B data between February 2021 and March 2023 were downloaded from the EUMETSAT Data Store as Level 2 Water Full Resolution (WFR) products processed using the OLCI L2 processor IPF-OL-2 version 07 (EUMETSAT, 2021; Zibordi et al., 2022) for the HYPSTAR® deployments at six sites: Acqua Alta Oceanographic Tower (VEIT), Lake Garda (GAIT), Etang de Berre (BEFR), Gironde (MAFR), La Plata (LPAR) and Zeebrugge (M1BE).
An adaptation of the Matchup Data Base (MDB) approach proposed by EUMETSAT (EUMETSAT, 2022) was used to organise the satellite and in situ data, and perform the validation analysis (Gonzalez Vilas et al., 2024). Validation protocols were based on the recommendation available in the literature for medium-resolution satellites (Concha et al., 2021), applying the same protocols for all the sites except for the adaptations noted below (1 valid pixel for GAIT and MAFR, negative satellite reflectance masking for BEFR, MAFR and LPAR).
The 15 OLCI bands between 400 and 865 nm are included in the analysis. The 1020 nm band is excluded because the low signal causes unreliable measurements.
Satellite measurements for each band were computed as the average, excluding outliers, for a measurement window of three by three pixels around the site location, using a strict criterium of nine valid pixels for all the sites except for GAIT and MAFR, where only one valid pixel was required because of the proximity of the coastline. Outliers are identified (EUMETSAT, 2022) when the pixel value is lower (or greater) than mean minus (or plus) 1.5 standard deviations, where mean and standard deviation are computed using valid (non-flagged) pixels in the 3 × 3 extraction window. For masking, the default flag list proposed by EUMETSAT (EUMETSAT, 2021) is used and is based on the Water Quality and Science Flags (WQSF) dataset for all the sites. As WQSF RNEG flags allow for low negative values up to a defined threshold, pixels with negative satellite reflectance between 400 nm and 442 nm are also masked for BEFR, MAFR and LPAR.
In situ measurements for each satellite band were extracted as the HYPSTAR® L2 reflectances convoluted using the mean spectral response function for each Sentinel-3 mission (https://sentinels.copernicus.eu/web/sentinel/technical-guides/sentinel-3-olci/olci-instrument/spectral-characterisation-data, accessed on 8 April 2024) without applying the NIR similarity spectrum correction for the validation of sites with highly turbid waters (i.e., MAFR, LPAR and M1BE).
In situ and satellite matchup data are provided in Supplementary Data Sheet S8.
Reduced Major Axis (RMA) regression lines and squared correlation coefficients,
4.3 Phytoplankton monitoring time series
Reflectance data from the autonomous systems were used to derive phytoplankton parameters in Belgian North Sea waters over the spring-summer season in 2020 (PANTHYR at Oostende, O1BE, Supplementary Data Sheet S9) and 2023 (HYPSTAR® at Zeebrugge_MOW1, M1BE, Supplementary Data Sheet S10). In this region, Phaeocystis globosa is considered as a non-toxic but undesirable phytoplankton species because of the unsightly and sometimes dangerous (Philippart et al., 2020) generation of foam, and because the gelatinous mucus has potential impact on species composition at higher trophic levels (Rousseau et al., 2000).
Chlorophyll a concentration (Chl-a hereafter) was calculated using the CRAT method (Ruddick et al., 2001) from reflectance spectra (without SimSpec correction) that have passed quality control. This algorithm, designed for hyperspectral data, is based on the red-NIR reflectance spectrum but contrary to typical semi-analytical red-edge algorithms it avoids calculation of NIR backscattering for moderate-high Chl-a (>13.45 μg/L). This algorithm is less suitable for low Chl-a, but is relevant for the bloom events considered here.
Two indices for P. globosa were calculated from reflectance spectra based on existing algorithms which are described in detail in the cited papers, and briefly summarised here.
The Lubac Index (LI), defined in (Lubac et al., 2008), is a binary algorithm (yes/no) indicating if the phytoplankton assemblage is dominated by P. globosa, and is based on the shape of the second derivative reflectance spectrum between 420 and 560 nm. The second derivative was calculated following the formulation described by (Lubac et al., 2008; Lavigne et al., 2022) for intervals of 2.5 nm for the PANTHYR data and of 1 nm for the HYPSTAR® data. Before making the second derivative calculation, ρw spectra were smoothed to avoid strong outliers in the second derivative. A five-point window (12.5 nm) running average was applied to all PANTHYR spectra, and a nine-point window (8 nm) running average was applied 3 times to all HYPSTAR® data.
The Modified Astoreca Line Height index (MALH), defined in (Lavigne et al., 2022), and based on prior work by (Astoreca et al., 2009) is a line height difference algorithm (Eq. 6) measuring the absorption anomaly at
where
Finally, because MALH depends on the concentration of P. globosa, the ratio MALH/Chl-a is calculated as a proxy for the P. globosa fractional contribution to phytoplankton absorption. This ratio is calculated from the slope of linear regressions between MALH and Chl-a data available 48 h before and after the measurement date. Hence, a positive value suggests a high fraction of P. globosa in the phytoplankton community, and a negative value a low fraction of P. globosa. When the regression slope was not significant (p-value ≤5%) results are shown in grey.
5 Results
5.1 Validation of Sentinel-2 (A&B) by PANTHYR deployments at Acqua Alta and Oostende sites
The scatterplots comparing Sentinel-2 (A&B) water-leaving radiance reflectance with matchup PANTHYR in situ measurements from the Acqua Alta (VEIT) and Oostende (O1BE) validation sites are shown in Figure 5 for selected spectral bands. Scatterplots for all spectral bands can be found in Supplementary Data Sheet S3. Results for Sentinel-2A and Sentinel-2B were very similar, and are presented together in this scatterplot. The results shown in Figure 5 are quite different for the two validation sites, suggesting different algorithm performance issues for the different turbidity ranges (Acqua Alta moderately turbid, Oostende highly turbid).
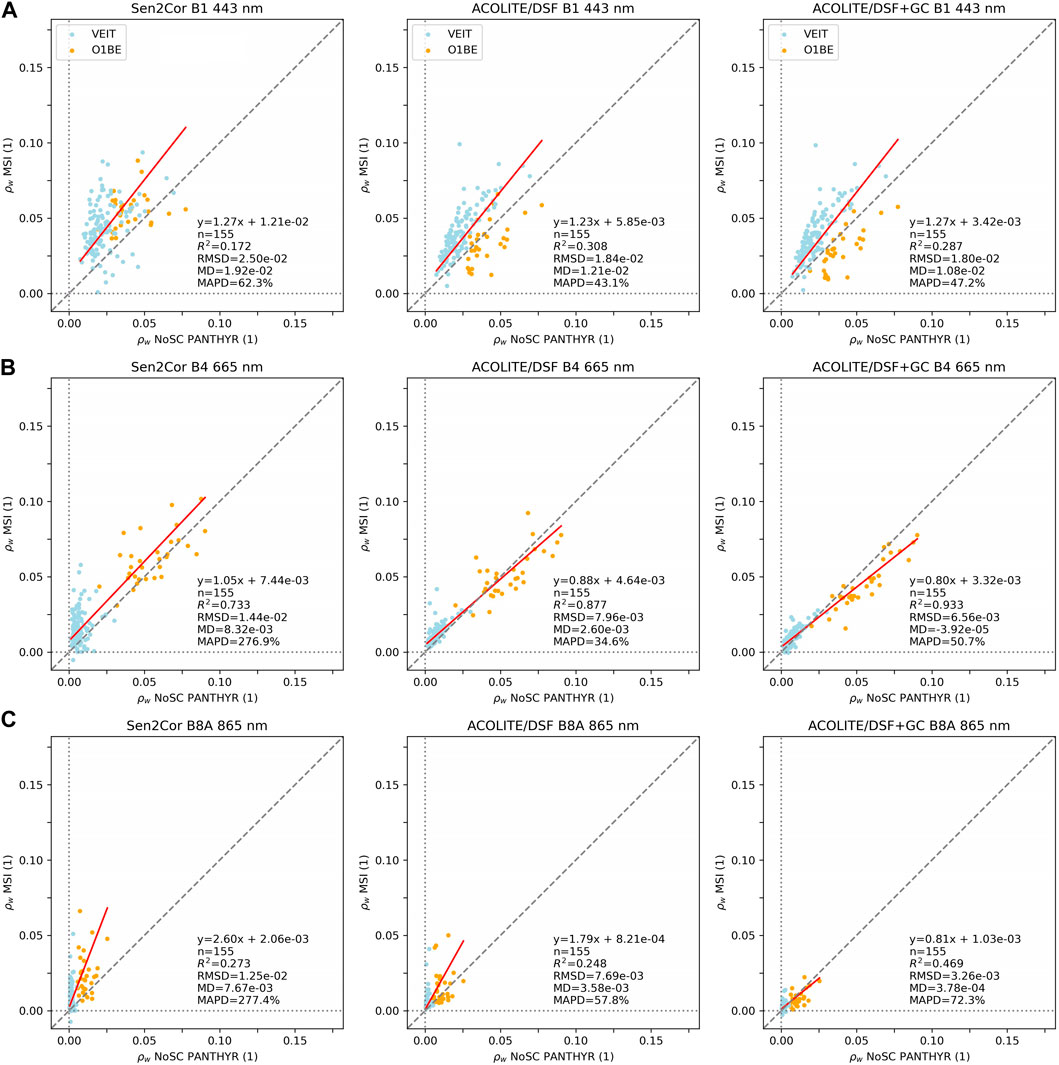
Figure 5. Scatterplot of Sentinel-2 (A&B) satellite (y-axis) and PANTHYR in situ (x-axis) water-leaving radiance reflectance measurements for 155 matchups at the Acqua Alta (VEIT: 124 blue points) and Oostende (O1BE: 31 orange points) validation sites for three bands: (A) 443 nm, (B) 665 nm and (C) 865 nm. Satellite data processed by Sen2Cor (left column), ACOLITE_DSF (centre) and ACOLITE_DSF_GC (right column). The linear RMA regression line is shown in red with corresponding statistical metrics in text on each plot. Scatterplots for all other bands are available in Supplementary Data Sheet S3.
For the Sen2Cor processor, the vertical dispersion of points in these scatterplots, and strong positive bias (MD) at all wavelengths with a striking overestimation of ρw at 865 nm suggests a general underestimation of aerosol reflectance and/or uncorrected sunglint–this is not surprising for an algorithm which is designed for atmospheric correction over land, taking aerosol optical thickness from dense dark vegetation (if present in scene) or from the fall-back external meteorological data (CAMS) and with no sunglint, or even skyglint, correction.
For the ACOLITE_DSF processor, without sunglint correction, results are improved somewhat compared to Sen2Cor with reduction of the positive bias (MD) at all bands, suggesting better estimation of aerosol reflectance, but with many positively biased outliers, most obvious at 865 nm, where the expected and in situ measured ρw is systematically low, especially at Acqua Alta.
For the ACOLITE_DSF_GC processor, with a sunglint correction, many of those positively biased outliers are now well-corrected at 865 nm, but little difference is found at 443 nm.
The spectral RMSD between Sentinel-2 (A&B) and PANTHYR measurements at Acqua Alta and Oostende for these matchups is shown in Figure 6. The general decrease of RMSD with increasing wavelength for the Sen2Cor and ACOLITE_DSF_GC processors is quite different from the “water-like” RMSD spectrum found in a validation study in the La Plata estuary - see Figure 4A of (Dogliotti et al., 2023). The RMSD spectrum of Figure 6 is typical of situations where the dominant error source is imperfect correction of atmospheric path reflectance (aerosols and/or Rayleigh)–see Figure 9 of (Vanhellemont and Ruddick, 2021) and associated discussion in that paper for similar experience with atmospheric correction of Sentinel-3/OLCI. This error is greater for Sen2Cor as discussed above. Interestingly, comparison of ACOLITE_DSF with ACOLITE_DSF_GC in Figure 6 shows that the sunglint correction has successfully reduced RMSD for 665–865 nm but not for 443–560 nm. This suggests that the remaining dominant error for ACOLITE_DSF_GC is related to atmospheric path reflectance but not sunglint. From the ACOLITE_DSF_GC 443 nm scatterplot in Figure 5 it seems that the atmospheric path reflectance error is positively biased for the Acqua Alta site but negatively biased for the Oostende site. The leading hypotheses for these biases are:
• ACOLITE_DSF_GC gives positively biased ρw
• ACOLITE_DSF_GC gives negatively biased
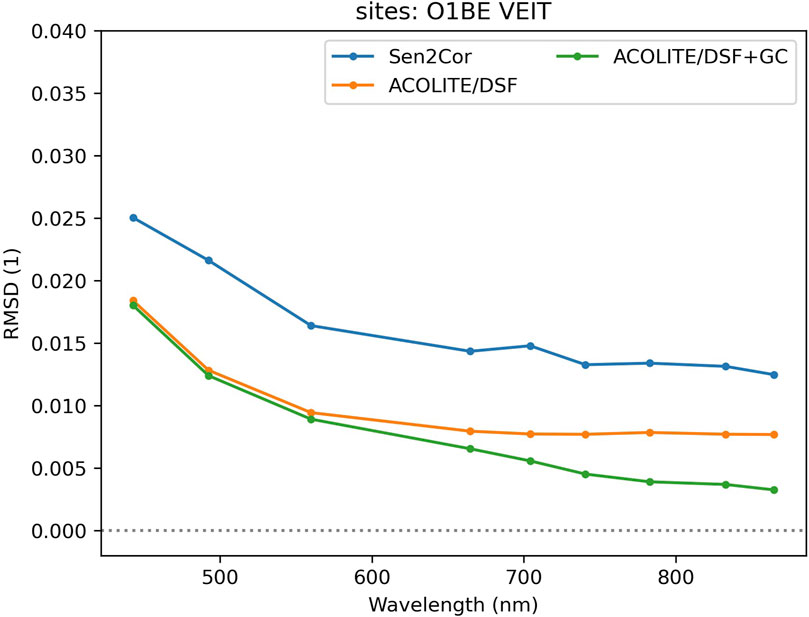
Figure 6. Root mean squared difference (RMSD) between Sentinel-2 (A&B) and WATERHYPERNET/PANTHYR measurements at Acqua Alta (VEIT) and Oostende (O1BE) as a function of wavelength for the 155 matchups shown in Figure 5.
Full testing of these hypotheses is beyond the scope of the present paper, which serves to demonstrate the usefulness of WATERHYPERNET in situ measurements in general and specifically to provide clues to how Sentinel-2 data quality might be improved when using ACOLITE_DSF.
In addition to the abovementioned biases, the scatterplots of Figure 5 suggest an important number of outlier cases. Validation outliers are not always studied in detail, particularly when there are a large number of matchups. However, these outliers contain very important information on the real quality of satellite data that reach end-users as well as vital clues on how to improve processing. While some of the outliers for Sen2Cor and ACOLITE_DSF can be attributed to the lack of a sunglint correction, many outliers remain in the ACOLITE_DSF_GC processing.
We define here “outlier” as a matchup where the difference between satellite and in situ exceeds the RMSD difference over all matchups for that site, i.e.,
• Surface reflectance,
• Surface reflectance,
• Surface reflectance,
• Top Of Atmosphere (TOA) reflectance,
• Top Of Atmosphere (TOA) reflectance,
All outliers were positively biased at
Figure 7 shows an example Validation Diagnostic sheet for the matchup with Sentinel-2/A acquisition over Acqua Alta (VEIT) on 2022-11-21T10:03:44. Inspection of the
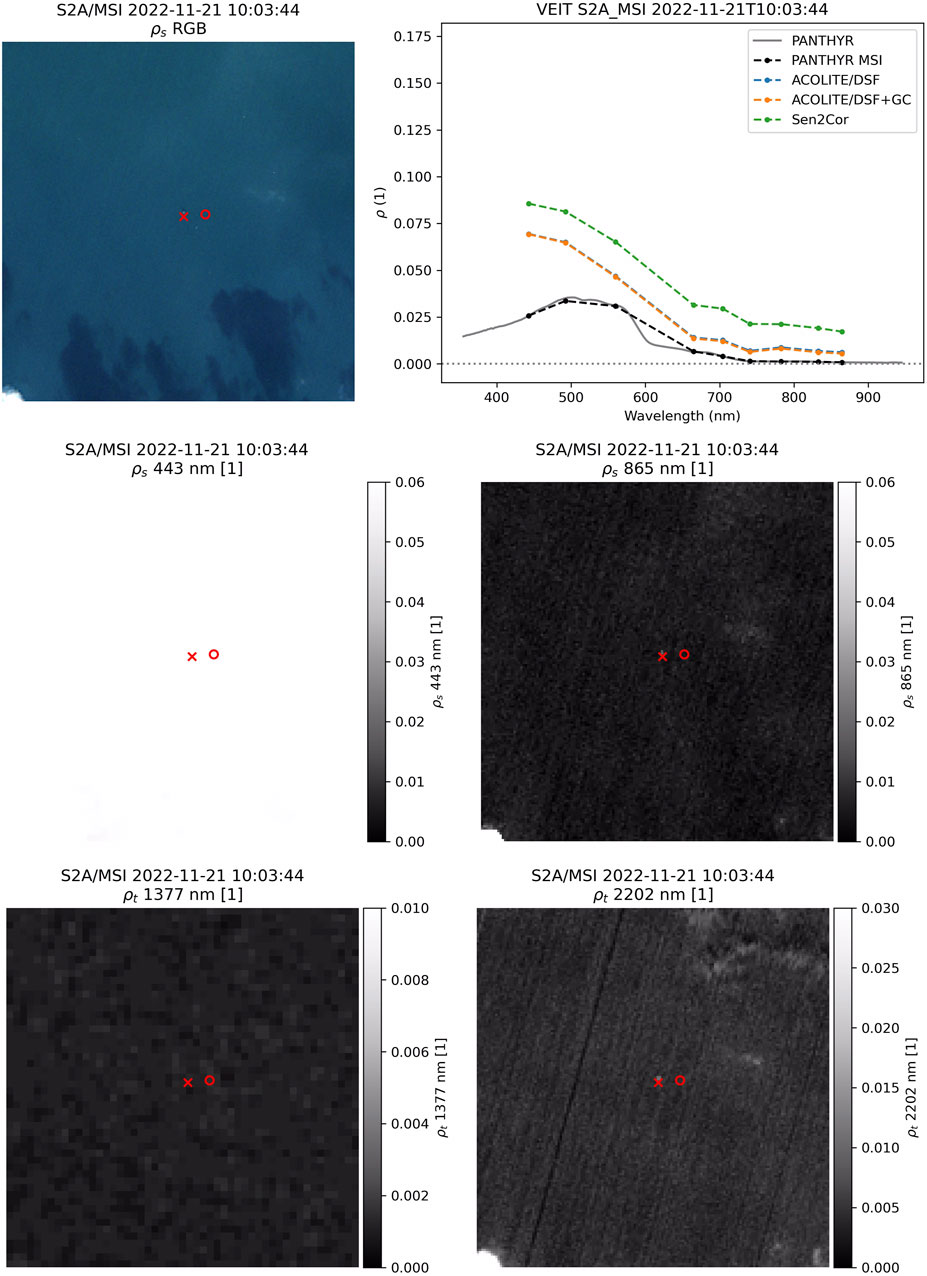
Figure 7. Validation Diagnostics sheet for the matchup with Sentinel-2/A acquisition over Acqua Alta (VEIT) on 2022-11-21T10:03:44, showing the 3 km*3 km ROI (top-left) Surface reflectance RGB composite (665 nm, 560 nm, 443 nm); (top-right) spectral plot comparing
Figure 8 shows an example Validation Diagnostic sheet for the matchup with Sentinel-2/A acquisition over Oostende (O1BE) on 2022-06-12T10:59:33. Inspection of the
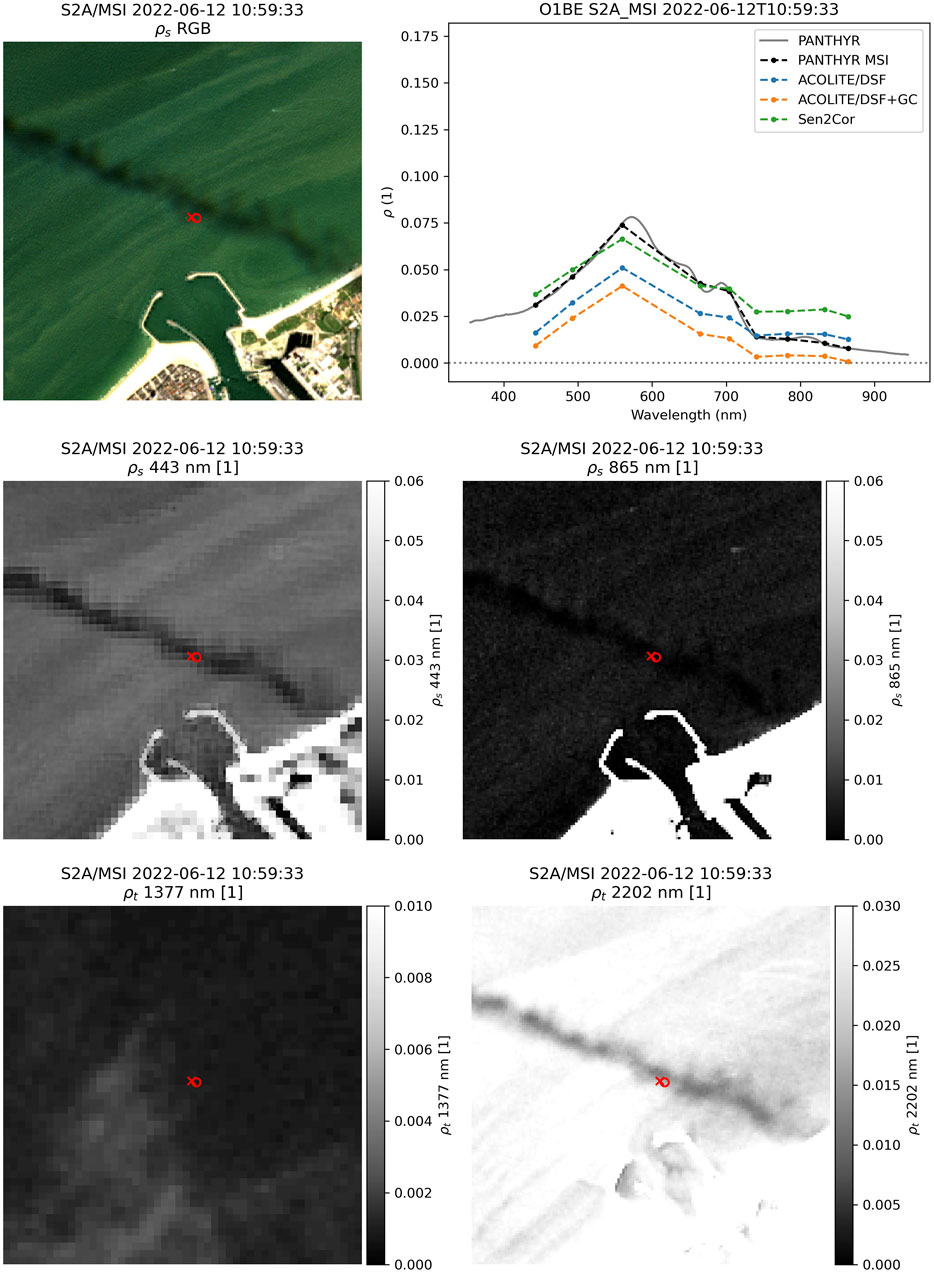
Figure 8. Validation Diagnostics sheet for the matchup with Sentinel-2/A acquisition over Oostende (O1BE) on 2022-06-12T10:59:33. Same plot content as in Figure 7.
On the basis of this subjective expert analysis, the hypotheses for all outliers are:
• For VEIT, 37/40 outlier cases it is thought that the AOT used at the validation pixel is too low, although the underlying reason can be diverse, and is sometimes unclear. The dark pixel may be “too dark”, e.g., because of sensor noise, a darker than average wave facet, cloud shadowing of the atmosphere, etc., or the validation pixel may have a brighter atmosphere/interface than the dark pixel, e.g., because of patchy haze or undetected thin clouds. In 3/40 outlier cases, the cause of the outlier is difficult to discern. In 38/40 outlier cases (and most non-outlier cases) the DSF approach uses the 865 nm band (8A) for the dark pixel.
• For O1BE, 2/11 cases with the validation pixel in a cloud shadow and 9/11 cases where it is suspected that the dark pixel is not black enough because of thin clouds (including cirrus) and/or glint and/or water reflectance (when the 443 nm is used for the DSF). In 8/11 cases the DSF approach uses the 865 nm band (8A) for the dark pixel, with the 443 nm band (1) used in the other 3/11 cases.
5.2 Validation of Sentinel-3/OLCI (A&B) by HYPSTAR® deployments at Acqua Alta, Lake Garda, Etang de Berre, Gironde, La Plata and Zeebrugge sites
Figure 9 shows the scatterplot of matchups between Sentinel-3_OLCI/A&B Level 2 Water Full Resolution (WFR) and the HYPSTAR® deployments at six sites (VEIT, GAIT, BEFR, MAFR, LPAR and M1BE, see Section 4.2) for each individual band and grouped by satellite sensor.
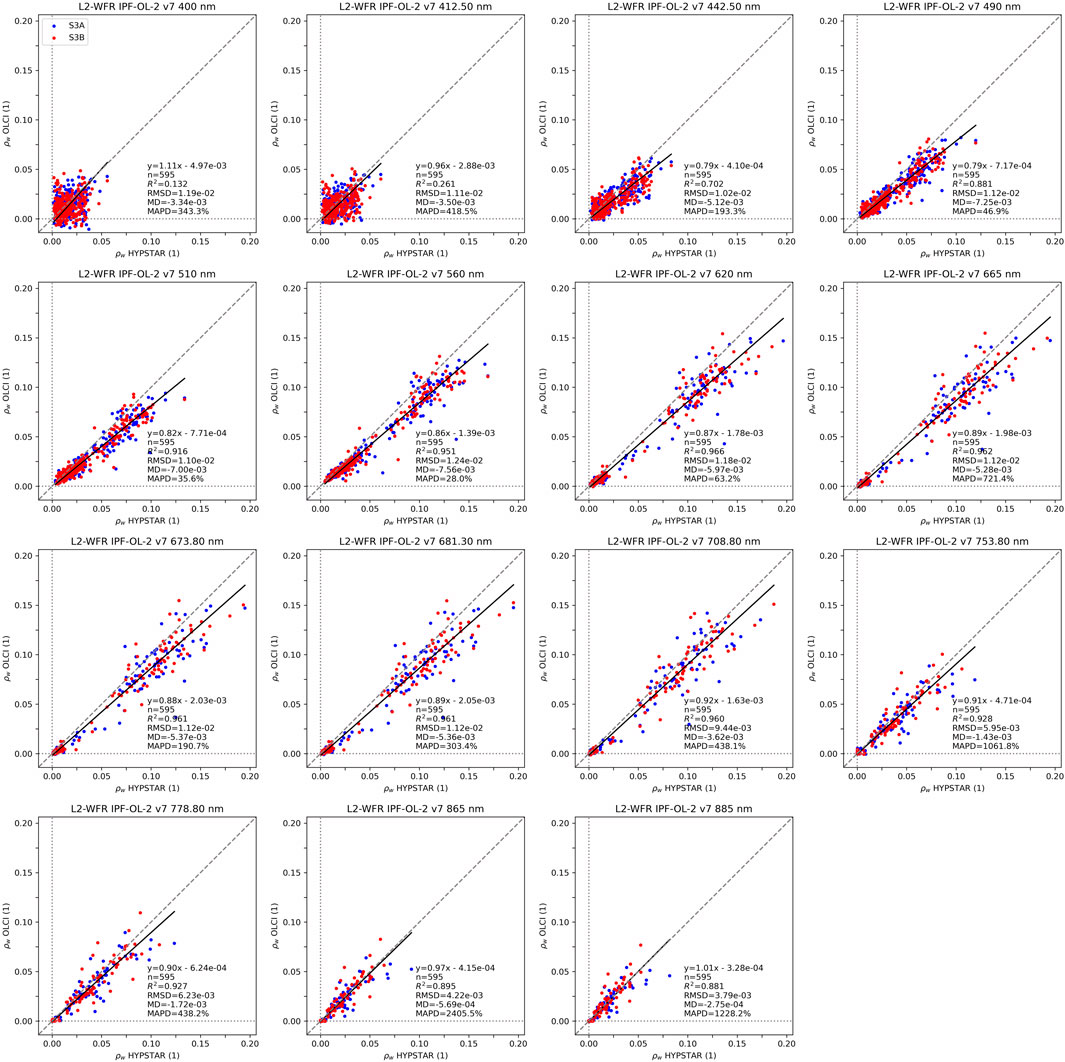
Figure 9. Scatterplots of matchups between OLCI sensor of Sentinel-3A (blue) and Sentinel-3B (red) for Acqua Alta (VEIT), Lake Garda (GAIT), Etang de Berre (BEFR), Gironde (MAFR), La Plata (LPAR) and Zeebrugge (M1BE) sites.
Overall, better fits were achieved between 490 nm and 885 nm (
The spectral shape of the bias (MD) and RMSD (Figures 10B, C) for 442–885 nm is similar to a turbid water reflectance spectrum. While some atmospheric correction algorithms have uncertainty which can be proportional to water reflectance, this is not expected for the WFR algorithm, suggesting that this difference may be dominated in the range 442–885 nm either by a systematic in situ measurement error or by space (or, less likely, time or angular) differences between the satellite and the in situ measurement. Both satellite sensors show similar performance.
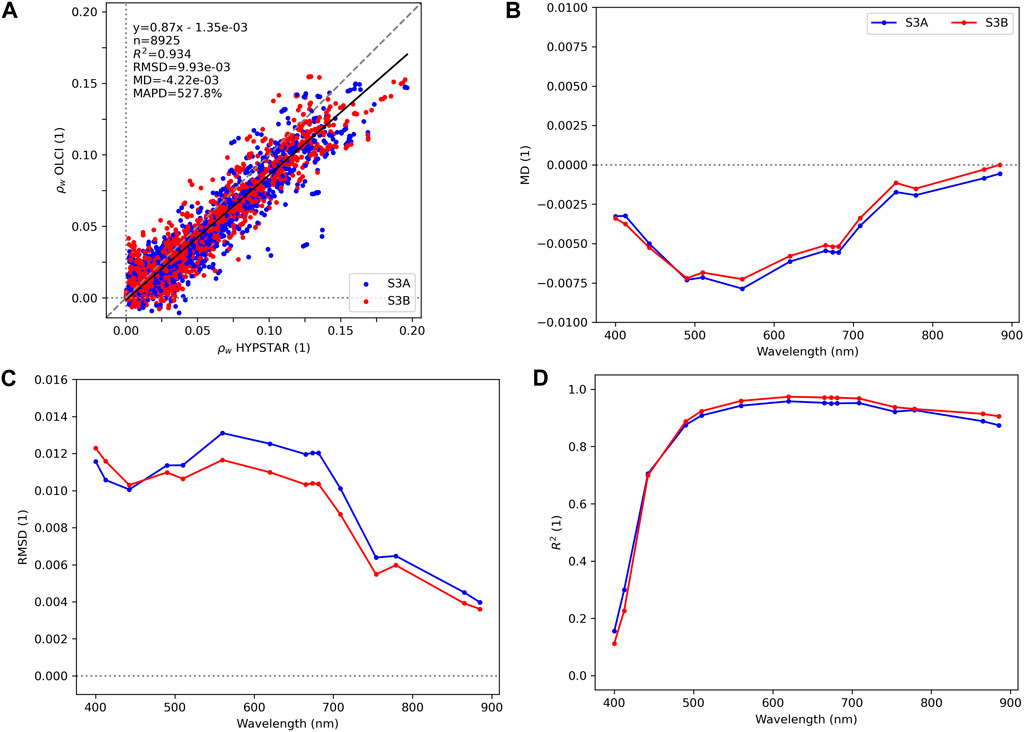
Figure 10. (A) Scatter plot of
The global scatter plot of matchups of Sentinel-3_OLCI/A&B Level 2 and HYPSTAR® including all the bands is shown in Figure 10A. There is an overlap of data points from both sensors, with a good fit and high correlation (
The number of valid matchups (whole spectra) from both sensors was very similar (S3A: 295, S3B: 300), as well as the global metrics including all the bands (Table 3). Spectral variation metrics (Figures 10B–D) follow similar patterns for both S3A and S3B. In fact, RMSD and bias (MD) differences between both satellites are always lower than 0.0006 and 0.0002, respectively. The single satellite metric values are also close to those obtained combining both sensors (see R2 and MD in Table 3).
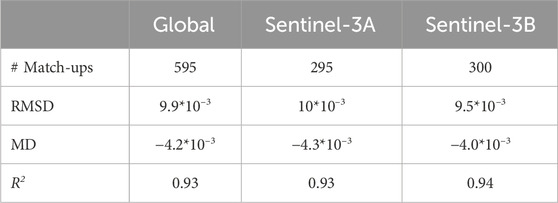
Table 3. Validation statistics for matchups between OLCI sensor of Sentinel-3A and Sentinel-3B for Acqua Alta (VEIT), Lake Garda (GAIT), Etang de Berre (BEFR), Gironde (MAFR), La Plata (LPAR) and Zeebrugge (M1BE) sites.
This analysis is reassuring as to the interoperability of the A and B units of the Sentinel-3/OLCI constellation, achieved by good harmonisation of space hardware and ground processing elements, and for the satellite ρw in the NIR bands 709–885 nm. For the spectral range 442–681 nm a better understanding is needed of in situ measurement uncertainty before conclusions can be drawn on the atmospheric correction algorithm performance.
5.3 Phytoplankton monitoring from PANTHYR and HYPSTAR® measurements in Belgian coastal waters
Although designed for the launching application of satellite validation, the WATERHYPERNET data can be used without satellite data for single point monitoring of water quality parameters, including phytoplankton.
Figure 11 shows a time series of phytoplankton parameters derived from the PANTHYR data at Oostende (O1BE) in 2020, extended from the previous analysis of Figure 5 of (Lavigne et al., 2022) to include MALH per unit chlorophyll a as a biomass-independent indicator of species fraction of P. globosa. The striking difference in MALH between the end-April/beginning-May bloom (positive
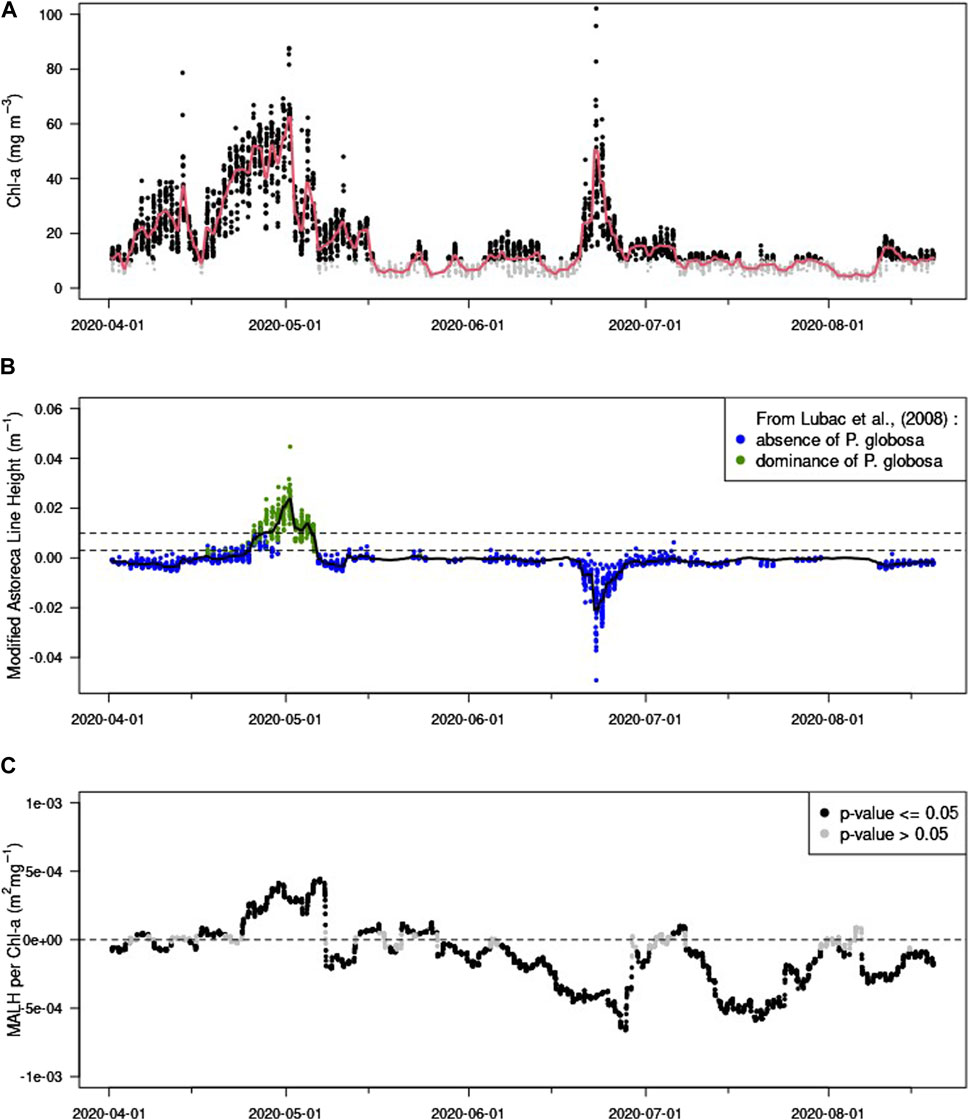
Figure 11. Time-series of phytoplankton parameters from the PANTHYR at Oostende (O1BE) for April-August 2020. (A) Chl-a concentration estimated from the CRAT algorithm (black dots, with concentrations <13.45 μg/L in grey) with daily mean (red line); (B) Phaeocystis globosa indicators: MALH on y-axis with suggested >0.01 threshold for presence and <0.003 for absence, together with point colouring from the LI flag and daily mean (solid black line); (C) MALH per unit Chl-a obtained by regression over a rolling 5-day window with point colouring according to significance of regression slope (p-value).
Figure 12 shows a similar time series of phytoplankton parameters, but now derived from the HYPSTAR® data at Zeebrugge (M1BE) in 2023. In this dataset, the phytoplankton blooms are less strong, and the MALH shows fewer positive values, although MALH, LI and MALH/Chl-a all indicate a phytoplankton bloom dominated by P. globosa in early/mid-Apr.
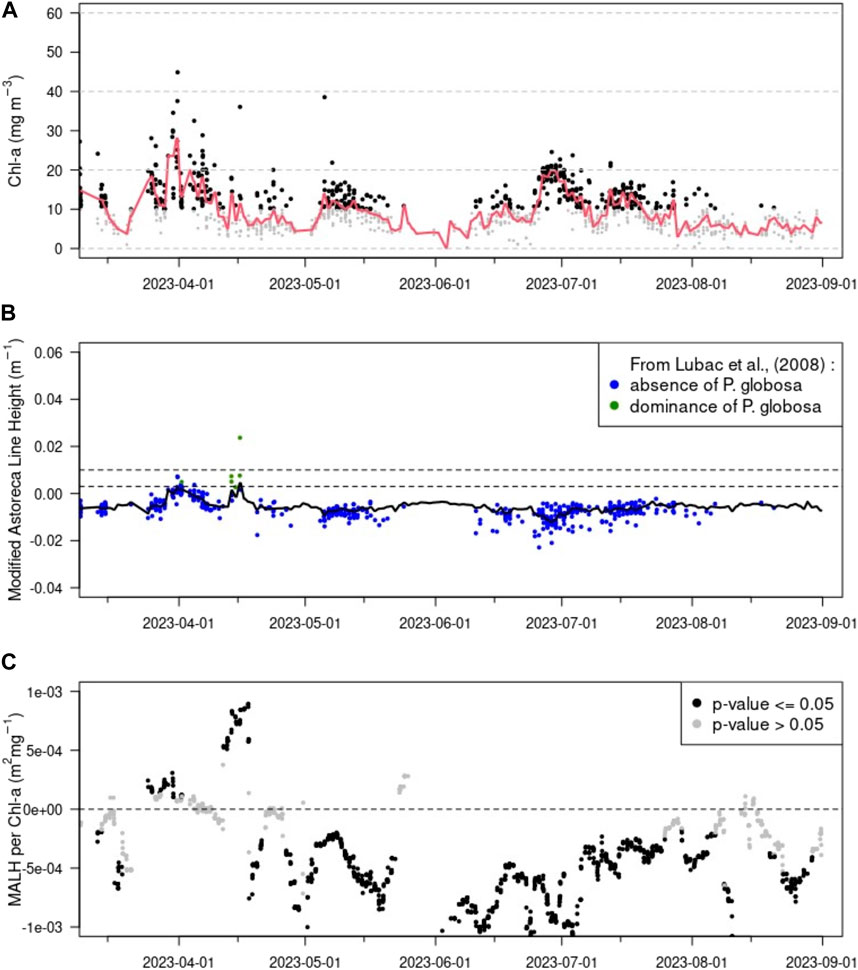
Figure 12. Time-series of phytoplankton parameters from the HYPSTAR® at Zeebrugge (M1BE) for Mar-August 2023. Details as for Figure 11.
While the MALH algorithm was originally designed (Astoreca et al., 2009) and refined (Lavigne et al., 2022) for application to hyperspectral satellite data, and the WATERHYPERNET network was designed for validation of satellite data, these time series of in situ measurements both reinforce the expected potential of future hyperspectral satellite data, and raise the possibility of using standalone WATERHYPERNET data for single-point time series of water quality parameters. A similar study showed the potential for using HYPSTAR® data for detecting the presence of cyanobacteria in a drinking water reservoir (Goyens et al., 2022).
6 Discussion
6.1 Summary of demonstration cases
The results of Section 5.1 comparing PANTHYR data from Oostende and Acqua Alta with Sentinel-2 data show that:
• The ACOLITE_DSF atmospheric correction algorithm performs better than the Sen2Cor atmospheric correction (designed for land, but still the only standard Sentinel-2 product for coastal waters) for all spectral bands, for both clear and turbid waters (Figure 5; Figure 6).
• The ACOLITE_DSF_GC atmospheric correction with SWIR-based sunglint correction performs better than ACOLITE_DSF (with no sunglint correction), but only for red and near infrared wavelengths (665–865 nm) - see Figure 6. For shorter wavelengths (443–560 nm) the GC makes little difference to the RMSD over 155 matchups. This suggests that the dominant error source in satellite data processing when using ACOLITE_DSF_GC is not inadequate sunglint correction. The spectral shape of the RMSD between satellite and in situ reflectance suggests that the dominant error source is related to atmospheric path reflectance, probably associated with the aerosol correction, but the possibility of inaccurate Rayleigh or coupled Rayleigh-aerosol corrections (including air-water interface reflection) cannot be excluded.
• Detailed analysis of the biggest outliers for each site suggests quite different problems for the satellite data processing in clear versus turbid waters.
• For Oostende the negative bias of satellite data and the detailed inspection of the outlier matchups suggest in most cases that the ACOLITE_DSF(_GC) algorithm does not find a dark pixel-wavelength with sufficiently low surface reflectance, thus leading to an overestimation of aerosol reflectance and underestimation of ρw. Processing for this region could be improved by including SWIR wavelengths in the dark pixel-wavelength search algorithm, provided sufficient filtering is applied to reduce noise in those bands.
• For Acqua Alta, the positive bias of satellite data and the detailed inspection of the outlier matchups suggest that the AOT used at the validation pixel is too low, although the underlying reason can be diverse, and is sometimes unclear. The dark pixel may be “too dark”, darker than the average atmospheric path reflectance over the 3*3 km ROI, e.g. because of sensor noise, a darker than average wave facet, cloud shadowing of the atmosphere, etc. Alternatively, the validation pixel may have a brighter atmosphere/interface than the dark pixel, e.g. because of patchy haze or undetected thin clouds.
• For both sites some outliers are seen to result from thin unmasked clouds, especially cirrus with TOA reflectance at 1.3 µm just less than the masking threshold of 0.005, and/or from cloud edges. Occasional cloud shadows, including the shadows of clouds outside the ROI, can give negative outliers. For these situations, the atmospheric correction algorithm performance statistics could be improved by better cloud and cloud shadow masking algorithms (Lebreton et al., 2016) and stricter thresholds for cirrus and non-water pixels, although the latter will lead to a removal of data that may be of interest for some users/applications.
• For both sites, imagery of ρw shows in some cases surface wave effects, suggesting that these have not been perfectly removed by ACOLITE_DSF_GC, the best-performing satellite data processing algorithm of those tested here.
• The large number of matchups provided by WATERHYPERNET, and the automation of the validation analysis, including a standard Validation Diagnostic sheet per matchup, is clearly essential for validation of Sentinel-2 ρw, and consequently establishing confidence in downstream products for users, and providing recommendations for how to further improve the processing algorithm, here ACOLITE_DSF_GC.
• While the use of two contrasting validation sites provided very different and relevant information on satellite algorithm performance the analysis should be expanded to more validation sites in a future operational context.
The results of Section 5.2 comparing HYPSTAR® data from six validation sites with Sentinel-3 data show that:
• Reasonable results are achieved at all spectral bands (RMSD<0.014) with very similar performance for the A and B units of the Sentinel-3/OLCI, confirming that good interoperability of the constellation has been achieved by harmonisation of space hardware and ground processing elements.
• While in situ and satellite measurements agree well for the range 709-885 nm (regression slope between 0.9 and 1.0, RMSD<0.01) a more systematic difference is found for the range 490-681 nm (R2>0.88 but regression slope between 0.79 and 0.89) where the RMSD has the spectral shape of turbid water reflectance. An explanation of this difference requires further study of the in situ measurements themselves, the satellite processing algorithm (including intermediate parameters such as aerosol Angstrom exponent), and any space-time differences between the satellite and the in situ measurement.
The results of Section 5.3 using the PANTHYR and HYPSTAR® data in Belgian waters (without satellite data), as a follow-up of work by (Lavigne et al., 2022), show that:
• Phytoplankton biomass and some information on dominant species (here Phaeocystis globosa) can be monitored at high frequency from these hyperspectral data.
This finding is of interest both in its own right for pointwise monitoring of water quality, and as a precursor for information that might be retrieved from the new generation of hyperspectral satellite missions (Dierssen et al., 2020), provided that the treatment of sub-resolution scale spectral features such as absorbing atmospheric gases renders second derivative spectra of adequate quality (Ruddick et al., 2023).
6.2 Discussion of WATERHYPERNET status and future
This paper has described the WATERHYPERNET, a federated network of automated in situ measurements of hyperspectral water reflectance designed for satellite validation. The medium-term ambition is to provide a sufficient quantity of high quality water reflectance data over sufficiently diverse water, atmosphere and Sun conditions to satisfy the needs for radiometric validation of all VIS/NIR (380–900 nm) spectral bands of all current and future optical satellite missions used for aquatic applications. The list of satellite missions expected to use WATERHYPERNET data is long, and includes: dedicated “water colour” missions such as Sentinel-3A&B (&C&D), MODIS, VIIRS; “land” missions repurposed for coastal and inland water applications such as Sentinel-2A&B (&C&D) and Landsat 8&9; recent and future hyperspectral missions such as PRISMA, ENMAP PACE … CHIME, SBG and the geostationary GLIMR; and the emerging “Newspace” cubesat constellations pioneered by the PlanetScope Doves and Superdoves.
The network is currently at the stage of a proof-of-concept prototype, with two functioning hardware systems, PANTHYR and HYPSTAR®, automated data acquisition, transmission and processing of data and demonstration datasets. Although significant improvements are expected in the next 2 years with evolution of the in situ data processing, particularly regarding quality control and estimation of measurement uncertainties, the prototype datasets are already considered by satellite validation/performance team users to be relevant for showing some performance issues and by water quality managers for describing phytoplankton dynamics, including some indication of species composition.
6.3 Possibilities and limitations
The validation sites described here constitute a network with reasonable coverage of water and atmosphere conditions where satellite data need to be validated (i.e., everywhere where end-users use final products), including clear and turbid waters, coastal and inland waters, various phytoplankton species, low and moderate Coloured Dissolved Organic Matter (CDOM) absorption, various Sun zenith, cloud and wind conditions, etc. A very complete network could be achieved with 20 appropriately chosen validation sites, although the choice of site is clearly limited by availability of funding, dedicated local scientist(s) and stable mounting platforms. Moreover, the current sites can be affected by occasional and/or long-term downtime associated from diverse causes (hardware failures, recalibration of radiometers, platform and/or ship crew availability, funding, etc.).
If the network manager could choose where to locate additional validation sites it would be relevant to add: better coverage of the Southern hemisphere (for satellite commissioning phases occurring in the Northern hemisphere winter), one or two sites at very high latitude (e.g., >70° to validate for the difficult high zenith angles and high air masses but with increased acquisitions/week), one or two sites at low latitudes (e.g., <30° to validate for the difficult high sunglint conditions), one or more very nearshore/inland/high altitude sites for testing adjacency effect removal and atmospheric pressure (and hence Rayleigh scattering) differences, one or two sites with very high CDOM and better longitudinal coverage (e.g., over the West and East coasts of North or South America and over Western and Eastern Asia to provide validation data for geostationary satellites). However, it is likely that the siting of additional validation sites will be more opportunistic (related to national funding and individual motivated scientists) than strategic.
6.4 Challenges and opportunities
The main challenges in establishing and consolidating a network such as WATERHYPERNET are organizational (funding, governance/coordination) and hardware-related. The equipment used here consists of one system (PANTHYR) based on a mature/aging COTS radiometer and COTS pan-tilt with non-commercial assemblage of driving electronics and mechanics and one system (HYPSTAR®) with a newly-designed prototype radiometer and pre-commercial assembly of pan-tilt, host system PC and mechanics with some custom-designed elements (relay board, junction box/cabling). These systems can function autonomously for many months/years in the best cases, but are far from plug-n-play, requiring considerable expertise for preparation and installation and troubleshooting/repairs. The large number of components and the hostile environmental conditions combine to generate a wide range of low probability but high impact failure modes with difficult logistics (safety training and equipment, availability of transfer boats and crew and seaworthy specialized technical/scientific staff) for maintenance visits to most offshore sites.
Abovewater radiometry, led by the AERONET-OC network (Zibordi et al., 2009; Zibordi et al., 2021), is now established as the main source of in situ data for radiometric validation of water colour missions, and there is a growing expertise in laboratory calibration and characterization of hyperspectral radiometers (Talone et al., 2016; Zibordi et al., 2017; Talone and Zibordi, 2018; Vabson et al., 2019; Kuusk et al., 2024), and how to propagate the related uncertainties (Białek et al., 2020; De Vis et al., 2024). However, there are still two elements of the measurement method where the quantification of measurement uncertainties for each individual measurement result can be improved:
• Removal of light reflected at the air-water interface is currently implemented in WATERHYPERNET using the wind speed formulation for effective Fresnel coefficient of (Mobley, 1999), which is a common approach and corresponds to the recommendations of the IOCCG protocols (Zibordi et al., 2019). However, there are many known problems with this model - see Section 4 and Section 6.2 of (Ruddick et al., 2019) and references therein - and no clear consensus on the bias/uncertainty associated with this correction at moderate and high wind speed (>5 m/s), especially for the shorter wavelengths.
• The measurement bias/uncertainty associated with optical perturbations of the water target from the radiometer mounting structure, generally termed “platform perturbations” are not quantified for the WATERHYPERNET sites. An experimental determination of platform perturbations has been made only for the Acqua Alta AERONET-OC site (Talone and Zibordi, 2019) to our knowledge, but is needed for all WATERHYPERNET sites (including Acqua Alta since the deployment there is not located at the same position on the platform as the AERONET-OC deployment).
In addition to these aspects of the measurement method, the uncertainties relating to space, time and viewing angle differences between the in situ measurement and the satellite measurement need to be included for a full validation uncertainty analysis, although these are beyond the scope of WATERHYPERNET, which aims to estimate first the uncertainty of the WATERHYPERNET measurement for its own space, time and viewing angle coverage. For comparison between satellite and in situ data:
• Spatial differences between satellite and in situ measurements can be quantified using higher resolution satellite data, potentially multispectral or even very broadband, which could provide a site-dependent estimate of spatial differences as a function of satellite pixel size. Some validation sites should only be used for metre or decametre scale satellite validation.
• Temporal differences between satellite and in situ measurements can generally be quantified from the bounding WATERHYPERNET measurements in time since these are continuous (notwithstanding QC) and are often small because of the 20 min sampling frequency.
• Angular differences between satellite and in situ measurements require the use of “BRDF-correction” models (Morel and Gentili, 1996; Park and Ruddick, 2005; Lee et al., 2011). Since the latter are not (yet) mature and generic for all water types, the WATERHYPERNET approach will be, at least initially, to provide data in the acquisition geometry, and point to external tools if angular extrapolation is required by users.
As regards data processing, archiving and distribution and user support:
• The increase in number of sites and data volume will necessitate efficient storage, increased computing power, especially for the time-consuming uncertainty calculations, and careful automation, including exception handling.
• The transformation from evolving R&D project to maturing pre-operational service implies rigorous traceability and versioning including: instrument firmware, data acquisition software, data processing software and calibration and characterization data.
• Extension of the network to new site Principal Investigators (PI) and opening up of the datasets to the scientific community will increase the need for site PI and user support, including documentation, FAQ, online forum and individual responses.
6.5 Future perspectives
In this paper we describe the prototype of the WATERHYPERNET network, and demonstrate its utility for massively multi-satellite radiometric validation. Future work (next 2 years) will focus on:
• Keeping the existing validation sites running as far as possible, and adding a few new sites within the current hardware and human resource limits (especially radiometer manufacturing, calibration and characterization).
• Increasing uptime of validation sites with improvements to critical system components, diagnostics and troubleshooting procedures.
• Incremental improvements in automated and generic quality control of data, especially using experience and time series from these first deployments.
• Including air-water interface correction uncertainty in the quantification and output of measurement uncertainties for each measurement result (i.e., for each time and wavelength).
• Quantification of platform perturbations for each validation site/viewing azimuth/Sun zenith.
• Estimation of aerosol properties (optical thickness, Angstrom exponent) from the
• Recommendations for reference location (away from platform and from land/mixed pixels) to be used for comparison with satellite imagery and quantification of spatial variability as a function of length scale of satellite data pixel (Dogliotti et al., 2024).
• Near-real time public distribution of consolidated hyperspectral data from the whole network, with water reflectance data supplemented by radiance and irradiance data to facilitate spectral convolution of
Data availability statement
The original contributions presented in the study are included in the article/Supplementary Material. Further inquiries can be directed to the corresponding author.
Author contributions
KR: Conceptualization, Formal Analysis, Funding acquisition, Methodology, Project administration, Supervision, Validation, Visualization, Writing–original draft, Writing–review and editing. VB: Conceptualization, Formal Analysis, Funding acquisition, Investigation, Methodology, Project administration, Resources, Supervision, Validation, Visualization, Writing–original draft, Writing–review and editing. AC: Conceptualization, Investigation, Methodology, Resources, Software, Writing–review and editing. AD: Conceptualization, Funding acquisition, Investigation, Methodology, Project administration, Resources, Supervision, Validation, Writing–review and editing. DD: Conceptualization, Funding acquisition, Investigation, Methodology, Project administration, Resources, Software, Supervision, Validation, Writing–review and editing. CG: Conceptualization, Data curation, Funding acquisition, Investigation, Methodology, Project administration, Resources, Software, Supervision, Validation, Writing–original draft, Writing–review and editing. JK: Conceptualization, Investigation, Methodology, Project administration, Resources, Software, Supervision, Validation, Writing–review and editing. QV: Conceptualization, Data curation, Formal Analysis, Investigation, Methodology, Resources, Software, Validation, Visualization, Writing–original draft, Writing–review and editing. DV: Investigation, Methodology, Resources, Software, Writing–review and editing. AB: Conceptualization, Funding acquisition, Methodology, Project administration, Supervision, Validation, Writing–review and editing. PD: Conceptualization, Data curation, Methodology, Resources, Software, Writing–review and editing. HL: Formal Analysis, Investigation, Visualization, Writing–original draft, Writing–review and editing. MB: Investigation, Methodology, Resources, Writing–review and editing. KF: Methodology, Resources, Writing–review and editing. AG: Investigation, Methodology, Resources, Writing–review and editing. LG: Formal Analysis, Investigation, Methodology, Visualization, Writing–original draft, Writing–review and editing. KL: Conceptualization, Methodology, Resources, Software, Writing–review and editing. FO: Investigation, Resources, Writing–review and editing. PP: Investigation, Methodology, Resources, Software, Writing–review and editing. EP: Investigation, Methodology, Resources, Writing–review and editing. LR: Investigation, Methodology, Resources, Writing–review and editing. MS: Investigation, Writing–review and editing. DV: Investigation, Writing–review and editing.
Funding
The author(s) declare that financial support was received for the research, authorship, and/or publication of this article. This work was carried out in the context of: the H2020/HYPERNETS project funded by the European Union’s Horizon 2020 research and innovation programme (Grant agreement no. 775983), the HYPERNET-POP project funded by the European Space Agency (contract no. 4000139081/22/I-EF), and by the PICT-2020/2636 project funded by the ANPCyT.
Acknowledgments
The Copernicus programme of the European Union, the European Space Agency and EUMETSAT is acknowledged for the supply of Sentinel-2 and Sentinel-3 data.
The Escuela Naval Militar and Servicio de Hidrografía Naval (LPAR), POM West-Vlaanderen Blue Accelerator Platform (O1BE), C-POWER (TBBE), the Italian National Research Council (Acqua Alta Oceanographic Tower—VEIT) and het agentschap Maritieme Dienstverlening en Kust (M1BE) are thanked for hosting and supporting the WATERHYPERNET validation sites.
Over the last 6 years we have benefited from input, discussions and support from many colleagues from the H2020/HYPERNETS and FRM4SOC projects and related activities and we thank particularly: Giuseppe Zibordi, Nigel Fox, Sam Hunt, Ilmar Ansko, Viktor Vabson, Kim Duong, Riho Vendt, Claudia Giardino, Mariano Bresciani, Salvatore Mangano, Javier A. Concha, André Cattrijsse, Daniel Spengler, Edouard Leymarie, Christope Penkerc’h, Erwin Goor, Miroslaw Darecki, Craig Donlon, Tania Casal, Ewa Kwiatkowska, Juan Gossn, Philippe Goryl, Kevin Alonso Gonzalez and Fabrizio Niro. Acknowledgement of these individuals does not constitute endorsement of or responsibility for the content of this work but is merely an expression of thanks.
Two reviewers are thanked for their careful reading and constructive suggestions.
Conflict of interest
Co-authors from Tartu University and Sorbonne University may benefit from future commercialisation of the HYPSTAR® radiometer and system. All authors are likely to receive future research funding for WATERHYPERNET data acquisition and/or exploitation. The authors declare that these interests do not affect the statements and findings of this paper, which has been written according to the normal scientific ethics and values of the academic community. The authors declare that the research was conducted in the absence of any other commercial or financial relationships that could be construed as a potential conflict of interest.
The author(s) declared that they were an editorial board member of Frontiers, at the time of submission. This had no impact on the peer review process and the final decision.
Publisher’s note
All claims expressed in this article are solely those of the authors and do not necessarily represent those of their affiliated organizations, or those of the publisher, the editors and the reviewers. Any product that may be evaluated in this article, or claim that may be made by its manufacturer, is not guaranteed or endorsed by the publisher.
Supplementary material
The Supplementary Material for this article can be found online at: https://www.frontiersin.org/articles/10.3389/frsen.2024.1347520/full#supplementary-material
References
Alonso, K., Bachmann, M., Burch, K., Carmona, E., Cerra, D., De los Reyes, R., et al. (2019). Data products, quality and validation of the DLR earth sensing imaging spectrometer (DESIS). Sensors 19 (20), 4471. doi:10.3390/s19204471
Arabi, B., Salama, M. S., Wernand, M. R., and Verhoef, W. (2018). Remote sensing of water constituent concentrations using time series of in-situ hyperspectral measurements in the wadden Sea. Remote Sens. Environ. 216 (October), 154–170. doi:10.1016/j.rse.2018.06.040
Astoreca, R., Rousseau, V., Ruddick, K., Knechciak, C., Van Mol, B., Parent, J.-Y., et al. (2009). Development and application of an algorithm for detecting Phaeocystis globosa blooms in the case 2 Southern North Sea waters. J. Plankton Res. 31 (3), 287–300. doi:10.1093/plankt/fbn116
Banks, A. C., Vendt, R., Alikas, K., Bialek, A., Kuusk, J., Lerebourg, C., et al. (2020). Fiducial reference measurements for satellite ocean colour (FRM4SOC). Remote Sens. 12 (8), 1322. doi:10.3390/rs12081322
Białek, A., Douglas, S., Kuusk, J., Ansko, I., Vabson, V., Vendt, R., et al. (2020). Example of Monte Carlo method uncertainty evaluation for above-water ocean colour radiometry. Remote Sens. 12 (5), 780. doi:10.3390/rs12050780
Braga, F., Fabbretto, A., Vanhellemont, Q., Bresciani, M., Giardino, C., Scarpa, G. M., et al. (2022). Assessment of PRISMA water reflectance using autonomous hyperspectral radiometry. ISPRS J. Photogrammetry Remote Sens. 192 (October), 99–114. doi:10.1016/j.isprsjprs.2022.08.009
Brando, V., Lovell, J., King, E., Boadle, D., Scott, R., and Schroeder, T. (2016). The potential of autonomous ship-borne hyperspectral radiometers for the validation of Ocean Color radiometry data. Remote Sens. 8 (2), 150. doi:10.3390/rs8020150
Brown, S. W., Flora, S. J., Feinholz, M. E., Yarbrough, M. A., Houlihan, T., Peters, D., et al. 2007. The marine optical buoy (MOBY) radiometric calibration and uncertainty budget for Ocean color satellite sensor vicarious calibration. Proc. SPIE 6744, Sensors, Systems, and Next-Generation Satellites XI, 67441M. doi:10.1117/12.737400
Burggraaff, O. (2020). Biases from incorrect reflectance convolution. Opt. Express 28 (9), 13801–13816. doi:10.1364/OE.391470
Carswell, T., Costa, M., Young, E., Komick, N., Gower, J., and Sweeting, R. (2017). Evaluation of MODIS-AQUA atmospheric correction and chlorophyll products of western North American coastal waters based on 13 Years of data. Remote Sens. 9 (10), 1063. doi:10.3390/rs9101063
Castagna, A., Johnson, B. C., Voss, K., Dierssen, H. M., Patrick, H., Germer, T., et al. (2019). Uncertainty in global downwelling plane irradiance estimates from sintered polytetrafluoroethylene plaque radiance measurements. Appl. Opt. 58 (16), 4497–4511. doi:10.1364/ao.58.004497
Concha, J. A., Bracaglia, M., and Brando, V. E. (2021). Assessing the influence of different validation protocols on ocean colour match-up analyses. Remote Sens. Environ. 259 (June), 112415. doi:10.1016/j.rse.2021.112415
De Vis, P., Goyens, C., Hunt, S., Vanhellemont, Q., Ruddick, K. G., and Bialek, A. (2024). Generating hyperspectral reference measurements for surface reflectance from the LANDHYPERNET and WATERHYPERNET networks. Front. Remote Sens. 5. doi:10.3389/frsen.2024.1347230
Dierssen, H., Bracher, A., Brando, V., Loisel, H., and Ruddick, K. (2020). Data needs for hyperspectral detection of algal diversity across the globe. Oceanography 33 (1), 74–79. doi:10.5670/oceanog.2020.111
Dogliotti, A. I., Gossn, J., Vanhellemont, Q., and Ruddick, K. G. 2015. Evaluation of Two Sites for Ocean Color Validation in the Turbid Waters of the Rio de La Plata (Argentina) (2015), In Proceedings of the Sentinel-3 for Science Workshop, Venice-Lido, Italy, June 2–5, 2015, ESA Special Publication SP-734.
Dogliotti, A. I., Merlo, R., Yema, L., and O’Farrell, I. (2023). Validation of Sentinel-2/MSI Water Reflectance and Water Quality Products in the Turbid Waters of Río de La Plata Estuary Using Fixed Automated Hyperspectral in situ Observations. Remote Sens. Ocean, Sea Ice, Coast. Waters, Large Water Regions 2023 12728, 1272802. doi:10.1117/12.2684141
Dogliotti, A. I., Piegari, E., Rubinstein, L., Perna, P., and Ruddick, K. G. (2024). Using the automated HYPERNETS hyperspectral system for multimission satellite ocean colour validation in the Río de La Plata, accounting for different spatial resolutions. Front. Remote Sens. 5, 1354662. doi:10.3389/frsen.2024.1354662
Dorji, P., and Fearns, P. (2018). Atmospheric correction of geostationary HIMAWARI-8 satellite data for total suspended sediment mapping: a case study in the coastal waters of western Australia. ISPRS J. Photogrammetry Remote Sens. 144 (October), 81–93. doi:10.1016/j.isprsjprs.2018.06.019
Doron, M., Bélanger, S., Doxaran, D., and Babin, M. (2011). Spectral variations in the near-infrared ocean reflectance. Remote Sens. Environ. 115, 1617–1631. doi:10.1016/j.rse.2011.01.015
EUMETSAT (2021). Sentinel-3 OLCI L2 report for baseline collection OL_L2M_003. Available from: https://user.eumetsat.int/s3/eup-strapi-media/Sentinel_3_OLCI_L2_report_for_baseline_collection_OL_L2_M_003_2_B_c8bbc6d986.pdf.
EUMETSAT (2022). Recommendations for Sentinel-3 OLCI Ocean colour product validations in comparison with in situ measurements – matchup protocols. EUM/SEN3/DOC/19/1092968 v8b. Available from: https://user.eumetsat.int/s3/eup-strapi-media/Recommendations_for_Sentinel_3_OLCI_Ocean_Colour_product_validations_in_comparison_with_in_situ_measurements_Matchup_Protocols_V8_B_e6c62ce677.pdf.
Franz, B. A., Werdell, P. J., Meister, G., Bailey, S. W., Eplee Jr, R. E., Feldman, G. C., et al. 2005. The continuity of Ocean Color measurements from SeaWiFS to MODIS. Proc. SPIE 5882, Earth Observing Systems X, 58820 W. doi:10.1117/12.620069
Garnesson, P., Mangin, A., Fanton d’Andon, O., Demaria, J., and Bretagnon, M. (2019). The CMEMS GlobColour chlorophyll a product based on satellite observation: multi-sensor merging and flagging strategies. Ocean Sci. 15 (3), 819–830. doi:10.5194/os-15-819-2019
Gonzalez Vilas, L., Brando, V. E., Concha, J. A., Goyens, C., Dogliotti, A. I., Doxaran, D., et al. (2024). Validation of satellite water products based on HYPERNETS in situ data using a Match-up Database (MDB) file structure. Front. Remote Sens. 5, 1330317. doi:10.3389/frsen.2024.1330317
Gorelick, N., Hancher, M., Dixon, M., Ilyushchenko, S., Thau, D., and Moore, R. (2017). Google Earth Engine: planetary-scale geospatial analysis for everyone. Remote Sens. Environ. 202 (December), 18–27. doi:10.1016/j.rse.2017.06.031
Gorman, E. T., Kubalak, D. A., Patel, D., Mott, D. B., Meister, G., and Werdell, P. J. (2019). The NASA Plankton, aerosol, cloud, ocean Ecosystem (PACE) mission: an emerging era of global, hyperspectral Earth system remote sensing. Proc. SPIE 11151, Sensors, Systems, and Next-Generation Satellites XXIII, 111510G. doi:10.1117/12.2537146
Goyens, C., Lavigne, H., Dille, A., and Vervaeren, H. (2022). Using hyperspectral remote sensing to monitor water quality in drinking water reservoirs. Remote Sens. 14 (21), 5607. doi:10.3390/rs14215607
Goyens, C., and Ruddick, K. (2023). Improving the standard protocol for above-water reflectance measurements: 1. Estimating effective wind speed from angular variation of sunglint. Appl. Opt. 62 (February), 2442. doi:10.1364/AO.481787
Gregg, W. W., and Carder, K. L. (1990). A simple spectral solar irradiance model for cloudless maritime atmospheres. Limnol. Oceanogr. 35 (8), 1657–1675.
Hedley, J. D., Roelfsema, C., Brando, V., Giardino, C., Kutser, T., Phinn, S., et al. (2018). Coral reef applications of Sentinel-2: coverage, characteristics, bathymetry and benthic mapping with comparison to Landsat 8. Remote Sens. Environ. 216 (October), 598–614. doi:10.1016/j.rse.2018.07.014
Hieronymi, M. (2019). Spectral band adaptation of Ocean Color sensors for applicability of the multi-water biogeo-optical algorithm ONNS. Opt. Express 27 (12), A707–A724. doi:10.1364/OE.27.00A707
Hooker, S. B., Bernhard, G., Morrow, J. H., Booth, C. R., Comer, T., Lind, R. N., et al. (2012). “Optical sensors for planetary radiant energy (OSPREY): calibration and validation of current and next-generation NASA missions,” in NASA technical memorandum 2012–215872 (Greenbelt, MD, USA: NASA).
Kaufmann, H., Segl, K., Chabrillat, S., Hofer, S., Stuffler, T., Mueller, A., et al. (2006). “EnMAP a hyperspectral sensor for environmental mapping and analysis,” in 2006 IEEE international symposium on geoscience and remote sensing (Germany: IEEE), 1617–1619.
Kou, L., Labrie, D., and Chylek, P. (1993). Refractive indices of water and ice in the 0.65 to 2.5 μm spectral range. Appl. Opt. 32, 3531–3540. doi:10.1364/ao.32.003531
Kuusk, J., Corizzi, A., Doxaran, D., Duong, K., Flight, K., Kivastik, J., et al. (2024). HYPSTAR: a hyperspectral pointable system for terrestrial and aquatic radiometry. Front. Remote Sens 5. doi:10.3389/frsen.2024.1347507
Kwiatkowska, E. J., Bonekamp, H. G., Ramon, D., Vanhellemont, Q., Brockmann, C., Lebreton, C., et al. (2016). Ocean colour opportunities from METEOSAT Second and Third Generation geostationary platforms. Ocean Sci. 12 (3), 703–713. doi:10.5194/os-12-703-2016
Lavigne, H., and Ruddick, K. (2018). The potential use of geostationary MTG/FCI to retrieve chlorophyll-a concentration at high temporal resolution for the open oceans. Int. J. Remote Sens. 39 (8), 2399–2420. doi:10.1080/01431161.2017.1420935
Lavigne, H., Ruddick, K., and Vanhellemont, Q. (2022). Monitoring of high biomass Phaeocystis globosa blooms in the Southern North Sea by in situ and future spaceborne hyperspectral radiometry. Remote Sens. Environ. 282 (December), 113270. doi:10.1016/j.rse.2022.113270
Lebreton, C., Stelzer, K., Brockmann, C., Bertels, L., Pringle, N., Paperin, M., et al. (2016). Cloud and cloud shadow masking of high and medium resolution optical sensors-an algorithm inter-comparison example for Landsat 8. Living Planet Symp. ESA Special Publication SP-740, 407.
Lee, Z. P., Du, K., Voss, K. J., Zibordi, G., Lubac, B., Arnone, R., et al. (2011). An inherent-optical-property-centered approach to correct the angular effects in water-leaving radiance. Appl. Opt. 50 (19), 3155–3167. doi:10.1364/ao.50.003155
Lubac, B., Loisel, H., Guiselin, N., Astoreca, R., Artigas, L. F., and Mériaux, X. (2008). Hyperspectral and Multispectral Ocean color Inversions to Detect Phaeocystis globosa blooms in coastal waters. J. Geophys. Res. 113 (C06026). doi:10.1029/2007jc004451
Luo, Y., Doxaran, D., and Vanhellemont, Q. (2020). Retrieval and validation of water turbidity at metre-scale using Pléiades satellite data: a case study in the Gironde estuary. Remote Sens. 12 (6), 946. doi:10.3390/rs12060946
Main-Knorn, M., Pflug, B., Louis, J., Debaecker, V., Müller-Wilm, U., and Gascon, F. (2017). Sen2Cor for Sentinel-2. Image Signal Process. Remote Sens. XXIII 10427, 37–48. doi:10.1117/12.2278218
Mélin, F., and Sclep, G. (2015). Band shifting for Ocean color multi-spectral reflectance data. Opt. Express 23 (3), 2262–2279. doi:10.1364/OE.23.002262
Meygret, A., Santer, R. P., and Berthelot, B. (2011). ROSAS: a Robotic Station for Atmosphere and Surface Characterization dedicated to on-orbit calibration. Proc. SPIE 8153, Earth Observing Systems XVI, 815311. doi:10.1117/12.892759
Mills, D. K., Laane, R. W. P. M., Rees, J. M., Loeff, M. R. V. d., Suylen, J. M., Pearce, D. J., et al. (2003). “Smartbuoy: a marine environmental monitoring buoy with a difference,” in Building the European capacity in operational oceanography, proc. Third international conference on EuroGOOS. Editors H. Dahlin, N. C. Flemming, K. Nittis, and S. E. Peterson (Germany: Elsevier Oceanography Series Publication Series 19), 311–316.
Mobley, C. D. (1999). Estimation of the remote-sensing reflectance from above-surface measurements. Appl. Opt. 38, 7442–7455. doi:10.1364/ao.38.007442
Morel, A., and Gentili, B. (1996). Diffuse reflectance of oceanic waters III. Implication of bidirectionality for the remote-sensing problem. Appl. Opt. 35 (24), 4850–4862. doi:10.1364/ao.35.004850
Mueller, J. L., Davis, C., Arnone, R., Frouin, R., Carder, K., Lee, Z. P., et al. (2003). “Above-water radiance and remote sensing reflectance measurements and analysis protocols (chapter 3),” in Ocean optics protocols for satellite Ocean color sensor validation revision (Greenbelt, MD, USA: NASA), 4, 21–31.
Neukermans, G., Ruddick, K., Bernard, E., Ramon, D., Nechad, B., and Deschamps, P.-Y. (2009). Mapping total suspended matter from geostationary satellites: a feasibility study with SEVIRI in the Southern North Sea. Opt. Express 17 (16), 14029–14052. doi:10.1364/OE.17.014029
Neukermans, G., Ruddick, K. G., and Greenwood, N. (2012). Diurnal variability of turbidity and light attenuation in the Southern North Sea from the SEVIRI geostationary sensor. Remote Sens. Environ. 124 (September), 564–580. doi:10.1016/j.rse.2012.06.003
Pahlevan, N., Mangin, A., Balasubramanian, S. V., Smith, B., Alikas, K., Arai, K., et al. (2021). ACIX-Aqua: a global assessment of atmospheric correction methods for Landsat-8 and Sentinel-2 over lakes, rivers, and coastal waters. Remote Sens. Environ. 258 (June), 112366. doi:10.1016/j.rse.2021.112366
Pahlevan, N., and Schott, J. R. (2013). Leveraging EO-1 to evaluate capability of new generation of Landsat sensors for coastal/inland water studies. IEEE J. Sel. Top. Appl. Earth Observations Remote Sens. 6 (2), 360–374. doi:10.1109/JSTARS.2012.2235174
Pahlevan, N., Smith, B., Binding, C., and O’Donnell, D. M. (2017). Spectral band adjustments for remote sensing reflectance spectra in coastal/inland waters. Opt. Express 25 (23), 28650–28667. doi:10.1364/OE.25.028650
Park, Y., and Ruddick, K. (2005). Model of remote-sensing reflectance including bidirectional effects for case 1 and case 2 waters. Appl. Opt. 44 (7), 1236–1249. doi:10.1364/AO.44.001236
Peters, S., Laanen, M., Groetsch, P., Ghezehegn, S., Poser, K., Hommersom, A., et al. (2018). WISPstation: a new autonomous above water radiometer system. Zenodo. doi:10.5281/zenodo.2533079
Philippart, K., Blauw, A., Bolhuis, H., Brandenburg, K., Brussaard, C., Gerkema, T., et al. (2020). Quick scan zeeschuim. NIOZ/Bureau Waardenbg. Statistics/CNR/KBIN/NIOO-KNAW/Rijkswaterstaat (RWS-WVL)/Technische Univ. Delft/Universiteit Amsterdam/Universiteit Utr. Groningen/Water Insight BV. NIOZ Open Respository, 356236.
Reinersman, P. N., and Carder, K. L. (1995). Monte Carlo simulation of the atmospheric point-spread function with an application to correction for the adjacency effect. Appl. Opt. 34 (21), 4453–4471. doi:10.1364/ao.34.004453
Rousseau, V., Becquevort, S., Parent, J. Y., Gasparini, S., Daro, M. H., Tackx, M., et al. (2000). Trophic efficiency of the planktonic food web in a coastal Ecosystem dominated by Phaeocystis colonies. J. Sea Res. 43, 357–372. doi:10.1016/s1385-1101(00)00018-6
Ruddick, K., De Cauwer, V., and Van Mol, B. (2005). Use of the near infrared similarity spectrum for the quality control of remote sensing data. Proc. SPIE 5885 (USA: SPIE), 5885. doi:10.1117/12.615152
Ruddick, K., De Cauwer, V., Park, Y., and Moore, G. (2006). Seaborne measurements of near infrared water-leaving reflectance: the similarity spectrum for turbid waters. Limnol. Oceanogr. 51 (2), 1167–1179. doi:10.4319/lo.2006.51.2.1167
Ruddick, K., Gons, H., Rijkeboer, M., and Tilstone, G. (2001). Optical remote sensing of chlorophyll a in case 2 waters by use of an adaptive two-band algorithm with optimal error properties. Appl. Opt. 40 (21), 3575–3585. doi:10.1364/AO.40.003575
Ruddick, K., Voss, K., Boss, E., Castagna, A., Frouin, R. J., Gilerson, A., et al. (2019). A review of protocols for fiducial reference measurements of water-leaving radiance for validation of satellite remote sensing data over water. Remote Sens. 11 (19), 2198. doi:10.3390/rs11192198
Ruddick, K. G., De Vis, P., Goyens, C., Kuusk, J., Lavigne, H., and Vanhellemont, Q. (2023). Second derivative water reflectance spectra for phytoplankton species detection – origin, impact and removal of spectral wiggles. Proc. SPIE 12728, Remote Sensing of the Ocean, Sea Ice, Coastal Waters, and Large Water Regions 2023, 127280A. doi:10.1117/12.2684336
Ryu, J.-H., Han, H.-J., Cho, S., Park, Y.-J., and Ahn, Y.-H. (2012). Overview of Geostationary Ocean color imager (GOCI) and GOCI data processing system (GDPS). Ocean Sci. J. 47 (3), 223–233. doi:10.1007/s12601-012-0024-4
Santer, R., and Schmechtig, C. (2000). Adjacency effects on water surfaces: primary scattering approximation and sensitivity study. Appl. Opt. 39 (3), 361–375. doi:10.1364/ao.39.000361
Simis, S. G. H., and Olsson, J. (2013). Unattended processing of shipborne hyperspectral reflectance measurements. Remote Sens. Environ. 135 (August), 202–212. doi:10.1016/j.rse.2013.04.001
Slivkoff, M. M. (2014). “Ocean colour remote sensing of the great barrier reef waters, ”. PhD Thesis. Curtin Univ.
Talone, M., and Zibordi, G. (2019). Non-linear response of a class of hyper-spectral radiometers. Metrologia 55 (5), 747–758. doi:10.1088/1681-7575/aadd7f
Talone, M., and Zibordi, G. (2019). Spectral assessment of deployment platform perturbations in above-water radiometry. Opt. Express 27 (12), A878. doi:10.1364/OE.27.00A878
Talone, M., Zibordi, G., Ansko, I., Banks, A. C., and Kuusk, J. (2016). Stray light effects in above-water remote-sensing reflectance from hyperspectral radiometers. Appl. Opt. 55 (15), 3966. doi:10.1364/AO.55.003966
Thompson, D., Thompson, D. R., Green, R. O., Bradley, C., Brodrick, P. G., Dor, B., et al. (2023). On-orbit calibration and performance of the EMIT imaging spectrometer. ESS Open Archive. doi:10.22541/essoar.168988432.29040205/v1
Tilstone, G. H., Pardo, S., Dall’Olmo, G., Brewin, R. J. W., Nencioli, F., Dessailly, D., et al. (2021). Performance of ocean colour chlorophyll a algorithms for sentinel-3 OLCI, MODIS-aqua and suomi-VIIRS in open-ocean waters of the atlantic. Remote Sens. Environ. 260 (July), 112444. doi:10.1016/j.rse.2021.112444
Vabson, V., Kuusk, J., Ansko, I., Vendt, R., Alikas, K., Ruddick, K., et al. (2019). Laboratory intercomparison of radiometers used for satellite validation in the 400-900 nm range. Remote Sens. 11 (9), 1101. doi:10.3390/rs11091101
Vanhellemont, Q. (2019a). Adaptation of the dark spectrum fitting atmospheric correction for aquatic applications of the Landsat and Sentinel-2 archives. Remote Sens. Environ. 225, 175–192. doi:10.1016/j.rse.2019.03.010
Vanhellemont, Q. (2019b). Daily metre-scale mapping of water turbidity using CubeSat imagery. Opt. Express 27 (20), A1372–A1399. doi:10.1364/OE.27.0A1372
Vanhellemont, Q. (2020). Sensitivity analysis of the dark spectrum fitting atmospheric correction for metre- and decametre-scale satellite imagery using autonomous hyperspectral radiometry. Opt. Express 28 (20), 29948–29965. doi:10.1364/OE.397456
Vanhellemont, Q. (2023). Evaluation of eight band SuperDove imagery for aquatic applications. Opt. Express 31 (9), 13851–13874. doi:10.1364/OE.483418
Vanhellemont, Q., and Ruddick, K. (2014). Turbid wakes associated with offshore wind turbines observed with Landsat 8. Remote Sens. Environ. 145 (April), 105–115. doi:10.1016/j.rse.2014.01.009
Vanhellemont, Q., and Ruddick, K. (2015). Assessment of Sentinel-3/OLCI sub-pixel variability and platform impact using Landsat-8/OLI, In Proceedings of the Sentinel-3 for Science Workshop, Venice-Lido, Italy, June 2–5, 2015. ESA Special Publication SP-734.
Vanhellemont, Q., and Ruddick, K. (2021). Atmospheric correction of metre-scale optical satellite data for inland and coastal water applications. Remote Sens. Environ. 216, 586–597. doi:10.1016/j.rse.2018.07.015
Vanhellemont, Q., and Ruddick, K. (2021). Atmospheric correction of Sentinel-3/OLCI data for mapping of suspended particulate matter and chlorophyll-a concentration in Belgian turbid coastal waters. Remote Sens. Environ. 256, 112284. doi:10.1016/j.rse.2021.112284
Wang, M., Jiang, L., Liu, X., Son, S., Sun, J., Shi, W., et al. 2016. VIIRS Ocean Color products: a progress update. Beijing, China: IEEE International Geoscience and Remote Sensing Symposium (IGARSS), 5848–5851. doi:10.1109/IGARSS.2016.7730528
Werdell, P. J., Bailey, S., Fargion, G., Pietras, C., Knobelspiesse, K., Feldman, G., et al. (2003). Unique data repository facilitates Ocean Color satellite validation. Eos, Trans. Am. Geophys. Union 84 (38), 377–387. doi:10.1029/2003EO380001
Zibordi, G., Holben, B., Slutsker, I., Giles, D., D’Alimonte, D., Mélin, F., et al. (2009). AERONET-OC: a network for the validation of Ocean Color primary products. J. Atmos. Ocean. Technol. 26, 1634–1651. doi:10.1175/2009jtecho654.1
Zibordi, G., Holben, B. N., Talone, M., D’Alimonte, D., Slutsker, I., Giles, D. M., et al. (2021). Advances in the Ocean Color component of the aerosol robotic network (AERONET-OC). J. Atmos. Ocean. Technol. 38 (4), 725–746. doi:10.1175/JTECH-D-20-0085.1
Zibordi, G., Kwiatkowska, E., Mélin, F., Talone, M., Cazzaniga, I., Dessailly, D., et al. (2022). Assessment of OLCI-A and OLCI-B radiometric data products across European seas. Remote Sens. Environ. 272 (April), 112911. doi:10.1016/j.rse.2022.112911
Zibordi, G., Mélin, F., and Berthon, J.-F. (2018). A regional assessment of OLCI data products. IEEE Geoscience Remote Sens. Lett. 15 (10), 1490–1494. doi:10.1109/LGRS.2018.2849329
Zibordi, G., Mélin, F., Voss, K. J., Johnson, B. C., Franz, B. A., Kwiatkowska, E., et al. (2015). System vicarious calibration for Ocean color climate change applications: requirements for in situ data. Remote Sens. Environ. 159, 361–369. doi:10.1016/j.rse.2014.12.015
Zibordi, G., Talone, M., and Jankowski, L. (2017). Response to temperature of a class of in situ hyperspectral radiometers. J. Atmos. Ocean. Technol. 34 (8), 1795–1805. doi:10.1175/JTECH-D-17-0048.1
Keywords: water colour, satellite validation, hyperspectral reflectance, in situ measurements, phytoplankton
Citation: Ruddick KG, Brando VE, Corizzi A, Dogliotti AI, Doxaran D, Goyens C, Kuusk J, Vanhellemont Q, Vansteenwegen D, Bialek A, De Vis P, Lavigne H, Beck M, Flight K, Gammaru A, González Vilas L, Laizans K, Ortenzio F, Perna P, Piegari E, Rubinstein L, Sinclair M and Van der Zande D (2024) WATERHYPERNET: a prototype network of automated in situ measurements of hyperspectral water reflectance for satellite validation and water quality monitoring. Front. Remote Sens. 5:1347520. doi: 10.3389/frsen.2024.1347520
Received: 30 November 2023; Accepted: 10 June 2024;
Published: 05 August 2024.
Edited by:
Amir Ibrahim, National Aeronautics and Space Administration, United StatesReviewed by:
Tristan Harmel, Earth Observation Unit, Magellium, FranceSrinivas Kolluru, Florida Atlantic University, United States
Copyright © 2024 Ruddick, Brando, Corizzi, Dogliotti, Doxaran, Goyens, Kuusk, Vanhellemont, Vansteenwegen, Bialek, De Vis, Lavigne, Beck, Flight, Gammaru, González Vilas, Laizans, Ortenzio, Perna, Piegari, Rubinstein, Sinclair and Van der Zande. This is an open-access article distributed under the terms of the Creative Commons Attribution License (CC BY). The use, distribution or reproduction in other forums is permitted, provided the original author(s) and the copyright owner(s) are credited and that the original publication in this journal is cited, in accordance with accepted academic practice. No use, distribution or reproduction is permitted which does not comply with these terms.
*Correspondence: Kevin G. Ruddick, a3J1ZGRpY2tAbmF0dXJhbHNjaWVuY2VzLmJl