- 1NASA Goddard Space Flight Center, Greenbelt, MD, United States
- 2Goddard Earth Sciences Technology Research II, Morgan State University, Baltimore, MD, United States
The Earth Polychromatic Imaging Camera (EPIC) on the Deep Space Climate Observatory (DSCOVR) routinely captures reflected radiation from the whole sunlit side of the Earth in the near backward direction to monitor the changing planet. The instrument had routinely operated until 27 June 2019, when the spacecraft was placed in an extended safe hold due to degradation of an inertial navigation unit. DSCOVR returned to full operations on 2 March 2020. Since then, the range of scattering angles between the incident sunlight and sensor direction has been larger than before and the largest scattering angle reaches ∼178°, only 2° from perfect backscattering, proving a unique opportunity to study the top-of-atmosphere (TOA) reflectance under such extreme conditions. In the paper, we compare EPIC global spectral reflectances in 2021–2016. We found that there are four occasions when the scattering angle reaches about 178° and associated with them enhanced global daily average spectral reflectances in 2021. The scattering angle related reflectance enhancements are not found in 2016 data when the maximum scattering angle is about 174.5°. CERES data do not show such occasions in global daily reflected shortwave flux. As a result, those enhanced reflectance occasions are primarily due to the change in scattering angle. The enhancement due to changes in scattering angle depends strongly on wavelength, primarily because of wavelength dependence of cloud scattering phase function. Radiative transfer calculations show that the change in scattering angles has the largest impact on reflectance in the red and NIR channels at 680 nm and 780 nm and the smallest influence on reflectance in the UV channel at 388 nm, consistent with EPIC observations. The change of global average cloud amount also plays an important role in the reflectance enhancement. The influence of the cloud effect depends on whether the change is in phase or not with the change of scattering angle.
1 Introduction
The launch of the Deep Space Climate Observatory (DSCOVR) in February 2015 to the orbit around Sun-Earth Lagrange-1 (L1) point started a new perspective of Earth observations from space. At a distance of about 1.5 million kilometers from the Earth, the Earth Polychromatic Imaging Camera (EPIC) routinely takes the image of the whole sunlit side of the Earth in the near backscattering direction in ten narrow bands from ultraviolet (UV) to visible (VIS) and near-infrared (NIR) every 65 and 110 min in Northern Hemisphere summer and winter, respectively.
The instrument had routinely operated until 27 June 2019, when the spacecraft was placed in an extended safe hold due to degradation of an inertial navigation unit. DSCOVR returned to full operations on 2 March 2020. Since then, the range of the scattering angle between the incident sunlight and sensor direction is larger than it was before and the largest scattering reaches ∼178°, only 2° from the perfect backscattering direction. Figure 1 shows a sketch of the Sun, Earth, and vehicle (satellite) position when the scattering angle reached its upper bound, or the Sun-Earth-Vehicle (SEV) angle (supplement to the scattering angle: SEV + scattering angle = 180°) reached its lower bound for 2016 and 2021. The minimum SEV angle is ∼5.5° and ∼2° for 2016 and 2021, respectively. In 2021, the closest distance of the DSCOVR satellite to the Sun-Earth line is ∼0.5 × 10⁵ km, only ∼2/5 of the closest distance of ∼1.4 × 10⁵ km for 2016. In this paper, we use SEV and scattering angle alternately to describe the same phenomenon.

FIGURE 1. Sketch of the Sun, Earth, and DSCOVR satellite vehicle position when the SEV reaches a minimum for the years of 2016 and 2021.
In studying the impact of near-backward scattering on EPIC top-of-atmosphere (TOA) reflectance, Marshak et al. (2021) and Penttilä et al. (2021) show a strong increase in the TOA reflectance towards the backscattering direction. They found that the reflectance increase occurred for both cloudy and clear sky over ocean and land areas (except cloudless areas over ocean); the largest enhancements arise in the NIR from vegetation. Su et al. (2021) accounted for the change of the scattering angle in deriving shortwave (SW) fluxes using EPIC observed radiances. Herman et al. (2023) analyzed EPIC UV reflectance at 388 nm and compared it with the reflectance at 380 nm from the low Earth polar orbiting nadir mapper in the Ozone Mapping and Profiler Suite (OMPS-NM); they suggested that the increase observed by EPIC is mostly due to an increase in cloud cover and not due to enhanced backscatter.
We compared daily global average reflectance in five EPIC non-absorbing channels in year 2021 and 2016. We found that the spectral reflectances in 2021 differ dramatically from 2016 (Figure 2). There are five distinctive spikes in spectral reflectance in 2021, and the magnitude of those spikes is wavelength dependent. Those enhanced spectral reflectances are not found in 2016. This study focuses on understanding the physical mechanism for the enhanced spectral reflectance based on analyzing EPIC observations and radiative transfer calculations. The data used is described in Section 2. The method of analysis is described in Section 3. The results are presented in Section 4 followed by a summary discussion in Section 5.
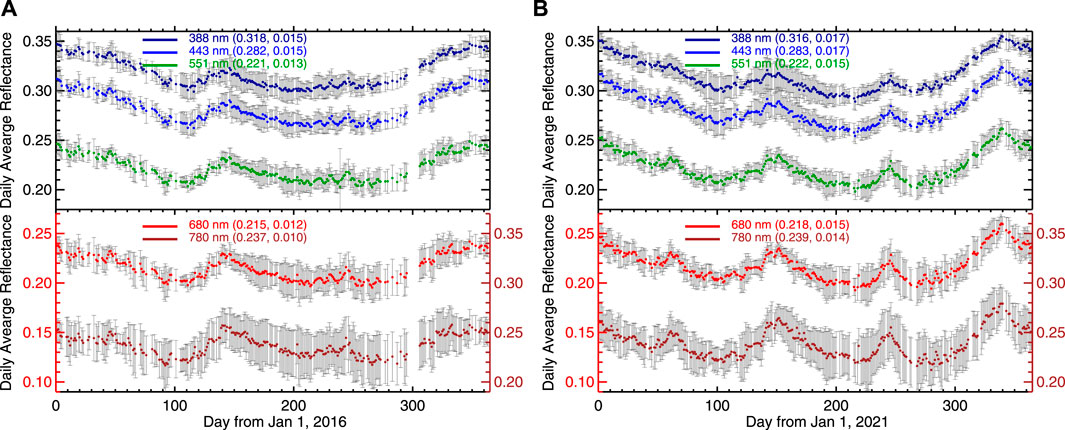
FIGURE 2. (A) Time series of daily average global reflectance with gray bars for the standard deviations for 2016 and (B) for 2021. The annual mean and standard deviation of daily reflectance are indicated in parentheses of the legends. Note that the ranges of all vertical axes are the same.
2 Data
In this paper, we will analyze EPIC reflectance. EPIC is a spectroradiometer onboard the DSCOVR satellite. It provides 10 narrowband spectral images of the entire sunlit face of Earth using a 2048 × 2048 pixel CCD (Charge Couple Device) detector. As the satellite orbits around the L1 point, EPIC observes reflected solar radiation from the Earth in near backscatter directions. The distance between the DSCOVR satellite and the Earth changes with time as a result of the Lissajous orbit. The rate of change in the distance is about 2000–2,500 km day−1; it is about 0.15% of its nominal distance of 1.5 × 10⁶ km (Herman et al., 2018; Marshak et al., 2018).
The EPIC’s 10 narrowband channels cover the spectral range from UV to NIR: there are four UV channels at 317, 325, 340, and 388 nm; three visible non-absorbing channels at 443 nm (blue), 551 nm (green), and 680 nm (red); two oxygen absorbing channels at 688 nm (B-band) and 764 nm (A-band); and one NIR channel at 780 nm. The three ozone absorbing channels (317, 325, 340 nm) are used for ozone, SO2, and aerosol retrieval, the UV channel at 388 nm, three visible channels, and one NIR channel together with the oxygen bands are used for aerosol and cloud study (e.g., Carn et al., 2018; Yang et al., 2019; Yang and Liu, 2019; Ahn et al., 2021; Kramarova et al., 2021; Lyapustin et al., 2021). Two oxygen-absorbing bands are used to determine cloud and aerosol height (e.g., Xu et al., 2017; Xu et al., 2019; Yang et al., 2019). The red (680 nm) and NIR (780 nm) channels are also used for obtaining leaf area index (LAI) and sunlit leaf area index (SLAI) as well as the normalized difference vegetation index (NDVI) (Yang et al., 2017). In particular, the red channel in oxygen-B band (688 nm) paired with the NIR channel can enhance NDVI for monitoring vegetation (Marshak and Knyazikhin, 2017). The visible non-absorbing channels are used to convert narrowband to broadband radiances for estimating broadband shortwave (SW) fluxes (Su et al., 2018). Those non-absorbing channels are also used to estimate photosynthetically available radiation (PAR) at the ice-free ocean surface (Frouin et al., 2018; 2022). From EPIC observations from deep space, Marshak et al. (2017) studied terrestrial glint originated from scattering of oriented ice crystals. The EPIC cloud products are used to investigate the daytime variability of cloud fraction and cloud height (Delgado-Bonal et al., 2020; Delgado-Bonal et al., 2022).
3 Analysis methods
We will analyze EPIC-observed global average reflectance. The EPIC pixel level reflectance is defined as
where
Song et al. (2018) introduced a scattering function,
where
For EPIC images, the scattering function (Eq. 2) is estimated by the global daytime average spectral reflectance of the planet Earth defined as
where
Clouds are highly reflective to shortwave radiation. With the global average cloud fraction over 60% (King et al., 2013), the reflection from clouds dominates in the global average reflected solar radiation. Wen et al. (2019) showed that the EPIC global average reflectance is highly correlated with the cloud amount. In this study, we use cloud mask in EPIC level 2 cloud products (Yang et al., 2019) to estimate cloud fraction for understanding the variation of reflectance. In the cloud product, a pixel is classified as clear with high confidence, clear with low confidence, cloudy with low confidence, or cloud with high confidence. Cloud fraction calculated using cloud mask with low and high confidence gives a global average cloud fraction of ∼65%, consistent with cloud fraction from GEO-LEO composite data sets (Yang et al., 2019). This criterion was used to study daytime variability of cloud fraction from EPIC observations (Delgado-Bonal et al., 2020). The same criterion is applied for cloud masking in this study.
To compare with the EPIC daily averaged global reflectance, the daily global average SW flux is calculated from area weighted average of the 1° daily CERES data (Doelling et al., 2016) as
where
We further calculate single scattering properties of water clouds based on Mie theory and perform radiative transfer calculation using Discrete-Ordinate-Method Radiative Transfer (DISORT) code (Stamnes et al., 1988).
4 Results
4.1 Observations
First, we examine the daily global average reflectance and associated standard deviation of the spectral reflectance (Figure 2) for 2016 and 2021, a normal and abnormal year of SEV variations, respectively. In both years, the daily average reflectance for the UV channel is largest with the smallest daily variability compared to longer wavelengths; the daily average reflectance decreases with wavelength from 388 nm to 680 nm with a slight increase from 680 nm to 780 nm; the standard deviation increases with wavelength, and the reflectance at the NIR channel has the largest daily variability among the five wavelength bands.
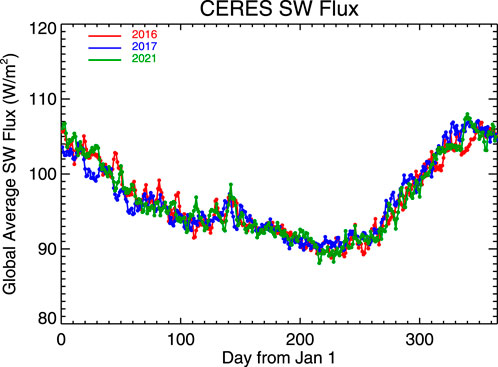
However, the variations of spectral reflectance in 2021 are dramatically different from those in 2016. There are four distinctive spectral reflectance spikes in 2021 observations, while there is one reflectance spike around May 19 (day 140) in 2016. The spikes in EPIC reflectance in 2021 do not appear in the CERES observed daily average TOA SW flux (Figure 3). Rather, the SW flux shows consistent year-to-year variations; it decreases from ∼105 W/m2 on January 1– to ∼95 W/m2 around 10 April (day 100) with a small increase to ∼98 W/m2 around May 20 (day 140 of year) and a decrease to ∼90 W/m2 on around August 18 (day 230), followed by a large increase to ∼108 W/m2 towards the end of the year. Similar year-to-year variation of SW flux is the result of the stable Earth-Atmosphere system. And EPIC spectral reflectances observed in 2016 resemble the CERES SW flux closely (Figures 2, 3).
We use 2016 EPIC data to examine the relationship between spectral reflectance and global average CERES SW flux and cloud fraction from EPIC cloud products (Figure 4). The spectral reflectances in 388, 443, and 551 nm are strongly correlated with the SW flux (the correlation coefficients are greater than 0.9). The spectral reflectance at 680 nm is slightly less correlated with the SW flux (the correlation coefficient is 0.89). The correlation coefficient and slope of the best linear fit line decrease with wavelength. The correlation coefficient for the NIR reflectance and SW flux is about 0.66, still significantly large. Since year-to-year variation of the SW flux is small and the EPIC spectral reflectance is highly correlated with the SW flux, the spectral reflectance would resemble the CERES SW flux in 2021 as well. Thus, it is unlikely that spikes in EPIC reflectance observed in 2021 are due to changes in cloud amount or surface properties. And one possible reason to cause those reflectance enhancements is the change of SEV angle when EPIC returned to full operation in March 2020 after the DSCOVR spacecraft was put in safe mode (Marshak et al., 2021).
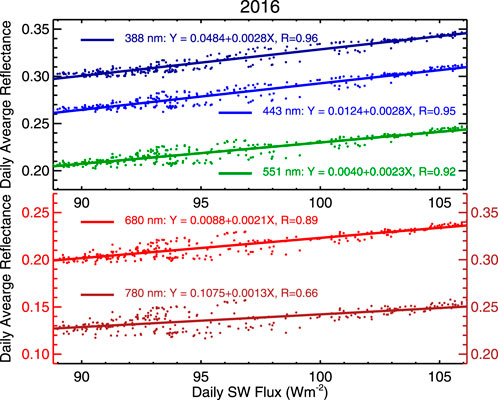
FIGURE 4. Relationship between EPIC global average spectral reflectance and CERES SW flux. Note that the ranges of all vertical axes are the same.
In Figure 5 we examine the variation of SEV and scattering angle with time in the years 2016 and 2021. Since the SEV and scattering angles are supplementary, the SEV angle is a measure of closeness of the direction of the EPIC observed Earth reflected sunlight to the direction of perfect backscattering. In 2016, the lower bound of the SEV angle is ∼5.5°, and the closest distance of the spacecraft to the Sun-Earth line is about 1.4 × 10⁵ km. In 2021, however, the lower limit of the SEV angle is ∼2°, the EPIC observed sunlight is extremely close to perfect backscattering, and the closest distance of the spacecraft to the Sun-Earth line is about 0.5 × 10⁵ km. Comparing spectral reflectance with the variations of the SEV angle, we found the four spikes of spectral reflectance in 2021 coincide with the minimum of the SEV angles, though there is about a 7-day lag of the last reflectance spike compared to the minimum of the SEV angle. Thus, the reflectance spikes occur when the DSCOVR satellite approaches the closest distance to the Sun-Earth line or the smallest SEV angle of ∼2°. We call those spikes the reflectance enhancements related to the smallest SEV angle.
The scattering angle variation behaves like a sinusoidal function with a peak-to-peak variation of ∼5° and ∼10° in 2016 and 2021, respectively, and there are about four such sinusoidal periods in both years (Figure 5). However, the associated reflectance spike in 2021 differs from one to another. To quantify the reflectance enhancement, we define four time periods associated with four reflectance spikes. Each period starts with a maximum SEV angle (or minimum scattering angle), reaching a local minimum of SEV angle (or maximum scattering angle), ended by maximum SEV angle (or minimum scattering angle) as shown in Table 1. For example, the first minimum of SEV angle occurs around 7 March 2021 (or day 66) in the first time period between the first and second maximum of SEV on 24 January (day 26) and 18 April (day 108). Since the SEV angle does not reach the maximum (or the scattering angle does not reach the minimum) at the end of the year 2021, we define the fourth time period as the time period between the last maximum and minimum of the SEV angle.

TABLE 1. The start (t1), peak (tmax), and end (t2) day of four periods of scattering angle variation with calendar date in parentheses in this study.
Here, we define the peak reflectance enhancement as the difference between the reflectance at the time (
where reference reflectance
For the last period, the reflectance enhancement is simply defined as the difference between the reflectance at the time (
The reflectance enhancements for the four time periods are presented in Figure 6. For the same scattering angle peak (minimum SEV), the reflectance enhancement increases with wavelength. The enhancements are the smallest for the first enhancement peak and largest for the fourth one. The enhancements of the second and third peaks are comparable. For the first peak, the enhancement is ∼1% for the UV channel at 388 nm and ∼5% for the NIR channel at 780 nm. For the second and third peaks, the enhancement is ∼5%– to ∼15% depending on wavelength. For the last peak, the enhancement ranges from ∼14% to ∼25% as wavelength increases from 388 nm to 780 nm.
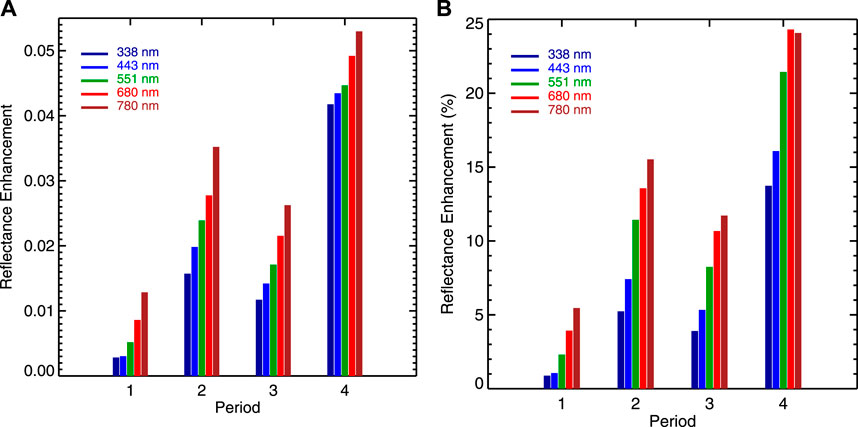
FIGURE 6. (A) Absolute global spectral reflectance enhancement for the four occasions; (B) similar to (A) but for percent reflectance enhancement relative to the reference reflectance.
To understand the change of reflectance enhancement from one peak to another, we examine the first and second peaks in some detail. Figure 7 shows the scatter plot of spectral reflectance as a function of the scattering angle for the first and second periods. The best line fit and correlation coefficient are indicated for each scenario. For the first period, scattered points are evidently separated into two branches by the best linear fit lines for the 388, 443, and 551 nm channels. The separation is less clear for the red and NIR channels. The spectral reflectance is positively correlated with the scattering angle for all five wavelengths, and the correlation coefficient increases from 0.23 for the UV channel to 0.53 for the NIR one. For the second period, the spectral reflectance is more correlated with the scattering angle compared to the first period. The correlation coefficient increases from 0.76 for the UV channel to 0.95 for the NIR channel.
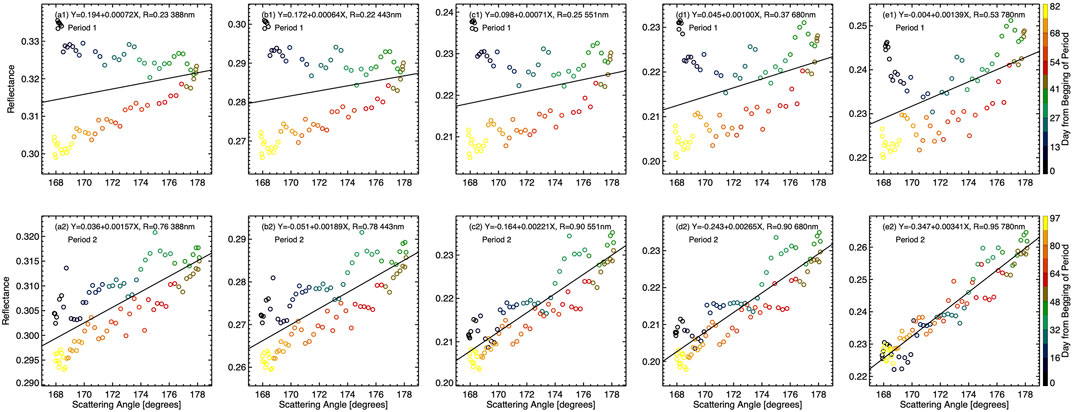
FIGURE 7. Spectral reflectance as a function of the scattering angle for period one and two. The color for each point indicates the day number relative to the first day of an event. The best line fit and correlation coefficient are indicated for each scenario. The bottom axis is for scattering angle and left axis is for reflectance for all sub-figures.
In the first period, the upper and the lower branches in the scatter plots of the first three channels (Figures 7A1, B1, C1) are associated with the ascending and descending phase of the scattering angle variation (Figure 5; Table 1). However, the spectral reflectance of the first three channels is negatively correlated with the scattering angle in the upper branches and positively correlated with the scattering angle in the lower branches (Figures 7A1, B1, C1). This suggests that variation of scattering angle alone does not explain the observed spectral reflectance variation during a cycle of scattering angle change.
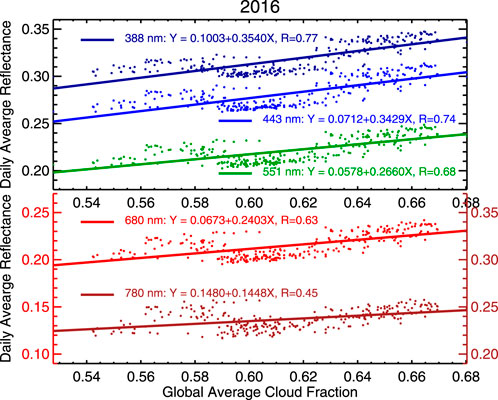
Clouds are bright in all five non-absorbing channels. Variations in cloud amount can contribute significantly to EPIC observed reflectance variations. To examine the relationship between spectral reflectance and cloud amount, we used 2016 data in Figure 8. The daily average spectral reflectances are well correlated with global cloud fraction. The sensitivity of the reflectance to the global average cloud fraction (the slope in the best linear fit line) as well as the correlation coefficient are the largest for the UV channel and decrease with wavelength. This is because the ocean is dark for all five wavelengths concerned, and land is dark in UV wavelength and bright in NIR, and the global average surface albedo in visible increases with wavelength. Note that some surface types have different wavelength dependencies. For example, green vegetation is brighter in green than red; snow albedo decreases with wavelength in visible and NIR wavelengths (Wiscombe and Warren, 1980). Thus, variation of cloud fraction can be used to explain, in part, the changes in spectral reflectance.
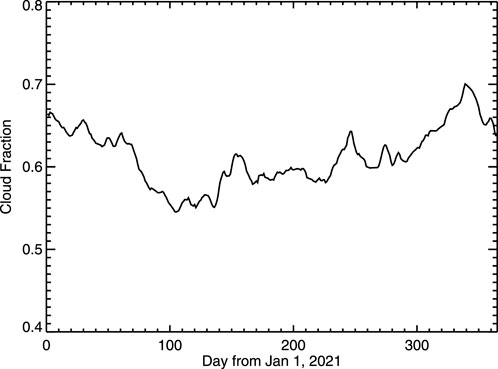
The cloud mask in EPIC level 2 cloud product is used to estimate global average cloud fraction. To reduce noise, a 5-day moving average is applied to obtain variation of global average cloud fraction with time for examining the effect of cloud on reflectance variation (Figure 9). In the first period (day 26–108 in 2021), cloud fraction decreases with time to reduced global reflectance in this period. In the ascending phase of scattering angle in this period, the increase of spectral reflectance due to the increase of scattering angle (or scattering angle effect) competes with the decrease of spectral reflectance due to the decrease in cloud fraction (or cloud fraction effect). In this case, the cloud fraction effect dominates, resulting in a small decrease in spectral reflectance as shown in the upper branches for 388, 443, and 551 nm in Figure 7. In the descending phase of scattering angle variation, both decrease in cloud fraction and scattering angle work together to result in a consistent decrease in spectral reflectance for all five channels.
In the first period, unlike first three channels, the reflectance for 680 nm and 780 nm decreases in the first 13 days of the ascending phase, followed by an increase towards the peak of scattering angle, suggesting the scattering angle effect dominates, as will be discussed in the next section.
For the second enhancement peak, the increase of scattering angle from 8 April (day 108) to 2 June (day 153) is in phase with variation of cloud amount, resulting in an increase in the spectral reflectance in all five channels; the decrease of the scattering angle from 2 June (day 153) to 24 July (day 205) is also in phase with variation of decreasing in cloud amount, resulting in a decrease in the spectral reflectance in all five channels. Since the scattering angle and cloud fraction vary in phase in both ascending and descending phases of scattering angle variation, the enhancement in this period is larger than the first period.
Now, it is evident that both variations of SEV angle and cloud amount are the two major mechanisms to cause EPIC observed global reflectance enhancement. As the SEV angle approaches to an extremely small value, EPIC observed Earth reflected radiation is in a near backscattering direction, resulting in the spikes in spectral reflectance coinciding with the scattering angle peaks. Change in cloud amount modifies the magnitude of spectral reflectance enhancement. The effect of cloud variation on reflectance enhancement may lead to an increase or decrease of global reflectance depending on whether the change in cloud fraction is in phase or out of phase with scattering angle variation.
Wavelength dependence is an important feature of the enhancement. In the next section, we will use radiative transfer simulations to show that the spectral dependence of the reflectance enhancement is due to strong wavelength dependence of cloud phase function in the near backscattering angles.
4.2 Radiative transfer simulations
As shown by Marshak et al. (2021), the dependence of the TOA reflectance on the scattering angle resembles that of a cloud phase function. In this section, we first examine cloud scattering phase functions for the five EPIC wavelengths concerned. Then, we perform radiative transfer calculations to understand scattering angle induced reflectance enhancement. Here, we focus on water clouds. We assume that the cloud droplet follows Gamma distribution with an effective variance of 0.13 (Hansen and Travis, 1974; Nakajima and King, 1990). Mie calculations show that the extinction weakly depends on wavelength for effective radius above 5 μm and the single scattering albedo is close to 1. However, the scattering phase function in backward directions depends strongly on wavelength and effective radius. Figure 10 shows the scattering phase function for the typical cloud effective radius of 10 μm and two extreme conditions of effective radius of 5 μm and 30 μm. For all three effective radii, the phase function increases with the scattering angle reaching a local maximum, then decreases to a local minimum near perfect backscattering angle, followed by an increase to the backscattering of 180° except for the cloud effective radius of 30 μm for wavelengths at 388, 443, and 551 nm.
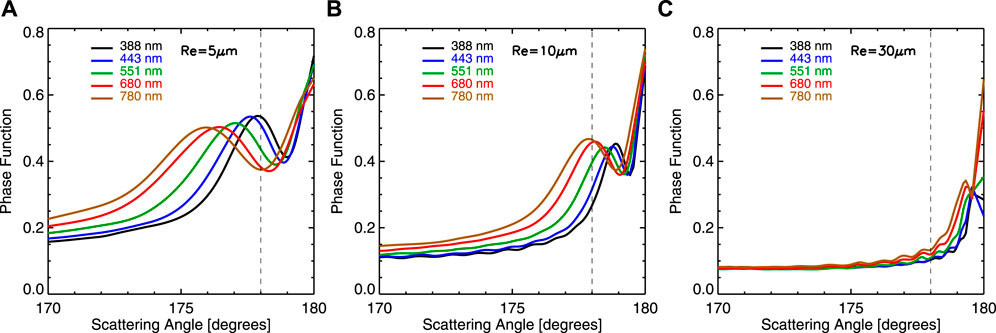
FIGURE 10. Scattering phase functions for the five EPIC wavelengths for the effective radius of 5, 10, and 30 μm.
For 30 μm, from 170° to 175°, there is little change in the phase functions; from 175° to 178° there is a small change in phase functions with insignificant wavelength dependence compared to the other two cloud effective radius situations. Because the scattering phase function resembles reflectance, as discussed in the following, and neither phase function for effective radius of 5 μm nor 30 μm resembles the EPIC observed spectral reflectance enhancement (e.g., phase function decreases with wavelength for effective radius of 5 μm for scattering angle near 178°, small wavelength dependence of phase function for effective radius of 30 μm), these two extreme scenarios do not explain the EPIC observations.
For 10 μm, a typical cloud effective radius, the phase function increases with scattering angle up to ∼178° for all five wavelengths. For a given scattering angle between 170° and 178°, the phase function monotonically increases with wavelength, a feature consistent with the wavelength dependence of the enhancement (see Figure 6). In fact, the phase function for 780 nm reaches the local maximum at ∼178° as the scattering angle increases. At 178°, the maximum EPIC scattering angle, the phase function decreases from 0.46 for 780 nm to 0.27 for 388 nm, about a 40% decrease. Thus, this realistic scenario resembles reflectance enhancement implied by EPIC observations. In fact, the wavelength dependence of the water cloud scattering phase near the backscattering directions is the origin of the glory, one of the spectacular natural optical phenomena. In a case study, Mayer et al. (2004) used the reflected sunlight in the glory directions to retrieve water cloud droplet size distributions.
We simulate TOA reflectance for understanding the wavelength dependence of scattering angle induced reflectance enhancement. To simulate TOA reflectance for a given solar zenith angle and scattering angle, one needs to know the satellite viewing zenith angle and relative azimuth angle to the direction of incident sunlight. One can show that the scattering angle (
where
To simulate TOA reflectance for given
One can show that, for given
Figure 11 presents TOA reflectance as a function of scattering angle for the five EPIC wavelengths for different cloud optical depth and solar zenith angle for calculated
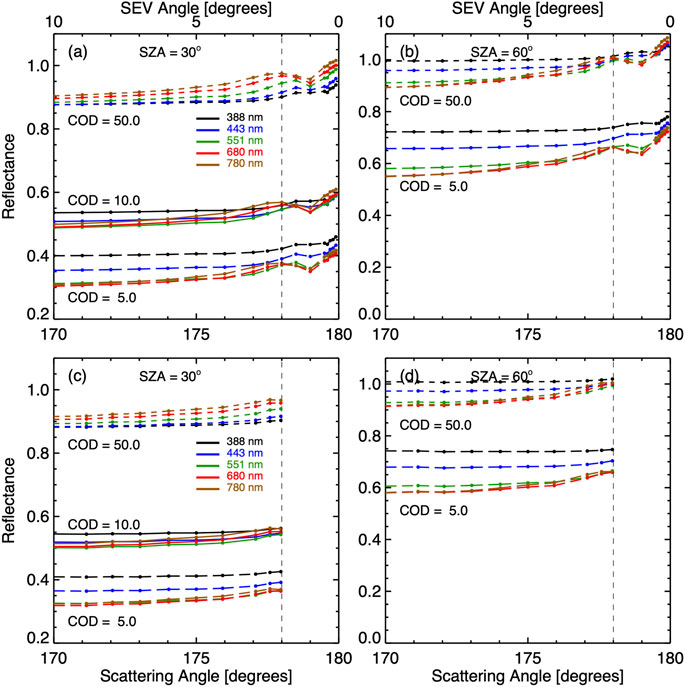
FIGURE 11. Spectral reflectance (
Here, we examine reflectance change (or enhancement) relative to scattering angle of 170° in Figure 12. It is important to note that, for a given solar zenith angle, the enhancement of spectral reflectance purely due to the change in scattering angle does not depend on cloud optical depth. This is because the shape of the reflectance curve is primarily determined by single scattering and closely resembles the cloud phase function. As cloud optical depth increases, diffuse radiation from multiple scattering contributions becomes more isotropic to increase the TOA reflectance, resulting in similar features in scattering angle dependence. Here we focus on reflectance change for scattering angle up to 178°, the maximum scattering angle in EPIC observations. For a given scattering angle, the enhancement increases with wavelength for a given solar zenith angle except for the scattering angle of 178°, for which the enhancement is about the same for the red and NIR channels. Here we examine the enhancement for the scattering angle of 178°. For a solar zenith angle of 30°, the enhancement for the NIR channel is about 0.07, about three times as large as the enhancement for the UV channel. For a solar zenith angle of 60°, the enhancement for the NIR channel is about 0.12, about six times as large as the enhancement for the UV channel.
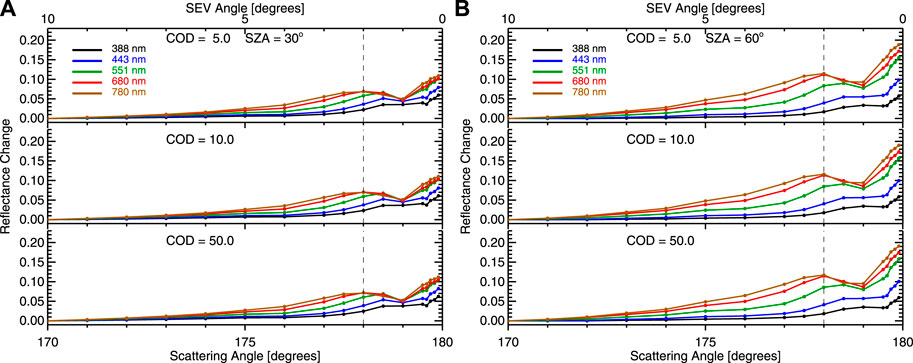
FIGURE 12. Spectral reflectance changes relative to scattering angle of 170° as a function of scattering angle for different cloud optical depth and solar zenith angle.
Figure 13 shows the percent changes of the TOA reflectance relative to the scattering angle of 170°. Like absolute reflectance change, the percent reflectance change increases with wavelength except for the scattering angle of 178°, for which the percent enhancement is about the same for the red and NIR channels. Unlike absolute reflectance change, the percent change of the TOA reflectance change decreases with cloud optical depth.
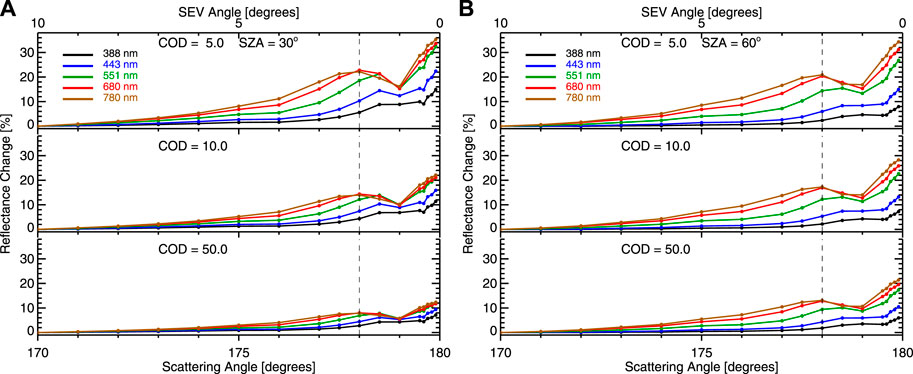
FIGURE 13. Percent changes of spectral reflectance relative to scattering angle of 170° as a function of scattering angle for different cloud optical depth and solar zenith angle.
Here, we examine the enhancement for a scattering angle of 178°. For the solar zenith angle of 30°, as cloud optical depth increases from 5 to 10 and 50, the enhancement for the NIR channel at 780 nm decreases from 22% to 14% and 8%, while the enhancement for the UV channel at 388 nm decreases from 6% to 5% and 3%. The percent enhancement for the NIR channel is about three times as large as that for the UV channel. For the solar zenith angle of 60°, there is less dependence on cloud optical depth compared to the solar zenith angle of 30°; as cloud optical depth increases from 5 to 10 and 50, the enhancement for the NIR channel at 780 nm decreases from 20% to 17% and 13%, while the enhancement for the UV channel at 388 nm is about ∼3% for cloud optical depth of 5 and decreases slightly as cloud optical depth increases. The percent enhancement for the NIR channel is about 4–6 times as large as that for the UV channel.
In reality, the change in spectral reflectance is a result of a change in scattering angle and cloud amount. For the first scenario of reflectance enhancement (Figure 7), the increase of reflectance in 680 and 780 nm from day 15–40 is mainly due to a much larger scattering angle effect compared to shorter wavelengths when the scattering angle approaches 178° and the scattering angle effect dominates. Similarly, we can explain the wavelength dependence of enhanced spectral reflectance by considering the change of cloud fraction and wavelength dependence of scattering angle induced enhancement.
5 Summary
We have analyzed EPIC observed global average reflectance in 2021, the year when the scattering angle reaches the extreme value of 178° or SEV angle of 2°. There are four spikes in spectral reflectance in 2021. Those spikes were not in 2016 EPIC observations nor in the CERES SW flux. Rather, they coincide with the peaks of scattering angle near 178°. The reflectance enhancement depends strongly on wavelength and is influenced by the change in global average cloud amount. The enhancement is mainly due to low level clouds. We also found that the strong wavelength dependence of the enhancement is primarily due to wavelength dependence of cloud scattering phase function. Radiative transfer calculations show that the change in scattering angles has the largest impact on TOA reflectance in the red and NIR channels at 680 nm and 780 nm and the smallest influence on reflectance in the UV channel at 388 nm, a similar feature in the EPIC observed global reflectance enhancement. The change in cloud amount in a cycle of scattering angle variation also plays an important role in increasing or decreasing the enhancement depending on whether the change in cloud fraction is in phase or out of phase with scattering angle variation.
Data availability statement
The datasets presented in this study can be found in online repositories. The names of the repository/repositories and accession number(s) can be found below: https://epic.gsfc.nasa.gov/science/calibration/uv, https://epic.gsfc.nasa.gov/science/calibration/visnir, https://eosweb.larc.nasa.gov/, https://ceres.larc.nasa.gov.
Author contributions
GW and AM wrote the paper together. This is a follow-up of the earlier work led by AM. All authors contributed to the article and approved the submitted version.
Acknowledgments
We are grateful to the DSCOVR science team for producing EPIC data products. The EPIC and CERES data were obtained from the NASA Langley Research Center Atmospheric Science Data Center.
Conflict of interest
The authors declare that the research was conducted in the absence of any commercial or financial relationships that could be construed as a potential conflict of interest.
Publisher’s note
All claims expressed in this article are solely those of the authors and do not necessarily represent those of their affiliated organizations, or those of the publisher, the editors and the reviewers. Any product that may be evaluated in this article, or claim that may be made by its manufacturer, is not guaranteed or endorsed by the publisher.
References
Ahn, C., Torres, O., Jethva, H., Tiruchirapalli, R., and Huang, L.-K. (2021). Evaluation of aerosol properties observed by DSCOVR/EPIC instrument from the Earth-Sun Lagrange 1 orbit. J. Geophys. Res. Atmos. 126, e2020JD033651. doi:10.1029/2020JD033651
Carn, S. A., Krotkov, N. A., Fisher, B. L., Li, C., and Prata, A. J. (2018). First observations of volcanic eruption clouds from the L1 Earth-Sun Lagrange point by DSCOVR/EPIC. Geophys. Res. Lett. 45. doi:10.1029/2018GL079808
Delgado-Bonal, A., Marshak, A., Oreopoulus, L., and Yang, Y. (2022). Cloud height daytime variability from DSCOVR/EPIC and GOES-R/ABI observations. Front. Remote Sens 3. doi:10.3389/frsen.2022.780243
Delgado-Bonal, A., Marshak, A., Yang, Y., and Oreopoulos, L. (2020). Daytime variability of cloud fraction from DSCOVR/EPIC observations. J. Geophys. Res. Atmos. 125, e2019JD031488. doi:10.1029/2019JD031488
Doelling, D. R., Sun, M., Nguyen, L. T., Nordeen, M. L., Haney, C. O., Keyes, D. F., et al. (2016). Advances in geostationary-derived longwave fluxes for the CERES synoptic (SYN1deg) product. J. Atmos. Ocean. Technol. 33 (3), 503–521. doi:10.1175/JTECH-D-15-0147.1
Frouin, R., Tan, J., Compiegne, M., Ramon, D., Sutton, M., Murakami, H., et al. (2022). The NASA EPIC/DSCOVR ocean PAR product. Front. Remote Sens 3. doi:10.3389/frsen.2022.833340
Frouin, R., Tan, J., Ramon, D., Franz, B., and Murakami, H. (2018). Estimating photosynthetically available radiation at the ocean surface from EPIC/DSCOVR data. Remote Sens. Open Coast. Ocean Inland Waters (24), 1077806. doi:10.1117/12.2501675
Geogdzhayev, I. V., and Marshak, A. (2018). Calibration of the DSCOVR EPIC visible and NIR channels using MODIS and EPIC lunar observations. Atmos. Meas. Tech. doi:10.5194/amt-2017-222
Hansen, J. E., and Travis, L. D. (1974). Light scattering in planetary atmospheres. Space Sci. Rev. 16, 527–610. doi:10.1007/BF00168069
Herman, J., Huang, L., Hafner, D., and Szabo, A. (2023). Measurement report: Observed increase in southern Hemisphere reflected energy from clouds during december 2020 and 2021. Atmos. Chem. Phys. Discuss. [preprint]. doi:10.5194/acp-2022-481
Herman, J. R., Huang, L., McPeters, R. D., Ziemke, J., Cede, A., and Blank, K. (2018). Synoptic ozone, cloud reflectivity, and erythemal irradiance from sunrise to sunset for the whole Earth as viewed by the DSCOVR spacecraft from the Earth–sun Lagrange 1 orbit. Atmos. Meas. Tech. 11, 177–194. doi:10.5194/amt-11-177-2018
King, M. D., Platnick, S. E., Menzel, W. P., Ackerman, S. A., and Hubandks, P. A. (2013). Spatial and temporal distribution of clouds observed by MODIS onboard the Terra and Aqua satellites. IEEE Trans. Geosci. Remote Sens. 51, 3826–3852. doi:10.1109/TGRS.2012.2227333
Kramarova, N. A., Zimke, J. R., Huang, L.-K., and Herman, J. R. (2021). Evaluation of Version 3 total and tropospheric ozone columns from EPIC on DSCOVR for studying regional scale ozone variations. Front. Remote Sens, 2. doi:10.3389/frsen.2021.734071
Lester, T. P., McCall, M. L., and Tatum, J. B. (1979). Theory of planetary photometry. J. R. Astron. Soc. Can. 73, 233–257.
Lyapustin, A., Go, S., Korkin, S., Wang, Y., Torres, O., Jethva, H., et al. (2021). Retrievals of aerosol optical depth and spectral absorption from DSCOVR EPIC. Front. Remote Sens. 2. doi:10.3389/frsen.2021.645794
Marshak, A., Delgado-Bonal, A, and Knyazikhin, Y (2021). Effect of scattering angle on earth reflectance. Front. Remote Sens. 2, 719610. doi:10.3389/frsen.2021.719610
Marshak, A., Herman, J., Szabo, A., Blank, K., Cede, A., Carn, S., et al. (2018). Earth observations from DSCOVR/EPIC instrument. Bull. Amer. Meteor. Soc. (BAMS) 9, 1829–1850. doi:10.1175/BAMS-D-17-0223.1
Marshak, A., and Knyazikhin, Y. (2017). The spectral invariant approximation within canopy radiative transfer to support the use of the EPIC/DSCOVR oxygen B-band for monitoring vegetation. J. Quant. Spectrosc. Radiat. Transf. 191, 7–12. doi:10.1016/j.jqsrt.2017.01.015
Marshak, A., Varnai, T., and Kostinski, A. (2017). Terrestrial glint seen from deep space: Oriented ice crystals detected from the Lagrangian point. Geoph. Res. Lett. 44, 5197–5202. doi:10.1002/2017GL073248
Mayer, B., Schröder, M., Preusker, R., and Schüller, L. (2004). Remote sensing of water cloud droplet size distributions using the backscatter glory: A case study. Atmos. Chem. Phys. 4, 1255–1263. doi:10.5194/acp-4-1255-2004
Molina García, V., Sasi, S., Efremenko, D., Doicu, A., and Loyola, D. (2018). Radiative transfer models for retrieval of cloud parameters from EPIC/DSCOVR measurements. J. Quantitative Spectrosc. Radiat. Transf. 123, 228–240. doi:10.1016/j.jqsrt.2018.03.014
Nakajima, T., and King, M. D. (1990). Determination of the optical thickness and effective particle radius of clouds from reflected solar radiation measurements. Part I: Theory. J. Atmos. Sci. 47, 1878–1893. doi:10.1175/1520-0469(1990)047<1878:DOTOTA>2.0.CO;2
Penttilä, A., Muinonen, K., Ihalainen, O., Uvarova, E., Vuori, M., Xu, G., et al. (2022). Temporal variation of the shortwave albedo of the Earth. Front. Remote Sens. 3. doi:10.3389/frsen.2022.790723
Song, W., Knyazikhin, Y., Wen, G., Marshak, A., Mõttus, M., Yan, G., et al. (2018). Implications of whole-disc DSCOVR EPIC spectral observations for estimating earth’s spectral reflectivity based on low-earth-orbiting and geostationary observations. Remote Sens. 10, 1594. doi:10.3390/rs10101594
Stamnes, K., Tsay, S. C., Wiscombe, W., and Jayaweera, K. (1988). Numerically stable algorithm for discrete-ordinate-method radiative transfer in multiple scattering and emitting layered media, Appl. Opt., 27 (12), 2502–2509. doi:10.1364/AO.27.002502
Su, W., Liang, L., Doelling, D. R., Minnis, P., Duda, D. P., Khlopenkov, K. V., et al. (2018). Determining the shortwave radiative flux from Earth polychromatic imaging camera. J. Geophys. Res. 123, 11,479–11,491. doi:10.1029/2018JD029390
Su, W., Liang, L., Duda, D. P., Khlopenkov, K., and Thieman, M. M. (2021). Global daytime mean shortwave flux consistency under varying EPIC viewing geometries. Front. Remote Sens 2. doi:10.3389/frsen.2021.747859
Wen, G., Marshak, A., Song, W., Knyazikhin, Y., Mõttus, M., and Wu, D. (2019). A relationship between blue and near-IR global spectral reflectance and the response of global average reflectance to change in cloud cover observed from EPIC. Earth Space Sci. 6, 1416–1429. doi:10.1029/2019EA000664
Wiscombe, W. J., and Warren, S. G. (1980). A model for the spectral albedo of snow. I. Pure snow. J. Atmos. Sci. 37, 2712–2733. doi:10.1175/1520-0469(1980)037<2712:AMFTSA>2.0.CO;2
Xu, X., Wang, J., Wang, Y., Zeng, J., Torres, O., Reid, J., et al. (2019). Detecting layer height of smoke aerosols over vegetated land and water surfaces via oxygen absorption bands: Hourly results from EPIC/DSCOVR in deep space. Atmos. Meas. Tech. 12, 3269–3288. doi:10.5194/amt-12-3269-2019
Xu, X., Wang, J., Wang, Y., Zeng, J., Torres, O., Yang, Y., et al. (2017). Passive remote sensing of altitude and optical depth of dust plumes using the oxygen A and B bands: First results from EPIC/DSCOVR at Lagrange-1 point. Geophys. Res. Lett. 44, 7544–7554. doi:10.1002/2017GL073939
Yang, B., Knyazikhin, Y., Mõttus, M., Rautiainen, M., Stenberg, P., Yan, L., et al. (2017). Estimation of leaf area index and its sunlit portion from DSCOVR EPIC data: Theoretical basis. Remote Sens. Environ. 198, 69–84. doi:10.1016/j.rse.2017.05.033
Yang, K., and Liu, X. (2019). Ozone profile climatology for remote sensing retrieval algorithms. Atmos. Meas. Tech. 12, 4745–4778. doi:10.5194/amt-12-4745-2019
Keywords: radiative transfer, scattering angle, spectral reflectance, clouds, DSCOVR EPIC
Citation: Wen G and Marshak A (2023) Effect of scattering angle on DSCOVR/EPIC observations. Front. Remote Sens. 4:1188056. doi: 10.3389/frsen.2023.1188056
Received: 16 March 2023; Accepted: 22 May 2023;
Published: 01 June 2023.
Edited by:
Pradeep Kumar, Jawaharlal Nehru University, IndiaReviewed by:
Víctor Molina García, Remote Sensing Technology Institute, GermanyVijay Natraj, NASA Jet Propulsion Laboratory (JPL), United States
Copyright © 2023 Wen and Marshak. This is an open-access article distributed under the terms of the Creative Commons Attribution License (CC BY). The use, distribution or reproduction in other forums is permitted, provided the original author(s) and the copyright owner(s) are credited and that the original publication in this journal is cited, in accordance with accepted academic practice. No use, distribution or reproduction is permitted which does not comply with these terms.
*Correspondence: Guoyong Wen, R3VveW9uZy5XZW5AbmFzYS5nb3Y=
 Guoyong Wen
 Alexander Marshak