
94% of researchers rate our articles as excellent or good
Learn more about the work of our research integrity team to safeguard the quality of each article we publish.
Find out more
ORIGINAL RESEARCH article
Front. Remote Sens., 22 February 2023
Sec. Image Analysis and Classification
Volume 4 - 2023 | https://doi.org/10.3389/frsen.2023.1118745
This article is part of the Research TopicAdvances in Deep Learning Approaches Applied to Remotely Sensed ImagesView all 6 articles
 Joseph Nied1
 Michael Jones1,2*
 Shane Seaman1
 Taylor Shingler1
 Johnathan Hair1
 Brian Cairns3David Van Gilst4
 Anthony Bucholtz5
 Sebastian Schmidt6Seethala Chellappan7
 Paquita Zuidema7
 Bastiaan Van Diedenhoven8
 Armin Sorooshian9,10
 Snorre Stamnes1*
For aerosol, cloud, land, and ocean remote sensing, the development of accurate cloud detection methods, or cloud masks, is extremely important. For airborne passive remotesensing, it is also important to identify when clouds are above the aircraft since their presence contaminates the measurements of nadir-viewing passive sensors. We describe the development of a camera-based approach to detecting clouds above the aircraft via a convolutional neural network called the cloud detection neural network (CDNN). We quantify the performance of this CDNN using human-labeled validation data where we report 96% accuracy in detecting clouds in testing datasets for both zenith viewing and forward-viewing models. We present results from the CDNN based on airborne imagery from the NASA Aerosol Cloud meteorology Interactions oVer the western Atlantic Experiment (ACTIVATE) and the Clouds, Aerosol, and Monsoon Processes Philippines Experiment (CAMP2Ex). We quantify the ability of the CDNN to identify the presence of clouds above the aircraft using a forward-looking camera mounted inside the aircraft cockpit compared to the use of an all-sky upward-looking camera that is mounted outside the fuselage on top of the aircraft. We assess our performance by comparing the flight-averaged cloud fraction of zenith and forward CDNN retrievals with that of the prototype hyperspectral total-diffuse Sunshine Pyranometer (SPN-S) instrument’s cloud optical depth data. A comparison of the CDNN with the SPN-S on time-specific intervals resulted in 93% accuracy for the zenith viewing CDNN and 84% for the forward-viewing CDNN. The comparison of the CDNNs with the SPN-S on flight-averaged cloud fraction resulted in an agreement of .15 for the forward CDNN and .07 for the zenith CDNN. For CAMP2Ex, 53% of flight dates had above-aircraft cloud fraction above 50%, while for ACTIVATE, 52% and 54% of flight dates observed above-aircraft cloud fraction above 50% for 2020 and 2021, respectively. The CDNN enables cost-effective detection of clouds above the aircraft using an inexpensive camera installed in the cockpit for airborne science research flights where there are no dedicated upward-looking instruments for cloud detection, the installation of which requires time-consuming and expensive aircraft modifications, in addition to added mission cost and complexity of operating additional instruments.
For passive remote sensing of aerosols from aircraft, the importance of detecting and masking for clouds below the aircraft is well-known, but the impact of high-level clouds above the aircraft is often ignored. In fact, above-aircraft cloud contamination by thin cirrus or supercooled liquid water clouds can significantly impact aerosol optical and microphysical property retrievals (Stamnes et al., 2018). For airborne passive remote sensing of aerosol, cloud, and surface properties, it is critical to carry instruments on the aircraft that can detect the presence of above-aircraft clouds. A recent study reveals that below-cloud aerosols share properties similar to those without overlying clouds, but the large fraction of below-cloud aerosols indicates a likely significant impact of above-aircraft cirrus on the aerosol direct radiative effect. This significant impact is due to 50% of the total aerosols being located below thin-cirrus clouds (Hong and Di Girolamo, 2022). Our paper studies the possibilities of detecting such above-aircraft clouds from upward-looking cameras mounted in the cockpit and on top of the aircraft by processing the images using convolutional neural networks.
Cloud mask improvements can lead directly to better remote-sensing retrieval products by improving their coverage and increasing their accuracy, e.g., distinguishing snow-covered terrain from clouds (Chen et al. (2018); Stillinger et al. (2019). If cloud masks are highly accurate, retrievals of snow grain size and water droplet effective radius can be properly applied to the scene without biases caused by contamination. ACTIVATE, CAMP2Ex, and future airborne research flight campaigns that rely on passive remote sensing can benefit similarly from accurate cloud masks.
Camera-based cloud masks can be used to validate satellite-based cloud masks by providing fine spatial resolution ground truth validation data. Such satellite cloud masks have been generated by passive instruments such as the MODIS and ASTER instruments, and from lidars like CALIOP. Frey et al. (2008) describe how MODIS cloud masks, such as MOD35 and MYD35, are tested and evaluated across different case environments in field data (e.g., nighttime vs. daytime, land vs. ocean, and Sun glint) to assess where improvements can be made. Studies have shown weaknesses in the ability of the MODIS cloud masks to detect optically thin clouds such as thin cirrus. Thin-cirrus clouds do not have high visibility within MODIS imagery but are able to be detected by coincident lidar measurements from the CALIOP instrument (Sun et al., 2011).
Machine learning and specifically neural networks are increasingly recognized as useful research tools that can help solve problems in cloud detection and remote sensing. An and Shi (2015) describe the advancement of cloud detection capabilities and outline a process of training neural networks to detect clouds by supplying satellite-based imagery that is human-labeled to indicate the presence of clouds. The neural networks were able to learn to detect the presence and location of clouds on a pixel-by-pixel basis. Further progress was made by Johnston et al. (2017) using a different internal network structure and hyperparameters to help optimize the correct learning of cloud imagery. Johnston et al. (2017) used binary confusion matrix characteristics, such as true positive and true negative classification success against a testing dataset, to evaluate neural networks in detecting clouds, which we will similarly adopt in this study.
We introduce a cloud detection neural network (CDNN) algorithm to detect the presence of clouds above aircraft using data from the Aerosol Cloud meTeorology Interactions oVer the western Atlantic Experiment (ACTIVATE) and the Clouds, Aerosol, and Monsoon Processes Philippines Experiment (CAMP2Ex) flight campaigns. These NASA flight campaigns relied on aircraft with mounted sensors to retrieve readings on cloud and aerosol properties. From the ACTIVATE and CAMP2Ex flight campaigns, we use camera data taken from mounted cameras on an aircraft that view surrounding clouds and atmospheric imagery. The mounted cameras are positioned to capture imagery from the forward-, nadir-, and zenith-viewing directions of the aircraft.
For the CAMP2Ex flight campaign, flights took place in the regions surrounding the Philippines in 2019 to study aerosol–cloud properties using remote and in situ instruments onboard the aircraft. The research flights sampled a wide variety of aerosol types and loadings, from smoke to marine aerosol, and a wide variety of cloud types from shallow cumulus and thin-cirrus clouds, while also experiencing the complex meteorology of the local monsoon season. Camera data that were used for the CDNN project from the CAMP2Ex flight campaign were sourced from the P-3 aircraft, capturing imagery from three cameras looking in the forward-, nadir-, and zenith-viewing directions, respectively. CAMP2Ex did have an additional aircraft, the Lear Jet aircraft, that flew during the campaign but did not have mounted cameras that were used for the CDNN project.
The ACTIVATE flight campaign captured airborne camera images during flights in 2020, 2021, and 2022 (Sorooshian et al., 2019). ACTIVATE research flights fly over the western North Atlantic Ocean area from January to June, each flight year with some exceptions such as flights in August–September 2020. A high-flying King Air aircraft made remote-sensing measurements, while the low-flying HU-25 Falcon conducted in situ measurements. These two planes fly in vertical coordination to simultaneously observe aerosol and cloud properties in the same atmospheric column. Camera data used for the CDNN project were recorded on the King Air aircraft, capturing data in the forward- and nadir-viewing directions of the aircraft. Since there was no dedicated zenith-viewing camera in the ACTIVATE flight campaign, the forward-viewing camera was angled to allow the partial capture of above-aircraft clouds.
The CDNN is trained and tested in a manner roughly similar to the work of An and Shi (2015) and Johnston et al. (2017) but is applied to the imagery that is taken from aircraft flight campaigns and not satellite imagery. Convolutional neural networks have been used in the past with aircraft imagery for different purposes than cloud detection, such as object detection of vegetation and assessing housing damage from natural disasters (Pi et al., 2020). The CDNN is applied to the camera data to generate cloud masks that flag when clouds are observed in the image. We compare these camera-based CDNN above-aircraft cloud masks from a forward-viewing camera and a zenith-viewing all-sky camera to a cloud mask generated from downwelling irradiance collected by the prototype hyperspectral total-diffuse Sunshine Pyranometer (SPN-S) instrument to validate the CDNN approach (Norgren et al., 2021).
The CDNN project is a novel approach to cloud masking that can provide an affordable and adaptable way to create cloud masks for airborne remote sensing. The advantage of using a camera to detect clouds is that it is cheaper to install and operate than current upward-looking instruments. Studies have shown that neural network models can provide advancements in cloud masking for satellite remote sensing. Based on the performance outlined in this study, the CDNN is proposed as a possible inexpensive solution to above-aircraft cloud masking for future airborne research flights where no other solution is afforded or possible. The CDNN is adaptable in that it can in the future also be applied to nadir-viewing imagery for the development of below-aircraft cloud masks, taking advantage of the large observing area and fine spatial resolution provided by modern cameras.
The methodology used to develop the CDNN is provided in Section 2. The CDNN is validated against human-labeled test data and SPN-S cloud optical depth (COD) sensor data in Section 3. We report CDNN cloud masks averaged over flight time in Section 4 for both the ACTIVATE and CAMP2Ex flight campaigns. We conclude with remarks on the capability of forward-looking and upward-looking cameras to detect above-aircraft clouds in Section 5.
The CDNN is a 2-dimensional convolutional neural network created to detect cirrus and high-level clouds from airborne-based camera images. Convolutional neural networks can be used to detect objects within static frame imagery of footage to ultimately create indicators for object presence (Sharma et al., 2018). Similar work has been carried out to create convolutional neural networks to detect clouds by taking in images from ground-based imagery and classifying them based on the presence and hue/opacity of the clouds (Zhang et al., 2018).
Our CDNN is able to output binary classifications in the presence of clouds within aircraft imagery. The CDNN operates by running a trained model against each image of the camera data, which generates a decimal probability P that indicates the likelihood of a cloud being present within the image. After probabilities are generated for each image, we then convert them into a Boolean of either “1” for true when P ≥ .5 or “0” for false when P
A framework using TensorFlow 2 (Abadi et al., 2016) was developed to train neural network models that follow the naming convention of
[trainingdataset].[samplemode].[target].[network].[optimizer].[batch size].[learning rate]
These naming attributes include the following hyperparameters that can be used to adjust the training.
1) Training dataset: The set of labeled images to train on (e.g., setD and setU).
2) Sample mode: The ratio of true to false (e.g., cloudy to non-cloudy) labels to use for training on the binary-classified data (e.g., min indicates a ratio of 1:1 (balanced) and max indicates a ratio of M:N (unbalanced), where M and N represent all samples within the dataset for each binary label of true and false classifications.
3) Target: The user-defined label to select for training (e.g., cirrus_clouds, cloud_shadows, cas, and white_caps).
4) Network: This denotes the underlying structure of the neural network, which includes layers, the number of neurons, activation functions, image augmentations, and image size (e.g., deep-full, deep-full-squared, and second-features-deep-full).
5) Optimizer: The TensorFlow 2 minimization function in charge of updating the neural network during training (e.g., adam and rmsprop).
6) Batch size: The number of images being considered when updating the neural network (e.g., 10, 50, and 200).
7) Learning rate: This indicates how rapidly the values learned by the neural network must be adjusted (e.g., 1e-3, 1e-4, and 1e-5).
The final hyperparameter that needs to be chosen is the number of epochs. The training is broken into discrete steps called epochs. Each epoch refers to one iteration of the training process that involves a minimization process to find the optimal neuron weights and biases. The entire dataset is used to recompute the weights and biases for each epoch, but the full dataset is broken into batches according to the batch size—this is to reduce the memory requirements and improve learning. Additionally, there is one fixed hyperparameter: the loss function, which is set to binary crossentropy.
The CDNN models are trained on aircraft camera data from the NASA ACTIVATE and CAMP2Ex missions. The video footage is captured from the cameras as listed in Table 1. The cameras are mounted at the forward-, nadir-, and zenith-viewing regions of the aircraft. It should be noted that while we have also trained and tested nadir-viewing CDNN models, the results and performance of these models are not discussed in this study and will be left for future work.
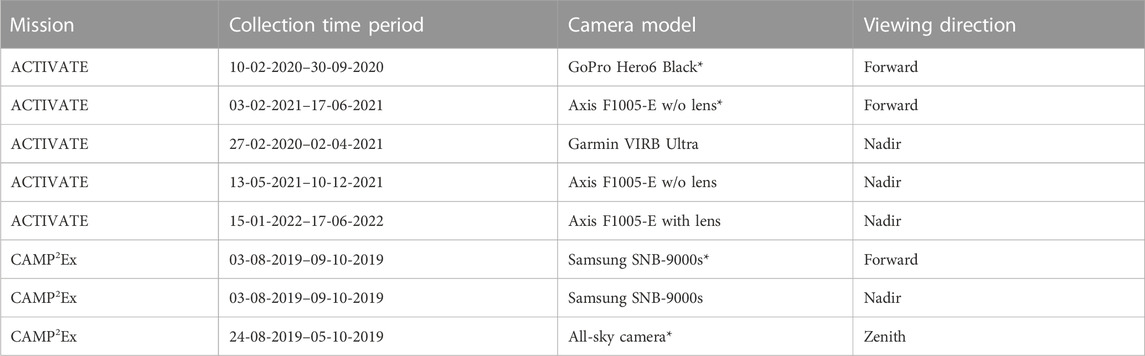
TABLE 1. Airborne cameras are used in the NASA ACTIVATE and CAMP2Ex campaigns. This table indicates the different camera models used in the ACTIVATE and CAMP2Ex flight campaigns. We report the time periods that different camera models collected images during each mission, but it should be noted that these dates may include test flights and thus may differ from the official dates for each campaign. Entries with an asterisk indicate the cameras that recorded data used to train and test our CDNNs.
The raw video footage is divided into either the training or testing datasets based on the number of original video files. For some of the research flights, there are multiple video files for a single day, such that a single research flight day may have video files that are present in both the training and testing datasets. However, there is absolutely no overlap in frames between the training and testing datasets, which ensures that there is no bias when testing the model’s performance. The video footage from ACTIVATE 2020 and CAMP2Ex 2019 is used to create the datasets, as shown in Table 2. Then, each of the individual frames from the videos is saved, constituting the data that make up the training and testing datasets.
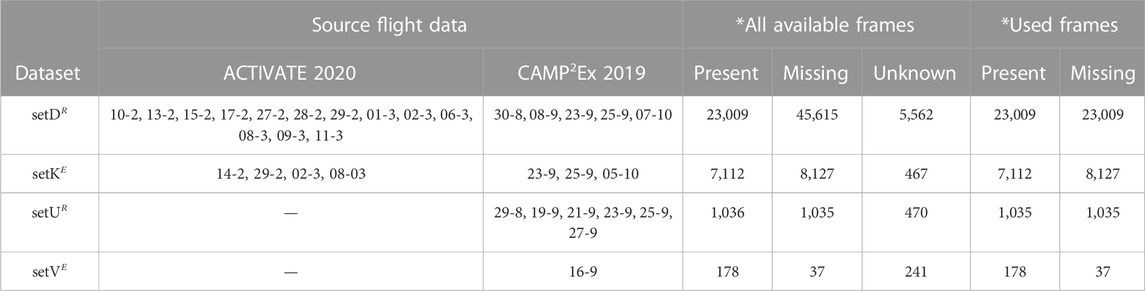
TABLE 2. Dataset information is used to train and test the forward CDNN and zenith CDNN. The sections denoted with a * represent the number of labeled frames where a given tag is present. For setD and setK, this is for the cirrus_clouds tag, which is associated with the forward CDNN. For setU and setV, this is for the cas tag, which is associated with the zenith CDNN. The Used Frames section does not contain an Unknown column since all frames that are not explicitly known are dropped from the training and testing datasets. Additionally, the Used Frames section specifies the number of frames that are used during training via the min sample mode and testing via the max sample mode. The datasets have a superscript of either R to label training data or E to label testing data. For the research flight dates, while there may be an overlap in the days between training and testing sets, there is zero shared footage. The reason for this is that there are multiple videos taken on certain research flight days.
All frames are manually labeled by hand using a binary classifier to assess whether a given tag is present in the imagery. Each frame can have one of three labels.
1) Present: The tag exists within the image.
2) Missing: The tag does not exist within the image.
3) Unknown: As the frames are human-labeled, there are some cases that cannot be definitively categorized, so we choose to keep them separate.
The reason for the Unknown label is to ensure that no incorrect data are used for training or testing the model, as the model may otherwise learn unintended features in the imagery. Therefore, all frames labeled as Unknown are dropped from the training and testing data.
The model that is trained to detect forward-viewing clouds is named:
setD.min.cirrus_clouds.deep-full.adam.200.1e-5, epoch58
Going forward, this trained neural network will be referred to as the forward CDNN.
The forward CDNN is trained on setD using data from both the NASA ACTIVATE and CAMP2Ex flight campaigns as specified in Table 2. The data are labeled to identify the presence of above-aircraft clouds using the cirrus_clouds tag. This binary true/false classifier simply identifies if there are any clouds present or not in the image. Using the min sample mode, the labeled data consist of 23,009 cloudy cases and 23,009 clear cases for a total of 46,018 samples. This leads to a one-to-one ratio of the binary label classifications, resulting in a balanced dataset. The forward CDNN is tested on setK as specified in Table 2, using the same tag as setD. All the labeled data are used for testing, which consists of 7,112 cloudy cases and 8,127 clear cases for a total of 15,239 samples. The reason for using all frames via the max sample mode is that we would like to use all available labeled data that can be tested.
Some of the images that form setD and setK are cropped to ensure that above-aircraft clouds are featured. This crop encourages the neural network to focus on learning about the presence or absence of cloud features rather than unrelated features such as the nose of the plane or an overlaid timestamp. All crops are performed relative to the top left corner of each image since our cropping algorithms initiate the coordinates (x,y) = (0, 0) as the origin in the top left of each image. Cropping is only performed on CAMP2Ex imagery, as we found that cropping does not improve performance for ACTIVATE footage. For setD, we use a crop of x = [386, 3453] and y = [75, 1800] to capture the above-aircraft clouds. Then, for setK, we use a more precise crop of x = [390, 3450] and y = [75, 1000] to better target and test against just the clouds above the aircraft. Example images with cropping for CAMP2Ex are shown in Figure 1.
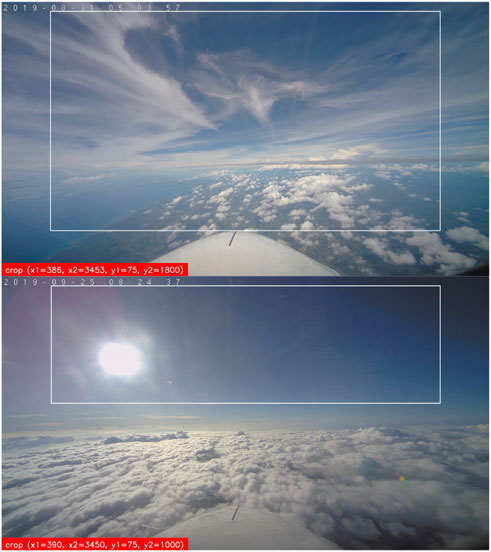
FIGURE 1. Examples of forward-viewing imagery from the CAMP2Ex campaign. The top image is a part of setD, while the bottom image is a part of setK. The images are cropped to remove the nose of the plane, remove the timestamp, and to focus on clouds positioned above the aircraft (white outline). The top image has a cirrus_clouds tag that is labeled as Present, while the bottom image is labeled as Missing.
The forward CDNN is built on the deep-full network. Input images are constrained to a height of 288 pixels and a width of 512 pixels, where input images of sizes outside of this range will be scaled proportionally. Scaling is performed within the function preprocessing.image.load_img, from TensorFlow 2’s Keras library, where we use the default parameter of nearest neighbor interpolation for scaling (Olivier and Hanqiang, 2012). The red, green, and blue layers are fed independently into the first layer, resulting in a complete input size of (288, 512, 3). We artificially inflate the amount of training data by applying so-called “augmentations” to the images at random before they are passed into the neural network. Augmentations represent a random combination of some or all of the following operations on an image: 1) zooming in toward the center, 2) flipping both vertically and horizontally, and 3) adjusting the contrast (or brightness). By applying these augmentations, it helps prevent static portions of the image, such as a part of the plane, from interfering with the neural network’s learning. We define the augmentations that are to be used in the model’s network. The CDNN code calls the underlying TensorFlow 2 image augmentation functions: random_brightness, random_zoom, random_flip_left_right, and random_flip_up_down.
The deep-full network has an architecture with six convolutional layers. Convolutional layers are the layers of a network that apply a kernel or filter to an image to extract spatial features from imagery, such as cloud imagery features in our case (O’Shea and Nash, 2015). The convolutions have a monotonically increasing feature count of 32, 32, 64, 64, 128, and 128 to allow further expansion of cloud imagery characteristics. Each convolutional layer is followed by a (2, 2) pooling layer to cut down on the number of pixels. Pooling layers are used to remove the remaining pixels from the border of an image after a convolutional layer is applied to reduce the image size for the next layer. Then, during training, a 20% dropout is used after each pooling layer to aid in the learning of unique features. Dropout allows us to limit overfitting in our datasets by randomly removing neurons and their prior connections to make sure that outlier patterns are not given a higher weighting in output features (Srivastava et al., 2014). After the convolutional layers are applied, the pixels are flattened into a single, one-dimensional array. The remaining two hidden layers are dense, fully connected layers with respective neuron counts of 128 and 64. Dense layers are connected to prior layers to be able to map to our output, indicating an ultimate weight and reporting whether there are clouds present (O’Shea and Nash, 2015). Both of these dense layers are followed by a 50% dropout rate during training. The final classification outputs from a singular neuron that has a sigmoid activation function. We tested many different network structures, changing the number of convolutional layers, number of features, dropout size, and pooling size, and ultimately decided on the aforementioned structure due to the features that were seen within the layers after applying them to imagery.
The following remaining hyperparameters for the forward CDNN are passed in during training. The optimizer is adam, and the loss function is binary_crossentropy. A batch size of 200 images is used to maximize the use of the available system memory. The learning rate is set to 1e-3 (.001), which is TensorFlow 2’s default rate. We tested the forward CDNNs using different learning rates but did not find an improvement in the model’s accuracy.
The model that is trained to detect zenith-viewing clouds is named.
setU.min.cas.deep-full-square .adam.200.1e-5, epoch83
Going forward, this trained neural network will be referred to as the zenith CDNN.
The zenith CDNN differs from the forward CDNN in that it is trained to detect clouds from an all-sky camera that observes a 180° field of view (FOV). The zenith CDNN is trained on setU using data from only the CAMP2Ex flight campaign since the ACTIVATE flight campaign does not include a zenith-viewing all-sky camera, as specified in Table 2. The data are labeled to identify the presence of clouds, aerosols, and smoke using the binary classifier cas tag. We list both aerosols and smoke separately since they have different visual characteristics, such as smoke being dark and opaque, whereas aerosols are relatively lighter and more transparent in appearance. Using the min sample mode to obtain a balanced dataset, the labeled data consist of 1,062 cases where the tag is present and 1,062 clear cases for a total of 2,124 samples. The zenith CDNN is tested on setV as specified in Table 2, using the same tag as setU. All the labeled data are used for testing, which consists of 178 cases where the tag is present and 37 clear cases for a total of 215 samples.
In comparison to Section 2.2, the zenith datasets have fewer labeled images than the forward datasets because the zenith all-sky camera data are captured approximately every 15 seconds, while the forward imagery is captured at 30 frames per second (FPS) for CAMP2Ex and two FPS for the ACTIVATE. The difference in frame rates means that the zenith-viewing data have much fewer images for a single flight in comparison to the forward-viewing data. Even though the zenith CDNN is trained on a smaller dataset than the forward CDNN, the model is still able to detect clouds with high accuracy.
The CAMP2Ex zenith-viewing camera is an all-sky camera that records images at 3096×2080 pixel resolution. The sides are pillarboxed with black pixels that encapsulate the circular 180° FOV. The images within setU and setV are cropped to 1280×1280 at the approximate center of the frame using the crop x = [908, 2188], y = [400, 1680], with respect to the top left corner of each image, as previously stated. This crop is used to minimize the impact of clouds near the edge of the camera view that are not directly above the aircraft while preserving the ability to view clouds that are within a 60° FOV. We additionally remove the black space on both sides of the frames of the zenith data that can be partially seen. The 60° FOV implies that we should apply the zenith CDNN only when the solar zenith angle (SZA) is less than 60° to ensure the Sun is above the aircraft. An example image with our specified crop is shown in Figure 2.
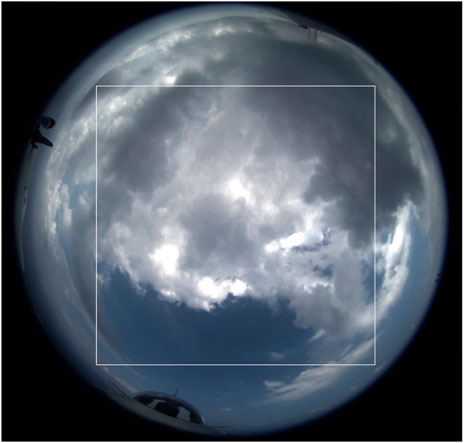
FIGURE 2. Example of the cropped all-sky camera zenith-viewing imagery, from CAMP2Ex flight 21-09-2019. The images are cropped to remove clouds near the edge of the camera and the black border on the image.
Specular artifacts and noise can exist in the zenith all-sky camera data due to glare from the Sun, debris on the lens, or specular reflections. To minimize the impact of these artifacts, we augment the training data similarly to how it is performed for the forward CDNN by flipping and scaling the brightness. The zoom augmentations are not used for the zenith CDNN since we wish to look for clouds in the entire image that spans 60° FOV. Other artifacts include reflection attributes within the all-sky camera data, as shown in Figure 3. These types of artifacts will be referred to as “reflective artifacts.” Blocking reflective artifacts are reflective spots that hide objects within a frame of the video. The black reflections are typically surrounded by a halo of light from similar specular reflections seen as glare from the Sun. These artifacts are thought of to be caused by reflections off the aircraft’s body into the lens of the camera. All artifacts remain in the training and testing data.
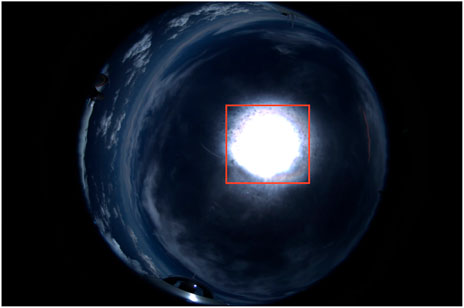
FIGURE 3. Example of the reflective artifact (red box) seen in the all-sky camera and zenith-viewing imagery, from CAMP2Ex flight 27-09-2019.
The zenith CDNN is built on a network similar to that described in Section 2.2, but with minor changes to adapt to the needs of our zenith data and model functionality. The network is called deep-full-square since it has the same exact network structure as deep-full but with a newly defined square ratio (1:1) and not a 16:9 ratio. Effectively, the only difference in network structure is that the first layer has an input size of (1280, 1280, and 3). This change is needed to allow us to properly apply convolutions without losing data in our imagery since it has an NxN crop (1280×1280 for setU). Additionally, we removed the “zoom” augmentation for our imagery to better train for the holistic image and not center a crop toward a reflective artifact.
The remaining hyperparameters for the zenith CDNN are passed in during training. The optimizer is adam, and the loss function is binary_crossentropy. A batch size of 200 images is used to fit within the amount of memory that is available on the node used to train the network. The learning rate is set to a constant 1e-5, which has been determined by testing with incremental values between [5e-6,1e-2].
After training our forward and zenith CDNN models, we then validate them with various methods to understand their performance. We split our validation methods into two categories: 1) validation using our human-labeled testing dataset, and 2) validation against the cloud mask product from the SPN-S instrument. First, we test the statistical accuracy of the CDNN models by generating binary predictions on testing datasets and generating related plots indicating the models’ accuracy. After selecting the best-performing CDNN models, we can then compare their predictions against an SPN-S cloud mask to further validate the usefulness of the CDNN. After these comparisons, we investigate and discuss the components that contribute to the inaccuracies between the CDNNs and the SPN-S and discuss what can be implemented to minimize these impacts. We, at last, discuss factors that can contribute to inaccuracies in the zenith and forward CDNNs.
To ensure that the CDNN cloud mask can predict the presence of clouds accurately, we validate this against human-labeled testing datasets. As part of this analysis, we generate a receiver operating characteristic (ROC) curve and a binary confusion matrix to better understand the performance of the CDNN models.
Figure 4 shows a line plot that shows the performance of a binary classification problem. Contained within the plot is an ROC curve that represents the success of the CDNNs against the testing datasets described in Section 2.2 and Section 2.3. The ROC curve demonstrates the rate at which a classification method, in this case, our CDNN models, performs better than a random binary classification, represented by the red dotted line (Hoo et al., 2017). In general, the closer the ROC point of inflection is to the top left of the graph, the better the model can distinguish between the label’s binary classes since it indicates that the model has a much larger true positive rate. Conversely, when the inflection point of the curve approaches the random classification line, it indicates that the model is no better than a random binary classification.
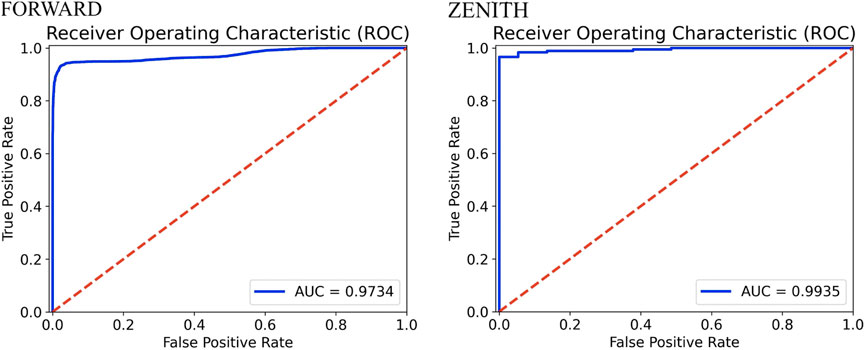
FIGURE 4. CDNN ROC curves. ROC curves for the forward CDNN and zenith CDNN models. The forward CDNN is tested against setK, and the zenith CDNN is tested against setV. The (blue) curve demonstrates the rate at which our CDNN classifies clouds better than a random binary classification. The (red) dotted line represents a baseline random binary classification for cloud detection, where the classification represents a random assignment as to whether a cloud is present or not. “Area under the curve” (AUC) represents the total accuracy of the CDNN in accounting for all true positive and negative classifications.
The ROC curve is a helpful tool to analyze the success of a particular classification method since the ROC curve can indicate how well a model is able to make a classification better than a random approach. Since both of our curves are very closely aligned in the top left of the graphs, we can conclude that our models are able to distinguish clouds much better than a random classifier.
We next investigate the CDNN models using a confusion matrix, which is another method, similar to ROC curves, for indicating how well a model can classify data using validation data (Sokolova and Lapalme, 2009; Johnston et al., 2017). Confusion matrices are particularly useful to help understand the ways in which a model tends to misclassify data, providing insight into when or why the model is providing inaccurate results. Understanding when and why the model classification is incorrect allows us to understand the flaws and biases of our neural network models. If there are clear-cut situations where the model performs poorly, additional training data can label these features, which should allow a future model to learn to ignore or classify them.
Figure 5 shows the performance of our forward CDNN and zenith CDNN models against their respective testing datasets using a binary confusion matrix. True positive (TP) and true negative (TN) both signify the model is correct in its cloud mask prediction: when the model indicates clouds are present or not present, it is correct in its classification compared to the human-labeled testing datasets. A false positive (FP) occurs when the model predicts that there is a cloud present but the human-labeled testing datasets mark it as not cloudy. For false negatives (FN), the model indicates that there are no clouds, but the human-labeled testing datasets mark it as cloudy.
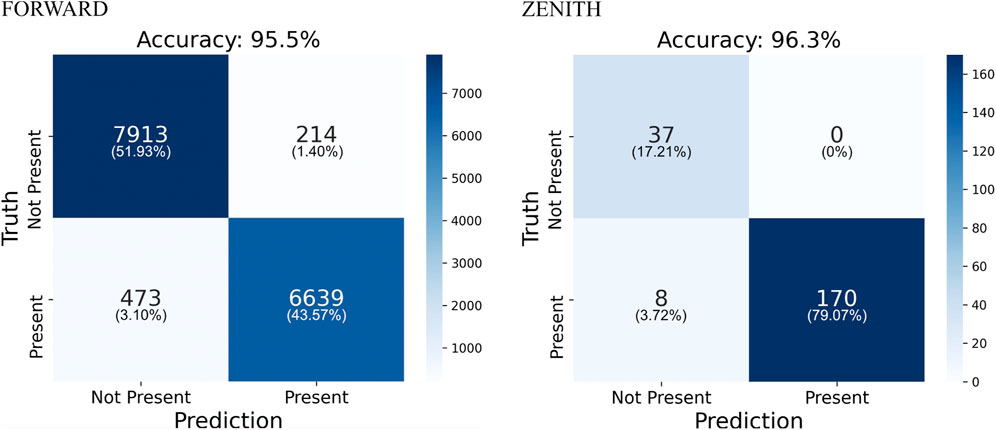
FIGURE 5. CDNN confusion matrices. Binary confusion matrices for the forward CDNN and zenith CDNN models. The forward CDNN is tested against setK, and the zenith CDNN is tested against setV. We use the term Truth as the label for our human-labeled testing dataset and Prediction as the label for the CDNN model’s prediction for cloud presence. The grid view demonstrates how CDNN models detect clouds both correctly and incorrectly against human-labeled data. Finally, we define accuracy as ((Cloud Not Present Match) + (Cloud Present Match)) / (Total Entries in Testing Dataset).
Both the forward and zenith CDNN models can detect above-aircraft clouds for each type of camera. By detecting clouds in the forward zenith imagery of the aircraft, we can investigate when and where clouds impact the solar irradiance that would be measured by the SPN-S instrument. The next step in the validation process is to measure the accuracy of the CDNNs against the SPN-S, an instrument that can also be used to detect above-aircraft clouds, to quantify how well the CDNNs are able to detect clouds, with the caveat that there are also uncertainties associated with the capabilities of the SPN-S to detect above-aircraft clouds, for example, when the clouds are optically thin.
For the CDNN and SPN-S comparisons, we first describe how we generate an SPN-S cloud mask that detects above-aircraft clouds by using a threshold on the cloud optical depth (COD) that is retrieved by the SPN-S instrument. After the generation of the SPN-S cloud mask, we validate the CDNN cloud masks using two different comparisons to the SPN-S cloud mask. We first make time-based comparisons between the forward and zenith CDNN cloud masks and the SPN-S cloud mask, allowing us to understand how often these values are in agreement at a high sampling resolution. After we investigate the frame-to-frame agreement between the two cloud masks, we can then assess the cloud masks of CDNN models and the SPN-S on a statistical basis by computing the total cloud coverage per flight date or flight-averaged cloud fraction for both the CDNNs and the SPN-S. We also report the flight-averaged cloud fraction for the ACTIVATE and CAMP2Ex flight campaigns in Section 4. In this assessment of flight-averaged cloud fraction, we can identify the research flight dates that can have the largest discrepancies and investigate the corresponding imagery for possible factors that cause issues in either the forward or zenith CDNNs.
We note that in order to compare the forward CDNN and zenith CDNN with the SPN-S data, we need to perform a crop to only view above-aircraft clouds in the corresponding CAMP2Ex footage. For the forward CDNN, we crop the forward footage as described in Section 2.2 for setK. For the zenith CDNN, we crop the zenith footage as described in Section 2.3 for setU and setV. We, at last, note that when comparing with the SPN-S, we use all camera images available in our analysis, even if the frame is labeled as Unknown. Thus, the human labels are not taken into account when comparing against SPN-S data. This choice was made to allow the CDNN to make predictions against all images for which we have SPN-S data and to ensure that we do not introduce a bias from our human labels in the comparisons. However, a cloud detection bias is possible within our validation analysis against the SPN-S for flight dates that are included in our training sets (setD and setU).
We validate the CDNN cloud mask against a cloud mask derived from the SPN-S-retrieved above-aircraft COD at 870 nm (Norgren et al., 2021). We use a constant COD threshold greater than .15 to indicate the presence of above-aircraft clouds; otherwise, the observation is assumed to be cloud-free. We select this threshold value by trial-and-error from the range (.01, .25) that best fits the zenith CDNN flight-averaged cloud fraction and the human-labeled testing dataset for the zenith-viewing all-sky camera. We found that compared to the SPN-S COD at 500 nm, the COD at 870 nm resulted in a better agreement for flight-averaged cloud fraction compared to the zenith CDNN.
We filter for SZA
The resulting SPN-S above-aircraft cloud mask is compared against the forward CDNN and zenith CDNN cloud masks to quantify CDNN accuracy on time-based retrievals and flight-averaged cloud fractions. The comparisons between the forward CDNN, zenith CDNN, and SPN-S cloud masks are tabulated in Table 3.
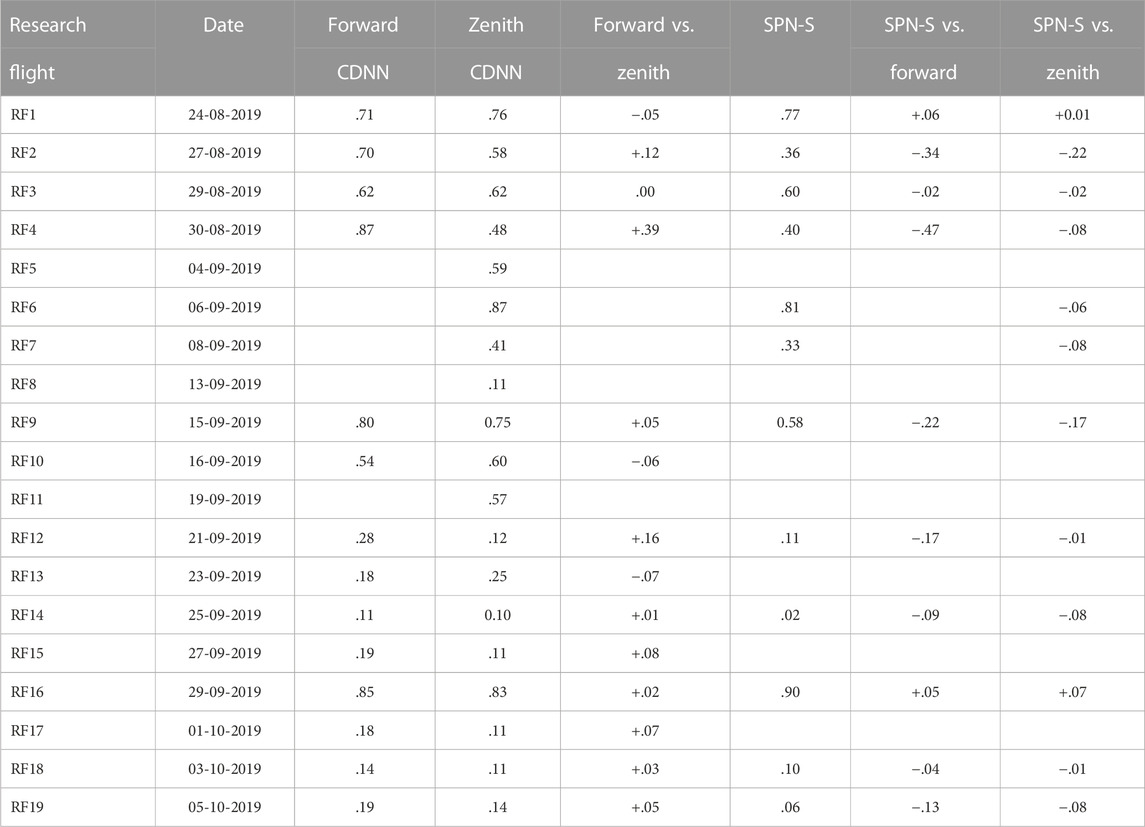
TABLE 3. CAMP2Ex 2019 flight-averaged cloud fractions. Flight-averaged cloud fractions for each CAMP2Ex flight. The CDNN flight-averaged cloud fraction values reflect how much of the flight imagery contained observable above-aircraft clouds from each camera and SPN-S. The SPN-S cloud mask is produced using the COD at 870 nm to create a Boolean filter where COD
Now that we have binary cloud masks for SPN-S COD data, we can make comparisons to the binary cloud masks from the forward CDNN and zenith CDNN. By comparing these CDNN cloud masks to the SPN-S, we can interpret how well the CDNN is able to detect clouds in comparison to a mounted instrument. We compare both CDNNs to the SPN-S cloud masks on a time-relevant scale to ensure cloud presence is indicated correctly. The comparison methods for the forward CDNN and zenith CDNN masks to the SPN-S cloud masks differ slightly due to their differences in the temporal availability of data.
Zenith CDNN cloud masks are compared to the SPN-S cloud masks by finding values of the zenith cloud mask that are within ±7 s of any SPN-S value. Since the zenith footage has many unpredictable time skips from data point to data point and the SPN-S sensor retrieves readings every 15 seconds on average, there were very few instances of exact matches of time values for retrievals in both. Due to the difference in available data, we extrapolate the SPN-S values by ± 7 s to ensure that we capture a window of possible retrievals for each SPN-S retrieval without overlapping SPN-S retrievals. We additionally check and ensure that only one comparison is made for any data value in either the zenith CDNN or SPN-S cloud masks to ensure that we do not have any bias in any data points. As shown in Figure 6, the zenith CDNN experienced 93% accuracy, indicating high accuracy in above-aircraft cloud detection for the zenith CDNN.
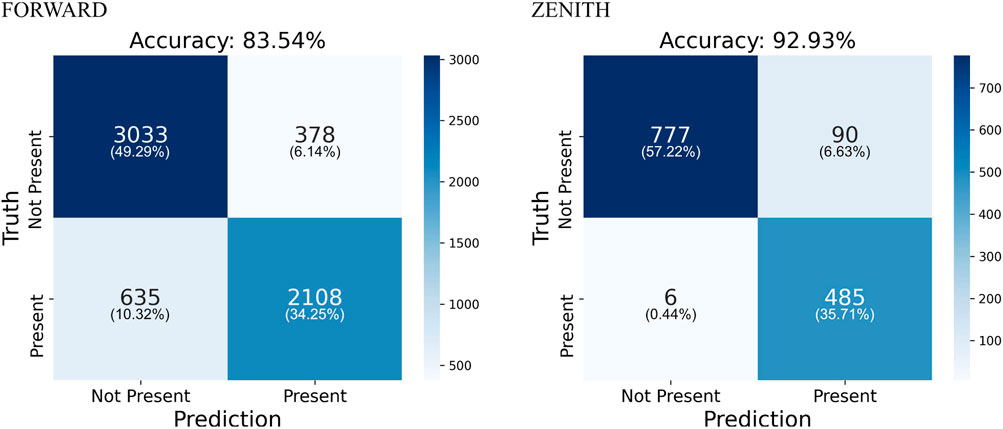
FIGURE 6. CDNN–SPN-S confusion matrices. Binary confusion matrices were created by comparing forward CDNN and zenith CDNN cloud masks with SPN-S cloud masks. The “Truth” binary values indicate the SPN-S cloud mask, whereas the “Predictions” indicate the CDNN cloud mask predictions. The figure shows the accuracy of the forward and zenith CDNNs against the SPN-S cloud masks that we generate, and where the error is based on false positive or negative results.
Forward CDNN cloud masks are compared to SPN-S in a far simpler manner by comparing every value of the SPN-S data to the correlated time values in the forward data. We are able to compare many more data values since the forward CDNN cloud masks contain data entries for every second within the available forward-viewing camera data. With many more data points, we are able to conduct more direct comparisons throughout the CAMP2Ex flight campaign. However, since the forward camera views above the aircraft imperfectly, there are many cases when there are no clouds in the forward camera, but there are clouds blocking the SPN-S directly above the aircraft, and vice versa, providing a larger margin of error due to this viewpoint discrepancy compared to the zenith camera. We note that, as we stated before in Section 2.2, the cloud masks that we create are generated on cropped camera data to increase focus on above-aircraft clouds but are not able to eliminate clouds in front of or on the horizon of the scene entirely. With the sources of error in mind, we are still able to achieve 84% accuracy when comparing the forward CDNN cloud masks with the SPN-S cloud masks, a lower but still relatively high accuracy in comparison to the zenith CDNN.
After we analyzed the accuracy of our time-relative comparisons for SPN-S and CDNN cloud masks, we next generated a summary of both retrievals over the span of the CAMP2Ex flight campaign. The summary calculation that we create is a flight-average cloud fraction that scales between [0.0, 1.0], where 1.0 indicates that there were above-aircraft clouds present in the entire flight and 0.0 indicates that there were no above-aircraft clouds present in the entirety of that flight. We generate flight-averaged cloud fractions to better understand the flight campaign’s cloud coverage and to identify dates to further analyze understanding errors based on camera imagery. Understanding the causes of errors in forward and zenith imagery will allow us to understand what can be improved for our CDNNs and the instruments that we use on the aircraft. The case study analysis of the imagery error between the SPN-S and CDNNs is captured in Section 3.2.4.
We calculate the forward, zenith, and SPN-S flight-averaged cloud fractions by taking the cloud masks for each and averaging all retrievals for the selected flight. We choose to use all data points, not just those that were correlated to each other within the extrapolated 15-second window or at exact time points relative to the SPN-S, as described in Section 3.2.2, to understand how well the SPN-S and CDNNs can interpret cloud coverage during a flight. This analysis gives us an indication for the CAMP2Ex and future missions on whether the zenith all-sky camera is able to capture enough data points to create a correct flight-averaged cloud fraction. We finally analyze if the forward-viewing camera exceeds the zenith all-sky camera in accuracy due to the better availability of data points.
The retrievals for SPN-S, forward, and zenith flight-average cloud fraction are shown in Table 3. In summary of this table, we calculate that the mean flight-averaged cloud fraction agreement on all available flights for the zenith CDNN and SPN-S is .07, indicating that the values on average are .07 off of each other. For the forward CDNN, we calculated that the mean flight-averaged cloud fraction agreement on available flights was .15. The means of average error indicate that the zenith CDNN, even though it has minimal data points, is still able to outperform the forward CDNN in cloud detection when compared to the SPN-S.
After calculating the accuracy for time-relevant cloud masking and flight-averaged cloud fraction for all CAMP2Ex 2019 data from the zenith CDNN, forward CDNN, and SPN-S cloud masks, we make a point-by-point comparison to understand why and when there were discrepancies between the two cloud masks on the following research flights: 15-09-2019, 16-09-2019, 29-09-2019, and 05-10-2019. We find that the discrepancies for the zenith CDNN primarily occur when optical aberrations in the zenith all-sky camera data are present, such as dust particles or water droplets on the camera lens, camera out-of-focus issues that blur the cloud texture, and automatic gain changes that lead to extreme brightness changes and cause the clouds to blend in with the sky. Such optical aberrations appear to cause the neural network to misclassify the data. Although the training dataset for the zenith CDNN did include imagery of such features, which is likely why the model does not fail in every instance, the issues caused by these optical aberrations can vary, and there was likely insufficient data to train the neural network to recognize clouds in all such cases.
We also experienced similar issues in the early forward CDNN models, but training on larger datasets appears to have helped negate such issues. We are unable to create a similar solution for the zenith CDNN since we currently have a limited amount of zenith data due to its lower frame rate. Increasing the frame rate and testing whether it is possible to pick a single gain and disable the auto-gain setting may help improve the cloud detection capabilities of the all-sky camera images using the zenith CDNN. The other issue we found that contributed to the zenith CDNN detecting clouds in the all-sky image when they were not present in the SPN-S is the zenith reflection artifact. The texture of this spectral reflection, depicted in Figure 3, is similar to the texture of clouds and, therefore, appears to signal a cloud is present in the internal feature layers of the neural network. For this particular artifact, we observed images of clouds and sky present in the location of the reflection artifact, and if the aircraft’s pitch, roll, and yaw were consistent from frame to frame, the reflection artifact did not move at all, indicating that it is in fact due to a reflection.
These visual aberrations in the all-sky imagery impact the performance of the CDNN, and due to the smaller amount of available data, we have not been able to completely train out these issues. Despite these issues, we find that the zenith CDNN still performs highly for above-aircraft cloud mask purposes in that it is capable of capturing flight-averaged cloud fractions to within an average error of .07 of the SPN-S cloud mask, as shown in Figure 7.
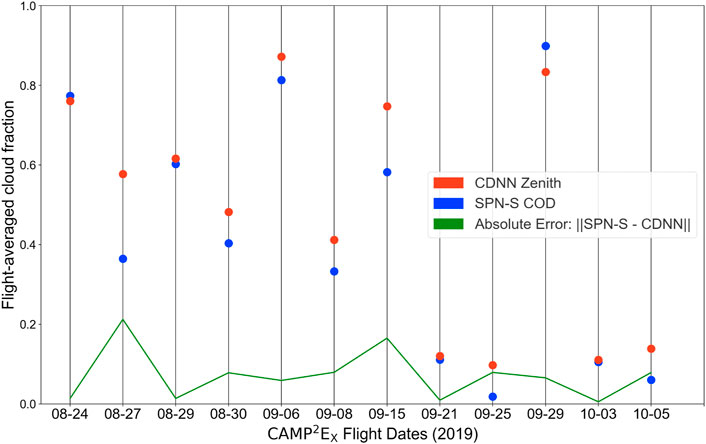
FIGURE 7. CAMP2Ex 2019 SPN-S vs CDNN flight-averaged cloud fraction. Zenith CDNN flight-averaged cloud fraction compared with SPN-S on a per CAMP2Ex research flight basis. Red dots indicate the zenith CDNN flight-averaged cloud fraction, whereas the blue dots represent the SPN-S flight-averaged cloud fraction. Flight-averaged cloud fractions are generated by averaging all zenith CDNN or SPN-S cloud mask values, described in Section 3.2.3. The green line presents the absolute error of the flight-averaged cloud fraction between the two different retrieval methods.
Similarly, if we look at possible issues with our forward CDNN when compared to SPN-S retrievals, the forward CDNN primarily has errors due to the viewpoint of the camera. As partially discussed in Section 3.2.2, the forward camera data overlook a large, widespread viewpoint, as shown in Figure 1, that requires cropping to ensure only above-aircraft clouds may be visible. If the crop was not created, there would be much larger inaccuracies in our forward CDNN; however, the cropping we use in the camera data is not perfect. When the aircraft experiences different pitches, rolls, and yaws, below-aircraft clouds may become visible within the crop. If we were to limit the crop to a smaller, more specific crop of above-aircraft clouds, we would risk and expose issues of not observing clouds that would become above-aircraft still, causing further errors. Related to the cropping conflict, the camera viewing angle causes discrepancy for forward-viewing camera data because the camera is angled primarily forward for CAMP2Ex, limiting the view of above-aircraft clouds. The ACTIVATE mission is able to view clouds from the forward-viewing camera better since the camera is slightly angled upward but does not contribute to our reported SPN-S compared accuracy since the ACTIVATE does not have an SPN-S mounted on the aircraft.
In summary, we find that both of the CDNNs can successfully detect the presence of above-aircraft clouds compared to the SPN-S cloud mask. In the future, the performance of the zenith CDNN can likely be further improved by training using additional all-sky camera data from future NASA flights. We make the following recommendations that may also improve the CDNN performance of above-aircraft cloud detection using all-sky camera data: 1) test capturing images at a higher frame rate of one frame per second rather than every 15 seconds; 2) test whether it is possible to find a single gain setting to eliminate auto-gain issues; 3) test whether it would be beneficial to regularly clean the camera lens after each flight; and 4) identify the source of the specular reflection artifact, whether it is from an instrument or the aircraft.
We also compare the forward and zenith CDNN predictions with each other. Comparing these two predictions allows us to both understand the flight-averaged cloud fraction within an entire flight from both viewing points on the aircraft and test how often above-aircraft clouds are observable with the forward-viewing camera mounted inside the cockpit rather than the all-sky camera, which is mounted externally on top of the aircraft. The forward-viewing camera can see the entire horizon (and below), while the zenith-view has a limited view of the horizon. Despite this difference, we still find that the cloud mask between the two cameras is well-correlated (Table 3). Most flight dates have very similar flight-averaged cloud fraction values, with one major discrepancy occurring on 30-08-2019.
To quantify how well the zenith CDNN and forward CDNN values correlate, we make a similar comparison as in Section 3.2.4, where we make point-by-point predictions from both models and investigate the causes of the error. From this exercise, we can confirm that the differences are primarily due to the fact that the forward camera can see more of the horizon and, therefore, can see clouds ahead out of the plane, even after the crop is applied, as shown in Figure 1. This issue can be exacerbated when the aircraft makes turns, which can result in the forward-view seeing clouds that will not eventually be above the aircraft and subsequently not be detected by the zenith all-sky camera. Additionally, we must also consider that we do not have data points for every second of the zenith-viewing all-sky camera and must thus assume that the flight-averaged cloud fraction goes unchanged between its sampling rate of 15 seconds. This assumption decreases the zenith-viewing accuracy when there are small or broken clouds above but close to the aircraft, for which there are no images but would be captured in the forward view. Last, if there are clouds behind the aircraft that nonetheless are above the aircraft and block or scatter light from the Sun, the forward-viewing camera will be unable to detect them, while the zenith-viewing all-sky camera can. These are some of the factors that cause the discrepancies in the data comparisons, yet the two CDNN models nevertheless have good agreement to within a mean absolute error of 0.09 on a point-by-point basis.
Cloud masking is vital due to the adverse effects that cloud contamination has against remote-sensing capabilities of aerosol properties and surface or ocean properties. Assessments of the cloud masks developed for moderate bandwidth spectroradiometers such as MODIS identify a need to further validate satellite cloud masks. Since the airborne cloud mask products created by the CDNN are useful for the passive airborne remote-sensing instruments, and because they have the potential to be used for the validation of satellite cloud masks, we applied the forward CDNN and zenith CDNN to all camera data available from the ACTIVATE and CAMP2Ex flight campaigns and created cloud mask products that can be used for validation or comparison purposes.
These above-aircraft CDNN cloud mask products can provide cloud detection ground-truth data for the assessment of ASTER and MODIS cloud masks (Tonooka and Tachikawa, 2019; Sun et al., 2011). Our current forward CDNN and zenith CDNN above-aircraft cloud masks can be compared to high-level cloud masks generated by MODIS and ASTER. In order to make full comparisons to the MODIS and ASTER total atmospheric column or low-level cloud masks, we also need to evaluate the performance of the CDNN below-aircraft cloud mask. Thus, future CDNN research would involve evaluation of the nadir-viewing CDNN capabilities in detecting below-aircraft clouds on a pixel-by-pixel basis with comparisons to ASTER and MODIS.
The archived cloud mask products contain the value “−9999” if there is no available camera image for a given timestamp. For example, if the camera was shut off or rebooted during a flight or if it is capturing images at less than one frame per second. To account for the zenith all-sky camera and SPN-S sensor, the zenith CDNN and SPN-S cloud mask are extrapolated over the difference in timestamps to allow for indirect comparisons when data points are not available in both datasets.
Table 3 and Figure 7 report and display the zenith CDNN flight-average cloud fraction of the research flights for CAMP2Ex. The CAMP2Ex flight campaign was able to observe different cloud and aerosol types, as we described in Section 1.
The goal of the CDNN cloud masks is to provide information on when above-aircraft clouds may be present that can scatter and absorb sunlight and that then impact the passive aircraft remote-sensing instruments. The SPN-S measures the downwelling irradiance and can also be used to derive COD (Norgren et al., 2021). As we describe in Section 3.2, we use the top-mounted SPN-S sensor onboard the aircraft for CAMP2Ex to validate the presence of above-aircraft clouds that could impact passive remote sensors on the aircraft.
By analyzing our CDNN flight-average cloud fraction, we can interpret the cloudiness of the CAMP2Ex flight campaign. For CAMP2Ex, using cloud masks from the zenith CDNN, seven out of 19 flight dates have above-aircraft cloud fractions that are about 10%–14%, while 10 flight dates have above-aircraft cloud fractions over 50%. If we compare this to the forward CDNN cloud masks, six out of 15 flight dates have above-aircraft cloud fractions of 11%–19%, and eight of the 15 flight dates have above-aircraft cloud fractions over 50%. Last, for the SPN-S COD cloud masks that we used in Section 3.2.3, four out of the 12 available flight dates have an above-aircraft cloud fraction that is below 12%, and five out of the 12 flight dates have an above-aircraft cloud fraction that is above 50%.
Figure 8 shows the CDNN results from the entirety of the ACTIVATE mission. We used the forward CDNN to create cloud mask predictions for the forward-viewing camera with crop to specifically view above-aircraft clouds. From these data, we computed the CDNN flight-averaged cloud fraction for each remote-sensing research flight from the first two years of ACTIVATE. As stated before, the camera angle for the forward-viewing camera was slightly different between 2020 and 2021 due to different cameras being installed, thus resulting in slight differences in the FOV of above-aircraft clouds. Although this change may have some effect on the CDNN’s cloud detection capabilities for clouds that are directly above the aircraft, we expect little impact due to this change since the view changes are rather similar to each other. Changes in the camera position can affect the cloud prediction results for above-aircraft clouds, depending on how the tilt impacts the up-looking field of view, but can often be accounted for by cropping the topmost part of the image.
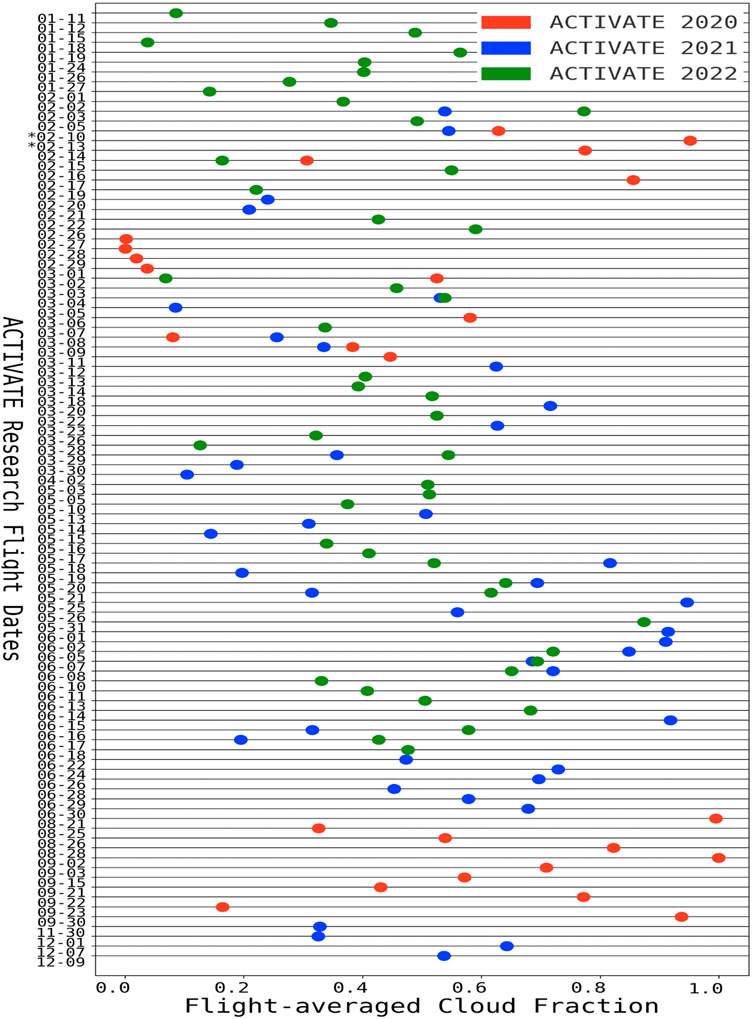
FIGURE 8. ACTIVATE CDNN flight-averaged cloud fraction. In the aforementioned figure, we show the flight-averaged cloud fraction results for 2020, 2021, and 2022 ACTIVATE flight campaigns. Data points are generated by using the forward CDNN to generate cloud masks for each available research flight date’s camera data. Section 2.2 shows how images from ACTIVATE camera data are cropped to the top section of the forward-viewing camera to focus on above-aircraft clouds only. Data-points for each date are generated by calculating the (# of Cloudy Images) / (Total # of images). We should note that some dates contain data from two research flights if there were two flights in a single day. Additionally, dates denoted with a * are test flight dates from 2020 that occurred before the 2-14-2020 launch of ACTIVATE research flights.
In ACTIVATE 2020, using the forward CDNN to generate cloud masks, we observed that six out of 25 flight dates had an above-aircraft cloud fraction below 20%, and 13 out of 25 flight dates had above-aircraft cloud fractions above 50%. For ACTIVATE 2021, using the same forward CDNN to create cloud masks, there were three out of 37 flight dates had above-aircraft cloud fraction of 20% or below, and 20 out of 37 flight dates had an above-aircraft cloud fraction above 50%. Last, for ACTIVATE 2022, there were six out of 47 flight dates had an above-aircraft cloud fraction of 20% or below, and 20 out of 47 flight dates had an above-aircraft cloud fraction above 50%.
Cloud masks, such as those generated by the CDNN, can potentially help validate satellite-based cloud masks, including for high-level and low-level clouds. To attempt to validate or create comparisons for our CDNN cloud masks with satellite data, a viewing angle correction may be needed to ensure that comparisons are one-to-one. Viewing angle correction of the camera instruments can correct issues in corresponding cloud masks to geographic coordinates, since forward or zenith-viewing clouds could be positioned offset of the plane. Cloud masks can additionally be used to study the impact of above-aircraft cloud contamination on aerosols and surface or ocean properties. Such related studies can further compare CDNN cloud masks and passive remote sensing instruments, similar to the comparisons we perform in Section 3.2.
Airborne passive remote sensing can be significantly impacted by the presence of above-aircraft clouds since they will attenuate and scatter the Sun’s light and thus contaminate retrievals of aerosol and surface or ocean properties. The CDNN algorithm allows NASA aircraft equipped with forward- and/or zenith-viewing cameras to detect the presence of these above-aircraft clouds. Detecting these above-aircraft clouds allows passive remote-sensing retrieval algorithms to choose whether to filter out cases containing above-aircraft clouds, develop corrections for the presence of above-aircraft clouds, or help ensure that clouds do not have an impact on the retrieval products of interest. This above-aircraft detection capability is thus vital for any aircraft carrying passive remote sensors that may be impacted by above-aircraft clouds. We report that the forward-viewing and zenith-viewing CDNNs have accuracies of approximately 96% compared to the human-labeled validation data from the ACTIVATE and CAMP2Ex flight campaigns. The CDNN models can be readily implemented to produce above-aircraft cloud mask products from all NASA airborne cameras and are fast enough to also be applied in near real-time.
There are limitations to the current cloud detection capabilities of the CDNN. If future missions apply the CDNN to additional or future airborne campaigns, there may be a need to extend the training of our models for the new imagery. This extended training may be necessary to accommodate different camera models or viewing geometries from the aircraft. Such changes may lead to decreased performance in cloud detection, which we do not account for within our study, but which can readily be explored later on upon such application. We do note that in the early stages of our research, we trained models using only ACTIVATE data and attempted to apply those models to CAMP2Ex but found that the CDNN struggled with cloud detection. While this indicates there can be limitations in the current CDNN for applications to new airborne camera datasets, we would expect that as additional camera data from more airborne campaigns are included in the CDNN training set, these performance limitations would be reduced.
In assessing the ACTIVATE and CAMP2Ex flight campaigns with our CDNN retrievals, we observed that ACTIVATE 2020 had 52%, ACTIVATE 2021 had 54%, ACTIVATE 2022 had 42.6%, and CAMP2Ex had 53% of flight dates with an observed above-aircraft cloud fraction of 50% or more. The large cloud fractions during the flight campaigns indicate the prolonged presence of clouds during these flights, which could cause potential impacts on passive remote sensing. Overall, the takeaway is that a significant fraction of each flight contains scenes with above-aircraft clouds that can contaminate passive remote sensing retrievals of aerosol and surface/ocean properties. With an understanding of the impact of passive remote sensing due to above-aircraft clouds, the CDNN approach to cloud masking provides a low-cost computational approach to the detection of above-aircraft clouds.
For future airborne field campaigns with passive remote-sensing instruments, we recommend at minimum a zenith-viewing all-sky camera to detect the presence of above-aircraft clouds, but preferably also an upward-looking sensor such as an SPN-S. However, a forward-viewing camera is still helpful for above-aircraft cloud detection compared to no camera but based on the small amount of zenith-viewing data that we have, we find that the all-sky camera provides a larger increase in capability. This recommendation for a zenith all-sky camera is supported by our comparisons of CDNN and SPN-S time-specific cloud mask comparisons and mean flight-averaged cloud detection. The forward and zenith CDNNs were able to achieve accuracies of 84% and 93% when compared to the SPN-S cloud mask at time-specific intervals. We observed from the flight-averaged cloud fraction that the zenith CDNN had a mean error of .07 when compared to the SPN-S flight-average cloud fraction, while the corresponding averaged error of the forward CDNN was .15. We further discovered that the averaged error between the forward CDNN and zenith CDNN flight-averaged cloud detection was .09, in which 73.3% of the flight-averages were over-estimated for the forward CDNN in comparison to the zenith CDNN.
It would be informative to investigate further improvements in the all-sky zenith-viewing data, such as increasing the frame rate, increasing the image resolution, minimizing reflective artifacts from the aircraft body and/or other instruments, and setting the camera to use a constant gain. Such investigations may allow for improved CDNN cloud mask products, but until such capability is proven, it would be ideal to fly the all-sky camera with additional upward-looking sensors such as the SPN-S. Last, it would be possible to investigate the possibility of using a forward-view camera in the cockpit, that is, mounted such that it is angled upward to target above-aircraft clouds. This change may allow for above-aircraft cloud detection without modifying the aircraft to mount an upward-looking all-sky camera or SPN-S sensor. Tilting upward may allow forward-viewing cameras to have a better view of the nearby above-aircraft clouds and a lower rate of false detections of clouds that are too far away from the plane to impact its local radiation field. The CDNN framework allows for easy re-training of new camera data, and an upward-tilted forward CDNN above-aircraft cloud mask can then be validated against zenith CDNN and SPN-S cloud masks.
The datasets analyzed for this study can be found in the CAMP2Ex and ACTIVATE data archival repositories:
CAMP2Ex Zenith All-Sky Imagery
ACTIVATE 2020 Forward/Nadir Imagery
ACTIVATE 2021 Forward/Nadir Imagery
ACTIVATE 2022 Forward/Nadir Imagery
The datasets generated for this study can be found in the ACTIVATE data archival repositories:
ACTIVATE 2020 CDNN cloud masks
ACTIVATE 2021 CDNN cloud masks
ACTIVATE 2022 CDNN cloud masks
CDNN development: JN, MJ, and SS. Text: All authors.
This study was funded by the NASA Langley Research Center, the NASA Office of STEM outreach, and the NASA ACTIVATE mission, a NASA Earth Venture Suborbital-3 (EVS-3) investigation funded by NASA’s Earth Science Division and managed through the Earth System Science Pathfinder Program Office.
The authors would also like to thank the pilots, crew, and support staff for the NASA CAMP2Ex and ACTIVATE missions.
Author MJ was employed by the company Science Systems and Applications, Inc.
The remaining authors declare that the research was conducted in the absence of any commercial or financial relationships that could be construed as a potential conflict of interest.
All claims expressed in this article are solely those of the authors and do not necessarily represent those of their affiliated organizations, or those of the publisher, the editors, and the reviewers. Any product that may be evaluated in this article, or claim that may be made by its manufacturer, is not guaranteed or endorsed by the publisher.
Abadi, M., Agarwal, A., Barham, P., Brevdo, E., Chen, Z., Citro, C., et al. (2016). Tensorflow: Large-scale machine learning on heterogeneous distributed systems. ARXIV. doi:10.48550/ARXIV.1603.04467
An, Z., and Shi, Z. (2015). Scene learning for cloud detection on remote-sensing images. IEEE J. Sel. Top. Appl. Earth Observations Remote Sens. 8, 4206–4222. doi:10.1109/JSTARS.2015.2438015
Chen, N., Li, W., Gatebe, C., Tanikawa, T., Hori, M., Shimada, R., et al. (2018). New neural network cloud mask algorithm based on radiative transfer simulations. Remote Sens. Environ. 219, 62–71. doi:10.1016/j.rse.2018.09.029
Frey, R. A., Ackerman, S. A., Liu, Y., Strabala, K. I., Zhang, H., Key, J. R., et al. (2008). Cloud detection with modis. part i: Improvements in the modis cloud mask for collection 5. J. Atmos. Ocean. Technol. 25, 1057–1072. doi:10.1175/2008JTECHA1052.1
Hong, Y., and Di Girolamo, L. (2022). An overview of aerosol properties in clear and cloudy sky based on calipso observations. Earth Space Sci. 9, e2022EA002287. doi:10.1029/2022ea002287
Hoo, Z. H., Candlish, J., and Teare, D. (2017). What is an roc curve? Emerg. Med. J. 34, 357–359. doi:10.1136/emermed-2017-206735
Johnston, T., Young, S., Hughes, D., Patton, R., and White, D. (2017). “Optimizing convolutional neural networks for cloud detection,” in Proceedings of the Machine Learning on HPC Environments, 1–9. doi:10.1145/3146347.3146352
Norgren, M. S., Wood, J., Schmidt, K. S., van Diedenhoven, B., Stamnes, S. A., Ziemba, L. D., et al. (2021). Above-aircraft cirrus cloud and aerosol optical depth from hyperspectral irradiances measured by a total-diffuse radiometer. Atmos. Meas. Tech. Discuss., 1–36.
Olivier, R., and Hanqiang, C. (2012). Nearest neighbor value interpolation. Int. J. Adv. Comput. Sci. Appl. 3. doi:10.14569/ijacsa.2012.030405
O’Shea, K., and Nash, R. (2015). An introduction to convolutional neural networks ARXIV. doi:10.48550/ARXIV.1511.08458
Pi, Y., Nath, N. D., and Behzadan, A. H. (2020). Convolutional neural networks for object detection in aerial imagery for disaster response and recovery. Adv. Eng. Inf. 43, 101009. doi:10.1016/j.aei.2019.101009
Sharma, N., Jain, V., and Mishra, A. (2018). An analysis of convolutional neural networks for image classification. Procedia Comput. Sci. Int. Conf. Comput. Intell. Data Sci. 132, 377–384. doi:10.1016/j.procs.2018.05.198
Sokolova, M., and Lapalme, G. (2009). A systematic analysis of performance measures for classification tasks. Inf. Process. Manag. 45, 427–437. doi:10.1016/j.ipm.2009.03.002
Sorooshian, A., Anderson, B., Bauer, S. E., Braun, R. A., Cairns, B., Crosbie, E., et al. (2019). Aerosol–cloud–meteorology interaction airborne field investigations: Using lessons learned from the u.s. west coast in the design of activate off the u.s. East Coast. Bull. Am. Meteorological Soc. 100, 1511–1528. doi:10.1175/BAMS-D-18-0100.1
Srivastava, N., Hinton, G., Krizhevsky, A., Sutskever, I., and Salakhutdinov, R. (2014). Dropout: A simple way to prevent neural networks from overfitting. J. Mach. Learn. Res. 15, 1929–1958.
Stamnes, S., Hostetler, C., Ferrare, R., Burton, S., Liu, X., Hair, J., et al. (2018). Simultaneous polarimeter retrievals of microphysical aerosol and ocean color parameters from the “MAPP” algorithm with comparison to high-spectral-resolution lidar aerosol and ocean products. Appl. Opt. 57, 2394–2413. doi:10.1364/ao.57.002394
Stillinger, T., Roberts, D. A., Collar, N. M., and Dozier, J. (2019). Cloud masking for landsat 8 and modis terra over snow-covered terrain: Error analysis and spectral similarity between snow and cloud. Water Resour. Res. 55, 6169–6184. doi:10.1029/2019WR024932
Sun, W., Videen, G., Kato, S., Lin, B., Lukashin, C., and Hu, Y. (2011). A study of subvisual clouds and their radiation effect with a synergy of ceres, modis, calipso, and airs data. J. Geophys. Res. Atmos. 116. doi:10.1029/2011JD016422
Tonooka, H., and Tachikawa, T. (2019). Aster cloud coverage assessment and mission operations analysis using terra/modis cloud mask products. Remote Sens. 11, 2798. doi:10.3390/rs11232798
Keywords: neural network, cloud mask, cirrus, camera, polarimeter, aerosol
Citation: Nied J, Jones M, Seaman S, Shingler T, Hair J, Cairns B, Gilst DV, Bucholtz A, Schmidt S, Chellappan S, Zuidema P, Van Diedenhoven B, Sorooshian A and Stamnes S (2023) A cloud detection neural network for above-aircraft clouds using airborne cameras. Front. Remote Sens. 4:1118745. doi: 10.3389/frsen.2023.1118745
Received: 07 December 2022; Accepted: 31 January 2023;
Published: 22 February 2023.
Edited by:
Cláudia Maria Almeida, National Institute of Space Research (INPE), BrazilReviewed by:
Xiaoyan Li, University of Chinese Academy of Science, ChinaCopyright © 2023 Nied, Jones, Seaman, Shingler, Hair, Cairns, Gilst, Bucholtz, Schmidt, Chellappan, Zuidema, Van Diedenhoven, Sorooshian and Stamnes. This is an open-access article distributed under the terms of the Creative Commons Attribution License (CC BY). The use, distribution or reproduction in other forums is permitted, provided the original author(s) and the copyright owner(s) are credited and that the original publication in this journal is cited, in accordance with accepted academic practice. No use, distribution or reproduction is permitted which does not comply with these terms.
*Correspondence: Michael Jones, bWljaGFlbC5qb25lcy00QG5hc2EuZ292; Snorre Stamnes, c25vcnJlLmEuc3RhbW5lc0BuYXNhLmdvdg==
Disclaimer: All claims expressed in this article are solely those of the authors and do not necessarily represent those of their affiliated organizations, or those of the publisher, the editors and the reviewers. Any product that may be evaluated in this article or claim that may be made by its manufacturer is not guaranteed or endorsed by the publisher.
Research integrity at Frontiers
Learn more about the work of our research integrity team to safeguard the quality of each article we publish.