 Lianbo Hu
 Xiaodong Zhang
 Yuanheng Xiong
95% of researchers rate our articles as excellent or good
Learn more about the work of our research integrity team to safeguard the quality of each article we publish.
Find out more
ORIGINAL RESEARCH article
Front. Remote Sens. , 25 July 2022
Sec. Atmospheric Remote Sensing
Volume 3 - 2022 | https://doi.org/10.3389/frsen.2022.925654
This article is part of the Research Topic Polarization of Light as a Tool for Characterizing Different Facets of the Atmosphere-Ocean System View all 9 articles
The scattering by suspended particles is being measured with increasing frequency in the global oceans. Yet, little is known of size fractioned contribution, particularly from submicron particles and to the polarized scattering. In this study, three Mueller scattering matrix elements, P11, P12, and P22, for the bulk particles and for size fractions <0.2
After penetrating seawater, natural light from the Sun interacts with water molecules, sea salt ions, and particles primarily through the absorption and elastic scattering processes. The scattering properties of water molecules and the associated sea salt ions are relatively well understood (Morel, 1974; Shifrin, 1994) and can now be predicted as a function of wavelength, temperature, salinity, and pressure with an uncertainty of <2% (Zhang et al., 2009; Zhang and Hu, 2018; Hu et al., 2019a; Hu et al., 2020a; Zhang and Hu, 2021). However, our knowledge is limited on scattering by particles in natural waters because they are very complex in composition, shape, and internal structure and exhibit significant variability in concentration and size distribution (Stramski et al., 2001; Stramski et al., 2004; Jonaz and Fournier, 2007; Organelli et al., 2018). For example, the size of particles that are optically significant spans five to six orders of magnitude ranging from small colloids of tens nanometer to large suspended particles of several millimeters (Stramski et al., 2004). Particles in the oceans also have complex shapes and structures, ranging from nearly spherical-layered chlorella (Quinby-Hunt et al., 1989) to disk-like coccoliths (Gordon and Du, 2001; Gordon, 2007; Zhai et al., 2013). The complete description of scattering by particles can be represented by a 16-element Mueller matrix that transforms the Stokes vectors of the incident light to the scattered light (Bohren and Huffman, 1983). If particles are randomly oriented, the Mueller scattering matrix can be simplified to six independent elements (Jonaz and Fournier, 2007).
The validity of Eq. 1 has been confirmed for natural seawater (Voss and Fry, 1984) and various phytoplankton cultures (Fry and Voss, 1985; Quinby-Hunt et al., 1989; Svensen et al., 2011). Among the Mueller matrix elements, P11, also called the volume scattering function (VSF), describes the angular distribution of the intensity of scattered light (Mobley, 1994). P12 measures the linear polarization parallel and perpendicular to the scattering plane while P22 indicates the deviation of particle from the sphericity (i.e., P22 = P11 for spherical particle) (Quinby-Hunt et al., 1989). The Mueller matrix elements are often normalized by P11, that is,
Because of complexity in instrument design, only a few studies have measured complete Mueller matrix elements for natural seawater or phytoplankton species (Voss and Fry, 1984; Fry and Voss, 1985; Quinby-Hunt et al., 1989; Svensen et al., 2011; Chami et al., 2014). Relatively, P11 has been measured extensively in oceanic, coastal, and inland waters (Tyler and Richardson, 1958; Petzold, 1972; Meyer, 1979; Lee and Lewis, 2003; Agrawal and Mikkelsen, 2009; Sullivan and Twardowski, 2009; Babin et al., 2012; Twardowski et al., 2012; Zhang et al., 2012; Tan et al., 2013; Chami et al., 2014). Some of the instruments used in these studies also measured the linear polarization components (Sullivan and Twardowski, 2009; Babin et al., 2012; Chami et al., 2014). Recently, a commercial instrument LISST-VSF (Laser In Situ Scattering and Transmissometer - Volume Scattering Function) developed by Sequoia Scientific Inc. has been used to measure P11 from 0.1° to 155° as well as P12 and P22 from 15° to 155° in the aquatic environment (Koestner et al., 2018; Hu et al., 2019b; Koestner et al., 2020; Sandven et al., 2020). The Mueller matrix elements are determined by the particle size distribution (PSD), refractive index, shape, and internal structure of the particles. Through inversion, the measurements of Mueller matrix have also been used to characterize particles (Gordon and Brown, 1972; Brown and Gordon, 1973; Zaneveld et al., 1974; Kopilevich, 1983; Agrawal et al., 2008; Agrawal and Mikkelsen, 2009; Zhang et al., 2011; Twardowski et al., 2012; Zhang et al., 2012; Hu et al., 2020b; Zhai and Twardowski, 2021). For example, commercial instruments (e.g., LISST-100X) have been developed to infer concentration of particles of sizes from 1 to 200 μm from P11 measured at angles from 0 to 15° (Agrawal and Pottsmith, 2000; Agrawal et al., 2008).
The size of particles is one of the most important factors that affect light scattering (Zhang et al., 2011), and understanding how particles of various sizes contribute to the scattering is essential to interpreting ocean color observation (Stramski and Kiefer, 1991; Jonaz and Fournier, 2007). Theoretical simulation representing oceanic particles as homogenous spheres that follow a power-law size distribution showed that particles <10
A few in situ size-fractionation experiments were conducted to directly measure the scattering contribution by particles in different size ranges. Dall’olmo et al. (2009) measured P11 at 117° with an ECO-BB3 sensor (Sea-Bird Scientific) in tropical Pacific Ocean and concluded that particles
In addition to total light intensity, knowledge of how sizes of particle affecting the linear components of the scattered light is also important, particularly in view of the next generation PACE satellite mission which will have two radiometers measuring linearly polarized light emitting from the oceans (Werdell et al., 2019). However, few studies have investigated the polarization by particles of various sizes. Koestner et al. (2020) measured the degree of linear polarization (DoLP) of seawater samples in three size fractions (e.g., <5
We participated in two NASA-led EXPORTS cruises (Siegel et al., 2016), from August 14 to September 10, 2018 onboard the R/V Sally Ride in the North Pacific Ocean (NPO-18) and from May 1 to June 1, 2021 onboard the RRS Discovery in the North Atlantic Ocean (NAO-21). The area of experiment for the NPO-18 was located within 144°–145.8°W and 49.6°–51.2°N (white rectangle in Figure 1A) and NAO-21 within 14°–16°W and 48.2°–52°N (white rectangle in Figure 1B). Monthly mean chlorophyll data derived from MODIS-Aqua indicated that the NPO-18 site had relatively uniform, low productivity, with a mean concentration of 0.22 ± 0.002 mg m−3, whereas the NAO-21 site had relatively productive and mixed waters, with a mean chlorophyll concentration 0.52 ± 0.05 mg m−3.
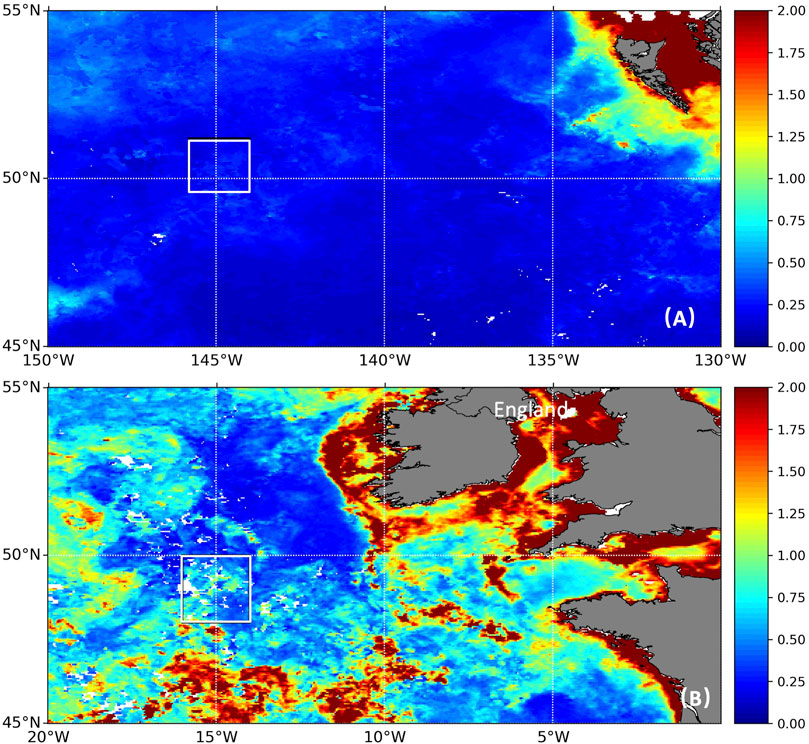
FIGURE 1. Boundary (white rectangles) of the (A) NPO-18 and (B) NAO-21 sites overlaid on monthly mean chlorophyll concentration maps (mg m−3) derived from the MODIS-Aqua data.
During each cruise, we conducted size fractionation experiment and measured the light scattering for each size fraction. Seawater samples at various depths (down to 3,000 m) were collected by Niskin bottles attached to a conductivity–temperature–depth rosette and transferred to the 10 L carboys, which were stored in the 4°C refrigerator on the ship. All samples were processed as soon as possible within five hours of collection. A peristaltic pump was used to transfer the seawater sample from the carboys to the LISST-VSF measuring chamber. For fractionation, we attached to the pump an AcroPak® 1000 capsule membrane 0.2 μm filter in both cruises, a Whatman® GF/F 0.7 μm filter during NPO-18 and a Millipore Sigma® polycarbonate 0.8 μm filter during NAO-21. The flow rates were set at about 5–10 and 2–5 ml s−1 for 0.2 and 0.7/0.8 μm filtrations, respectively. The size specification (0.2, 0.7, or 0.8 μm) is the nominal pore size of the filter and roughly represents the median retention size of particles. In this study, we will refer the scattering measurements of filtrate as <0.2
Light scattering of the samples was measured using an LISST-VSF (SN = 1662) instrument operating in bench mode. For each sample, thirty repeated measurements were taken and the median value at each scattering angle was used in further analysis. The LISST-VSF comprises two optical units. A laser diffraction unit (LISST) measures P11 from 0.08° to 14.4° at 32 angles with photodiode detectors and a “roving eyeball” unit measures P11, P12, and P22 from 15° to 155° with 1° increments using two PMT detectors. The light source of the LISST-VSF is a TE-cooled diode laser operating at a centroid wavelength of 517 nm. The laser polarization is alternated between vertical and horizontal states by insertion or removal of a half-wave plate. A polarizing beam splitter was placed in front of two PMT detectors to separate the scattered light into vertical and horizontal components (Slade et al., 2013). In this configuration, four different combinations of linear polarization between the incident and the scattered light are measured by two PMT detectors at scattering angles between 15° and 155° and used to compute the three Mueller matrix components, P11, P12, and P22 (Sequoia Scientific Inc, 2016; Hu et al., 2019b). The following three equations describe how the measurements are converted to P11, P12, and P22 at different scattering angles
where I denotes the intensity of scattered light and its subscripts v and h indicate vertical and horizontal polarization with the first indicating the polarization state of the laser beam and the second indicating the polarization state of the scattered light,
P11,sw was estimated by the theoretical model developed by Zhang et al. (2009) with concurrently measured temperature and salinity while P12,sw and P22,sw were calculated from P11,sw by assuming a seawater depolarization ratio of 0.039 (Zhang et al., 2019). By definition, the degree of linear polarization is calculated as (Koestner et al., 2018; Zhai and Twardowski, 2021)
For simplicity, we will drop the subscript p from P11, P12, and P22 hereafter understanding that they now represent the scattering by particles with contribution by seawater being removed.
The particulate P11 by bulk and submicron particles at scattering angles from 15° to 145° measured for all the water samples was averaged for the NPO-18 (Figure 2A) and NAO-21 (Figure 2B). Measurements at angle >145° were discarded due to the contamination of reflection by the exit window of the LISST-VSF (Hu et al., 2019b). The overall magnitude of particulate scattering decreases as more large particles were removed through filtration with decreasing pore sizes. While this is expected, it also attests to and proves that the instrument we used has the required sensitivity to resolve the scattering by submicron particles. At each size fraction, the overall angular variations of scattering measured in NPO-18 and NAO-21 are consistent with each other. Relatively, particulate scattering dominated the total scattering at forward angles (e.g., <50°) while scattering by pure seawater dominated at angles >120°. At angles >90°, the scattering by submicron particles in both sites was less than that by seawater. P11 for both bulk and submicron particles exhibited greater variability during NAO-21 than NPO-18 (comparing the sizes of the shaded areas between Figures 2A,B), consistent with the MODIS-Aqua derived chlorophyll data (Figure 1) which appeared more homogenous at the NPO-18 site than that in the NAO-21 site. A sharp increase in P11 for particles <0.2 μm at forward angles <20° was observed in the NPO-18 but not in the NAO-21. The increase was caused by the instrument drift because it was also found in the measurements of purified deionized water during NPO-18 and disappeared if we subtracted the pure water measurements from the bulk measurements instead of subtracting the scattering calculated from the theoretical model. The LISST-VSF was serviced by the company after the NPO-18 experiment and no obvious increase was observed in the following NAO-21 experiment in either <0.2 µm or pure water measurements. The instrument drift at angle 15° is about 1 × 10⁻³ sr−1 m−1, approximately 2% of bulk P11 at the same angle (Figure 2A). Therefore, the drift did not affect the rest of the data analysis.
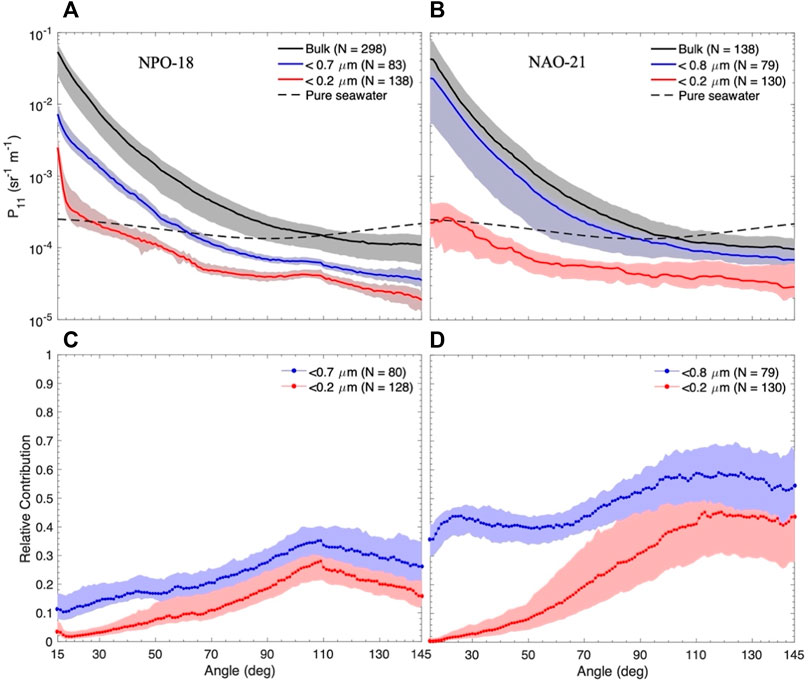
FIGURE 2. The median values of particulate P11 measured by the LISST-VSF for unfiltered sample (Bulk), 0.7-μm filtrate (<0.7 μm), and 0.2-μm filtrate (<0.2 μm) in the (A) NPO-18 and (B) NAO-21 sites and the relative contribution by submicron particles in the (C) NPO-18 and (D) NAO-21 sites. The shaded area represents the 25th and 75th percentile of the data. Theoretical pure seawater scattering (black dash line) was calculated using the Zhang et al. (2009) model.
The depth variations in P11 at 120° in two sites are shown in Figure 3A. A nearly universal relationship exists between P11 (120°) and the particulate backscattering coefficient (bbp, m−1) based on the global measurements (Sullivan and Twardowski, 2009; Zhang et al., 2021) and theoretical studies (Boss and Pegau, 2001; Zhang et al., 2017). Therefore, P11 (120°) can be used as a proxy of bbp. For particles <0.2 µm, the median values of P11 (120°) were relatively constant at depths <500 m in both sites, indicating particles <0.2 µm forming a constant background backscattering in these two waters (Zhang et al., 2020). The bulk P11 (120°) had a scattering-cline feature in both sites, exhibiting a constant layer at depths <80–100 m, a rapid decline from 100–200 m, and a deeper layer >200 m with limited variation. The profiles of P11 (120°) for particles <0.7/0.8 µm seemed to bridge between <0.2 µm and bulk particles, neither constant nor cline-like; instead, they decreased slowly with depths. Because the variability of P11 (120°) was greater during NAO-21 than NPO-18, the depth features of P11 (120°) just described, which were based on the median values, might not appear as salient or recognizable in NAO-21 if individual profiles were examined. Nevertheless, the mean features of size-fractioned P11 (120°) are very similar between the two sites.
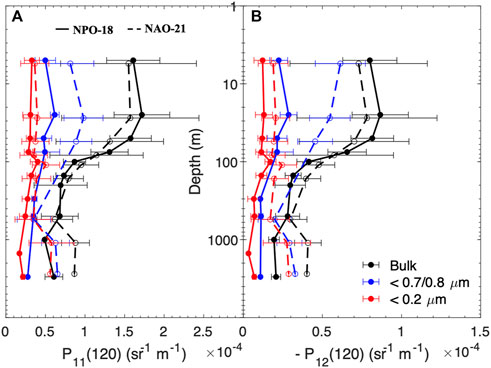
FIGURE 3. (A) Depth variations of P11 (A) and −P12 (B) at 120° (median ± one standard deviation) for unfiltered (Bulk), 0.7/0.8-μm filtered (<0.7/0.8 μm), and 0.2-μm filtered (<0.2 μm) samples in the NPO-18 (solid circle + solid line) and NAO-21 (open circle + dash line) sites. For better visualization, the depth of NAO-21 data was shifted downward by 10% of the original depth.
The median and standard deviation of −P12 by bulk and submicron particles measured for all the samples for NPO-18 and NAO-21 are shown in Figures 4A,B. Similar to P11 shown in Figures 2A,B, the overall magnitude of −P12 decreases as more large particles were removed through filtration with decreasing filter pore sizes. The angular variations of −P12 differed significantly between <0.2 µm and the other size fractions. For particles <0.2
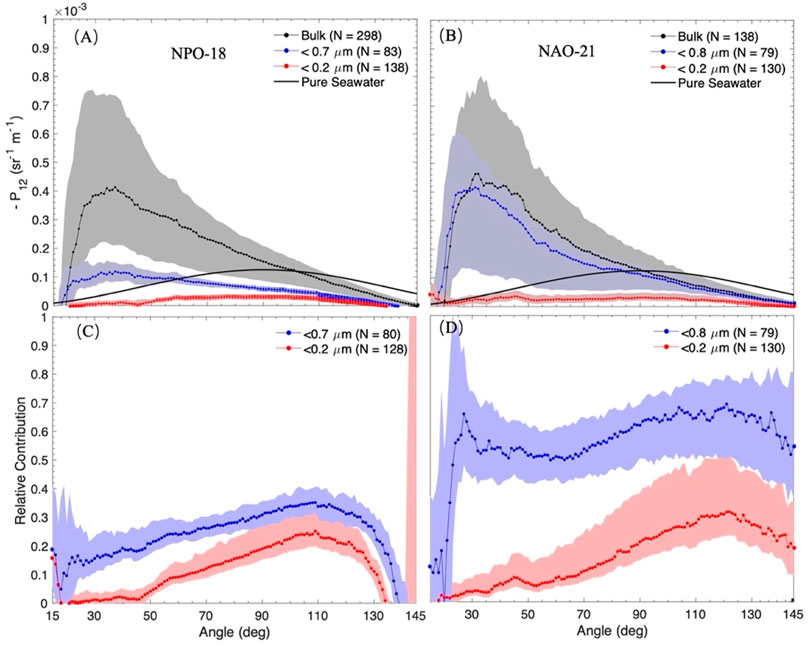
FIGURE 4. The median values of particulate -P12 measured by the LISST‐VSF for unfiltered sample (Bulk), 0.7‐μm filtrate (<0.7 μm), and 0.2‐μm filtrate (<0.2 μm) in the (A) NPO-18 and (B) NAO-21 sites and the relative contribution by submicron particles in the (C) NPO-18 and (D) NAO-21 sites. The shaded area represents the 25th and 75th percentile of the data. Theoretical pure seawater scattering (black solid line) was calculated using the Zhang et al. (2009) and Zhang et al. (2019) models.
The depth profiles of −P12 (120°) in the two sites are shown in Figure 3B. The variations of −P12 (120°) for each size fraction were very similar to P11 (120°) shown in Figure 3A, even though their respective magnitudes were different. For example, the values of −P12 (120°) for particles <0.2 µm were relatively constant with depth and bulk −P12 (120°) exhibited a cline-like feature, both are similar to their counterparts in P11 (120°).
We examined the relative contribution by submicron particles by forming a ratio of P11 or −P12 to the bulk values. Comparatively, submicron particles contributed more to the scattering in NAO-21 (Figures 2D, 4D) than in NPO-18 (Figures 2C, 4C). However, they all exhibited a similar angular pattern: the submicron particles accounted for increased portion of scattering in both P11 and -P12 as scattering angle increases, with peak contribution located at 110–120° and then decreasing slightly toward larger angles. This angular behavior for submicron particles is consistent with the theoretical simulation for P11 (Stramski and Kiefer, 1991), and here in this study, we also observed it for –P12. Because the peak contribution occurred at angles near 120° for both P11 and –P12, we examined P11 (120°) and –P12 (120°) ratios in more detail.
The depth variations of P11 and P12 ratios at 120° in two sites are shown in Figure 5. As the relative contributions differed between size fractions and between the sites, it is interesting to note that for each size fraction and in one site, the relative contributions to P11 and −P12 are very similar to each other (within one standard deviation). This suggests that particles of a particular size, at least in the submicron range, contribute to P11 and P12 similarly. On average, particles <0.2 µm accounted for approximately 20% of P11 or P12 at depths <50 m in both sites and the contributions increased to approximately 40% (Figure 5A) and 60% (Figure 5B) at 3000 m during NPO-18 and NAO-21, respectively. The fractional contribution by particles <0.7/0.8 µm also increased with depth, ranging from 30 to 40% (Figure 5A) and 55 to 75% (Figure 5B) on average from surface to 3000 m during NPO-18 and NAO-21, respectively.

FIGURE 5. Depth variation of relative contributions to bulk P11 (solid circle + solid line) and P12 (open circle + dash line) at 120° by submicron particles in the (A) NPO-18 and (B) NAO-21 sites.
S22 calculated as S22 = P22/P11 is an indicator of how particle shapes deviate from sphericity. For marine particle assemblages, the extent that S22 differs from unity represents the deviation from a collection of homogenous spheres (Jonaz and Fournier, 2007; Koestner et al., 2020). The median values of S22 by bulk and submicron particles are shown in Figures 6A,B for seawater samples collected in the NPO-18 and NAO-21 sites, respectively. We only showed S22 at scattering angles between 70° and 110° because Eq. 4, which was used to estimate S22, is singular at scattering angles 45° and 135° (Sequoia Scientific Inc, 2016) even though S22 should physically have valid values at these angles. Also, we did not show S22 by particles <0.2

FIGURE 6. Median values of S22 measured for the bulk and submicron particles in the (A) NPO-18 and (B) NAO-21 sites. The black solid and dash lines are mean S22 measured by Voss and Fry (1984) in the northern Pacific and eastern Atlantic oceans (VF84) and Koestner et al. (2020) in the coastal waters of San Diego (KSR20), respectively.
During both experiments, S22 is rather flat between 70° and 110°. During NPO-18, the magnitudes of S22 by bulk and submicron particles were comparable with each other with a median value of 0.87. During NAO-21, however, the bulk S22 had a median value of 0.81, smaller than the median value of 0.87 by submicron particles, but was similar to that during NPO-18. Jonasz (1987) examined the morphology of marine particles collected in the coastal and offshore waters using a scanning electron microscope and found that the small particles were roughly spherical or spheroidal while large particles were largely nonspherical. His finding that the nonsphericity of marine particles increases with particle size is consistent with our S22 results during NAO-21. But, our S22 results during NPO-18 suggested that nonsphericity did not change with the particle size in that site.
S22 measured in both sites was greater than that measured by Voss and Fry (1984) in the northern Pacific and eastern Atlantic oceans (black solid line in Figure 6), but smaller than the recent measurements by Koestner et al. (2020) in the waters of San Diego (black dash line in Figure 6). Also, no obvious angular pattern of S22 was observed in ours as well as Koester’s measurements; however, S22 measured by Voss and Fry decreased slightly with the scattering angles.
DoLP calculated using Eq. 8 for bulk and submicron particles exhibited more or less a bell-shape (Figure 7). Again, DoLP by particles <0.2

FIGURE 7. Median values of degree of linear polarization (DoLP) measured for the bulk and submicron particles in the (A) NPO-18 and (B) NAO-21 sites. The black solid and dash lines are mean DoLP measured by Voss and Fry (1984) in the northern Pacific and eastern Atlantic oceans (VF84) and Koestner et al. (2020) in the coastal waters of San Diego (KSR20), respectively.
The P11 (120°) values (red dots in Figure 3A) are of similar magnitude for <0.2 µm particles between the two sites but differed significantly for particles <0.7/0.8
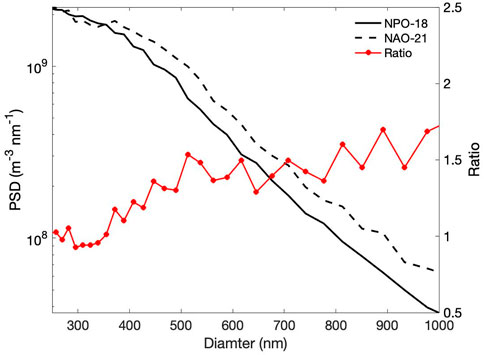
FIGURE 8. Submicron particle size distribution (PSD) measured by ViewSizer 3000 in the NPO-18 and NAO-21 sites (left y-axis) and their ratio (right y-axis).
During both cruises, we also deployed a suite of instruments measuring the size distribution of particles over different size ranges. These instruments include the ViewSizer 3000 that we mentioned above measuring particles of sizes from 0.25 to 1 μm, Coulter Counter Multisizer 4e measuring particles of sizes from 2 to 40 μm, and LISST-100X measuring particles of sizes from 2 to 200 µm. The detailed analysis of these instruments will be reported elsewhere, but their measurements did show the slopes of the size distributions over different size fractions are generally consistent with each other and had a mean slope value of −3.84 during NPO-18 (Figure 9). We will test this mean size distribution to see if we can explain the observed variations in P11 and P12 for different size fractions. We used three particle models of different shapes and internal structures. The first two models are homogenous spheres and homogenous asymmetric hexahedra to represent two extreme shapes of particle: symmetry versus asymmetry and smooth curvature versus sharp edge. We assumed particle size distribution follows a power-law distribution with a slope of −3.84. The diameter of particles ranged from 0.02 to 200 μm with a logarithmic increment of 0.01. The upper and lower cutoff sizes were chosen to ensure that the contribution by particles smaller than the lower cutoff size or larger than the upper cutoff size was negligible (Stramski and Kiefer, 1991). The refractive index of particles was assumed to be 1.05, a representative mean value for oceanic particles (Aas, 1996; Twardowski et al., 2001; Green et al., 2003). The third particle model is based on the first model (homogeneous sphere) but replacing particles in the size range from 1.0 to 20.0 μm with two-layer coated sphere to represent phytoplankton-type particles with an internal cellular structure (Meyer, 1979; Bricaud and Morel, 1986). The thickness of the outer layer was 10% of the radius of the particle approximately corresponding to 30% of phytoplankton cell volume being chloroplast (Bernard et al., 2009). The refractive index for coated spheres was 1.14 and 1.02 for the outer- and inner-layer, respectively. In this setup, the volume-weighted mean refractive index of the coated sphere was 1.05, the same value as used in the other two models. P11 and P12 were computed with modified Mie theory for spherical particles and a combination of the invariant-imbedding T-matrix method and physical-geometric optics method was used (Bi et al., 2013; Sun et al., 2017) for hexahedra particles. In the following we will use HS, HH, and CS to represent homogeneous sphere model, homogeneous hexahedral model, and the mix of homogeneous/coated sphere model, respectively.
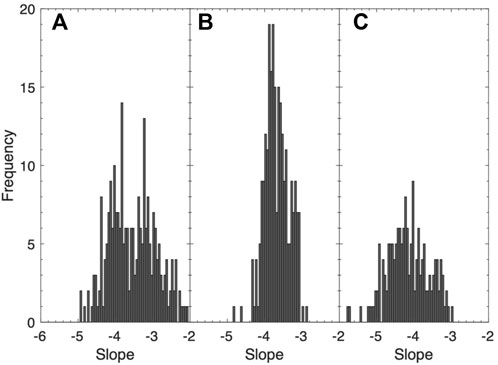
FIGURE 9. Histogram of the power-law slopes estimated from the particle size distributions measured by (A) ViewSizer 3000, (B) Coulter Counter Multisizer 4e, and (C) LISST-100X during NPO-18.
Because the particle size distribution was only available for the NPO-18 data at the moment, we mainly focused on discussing the NPO-18 results. The overall shape of P11, obtained by normalizing P11 with the integrated scattering from 15° to 145°, was well reproduced by HS and HH models but deviated significantly from the CS model, particularly at angles >90° (Figure 10A). This confirms the earlier studies, where homogeneous spheres have been used successfully to reproduce the VSFs measured in the field (Gordon and Brown, 1972; Brown and Gordon, 1973, 1974; Zaneveld et al., 1974). The homogeneous hexahedra have also been used successfully to reproduce the measured VSFs (Twardowski et al., 2012). The fractional contribution to P11 by particles <0.2 µm can be reproduced reasonably well by both CS and HH models, but deviated significantly from the HS model (Figure 10C). Results shown in both Figures 10A,C suggest that while homogeneous sphere model can simulate the angular shape of P11 well and coated sphere model can simulate the size variation of P11 well, only irregularly shaped hexahedra can simultaneously simulate these two scattering features of P11 well. This suggests that it is important to account for the nonsphericity of oceanic particles, which are seldom spherical, in order to reproduce the angular and size variation of P11. In our simulation, the particle size distribution was based on the measurements, whereas the refractive index of particles was assumed to be 1.05. We also tested the refractive index of two different values, 1.02 and 1.10. In both cases (results not shown), the simulated P11 changed, but the ones that based the HH model were closest to the measured values for both bulk P11 and fractional contribution to P11 by < 0.2 µm particles. This seems to suggest that particle shape plays a more important role in regulating the angular and size variation of P11 than the refractive index. However, if we used a size distribution that differed significantly from the measurement, for example, slopes = −4.5 or −3.0, none of the particle models (results not shown) can reproduce the observed angular and size variation of P11. This also makes sense because it is expected to have the correct size distribution in order to predict the size-related variation in the scattering.

FIGURE 10. Comparison of angular scattering features measured during NPO-18 and simulated using homogeneous sphere model (HS), homogeneous hexahedral model (HH), and the mix of homogeneous/coated sphere model (CS). (A) P11 for bulk particles, (B) −P12 for bulk particles, (C) the relative contribution by particles <0.2 μm to P11, and (D) degree of linear polarization (DoLP) for bulk particles.
The overall shape of P12, similarly obtained by normalizing P12 with the integrated P12 from 15° to 145°, can be reproduced by either of the three models only at angles from 30 to 130° (Figure 10B). The observed sharp increase as scattering angle approaching 30° can only be reproduced by the CS model. However, none of the models can reproduce the rapid drop of P12 at angles >130°. Because CS model includes coated spheres to simulate the cellular structure of phytoplankton particles, the rapid increase in P12 from 15 to 30° could be a scattering signature due to the heterogeneity of particles. However, at this stage we do not know what could cause the rapid drop of P12 at angles >130°, which was found in both NPO-18 and NAO-21 sites. For DoLP, the CS model compared the best with the measurements in terms of the overall magnitude (Figure 10D), but none of the models can reproduce θmax, the angle at which the maximum DoLP occurs. The results shown in Figures 10B,D seemed to suggest that the internal structure or heterogeneity of oceanic particles also affects the linearly polarized components of the scattering and should be accounted for in simulating P12. Testing with different slope and refractive index values led to the similar conclusion as with P11. With wrong slope values (−3.0 or −4.5), none of the particle models can reproduce both P12 features as shown in Figures 10B,D. Using different refractive index values (1.02 or 1.10) could lead to improvement in one feature but degradation in the other, but only CS model results are closest in reproducing both P12 features.
Overall, our scattering simulation indicates that both the shape and heterogeneity of the oceanic particles, in addition to concentrations and sizes, affect the polarized angular scattering. The change of refractive index alters the scattering too, but it will not replicate the effect due to either the shape or internal structure of the particles. We have considered nonsphericity or heterogeneity of marine particles, but not both. More advanced particle models that account for both particle characteristics are needed to better simulate the polarized scattering by oceanic particles.
Particles of different sizes contribute to scattering differently. We have limited knowledge on the scattering contribution by submicron particles (Stramski and Kiefer, 1991; Stramski et al., 2004; Zhang et al., 2020), particularly in terms of polarized scattering. In this study, we measured contribution by submicron particles to the three Mueller scattering matrix elements, P11, P12, and P22, by conducting fractionation experiments in the North Pacific Ocean and the North Atlantic Ocean. To interpret the results, we also simulated P11 and P12 using three particle models including homogenous sphere (HS), mix of homogenous/coated sphere (CS), and homogenous asymmetric hexahedra (HH) to represent different shapes and internal structures.
While the angular variation of P11 for each size fraction (Figures 2A,B) is different from that of P12 (Figures 4A,B), the relative contribution by submicron particles to the bulk particle scattering is approximately the same between the two Mueller matrix elements (Figure 5). In other words, the effect of particle size on P11 and P12 is similar.
The magnitude of P11 and P12 by particles <0.2
In contrast, P11 and P12 by particles <0.7/0.8 µm differed between the two sites, with greater scattering observed for NAO-21 than NPO-18. This difference, which cannot be explained by different pore sizes of filters that were used (0.7 µm for NPO-18 vs. 0.8 µm for NAO-21), corresponded very well to the difference of concentrations measured for particles of size 0.4–1.0 µm between the two sites (Figure 8). Relative contribution by < 0.7/0.8 µm particles to the total particle scattering increased slightly with depth, from 30% at surface to 40% at 3000 m in the NPO-18 site and from 55 to 75% in the NAO-21 site.
Both submicron and bulk particles in the NPO-18 site had same sphericity index (S22 = 0.86). While the submicron particles in the NAO-21 site had the same S22 value as in the NPO-18, its bulk particles had a lower S22 value (0.81), meaning greater deviation from spheres (Figure 6). This is probably because the NAO-21 experiment coincided with a phytoplankton spring bloom (Figure 1), introducing relatively large, irregularly shaped phytoplankton cells.
When using the correct size distribution of particles, particle model of homogeneous spheres, homogeneous hexahedra, or coated spheres can reproduce some of the scattering features measured in this study, but neither of them can reproduce all (Figure 10). This suggests that it is important to account for both nonsphericity and heterogeneity of particles to simulate their polarized scattering.
With the planned launch in the near future of the next generation ocean color satellite mission, PACE, there will be one radiometer, OCI, measuring hyperspectral radiance, and two polarimeters, HARP and SPEXone, measuring the polarized radiance, from the atmosphere and the oceans (Werdell et al., 2019). While we recognize it is still challenging and will involve significant amount of research to sufficiently account for the shape and internal structure of oceanic particles, the findings in this study suggest that the use of idealized homogeneous spheres is inadequate for correctly interpreting the polarized remote sensing signal. Also, this study and other recent studies (Behrenfeld et al., 2005; Brewin et al., 2012; Bellacicco et al., 2019; Zhang et al., 2020) point to the existence of a background backscattering signal that should be considered in the backscattering models.
The datasets presented in this study can be found in online repositories. The names of the repository/repositories and accession number(s) can be found at: https://seabass.gsfc.nasa.gov/experiment/EXPORTS.
LH analyzed data, conducted the simulations, and drafted the manuscript. XZ conceived the idea and edited the manuscript. YX collected and processed in situ data.
This study was supported by NASA grants (80NSSC20K0350 and 80NSSC20M0210) and the National Natural Science Foundation of China (61675187).
The authors declare that the research was conducted in the absence of any commercial or financial relationships that could be construed as a potential conflict of interest.
All claims expressed in this article are solely those of the authors and do not necessarily represent those of their affiliated organizations, or those of the publisher, the editors, and the reviewers. Any product that may be evaluated in this article, or claim that may be made by its manufacturer, is not guaranteed or endorsed by the publisher.
The authors thank the captain and crew of the R/V Sally Ride and RRS Discovery for their help in collecting in situ data. They also appreciate Daniel Koestner for providing their measurement data. They thank two reviewers for their insightful comments.
Aas, E. (1996). Refractive Index of Phytoplankton Derived from its Metabolite Composition. J. Plankton Res. 18, 2223–2249. doi:10.1093/plankt/18.12.2223
Agrawal, Y. C., and Mikkelsen, O. A. (2009). Empirical Forward Scattering Phase Functions from 008 to 16 Deg for Randomly Shaped Terrigenous 1-21 μm Sediment Grains. Opt. Express 17, 8805–8814. doi:10.1364/oe.17.008805
Agrawal, Y. C., and Pottsmith, H. C. (2000). Instruments for Particle Size and Settling Velocity Observations in Sediment Transport. Mar. Geol. 168, 89–114. doi:10.1016/s0025-3227(00)00044-x
Agrawal, Y. C., Whitmire, A., Mikkelsen, O. A., and Pottsmith, H. C. (2008). Light Scattering by Random Shaped Particles and Consequences on Measuring Suspended Sediments by Laser Diffraction. J. Geophys. Res. Oceans 113, C04023. doi:10.1029/2007jc004403
Ahn, Y.-H., Bricaud, A., and Morel, A. (1992). Light Backscattering Efficiency and Related Properties of Some Phytoplankters. Deep Sea Res. Part A. Oceanogr. Res. Pap. 39, 1835–1855. doi:10.1016/0198-0149(92)90002-b
Babin, M., Stramski, D., Reynolds, R. A., Wright, V. M., and Leymarie, E. (2012). Determination of the Volume Scattering Function of Aqueous Particle Suspensions with a Laboratory Multi-Angle Light Scattering Instrument. Appl. Opt. 51, 3853–3873. doi:10.1364/ao.51.003853
Behrenfeld, M. J., Boss, E., Siegel, D. A., and Shea, D. M. (2005). Carbon-based Ocean Productivity and Phytoplankton Physiology from Space. Glob. Biogeochem. Cycles 19, GB1006. doi:10.1029/2004gb002299
Bellacicco, M., Cornec, M., Organelli, E., Brewin, R. J. W., Neukermans, G., Volpe, G., et al. (2019). Global Variability of Optical Backscattering by Non-algal Particles from a Biogeochemical-Argo Data Set. Geophys. Res. Lett. 46, 9767–9776. doi:10.1029/2019gl084078
Bernard, S., Probyn, T. A., and Quirantes, A. (2009). Simulating the Optical Properties of Phytoplankton Cells Using a Two-Layered Spherical Geometry. Biogeosciences Discuss. 2009, 1497–1563. doi:10.5194/bgd-6-1497-2009
Bi, L., Yang, P., Kattawar, G. W., and Mishchenko, M. I. (2013). Efficient Implementation of the Invariant Imbedding T-Matrix Method and the Separation of Variables Method Applied to Large Nonspherical Inhomogeneous Particles. J. Quantitative Spectrosc. Radiat. Transf. 116, 169–183. doi:10.1016/j.jqsrt.2012.11.014
Bohren, C. F., and Huffman, D. R. (1983). Absorption and Scattering of Light by Small Particles. New York: John Wiley.
Boss, E., and Pegau, W. S. (2001). Relationship of Light Scattering at an Angle in the Backward Direction to the Backscattering Coefficient. Appl. Opt. 40, 5503–5507. doi:10.1364/ao.40.005503
Brewin, R. J. W., Dall’Olmo, G., Sathyendranath, S., and Hardman-Mountford, N. J. (2012). Particle Backscattering as a Function of Chlorophyll and Phytoplankton Size Structure in the Open-Ocean. Opt. Express 20, 17632–17652. doi:10.1364/oe.20.017632
Bricaud, A., and Morel, A. (1986). Light Attenuation and Scattering by Phytoplanktonic Cells: a Theoretical Modeling. Appl. Opt. 25, 571–580. doi:10.1364/ao.25.000571
Brown, O. B., and Gordon, H. R. (1974). Size-Refractive Index Distribution of Clear Coastal Water Particulates from Light Scattering. Appl. Opt. 13, 2874–2881. doi:10.1364/ao.13.002874
Brown, O. B., and Gordon, H. R. (1973). Two Component Mie Scattering Models of Sargasso Sea Particles. Appl. Opt. 12, 2461–2465. doi:10.1364/ao.12.002461
Chami, M., Thirouard, A., and Harmel, T. (2014). POLVSM (Polarized Volume Scattering Meter) Instrument: an Innovative Device to Measure the Directional and Polarized Scattering Properties of Hydrosols. Opt. Express 22, 26403–26428. doi:10.1364/oe.22.026403
Dall'olmo, G., Westberry, T. K., Behrenfeld, M. J., Boss, E., and Slade, W. H. (2009). Significant Contribution of Large Particles to Optical Backscattering in the Open Ocean. Biogeosciences 6, 947–967. doi:10.5194/bg-6-947-2009
Fry, E. S., and Voss, K. J. (1985). Measurement of the Mueller Matrix for Phytoplankton1. Limnol. Oceanogr. 30, 1322–1326. doi:10.4319/lo.1985.30.6.1322
Gordon, H. R. (2007). Backscattering of Light from Disk-like Particles with Aperiodic Angular Fine Structure. Opt. Express 15, 16424–16430. doi:10.1364/oe.15.016424
Gordon, H. R., and Brown, O. B. (1972). A Theoretical Model of Light Scattering by Sargasso Sea Particulates1. Limnol. Oceanogr. 17, 826–832. doi:10.4319/lo.1972.17.6.0826
Gordon, H. R., and Du, T. (2001). Light Scattering by Nonspherical Particles: Application to Coccoliths Detached from Emiliania Huxleyi. Limnol. Oceanogr. 46, 1438–1454. doi:10.4319/lo.2001.46.6.1438
Green, R. E., Sosik, H. M., Olson, R. J., and Durand, M. D. (2003). Flow Cytometric Determination of Size and Complex Refractive Index for Marine Particles: Comparison with Independent and Bulk Estimates. Appl. Opt. 42, 526–541. doi:10.1364/ao.42.000526
Hu, L., Zhang, X., and Perry, M. J. (2020a). Light Scattering by Pure Seawater at Subzero Temperatures. Deep Sea Res. Part I Oceanogr. Res. Pap. 162, 103306. doi:10.1016/j.dsr.2020.103306
Hu, L., Zhang, X., and Perry, M. J. (2019a). Light Scattering by Pure Seawater: Effect of Pressure. Deep Sea Res. Part I Oceanogr. Res. Pap. 146, 103–109. doi:10.1016/j.dsr.2019.03.009
Hu, L., Zhang, X., Xiong, Y., Gray, D. J., and He, M.-X. (2020b). Variability of Relationship between the Volume Scattering Function at 180° and the Backscattering Coefficient for Aquatic Particles. Appl. Opt. 59, C31–C41. doi:10.1364/ao.383229
Hu, L., Zhang, X., Xiong, Y., and He, M.-X. (2019b). Calibration of the LISST-VSF to Derive the Volume Scattering Functions in Clear Waters. Opt. Express 27, A1188–A1206. doi:10.1364/oe.27.0a1188
Jonasz, M. (1987). Nonsphericity of Suspended Marine Particles and its Influence on Light Scattering1. Limnol. Oceanogr. 32, 1059–1065. doi:10.4319/lo.1987.32.5.1059
Jonaz, M., and Fournier, G. R. (2007). Light Scattering by Particles in Water: Theoretical and Experimental Foundations. Amsterdam: Academic Press.
Kitchen, J. C., and Zaneveld, J. R. V. (1992). A Three-Layered Sphere Model of the Optical Properties of Phytoplankton. Limnol. Oceanogr. 37, 1680–1690. doi:10.4319/lo.1992.37.8.1680
Koestner, D., Stramski, D., and Reynolds, R. A. (2020). Polarized Light Scattering Measurements as a Means to Characterize Particle Size and Composition of Natural Assemblages of Marine Particles. Appl. Opt. 59, 8314–8334. doi:10.1364/ao.396709
Koestner, D., Stramski, D., and Reynolds, R. (2018). Measurements of the Volume Scattering Function and the Degree of Linear Polarization of Light Scattered by Contrasting Natural Assemblages of Marine Particles. Appl. Sci. 8, 2690. doi:10.3390/app8122690
Kopilevich, O. V. (1983). “Low-parametric Model of Seawater Optical Properties,” in Ocean Optics I: Physical Ocean Optics. Editor A. S. Monin. Nauka, 208–234.
Lee, M. E., and Lewis, M. R. (2003). A New Method for the Measurement of the Optical Volume Scattering Function in the Upper Ocean. J. Atmos. Ocean. Technol. 20, 563–571. doi:10.1175/1520-0426(2003)20<563:anmftm>2.0.co;2
Meyer, R. A. (1979). Light Scattering from Biological Cells: Dependence of Backscatter Radiation on Membrane Thickness and Refractive Index. Appl. Opt. 18, 585–588. doi:10.1364/ao.18.000585
Mobley, C. (1994). Light and Water: Radiative Transfer in Natural Waters. San Diego, CA: Academic Press.
Morel, A., and Ahn, Y.-H. (1991). Optics of Heterotrophic Nanoflagellates and Ciliates: A Tentative Assessment of Their Scattering Role in Oceanic Waters Compared to Those of Bacterial and Algal Cells. J. Mar. Res. 49, 177–202. doi:10.1357/002224091784968639
Morel, A. (1974). “Optical Properties of Pure Water and Pure Sea Water,” in Optical Aspects of Oceanography. Editor N. G. Jerlov, and E. S. Nielsen (New York: Academic Press), 1–24.
Organelli, E., Dall’Olmo, G., Brewin, R. J. W., Tarran, G. A., Boss, E., and Bricaud, A. (2018). The Open-Ocean Missing Backscattering Is in the Structural Complexity of Particles. Nat. Commun. 9, 5439. doi:10.1038/s41467-018-07814-6
Petzold, T. J. (1972). Volume Scattering Functions for Selected Ocean Waters. Report. La Jolla, CA: Scripps Institution of Oceanography, 72–78.
Quinby-Hunt, M. S., Hunt, A. J., Lofftus, K., and Shapiro, D. (1989). Polarized-light Scattering Studies of Marine Chlorella. Limnol. Oceanogr. 34, 1587–1600.
Quirantes, A., and Bernard, S. (2006). Light-scattering Methods for Modelling Algal Particles as a Collection of Coated And/or Nonspherical Scatterers. J. Quantitative Spectrosc. Radiat. Transf. 100, 315–324. doi:10.1016/j.jqsrt.2005.11.048
Sandven, H., Kristoffersen, A. S., Chen, Y.-C., and Hamre, B. (2020). In Situ measurements of the Volume Scattering Function with LISST-VSF and LISST-200X in Extreme Environments: Evaluation of Instrument Calibration and Validity. Opt. Express 28, 37373–37396. doi:10.1364/oe.411177
Sequoia Scientific Inc (2016). LISST-VSF User's Manual (Version 3.0). Available at: https://www.sequoiasci.com/product/lisst-vsf/ (Accessed March 10, 2022).
Siegel, D. A., Buesseler, K. O., Behrenfeld, M. J., Benitez-Nelson, C. R., Boss, E., Brzezinski, M. A., et al. (2016). Prediction of the Export and Fate of Global Ocean Net Primary Production: The EXPORTS Science Plan. Front. Mar. Sci. 3, 22. doi:10.3389/fmars.2016.00022
Slade, W. H., Agrawal, Y. C., and Mikkelsen, O. A. (2013). “Comparison of Measured and Theoretical Scattering and Polarization Properties of Narrow Size Range Irregular Sediment Particles,” in 2013 OCEANS - San Diego (San Diego: IEEE), 1–6. San Diego, CA, September 23–September 27, 2013. doi:10.23919/OCEANS.2013.6740987
Stramski, D., Boss, E., Bogucki, D., and Voss, K. J. (2004). The Role of Seawater Constituents in Light Backscattering in the Ocean. Prog. Oceanogr. 61, 27–56. doi:10.1016/j.pocean.2004.07.001
Stramski, D., Bricaud, A., and Morel, A. (2001). Modeling the Inherent Optical Properties of the Ocean Based on the Detailed Composition of the Planktonic Community. Appl. Opt. 40, 2929–2945. doi:10.1364/ao.40.002929
Stramski, D., and Kiefer, D. A. (1991). Light Scattering by Microorganisms in the Open Ocean. Prog. Oceanogr. 28, 343–383. doi:10.1016/0079-6611(91)90032-h
Stramski, D., and Woźniak, S. B. (2005). On the Role of Colloidal Particles in Light Scattering in the Ocean. Limnol. Oceanogr. 50, 1581–1591. doi:10.4319/lo.2005.50.5.1581
Sullivan, J. M., and Twardowski, M. S. (2009). Angular Shape of the Oceanic Particulate Volume Scattering Function in the Backward Direction. Appl. Opt. 48, 6811–6819. doi:10.1364/ao.48.006811
Sun, B., Yang, P., Kattawar, G. W., and Zhang, X. (2017). Physical-geometric Optics Method for Large Size Faceted Particles. Opt. Express 25, 24044–24060. doi:10.1364/oe.25.024044
Svensen, Ø., Stamnes, J. J., Kildemo, M., Aas, L. M. S., Erga, S. R., and Frette, Ø. (2011). Mueller Matrix Measurements of Algae with Different Shape and Size Distributions. Appl. Opt. 50, 5149–5157. doi:10.1364/ao.50.005149
Tan, H., Doerffer, R., Oishi, T., and Tanaka, A. (2013). A New Approach to Measure the Volume Scattering Function. Opt. Express 21, 18697–18711. doi:10.1364/oe.21.018697
Twardowski, M. S., Boss, E., Macdonald, J. B., Pegau, W. S., Barnard, A. H., and Zaneveld, J. R. V. (2001). A Model for Estimating Bulk Refractive Index from the Optical Backscattering Ratio and the Implications for Understanding Particle Composition in Case I and Case II Waters. J. Geophys. Res. 106, 14129–14142. doi:10.1029/2000jc000404
Twardowski, M., Zhang, X., Vagle, S., Sullivan, J., Freeman, S., Czerski, H., et al. (2012). The Optical Volume Scattering Function in a Surf Zone Inverted to Derive Sediment and Bubble Particle Subpopulations. J. Geophys. Res. Oceans 117, C00H17. doi:10.1029/2011jc007347
Tyler, J. E., and Richardson, W. H. (1958). Nephelometer for the Measurement of Volume Scattering Function In Situ*†. J. Opt. Soc. Am. 48, 354–357. doi:10.1364/josa.48.000354
Voss, K. J., and Fry, E. S. (1984). Measurement of the Mueller Matrix for Ocean Water. Appl. Opt. 23, 4427–4439. doi:10.1364/ao.23.004427
Wells, M. L., and Goldberg, E. D. (1994). The Distribution of Colloids in the North Atlantic and Southern Oceans. Limnol. Oceanogr. 39, 286–302. doi:10.4319/lo.1994.39.2.0286
Werdell, P. J., Behrenfeld, M. J., Bontempi, P. S., Boss, E., Cairns, B., Davis, G. T., et al. (2019). The Plankton, Aerosol, Cloud, Ocean Ecosystem Mission: Status, Science, Advances. Bull. Am. Meteorological Soc. 100, 1775–1794. doi:10.1175/bams-d-18-0056.1
Xiong, Y., Zhang, X., and Hu, L. (2022). A Method for Tracking the Brownian Motion to Derive the Size Distribution of Submicron Particles in Seawater. Limnol. Oceanogr. Method. doi:10.1002/lom3.10494
Yamasaki, A., Fukuda, H., Fukuda, R., Miyajima, T., Nagata, T., Ogawa, H., et al. (1998). Submicrometer Particles in Northwest Pacific Coastal Environments: Abundance, Size Distribution, and Biological Origins. Limnol. Oceanogr. 43, 536–542. doi:10.4319/lo.1998.43.3.0536
Zaneveld, J. R. V., Roach, D. M., and Pak, H. (1974). The Determination of the Index of Refraction Distribution of Oceanic Particulates. J. Geophys. Res. 79, 4091–4095. doi:10.1029/jc079i027p04091
Zhai, P.-W., Hu, Y., Trepte, C. R., Winker, D. M., Josset, D. B., Lucker, P. L., et al. (2013). Inherent Optical Properties of the Coccolithophore: Emiliania Huxleyi. Opt. Express 21, 17625–17638. doi:10.1364/oe.21.017625
Zhai, S., and Twardowski, M. (2021). The Degree of Linear Polarization for Suspended Particle Fields from Diverse Natural Waters. Front. Remote Sens. 2, 735512. doi:10.3389/frsen.2021.735512
Zhang, X., Fournier, G. R., and Gray, D. J. (2017). Interpretation of Scattering by Oceanic Particles Around 120 Degrees and its Implication in Ocean Color Studies. Opt. Express 25, A191–A199. doi:10.1364/oe.25.00a191
Zhang, X., Gray, D. J., Huot, Y., You, Y., and Bi, L. (2012). Comparison of Optically Derived Particle Size Distributions: Scattering over the Full Angular Range versus Diffraction at Near Forward Angles. Appl. Opt. 51, 5085–5099. doi:10.1364/ao.51.005085
Zhang, X., and Hu, L. (2018). Anomalous Light Scattering by Pure Seawater. Appl. Sci. 8, 2679. doi:10.3390/app8122679
Zhang, X., Hu, L., Gray, D., and Xiong, Y. (2021). Shape of Particle Backscattering in the North Pacific Ocean: the χ Factor. Appl. Opt. 60, 1260–1266. doi:10.1364/ao.414695
Zhang, X., Hu, L., and He, M.-X. (2009). Scattering by Pure Seawater: Effect of Salinity. Opt. Express 17, 5698–5710. doi:10.1364/oe.17.005698
Zhang, X., and Hu, L. (2021). Light Scattering by Pure Water and Seawater: Recent Development. J. Remote Sens. 2021, 9753625. doi:10.34133/2021/9753625
Zhang, X., Hu, L., Xiong, Y., Huot, Y., and Gray, D. (2020). Experimental Estimates of Optical Backscattering Associated with Submicron Particles in Clear Oceanic Waters. Geophys. Res. Lett. 47, e2020GL087100. doi:10.1029/2020gl087100
Zhang, X., Stramski, D., Reynolds, R. A., and Blocker, E. R. (2019). Light Scattering by Pure Water and Seawater: the Depolarization Ratio and its Variation with Salinity. Appl. Opt. 58, 991–1004. doi:10.1364/ao.58.000991
Keywords: ocean optics, light scattering, linear polarization, Mueller scattering matrix, submicron particles
Citation: Hu L, Zhang X and Xiong Y (2022) Contribution of Submicron Particles to the Unpolarized and Linearly Polarized Angular Scattering. Front. Remote Sens. 3:925654. doi: 10.3389/frsen.2022.925654
Received: 21 April 2022; Accepted: 23 June 2022;
Published: 25 July 2022.
Edited by:
Kirk D. Knobelspiesse, National Aeronautics and Space Administration, United StatesReviewed by:
Chong Shi, Aerospace Information Research Institute (CAS), ChinaCopyright © 2022 Hu, Zhang and Xiong. This is an open-access article distributed under the terms of the Creative Commons Attribution License (CC BY). The use, distribution or reproduction in other forums is permitted, provided the original author(s) and the copyright owner(s) are credited and that the original publication in this journal is cited, in accordance with accepted academic practice. No use, distribution or reproduction is permitted which does not comply with these terms.
*Correspondence: Xiaodong Zhang, WGlhb2RvbmcuWmhhbmdAdXNtLmVkdQ==
Disclaimer: All claims expressed in this article are solely those of the authors and do not necessarily represent those of their affiliated organizations, or those of the publisher, the editors and the reviewers. Any product that may be evaluated in this article or claim that may be made by its manufacturer is not guaranteed or endorsed by the publisher.
Research integrity at Frontiers
Learn more about the work of our research integrity team to safeguard the quality of each article we publish.