- 1Jet Propulsion Laboratory, California Institute of Technology, Pasadena, CA, United States
- 2Spectral Sciences, Inc., Burlington, MA, United States
- 3GFZ German Research Centre for Geosciences, Potsdam, Germany
Models linking surface characteristics within incident solar radiation are inexorably dependent on the topography of the given region. To date, however, most operational surface reflectance retrievals treat this dependence by assuming a flat terrain, leading to significant deviations in the estimated reflectance. Here, we demonstrate that incorporating dynamic topography directly into the joint surface and atmospheric model during retrievals has several advantages. First, it allows for a more complete physical accounting of downwelling illumination, providing more accurate estimates of the absolute magnitude of reflectance. Second, it facilitates a superior resolution of the atmospheric state, most notably due to the confounding influence of atmospheric aerosols and unresolved topographic effects. Our methodology utilizes a practical, high-fidelity, model-driven approach to separate out diffuse and direct irradiation and account for topographic effects during the joint inversion of atmosphere and surface properties. We achieve this by enhancing the atmosphere/surface inversion to account for the radiative transfer effects of surface slope. We further demonstrate how uncertainties in topographic features can be quantified and leveraged within our formulation for a more realistic posterior uncertainty estimates. Our results demonstrate that the inclusion of topographic effects into the retrieval model reduces errors in the reflectance of an only moderately rugged terrain by more than 15%, and that a post hoc accounting of topography cannot achieve these same results.
1 Introduction
Earth observing airborne and orbital imaging spectrometers measure the electromagnetic radiation reaching the aperture of an instrument in narrow and continuously spaced spectral channels. Passive instruments sensitive to the Visible-to-ShortWave InfraRed (VSWIR, 350–2,500 nm) such as NASA’s upcoming Earth Venture Instrument Earth Surface Mineral Dust Source Investigation (EMIT), rely on solar illumination as the radiation source, and measure the radiation reflected from Earth’s surface and atmosphere (Connelly et al., 2021). The magnitude and shape of the reflectance at any given point on the surface is a complex combination of material structure and molecular composition. Consequently, these instruments can be used for a plethora of Earth Science applications, ranging from surface classification, estimating vegetation traits and genetics, mapping of soil properties and snow conditions, and many others (Clark et al., 2003; Painter et al., 2003; Asner et al., 2017; Carmon and Ben-Dor, 2017; Gholizadeh et al., 2017; Pelta et al., 2019; Chadwick et al., 2020; Blonder et al., 2021; Bohn et al., 2021; Cawse-Nicholson et al., 2021). However all of these biogeophysical retrievals are predicated on the accurate characterization of surface reflectance, which in the context of remote sensing must be estimated from at-sensor radiance using a coupled surface and atmospheric model, a routine colloquially referred to as atmospheric correction.
Most operational atmospheric correction routines are performed using an inversion strategy, where either optimization or algebra is used to solve for surface and atmospheric state variables by comparing the results of a forward model of at-sensor radiance with the actual measurements (Thompson et al., 2018). A simplified forward model that is commonly used is
where lobs is the modeled at-sensor radiance measurement, eo is the solar irradiance at top of atmosphere, μs is the cosine of the solar zenith angle (SZA), ρa is the atmospheric reflectance, t is the direct plus diffuse atmospheric transmittance for the sun to surface to sensor path, s is the surface spherical albedo, and ρs is the unknown surface reflectance. Lowercase bold letters are m-vectors, where m is the number of channels in the instrument, and lowercase non-bold letters indicate scalars. In this equation and elsewhere, multiplication of vectors is interpreted as element-wise, that is, wavelength-by-wavelength, multiplication.
The atmospheric optical coefficients like transmittance vary over space, time, and observing geometry. To calculate these parameters for a specific observation, atmospheric Radiative Transfer Models (RTMs) are used to simulate the interaction of radiation with atmospheric constituents. RTMs account for observational conditions known in advance, such as the sensor’s geometry and altitude, and the position of the sun. They also consider the atmospheric state, i.e., the presumed atmospheric conditions typically parameterized by the columnar water vapor concentration and the aerosol optical depth at 550 nm, assuming a default aerosol type (Carmon et al., 2020). The RTM maps between the atmospheric state and the atmospheric coefficients to be used in the forward model (ρa, t, and s, in Eq. 1). The atmospheric coefficients are vectors in the same dimension of the measurement, representing different physical phenomena occurring in the interaction of radiation with the atmosphere and surface.
Traditional atmospheric correction software (e.g., ATCOR, ATREM, ACORN, FLAASH) use a sequential approach where first the unknown state of the atmosphere is estimated, and then, given a fixed atmosphere, the forward model is algebraically inverted for the unknown surface reflectance (Richter and Schläpfer, 2019). A number of techniques for estimating the atmospheric state from the data have been developed. Most aim at finding the water vapor amount that fits the radiance curve best, quantified using simple band ratio calculations around the water absorption bands, and using general assumptions about the surface (Green et al., 1998). This approach performs well under optimal atmospheric and environmental conditions, but its performance degrades with more challenging conditions such as low illumination, clouds, high aerosols, and rugged terrain (Thompson et al., 2019). One of the main reasons for the degradation of atmospheric correction performance in such conditions is indeterminacy between signals from the surface reflectance and atmosphere occupying the same spectral range. This makes the separation of the individual contributions an ill-posed problem, as multiple combinations of the surface and atmospheric states can be explained equally well by the forward model. One strategy for tackling the issue of indeterminacy that has been gaining traction is the use of a Bayesian optimization formulation, referred to as optimal estimation (OE) (Rodgers, 2000). In contrast to the sequential approach, this methodology simultaneously estimates both the surface and atmosphere, allowing all unknown variables to be adapted jointly to maximize the goodness of fit subject to prior constraints.
Areas with rugged surface topography, i.e., hilly and mountainous regions, are especially challenging for atmospheric correction, as the surface geometry changes the projection of the illumination flux onto the pixel (Richter et al., 2009). Rugged topography in a scene changes the spectrum of atmospheric downwelling solar radiation falling on a given pixel as a function of its slope and aspect, expressed by the angle between the normal direction to the surface and the Sun’s direction, termed the local or effective solar zenith angle (eSZA) (Richter and Schläpfer, 2005). This leads to inconsistencies in surface illumination even if the atmospheric state is constant across the scene. Future orbital instruments, including NASA’s Surface Biology and Geology (SBG) and Earth surface Mineral dust source InvesTigation (EMIT) and ESA’s Copernicus Hyperspectral Imager (CHIME), will provide global coverage, where topographic uniformity is more scarce than it is common. Many key scientific questions and applications are also inherently coupled with topography, such as those centered on the distribution, function, and diversity of ecosystems, the security and quality of snow as a water resource, or the fire fuel load at wildlife-urban interface. These and many more questions will be within reach with this next generation of imaging spectroscopy measurements, but only if the true influence of topography on biogeophysical processes can be disentangled from biases in the surface reflectance induced by similar topographic effects (Dozier et al., 2022).
The traditional approach to compensate for topographic effects is to perform an atmospheric correction that assumes the terrain is flat, and then apply a post hoc topographic correction on the retrieved surface reflectance (Hantson and Chuvieco, 2011). Although this approach helps to even out the visual differences in terrain shading within the scene, it is far from optimal. In principle, topography affects both the color and intensity of downwelling illumination onto the pixel via the magnitudes of diffuse and direct flux per unit area (Thompson et al., 2022). This could modify the atmospheric correction solution, in particular the interpretation of aerosol scattering that causes similar distortions to the spectral shape. Post hoc topographic correction thus withholds information that is necessary to achieve the correct atmospheric solution. Additionally, most post hoc topographic correction approaches assume that the topographic effect is spectrally uniform, purely due to the photometry of surface aspect to the direct solar beam. In the few cases where post hoc corrections account for both diffuse and direct illumination, the relationship is empirically derived and may be inconsistent with the retrieved atmospheric constituents (Teillet et al., 1982). Only a pure model driven solution, in which atmosphere and surface are estimated together while accounting for local topography, can correctly account for these issues and obtain a globally consistent answer.
In this work we describe a new model named TOPOFLUX, that incorporates the effects of variable pixel topography into the forward model within an OE atmospheric correction algorithm, yielding a more precise estimation of surface reflectance and atmospheric conditions. In contrast to the post hoc correction, here we fold the radiative transfer effects of topography into the initial correction, capturing more of the radiative-transfer physics in the forward model, and thereby yielding higher fidelity modeled radiances and retrieved reflectances.
2 Methods
Our experiments are performed using optimal estimation (OE) techniques, which provide several advantages over traditional atmospheric-correction approaches, and which have proven effective in prior work (Nguyen et al., 2015; Natraj et al., 2017; Carmon et al., 2020; Thompson et al., 2020). Partitioning downwelling flux, at each wavelength, into direct and diffuse components allows their separate radiative effects to be balanced with atmospheric effects, all jointly within the OE radiance-fitting procedure. For clarity, we motivate the OE setup and show how it uses the notion of a forward model. Section 2.1 gives the mathematical framework description of the OE algorithm in the context of atmospheric correction. Section 2.2 describes the theoretical background of surface reflectance retrieval (Section 2.2.1), the radiative transfer fluxes and components (Section 2.2.2), and concludes with a description of two alternative forward models; a topography-naive (Section 2.2.3) and a topography-aware (Section 2.2.4).
2.1 Optimal Estimation for Atmospheric Correction
The OE formulation of surface and atmospheric modeling uses an inverse approach where the at-sensor radiance is an indirect measurement of the surface and atmospheric states. A real physics forward function maps between the unknown state to the at-sensor radiance, and the goal is to “invert” this function and retrieve the state from the measurement.
We define x to be the “state vector” of free parameters, made up of sub-components for the surface xsurf, and the atmosphere xatm. The surface component contains an entry for each spectral channel, i.e.,
where f (⋅) is the ideal forward function applied to the true state vector, and δ1 is the added error due to instrument noise
We assume that the expected value for ϵ is zero, i.e., E(ϵ) = 0, and that δ1 and δ2 are independent of each other, which implies the following:
To find the most probable solution for x, OE uses Bayes’ law of conditional probability that reads:
where P (x ∣ y) is the posterior likelihood of the unknown state given the measurement. P(y∣x) is the likelihood of the measurement given the state, and P(x) is the prior probability of the state. Typically in remote sensing applications, P(y∣x) and P(x) are modeled with multivariate Gaussian distributions, and the behavior as a function of the already-observed y is not of interest. Equation 2 becomes
where we abbreviate the weighted vector magnitude
To compute the most probable solution given the measurement, we define a cost function
This two-term cost function can be interpreted as a Lagrangian, in which the left term expresses the objective of “goodness of fit” of the measurement to the model’s prediction, accounting for instrument noise, and the right term penalizes for any departure from the mean of the prior distribution, accounting for the prior uncertainty characterized by its covariance.
Minimizing the cost function is equivalent to maximizing the posterior probability in Eq. 2. We minimize
When P (y ∣ x) and P(x) are multivariate normal, then
2.2 The Forward Model
2.2.1 Theoretical Background
The forward model F(x) → y translates conditions in the state space into the radiance-measurement space by formulating the physical system as an algebraic expression. This section describes the imaging geometry and a radiance decomposition that are key to understanding the topographic adjustments we propose.
Figure 1 shows a graphical representation of the observation system. The instrument, positioned at top of atmosphere (TOA), observes Earth at a given viewing zenith angle (VZA), and records the TOA radiance arriving at the sensor’s aperture (known as the at-sensor radiance). This radiation originates from the Sun (the solar irradiance), and is reflected from Earth’s surface and atmosphere into the instrument’s line of sight (LOS). When downwelling and upwelling through the atmosphere, the solar radiation interacts with atmospheric gases and aerosols/clouds via molecular and particulate absorption and scattering. The source attenuation is called total, direct plus diffuse, atmospheric transmittance, and is a function of the atmospheric state, with the water vapor columnar concentration and the aerosol optical depth being the most influential unknowns under cloud-free sky conditions.
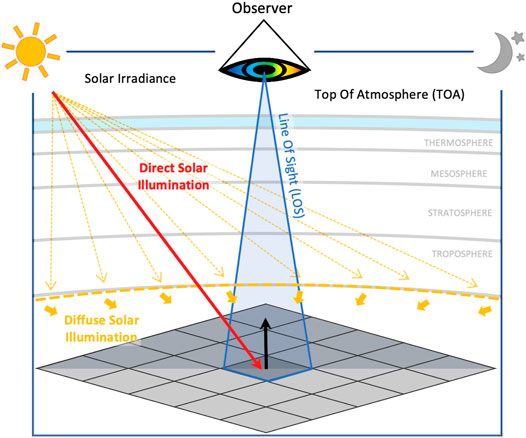
FIGURE 1. The global illumination flux onto the pixel is omni-directional and is the sum of the direct and the diffuse fluxes. The direct flux is directional and comes strictly from the sun-to-target direction, while the diffuse flux is hemispherical and is coming from all upwards directions compared to the target. The observation is conical, but assumed directional.
The radiation illuminating a given pixel is called the incident radiation, or the global flux eg. The global flux has direct and diffuse components, where the direct component represents photons strictly in the Sun-to-surface direction, and the diffuse component represents photons from the entire hemisphere (see Figure 1). This radiation illuminates the surface of a given pixel, and the materials within the pixel interact with the incident radiation via transmittance, absorption and reflectance. Whereas the global flux arrives at the pixel from the entire hemisphere, the instrument observes the target from a single direction, and hence the correct retrieved quantity for surface reflectance is the hemispherical-directional reflectance factor (HDRF), i.e., illuminated by the hemisphere, observed from a direction. Simply put, the HDRF is the ratio between the surface-leaving radiance, sampled from a single direction, and the incident radiation, arriving from all directions, capturing the spectral reflectance of the materials in a given pixel (Schaepman-Strub et al., 2006). In this work we use the notion of an intrinsic reflectance, i.e., a reflectance that is an intrinsic property of the materials that cover the pixel’s surface.
2.2.2 Radiation Components
Following common approach in atmospheric RTM-related publications, we separate the at-sensor radiance into five components: path radiance (direct and diffuse), direct-reflected, diffuse-reflected, spherical albedo, and adjacency effects (Figure 2) (Guanter et al., 2009; Berk et al., 1999). The path radiance represents photons that are reflected into the line of sight (LOS) by the atmosphere, without interacting with the surface, and is mostly affected by atmospheric aerosols and Rayleigh scattering. The direct-reflected component represents photons strictly in the sun-to-surface-to-sensor path, and is strongly affected by the concentration of atmospheric gases. The diffuse-reflected component comprises photons illuminating the target from the entire hemisphere (excluding the Sun’s direction) and reflected into the LOS. The spherical albedo component are photons reflected from the surface to the atmosphere and back, before illuminating the target pixel. And finally, adjacency effects represent diffuse radiation from the surface entering the LOS.
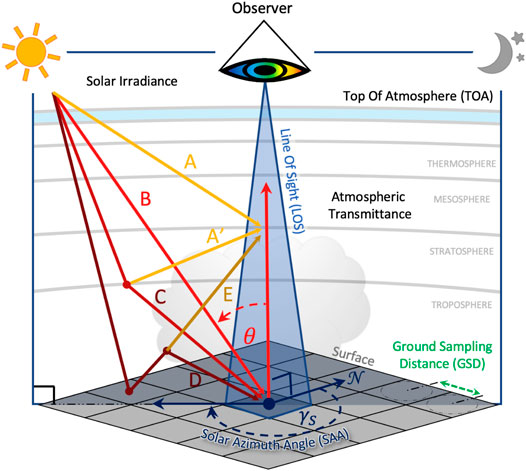
FIGURE 2. Radiation components for a flat surface that enter the line of sight and contribute to the at-sensor radiance measurement. A and A′ are the direct and diffuse atmospheric path radiance, respectively, and do not interact with the surface. B is the direct solar flux illuminating the target pixel. C is the diffuse hemispherical downwelling flux illuminating the target pixel. D is the atmosphere reflectivity (spherical albedo) from the surface, and E is upwelling diffuse radiation from the surface.
For the following discussion it is useful to think about the radiance model in terms of incident fluxes. The global or total flux eg incident upon a given area on the surface is the sum of the direct and diffuse fluxes, i.e., eg = edir + edif. The materials on the surface interact with the incident flux, and the ratio between the outgoing and the incident fluxes for a given pixel is ρs, the “surface reflectance,” the sum of the bi-hemispherical reflectance for the incoming diffuse illumination and the hemispherical directional reflectance for the incident direct flux. The outgoing flux, the hemispherical integral of the “surface-leaving radiance,” is then attenuated by the absorption and scattering of the intervening particles and gases in the atmosphere, characterized by the direct upwelling atmospheric transmittance t↑, before arriving at the sensor. Hence, we can describe the at-sensor spectral channel radiance as:
where lp is the atmospheric path radiance, i.e., the path length integral over the sum of the direct solar irradiance and incident diffuse radiance reflected into the LOS of the sensor.
The global flux eg is comprised of the downwelling direct flux edir, i.e., photons in the sun-to-surface direction, and the downwelling diffuse flux edif, i.e., photons downwelling from the entire hemisphere illuminating the target pixel. The diffuse flux can be partitioned into two components: purely atmospheric diffuse solar radiation, and a surface reflected solar term. The former is comprised of photons illuminating the surface without any prior interaction with it, while the latter are photons that have been multiply reflected/scattered by the surface and atmosphere before eventually illuminating the target pixel. To decouple the purely atmospheric flux from the surface reflectance signature, we use the spherical albedo coefficient vector s that defines the fraction of surface leaving photons that return to the surface after being scattered by the atmosphere:
where the symbol (0) describes the fluxes for a black, zero reflectance, surface. Now, the decoupled downwelling direct and diffuse fluxes take the following form:
where μϕ and μθ are the cosines of the solar zenith angle at the surface and top of atmosphere (TOA), respectively. Note, for a flat surface and plane-parallel atmosphere without refraction these angles are identical. The spectral channel
Next, we will describe two alternative forward models; the “original” model, F0, and an “augmented” model, F1. The original model assumes that all pixels in the scene are flat, ignoring the topography of the terrain. Any variability in the upwelling radiance field at the bottom of the atmosphere is assumed to be a result of the surface reflectance. In contrast, the augmented model accounts for the variability in pixel geometry, represented by its effective solar zenith angle (eSZA), defined in the introduction.
2.2.3 Topography Naive Forward Model
The original forward model assumes that all pixels in the scene are horizontal, and that the effective and TOA solar zenith angles are essentially equal (i.e., μϕ = μθ). In this case there is no need to decouple the downwelling fluxes, and the forward model takes the form:
This model performs well under many conditions, but has limited capacity in scenes with variable topography, as it cannot capture the change in the spectral shape of the illumination when the pixels have a slope and aspect, as shown in the next section. In these cases, the effective solar zenith angle differs significantly from the TOA SZA.
2.2.4 Topography Aware Forward Model
This augmented model is based on the fact that the direct downwelling flux edir onto a given pixel is scaled according to the effective SZA ϕ, i.e., the angle between the pixel’s normal direction and the Sun’s direction, and not by the TOA SZA θ (Figure 3). For Sun-facing slopes, the relative composition of the global flux would favor the direct component, and for non-Sun-facing slopes, it would favor the diffuse component, compared to a flat surface. Moreover, for non-Sun-facing slopes the atmospheric path radiance also has a higher relative contribution to the at-sensor radiance, as is well established for strongly shadowed pixels.
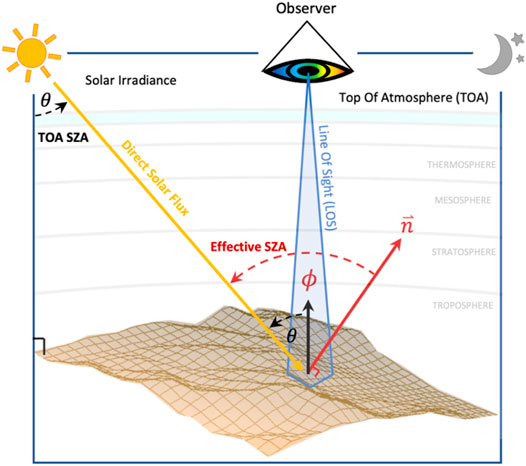
FIGURE 3. The effective SZA and TOA SZA are equal when the target pixel is flat, but if the pixel is sloped, the effective SZA is different.
The importance of this distinction is paramount. The direct and diffuse fluxes have different spectral shapes, and leveraging this physical structure in the forward model will significantly reduce model discrepancy errors. Figure 4 shows the spectral shape variation between the different components, and the errors incurred if assuming a horizontal surface. Implementing this augmented forward model requires knowledge about the surface topography, usually retrieved from a digital surface model (DSM). To calculate the effective SZA ϕ, we use the relationship:
where θ is the TOA SZA, α is the slope, γs is the solar azimuth, and β is the pixel’s aspect (the geographical direction to which the pixel’s slope is facing).

FIGURE 4. The direct illumination flux has a significantly large difference in spectral shape compared with the diffuse flux and the path radiance. Whereas the former is scaled by the cosine of the eSZA, the two latter are scaled by the cosine of the TOA SZA. Panel (A) shows normalized vectors of the three radiation components to illustrate this difference. If not accounting for the eSZA of a pixel, these differences will lead to errors in the modeled radiance within the inversion. Panel (B) shows the spectral shape of radiance errors due to not accounting for the eSZA. The plots show errors between at-sensor radiance modeled with the correct eSZA to a topography naive simulation, for different eSZA values indicated by the colorbar. The radiance were modeled with a spectrally uniform 50% surface reflectance. Both A and B panels show outputs with atmospheric coefficients simulated using MODTRAN 6.0, for standard atmospheric conditions.
The augmented forward model decouples the direct and diffuse downwelling fluxes, and scales them based on pixel geometry. The diffuse downwelling flux is scaled by μθ, the cosine of the TOA SZA, while the direct downwelling flux is scaled by μϕ, the cosine of the effective SZA on the surface, from Eq. 8. The augmented forward model takes the following form:
For horizontal pixels μθ = μϕ and F1 reduces to F0, but when μθ ≠ μϕ this model allows for two differently-weighted flux sources, a generalization that is particularly important in variable terrain when the diffuse illumination has a different spectral shape than the direct illumination.
2.3 Experiments
2.3.1 Study Site
To test and compare between these two alternative forward models we selected a study site in Valencia, Santa Clarita, CA (henceforth, Valencia), characterized by rugged terrain and mostly bare soil with sparse green and non-photosynthetic vegetation (See Figure 5).
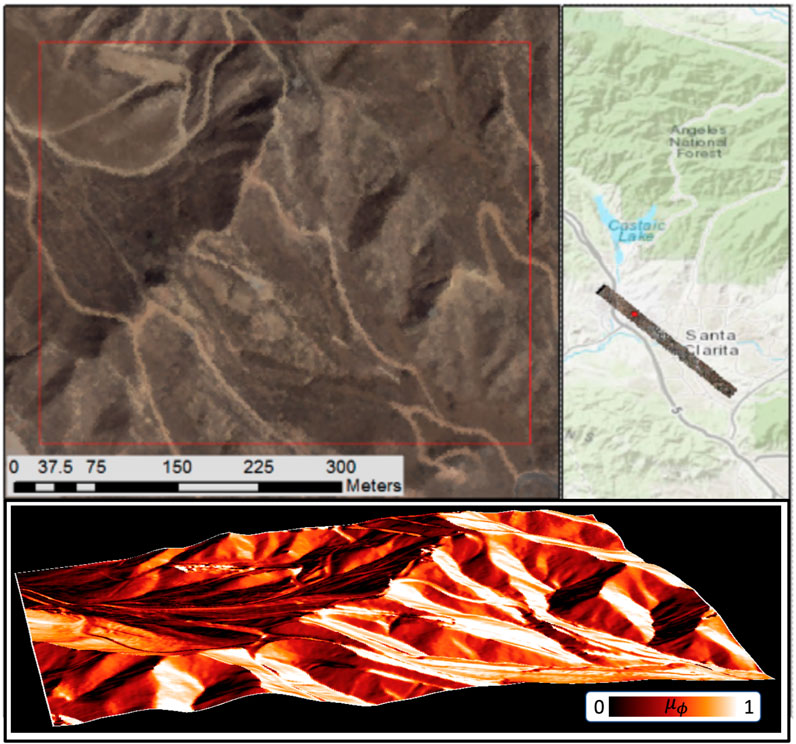
FIGURE 5. The selected study site is mostly bare soil with hilly terrain, located in Valencia, Santa Clarita, California. Bottom panel shows the eSZA cosine for standard illumination conditions.
Multiple radiance images were acquired over Valencia using NASA’s Next Generation Airborne Visible Infrared Imaging Spectrometer (AVIRIS-NG) (Chapman et al., 2019), producing spectral cubes with 425 channels, with spatial resolution of 2–3 m. We selected three flightlines taken on different dates and at different times-of-day to capture variable TOA-SZA and eSZA conditions (see Table 1).

TABLE 1. Flightlines used in this study, showing identification numbers, with per-flightline mean TOA SZA (degrees from zenith), solar azimuth angle (degrees clockwise from North), and spatial resolution.
2.3.2 Preprocessing
To compare images on a per-pixel basis, we co-registered all flightlines to a consistent grid based on Landsat 8’s panchromatic band. Using a high-resolution 1-m DSM from the USGS (USGS, 2015), we calculated the eSZA for each image at each pixel and saved the results for later use. We spatially resampled all images to a 15 × 15 m2 spatial resolution to simulate an orbital instrument and for computational efficiency. Each radiance image was processed twice, with the original forward model, F0, and with the topography-aware model, F1. The result was a set of six reflectance maps, two for each date, to be used in the following analysis.
3 Results and Discussion
Evaluation of the effectiveness of the proposed model is challenging without in situ data. We use two methods to demonstrate the improvements offered by the augmented model: an increased spatial consistency of the retrieved reflectance (Section 3.1), and a decorrelation of this reflectance from topographic information (Section 3.2). We also demonstrate that difficult-to-fix atmospheric errors can be introduced by the naive model (Section 3.3). Next, we show how topographic uncertainties may be handled (Section 3.5), and finally, we provide a comparison of our approach with a common post hoc topographic correction, for completeness (Section 3.4).
3.1 Reduction of Topographic Shadow
A forward model naive to the effective SZA will assume all pixels are flat, and hence, will model a global flux which adds significant errors. This is especially evident when a given pixel is sloped away from the Sun’s direction but not shadowed. In these cases, the direct solar illumination onto the pixel is weaker, as the direct flux stretches over a larger area on the surface. A topography-naive forward model is unaware of this and simulates an incident flux with a magnitude that is too high. Consequently, optimization procedure will compensate for this error by significantly lowering the best-fit reflectance. Figure 6 shows this phenomenon. The left column gives the distribution of eSZA across each flightline. The center column is a reflectance map calculated with the naive forward model, while the right column is calculated with the augmented model, for each fligthline. Recall that the North-Western hill slope of Valencia is facing to the opposite direction from the Sun, clearly visible from the bottom panel of Figure 5. As can be seen here, in the naive case, the reflectance maps show a patch of very dark pixels, which disappears in the augmented model. These results suggest that the dark patch shown in the reflectance results of the original model is not intrinsic to the surface but is an outcome of model discrepancy. Also, the results suggest that the augmented model removes this discrepancy and gives a reflectance solution closer to the intrinsic surface conditions.
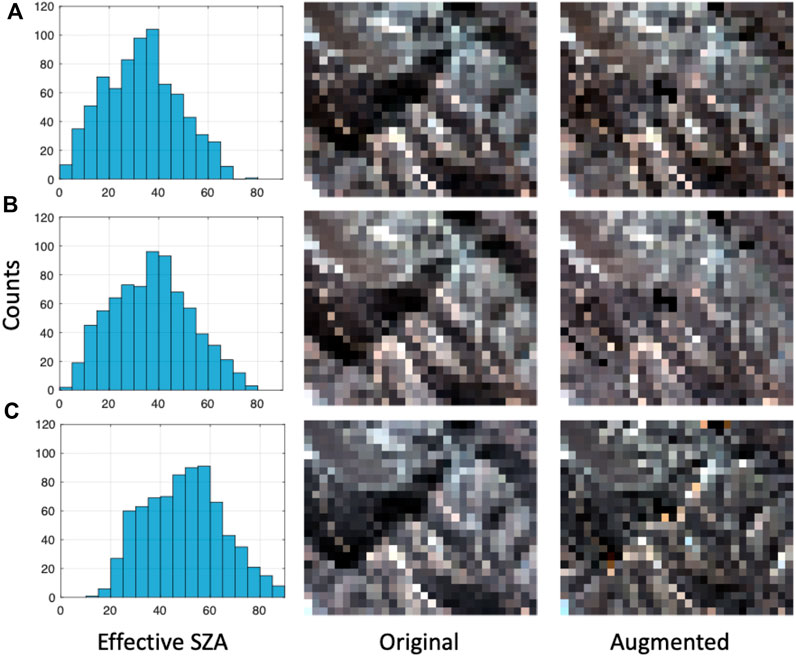
FIGURE 6. True Color images of reflectance retrieval over the study site for the three flightlines. Center column shows results of the original model, and right column using the augmented model. Left column show histograms of the eSZA for each acquisition, for all pixels in the image.
3.2 Decorrelation of Reflectance From Topography
While a reduction in shadows suggests the topographic enhancement is beneficial, it is a subjective measure and does not indicate the magnitude of improvement. To our knowledge, all previous studies of topographic correction in imaging spectroscopy have used similarly qualitative evaluations. To provide a more objective performance metric, we evaluated the correlation between the reflectance maps and the cosine of the effective solar zenith angle. Because the solar angle is highly variable over time, it would be surprising if the surface materials were highly correlated with the specific sun-surface geometry observed on any particular overflight. If the surface materials are evenly distributed on landscape scales, then the sun angle and surface spectra should be mostly uncorrelated with surface reflectances. Nominally, one would expect that the true reflectances measured normal to the pixels should not very significantly with this angle.
Based on this premise, the degree of correlation between surface and solar angle can be used as a quantiative performance metric to assess improvements from topography-aware atmospheric correction. To calculate this we used a correlogram, a graph that quantifies the r2 (coefficient of correlation) between the reflectance values (the square of the correlation coefficient) and the geometry value, for each pixel in the map. This calculation is done independently at each wavelength, and the resulting correlogram quantify the amount of correlation between the reflectance value at each band and the response (Carmon and Ben-Dor, 2019).
Figure 7 demonstrates how using the augmented model decorrelates the reflectance result from topography. The left column of the figure provides a scatter plot between the reflectance primary Principal Components (PC) score and the eSZA, while the right panels display the correlograms. This figure serves as a validation and give evidence that the reflectance retrieved with the augmented model is closer to the intrinsic reflectance of the materials in the pixel.
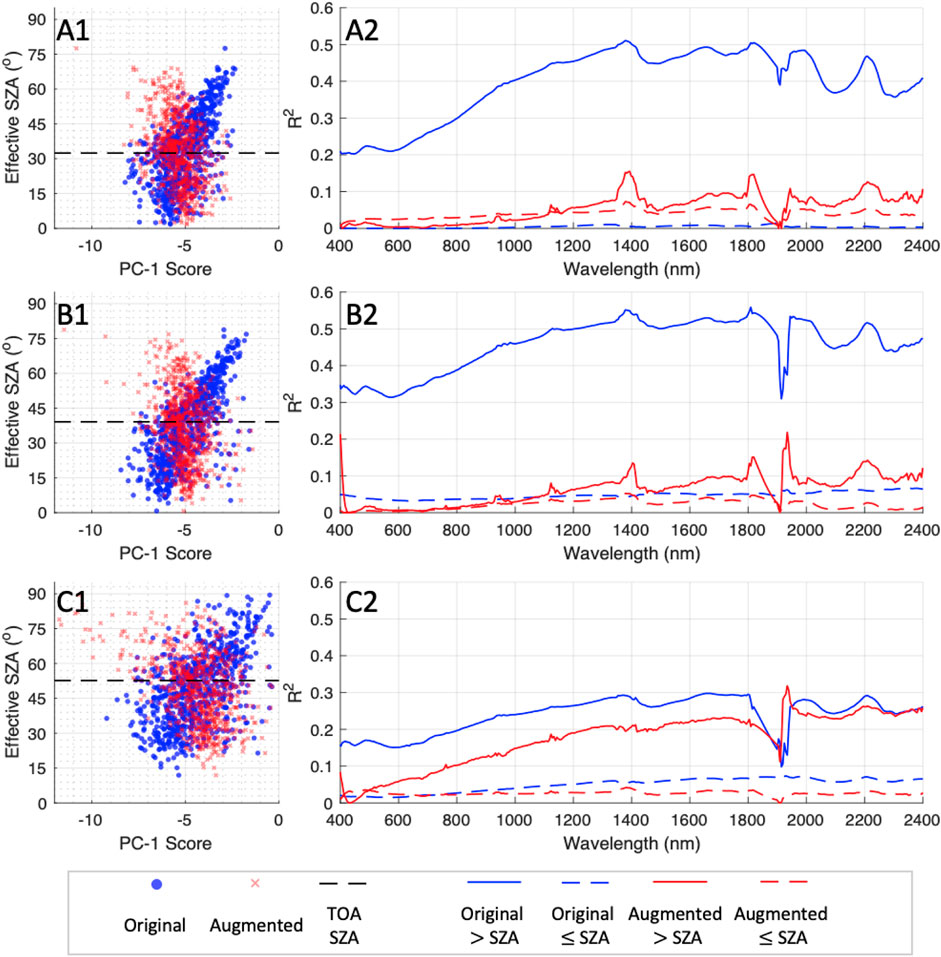
FIGURE 7. Decorrelation plots showing how the retrieved reflectance is less correlated with topography using the augmented model, compared to the original. The left panels show a scatter plot between the 1st principal-component projection of the reflectance and the eSZA for the two models. The right column panels show a per-channel r2 between reflectance and eSZA, AKA “correlograms”. For clarity, we divided the calculation for the correlograms into two pixel groups; pixels with eSZA larger than TOA-SZA, and smaller than TOA-SZA, as represented by the contentious and dashed lines, respectively. The letter codes follow Table 1 to represent the three different flightlines.
The reader should note that although our results strongly suggests a physically driven decorrelation of reflectance from topography, still, surface conditions are naturally correlated with illumination patterns via various mechanisms. Hence, the conclusion that these results suggests the augmented model is better at retrieving a more accurate surface reflectance is contrasted by the caveat that there should be a correlation between surface conditions and topography. Still, we motivate this conclusion by the fact that the reduction in correlation was achieved through a forward model that incorporates additional physics, and that the correlograms for the augmented model still show some degree of correlation with topography.
3.3 Estimating Atmospheric State
RTM-based atmospheric correction algorithms search for the unknown atmospheric state that best fits the data. Significant amounts of atmospheric water vapor and aerosols strongly attenuate the spectral atmospheric coefficients that go into the forward model, and lead to large errors in the reflectance if the wrong value is assigned. If that occurs, a post hoc topographic correction will be incapable of compensating for these errors: the post hoc correction assumes that the retrieved atmospheric state was correct. In this section we use a simulation experiment to demonstrate how the augmented TOPOFLUX model retrieves the correct atmospheric state in all surface geometries, while the naive model results in atmospheric state errors that increase with increasing difference between the TOA-SZA and the eSZA.
We use the augmented model F1, defined in Eq. 18, to simulate at-sensor radiance given a fixed atmospheric and surface states, changing only the value of μϕ. We use a standard vegetation reflectance spectrum as the true surface state, and an atmospheric state where the water vapor amount is 1.6 g/cm2, and AOD is 0.25, representing common atmospheric conditions. We sample from a Gaussian distribution representing the eSZA angle, where the mean equals the TOA SZA θ and equals to 32°, with a variance of 40°. We sampled 1,000 times from this distribution, and calculated at-sensor radiance for each sample. We then ran our atmospheric correction algorithm with the original and the augmented models, retrieving surface and atmospheric state for each.
In Figure 8 we show the estimated atmospheric state for the topography aware model (left) and the topographic naive model (right). One can clearly see that the topography-aware model performs well in all surface geometry conditions, while the naive model performs well only when the eSZA is close to the TOA-SZA. From the topography-naive panel we can see that not including the eSZA in the model would lead to errors in both water and aerosol estimates, and that these errors are correlated to the eSZA and increase as the difference between the eSZA and the TOA-SZA is increasing.
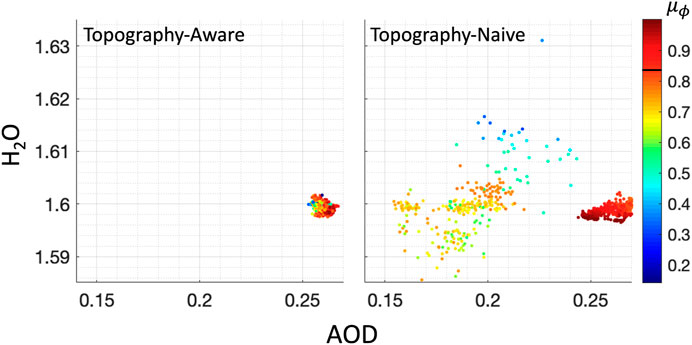
FIGURE 8. Atmospheric state vector retrievals for the two models, varying eSZA, with a constant reflectance and atmosphere. We used a topography-aware and topography-naive inversions to obtain state estimates under these conditions. Points in the scatter plots are colored by μϕ = cos (eSZA).
3.4 Comparison to a post hoc Topographic Correction
For completeness, we evaluate the performance of the topography-aware model against a popular and commonly used post hoc topographic correction algorithm, the Sun Canopy Sensor algorithm with C-correction (SCS + C) (Soenen et al., 2005). In Figure 9 we show a comparison of 3 models: the augmented model, the SCS + C model and the original model, which notably differ substantially. Without extensive, spatially-explicit in situ data, we cannot make a definitive statement about which method is more accurate. However, post hoc corrections are inherently an attempt at approximating the true physics of the system, lending support for the topography-aware approach.

FIGURE 9. Comparison of 3 reflectance spectra from the study site (see green markers in upper panels for locations), retrieved using the topography-aware Topoflux model (blue), the SCS+C posthoc topographic correction (red), and the original topography-naive model (in orange).
3.5 Propagating Uncertainties From the Digital Surface Model
The TOPOFLUX model is based on an estimate of the eSZA, which is usually derived from an external DSM. For operational use in a global investigation, uncertainties in the DSM will depend on the quality of the original measurement, its spatial resolution, and its temporal proximity to the radiance measurement to be inverted. In some areas, such as our California study site, recently acquired high-resolution 1 m LIDAR-based DSMs are available, providing excellent quality surface geometry information. In contrast, the only freely-available dataset covering other regions may be the Shuttle Radar Topography Mission (SRTM) DEM at 30 m, acquired in the early 2000s (National Academies of Sciences E and Medicine, 2018, section 10.2). In such regions, a wide variety of physical processes can affect surfaces such as volcanoes and snow-covered mountains, producing significant topography alteration over decadal timescales (Henderson and Pritchard, 2017; Cigna and Tapete, 2021). Hence, a principled management of uncertainty is required to ensure a correct use of these data within the atmospheric correction algorithm.
In this section we provide a mechanism to quantify, leverage, and propagate uncertainties from the DSM within the OE inversion, based on existing formulations (Rodgers, 2000). We demonstrate how to quantify the effect of DSM uncertainty within the atmospheric correction algorithm, how to leverage these quantities to make better estimates of the unknown surface and atmospheric states, and finally, how to propagate these uncertainties forward and capture their effect in the posterior uncertainty associated with each pixel.
Rodgers (2000, Section 3.2) provides a formulation for “forward model parameters,” components which affect the forward model but are not a part of the state vector. Here, we treat these auxiliary variables as a part of the forward model that is known with some measurement uncertainties, however it is not retrieved as part of the state vector. The OE formulation can treat these sources of uncertainty in the algorithm, where we can capture their effect on the forward model, leverage it, and incorporate it within the inversion. In order to follow the notation of Rodgers, we will relabel μϕ as
where ϵ0 denotes the measurement uncertainties for the radiances. This formulation allows to capture the effect of the
whereJb is the Jacobian of the forward model with respect to
We assume that
where Sy = var(ϵ) is strictly instrument noise, Kb is the forward model’s sensitivity to the
The gradient Kb is the partial derivative of the forward model with respect to
This formulation is equivalent to inflating Sϵ with a physically-structured uncertainty weighed by the accuracy of
Adding to Sϵ this structured noise leads to weighting down the radiance residual’s influence on data portion of the cost function, which now has the form:
Formulating μϕ as an auxiliary variable affects the retrieval in two ways. First, it would shift the balance in the cost function and will weight down the measurement leverage where μϕ affects the spectra the most. This would lead to the solution state to converge on a different location in the sample space. Second, it changes the posterior uncertainty, which now takes the form
Here there is an additional variance term of rank 1, which will inflate the posterior variance along a certain direction that is a function of K. Recall that K is the matrix of partial derivatives of the forward model with respect to the state vector, evaluated at the solution. Because the solution state changes upon introduction of the model noise term, so does K, causing a secondary change to the overall
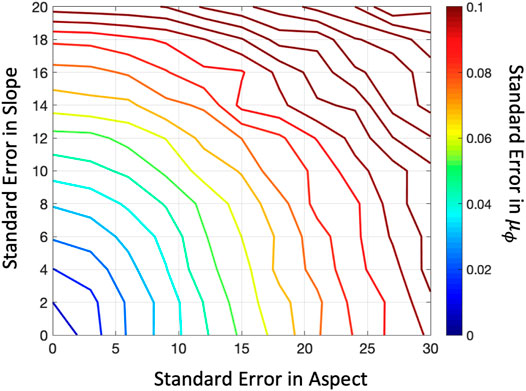
To evaluate these assumptions, we conducted an uncertainty quantification experiment, where we quantify uncertainties in the DSM, propagate them through to μϕ and into the retrieval. First, to get a realistic value for μϕ uncertainty, we calculated the error in μϕ as a function of errors in pixel slope and aspect, for standard conditions. We started with a “true” (reference) μϕ for a sloped pixel of 30°, with an aspect of 90°. We selected standard solar illumination conditions with a TOA SZA of 30°, and a solar azimuth angle of 150°. We then drawn random samples of slope and aspect, where we changed the variance of these variables increasing attractively. For each unique combination of slope and aspect variance, we drew 10,000 samples, and calculated the difference between the simulated and reference μϕ. We tabulated the results based on the slope and aspect uncertainty, and finally we calculated the standard deviation of the difference for each combination.
Figure 10 shows uncertainty in the μϕ variable as a function of uncertainty in the slope and aspect. We selected slope standard deviations ranging between 0 and 20°, and aspect standard deviations from 0 to 30°. From the figure, we can see that for a relatively accurate DSM, with errors in slope of up to 10°, and errors in aspect of up to 10°, we can expect a standard error in μϕ of around 0.05. This level of accuracy is consistent with our experiments, as we have resampled the 1 m2 USGS DSM to 15 m2, resulting with errors of this range or less.
In Figure 11 we show the effect of this formulation in two ways. First panel A gives the shape of the effect in radiance space, for different values of μϕ uncertainties by showing the square-root of the diagonal element of
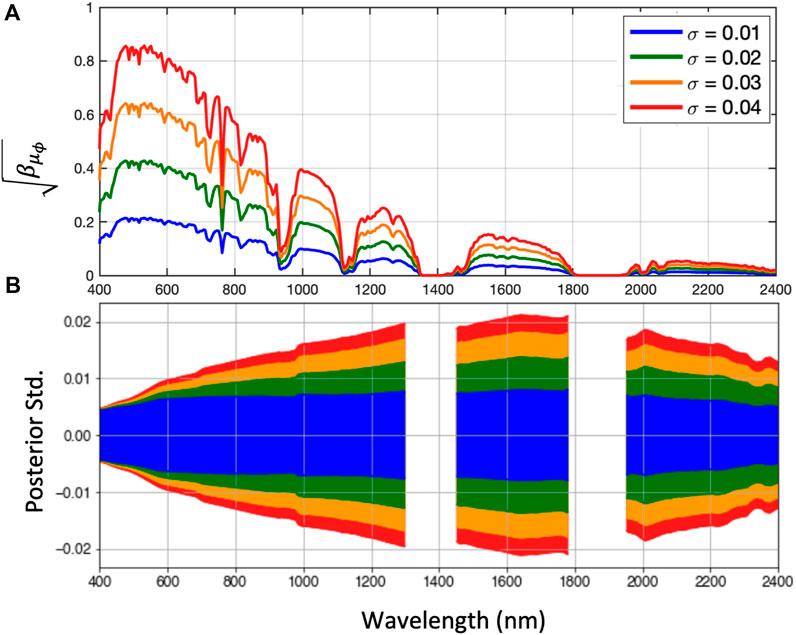
FIGURE 11. μϕ uncertainty effects and propagation. Panel (A) shows the direction of uncertainty in radiance space for different μϕ uncertainties. Panel (B) shows the effect of these uncertainties on the posterior variance.
Adding this uncertainty to the retrieval algorithm can be useful in buffering against small errors in μϕ value, but at the cost of reducing the information content of the retrieved quantities. Due to the magnitude of this effect, a standard error greater than 5–10% for
4 Conclusion
Atmospheric correction of imaging spectroscopy observations is the critical step in estimating biogeophysical properties of the Earth’s surface from instrument-measured radiance. Errors in this first step thus affect all subsequent analyses and products, and systematic deviations from true reflectance may lead to commensurate—or even exaggerated—effects downstream. The purpose of this work was to improve the accuracy of reflectance estimates and their uncertainties using topographic information. By enhancing the physical formulation of the forward model we aimed to retrieve a surface reflectance estimate more intrinsic to the materials within the pixel as opposed to an apparent reflectance that is affected by the environmental conditions of the scene.
A topography-naive forward model will poorly model a radiance measurement originating from a pixel of high slope, facing away from the sun’s direction. This topographic shadow effect is common in rugged terrains, many of which are ecosystems of critical interest for analyses. Topography-naive models treat each horizontal pixel of the surface as having equivalent area, an assumption that breaks down with non-zero slope. This in turn leads to the projection of equivalent solar radiation onto a larger area on the surface, introducing topographically-based biases. This effect can be demonstrated by comparing forward models directly (Figure 4, highlighting an effect most dominant in wavelengths less than 1,000 nm, but present throughout the spectrum). The implications of this correction become even more pronounced when examining real retrievals, as in Figure 6, where we contrast the topography naive and aware models in a rugged landscape. We show how a naive model estimates the reflectance of these pixels as dark, while a topographically aware model provides a brighter, and more spectrally consistent, result. The topography-aware model is able to disassociate the illumination pattern onto this area from the retrieved reflectance, resulting with more consistent and intrinsic estimates of the surface reflectance.
We further investigate the consequences of a topography-aware forward model by showing a simplified comparison of retrieved reflectance and topography. Figure 7 demonstrates a reduced correlation between the first principle component of the reflectance generally understood to indicate brightness (Sousa et al., 2022) and effective solar zenith angle. The reduction in correlation is large (≈75%), though the expected rate of correlation reduction is clouded by likely ecological and geomorphological drivers of surface-topography relationships. An important consideration of this expansion is that the topographic influence is really a coupled solar-angle and topographic effect; in other words, the effect is dominant when the direction normal to the surface is not parallel with the angle of direct solar illumination. This means that, for the same location, acquisitions that occur during different times of day (meaning different solar angles) will experience the effect at different magnitudes. If not accounted for in the forward model, this leads to a potentially significant bias that can also manifest in the spatial and temporal domains.
Figure 4 demonstrates that the difference between the topography naive and aware forward models is consistent with effects due to the presence of aerosols. Any conflation between the two sources (aerosols and topography) may then also influence the retrieval of atmospheric water vapor, leading to a spectrally distorted solution. We hypothesized that a topography-naive model will result in greater errors in the retrieved atmospheric state. A simulation experiment described in Section 3.3 supported this hypothesis, with topography-aware retrievals leading to more consistent aerosol optical depth and water vapor values (Figure 8).
From a practical standpoint, it is useful to also understand how a post hoc correction compares to the topography-aware retrieval. To that end, Figure 9 shows spectra throughout a landscape that highlight how different the reflectance estimates are between the topography-aware model and at least one common post hoc correction (SCS + C). We do not make the claim that aligning a physically-based correction and post hoc correction is impossible, but we do note that common current corrections do not yet concur. And, given that the post hoc correction is an inherent approximation, we believe the topographically-aware retrieval is more likely correct. We suggest that post hoc corrections that attempt to incorporate differences between direct and diffuse transmission from radiative transfer modeling, historically rejected due to the substantial computational requirements, may be more effective and now tractable given advances in emulating atmospheric radiative transfer (Brodrick et al., 2021).
Global imaging spectroscopy missions will encounter variable topography, challenging atmospheric conditions, and a wide diversity of surface types various surface biomes. Accounting for topography in the initial inversion of radiance will help to ensure that retrieved reflectance estimates are buffered against systematic error related to variable terrain.
Data Availability Statement
The raw data supporting the conclusion of this article will be made available by the authors, without undue reservation.
Author Contributions
NC: Conceptualization, Methodology, Visualization, Investigation, Writing—Original Draft, Writing—Review Editing. AB: Methodology, Writing—Review Editing. NB: Methodology, Validation, Writing—Review Editing. PGB: Software, Formal Analysis, Data Curation, Writing—Review Editing, Visualization. OK: Validation, Visualization. HN: Methodology, Formal Analysis, Writing - Review Editing. DT: Methodology, Software, Investigation, Writing—Review Editing. MT: Methodology, Formal Analysis, Supervision, Funding Acquisition.
Funding
This study was carried out at the Jet Propulsion Laboratory, California Institute of Technology. AVIRIS is sponsored by the National Aeronautics and Space Administration (NASA) Earth Science Division. A portion of this work was supported by the Earth Surface Mineral Dust Source Investigation (EMIT), a NASA Earth Ventures-Instrument (EVI-4) Mission.
Conflict of Interest
Author AB was employed by Spectral Sciences Inc.
The remaining authors declare that the research was conducted in the absence of any commercial or financial relationships that could be construed as a potential conflict of interest.
Publisher’s Note
All claims expressed in this article are solely those of the authors and do not necessarily represent those of their affiliated organizations, or those of the publisher, the editors and the reviewers. Any product that may be evaluated in this article, or claim that may be made by its manufacturer, is not guaranteed or endorsed by the publisher.
Acknowledgments
The research was carried out at the Jet Propulsion Laboratory, California Institute of Technology, under a contract with the National Aeronautics and Space Administration (80NM0018D0004). ⓒ 2022. All rights reserved. We also thank the members of the Airborne Visible/Infrared Imaging Spectrometer (AVIRIS) team who participated in data acquisition and analysis.
References
Asner, G. P., Martin, R. E., Knapp, D. E., Tupayachi, R., Anderson, C. B., Sinca, F., et al. (2017). Airborne Laser-Guided Imaging Spectroscopy to Map Forest Trait Diversity and Guide Conservation. Science 355, 385–389. doi:10.1126/science.aaj1987
Berk, A., Anderson, G. P., Bernstein, L. S., Acharya, P. K., Dothe, H., Matthew, M. W., et al. (1999). “MODTRAN4 Radiative Transfer Modeling for Atmospheric Correction,” in Optical Spectroscopic Techniques and Instrumentation for Atmospheric and Space Research III (International Society for Optics and Photonics), 3756, 348–353. doi:10.1117/12.366388
Blonder, B., Brodrick, P. G., Walton, J. A., Chadwick, K. D., Breckheimer, I. K., Marchetti, S., et al. (2022). Remote Sensing of Cytotype and Its Consequences for Canopy Damage in Quaking Aspen. Glob. Change Biol. 28, 2491–2504. doi:10.1111/gcb.16064
Bohn, N., Painter, T. H., Thompson, D., Carmon, N., Susiluoto, J., Turmon, M., et al. (2021). Optimal Estimation of Snow and Ice Surface Parameters From Imaging Spectroscopy Measurements. Remote Sens. Environ. 264, 112613. doi:10.1016/j.rse.2021.112613
Brodrick, P. G., Thompson, D. R., Fahlen, J. E., Eastwood, M. L., Sarture, C. M., Lundeen, S. R., et al. (2021). Generalized Radiative Transfer Emulation for Imaging Spectroscopy Reflectance Retrievals. Remote Sens. Environ. 261, 112476. doi:10.1016/j.rse.2021.112476
Carmon, N., and Ben-Dor, E. (2019). A Spectral Assignment-Oriented Approach to Improve Interpretability and Accuracy of Proxy Spectral-Based Models. IEEE Trans. Geosci. Remote Sens. 57, 3221–3228. doi:10.1109/tgrs.2018.2882623
Carmon, N., and Ben-Dor, E. (2017). An Advanced Analytical Approach for Spectral-Based Modelling of Soil Properties. Int. J. Emerg. Technol. Adv. Eng. 7, 90–97.
Carmon, N., Thompson, D. R., Bohn, N., Susiluoto, J., Turmon, M., Brodrick, P. G., et al. (2020). Uncertainty Quantification for a Global Imaging Spectroscopy Surface Composition Investigation. Remote Sens. Environ. 251, 112038. doi:10.1016/j.rse.2020.112038
Cawse-Nicholson, K., Townsend, P. A., Schimel, D., Assiri, A. M., Blake, P. L., Buongiorno, M. F., et al. (2021). NASA's Surface Biology and Geology Designated Observable: A Perspective on Surface Imaging Algorithms. Remote Sens. Environ. 257, 112349. doi:10.1016/j.rse.2021.112349
Chadwick, K. D., Brodrick, P. G., Grant, K., Goulden, T., Henderson, A., Falco, N., et al. (2020). Integrating Airborne Remote Sensing and Field Campaigns for Ecology and Earth System Science. Methods Ecol. Evol. 11, 1492–1508. doi:10.1111/2041-210x.13463
Chapman, J. W., Thompson, D. R., Helmlinger, M. C., Bue, B. D., Green, R. O., Eastwood, M. L., et al. (2019). Spectral and Radiometric Calibration of the Next Generation Airborne Visible Infrared Spectrometer (Aviris-ng). Remote Sens. 11, 2129. doi:10.3390/rs11182129
Cigna, F., and Tapete, D. (2021). Present-Day Land Subsidence Rates, Surface Faulting Hazard and Risk in Mexico City with 2014-2020 Sentinel-1 IW InSAR. Remote Sens. Environ. 253, 112161. doi:10.1016/j.rse.2020.112161
Clark, R. N., Swayze, G. A., Livo, K. E., Kokaly, R. F., Sutley, S. J., Dalton, J. B., et al. (2003). Imaging Spectroscopy: Earth and Planetary Remote Sensing with the USGS Tetracorder and Expert Systems. J.-Geophys.-Res. 108, 1847. doi:10.1029/2002JE001847
Connelly, D. S., Thompson, D. R., Mahowald, N. M., Li, L., Carmon, N., Okin, G. S., et al. (2021). The EMIT Mission Information Yield for Mineral Dust Radiative Forcing. Remote Sens. Environ. 258, 112380. doi:10.1016/j.rse.2021.112380
Dozier, J., Bair, E. H., Baskaran, L., Brodrick, P. G., Carmon, N., Kokaly, R. F., et al. (2022). Error and Uncertainty Degrade Topographic Corrections of Remotely Sensed Data. Earth Space Sci. Open Archive. doi:10.1002/essoar.10511568.4
Gholizadeh, A., Carmon, N., Klement, A., Ben-Dor, E., and Borůvka, L. (2017). Agricultural Soil Spectral Response and Properties Assessment: Effects of Measurement Protocol and Data Mining Technique. Remote Sens. 9, 1078. doi:10.3390/rs9101078
Green, R. O., Eastwood, M. L., Sarture, C. M., Chrien, T. G., Aronsson, M., Chippendale, B. J., et al. (1998). Imaging Spectroscopy and the Airborne Visible/Infrared Imaging Spectrometer (AVIRIS). Remote Sens. Environ. 65, 227–248. doi:10.1016/s0034-4257(98)00064-9
Guanter, L., Richter, R., and Kaufmann, H. (2009). On the Application of the MODTRAN4 Atmospheric Radiative Transfer Code to Optical Remote Sensing. Int. J. Remote Sens. 30, 1407–1424. doi:10.1080/01431160802438555
Hantson, S., and Chuvieco, E. (2011). Evaluation of Different Topographic Correction Methods for Landsat Imagery. Int. J. Appl. Earth Observation Geoinformation 13, 691. doi:10.1016/j.jag.2011.05.001
Henderson, S. T., and Pritchard, M. E. (2017). Time-Dependent Deformation of Uturuncu Volcano, Bolivia, Constrained by GPS and InSAR Measurements and Implications for Source Models. Geosphere 13, 1834–1854. doi:10.1130/GES01203.1
National Academies of Sciences E. and Medicine (2018). Thriving on Our Changing Planet: A Decadal Strategy for Earth Observation from Space. Washington, DC: The National Academies Press. doi:10.17226/24938
Natraj, V., Thompson, D. R., Helmlinger, M. C., Green, R. O., and Gao, B.-C. (2017). Improved Atmospheric Correction for Imaging Spectroscopy Using Optimal Estimation Publisher. Pasadena, CA: Jet Propulsion Laboratory, National Aeronautics and Space.
Nguyen, H., Jung, J., Lee, J., Choi, S.-U., Hong, S.-Y., and Heo, J. (2015). Optimal Atmospheric Correction for Above-Ground Forest Biomass Estimation with the ETM+ Remote Sensor. Sensors 15, 18865–18886. doi:10.3390/s150818865
Painter, T. H., Dozier, J., Roberts, D. A., Davis, R. E., and Green, R. O. (2003). Retrieval of Subpixel Snow-Covered Area and Grain Size from Imaging Spectrometer Data. Remote Sens. Environ. 85, 64–77. doi:10.1016/s0034-4257(02)00187-6
Pelta, R., Carmon, N., and Ben-Dor, E. (2019). A Machine Learning Approach to Detect Crude Oil Contamination in a Real Scenario Using Hyperspectral Remote Sensing. Int. J. Appl. Earth Observation Geoinformation 82, 101901. doi:10.1016/j.jag.2019.101901
Richter, R., Kellenberger, T., and Kaufmann, H. (2009). Comparison of Topographic Correction Methods. Remote Sens. 1, 184–196. doi:10.3390/rs1030184
Richter, R., and Schläpfer, D. (2019). Atmospheric and Topographic Correction (ATCOR Theoretical Background Document). DLR IB, 564.
Richter, R., and Schläpfer, D. (2005). Atmospheric/Topographic Correction for Satellite Imagery. DLR Rep. DLR-IB 438, 565.
Rodgers, C. D. (2000). Inverse Methods for Atmospheric Sounding: Theory and Practice, 2. World Scientific.
Schaepman-Strub, G., Schaepman, M. E., Painter, T. H., Dangel, S., and Martonchik, J. V. (2006). Reflectance Quantities in Optical Remote Sensing-Definitions and Case Studies. Remote Sens. Environ. 103, 27–42. doi:10.1016/j.rse.2006.03.002
Soenen, S. A., Peddle, D. R., and Coburn, C. A. (2005). Scs+c: A Modified Sun-Canopy-Sensor Topographic Correction in Forested Terrain. IEEE Trans. Geosci. Remote Sens. 43, 2148–2159. doi:10.1109/TGRS.2005.852480
Sousa, D., Brodrick, P., Cawse-Nicholson, K., Fisher, J. B., Pavlick, R., Small, C., et al. (2022). The Spectral Mixture Residual: A Source of Low-Variance Information to Enhance the Explainability and Accuracy of Surface Biology and Geology Retrievals. J. Geophys. Res. Biogeosciences, e2021JG006672. doi:10.1029/2021JG006672
Teillet, P. M., Guindon, B., and Goodenough, D. G. (1982). On the Slope-Aspect Correction of Multispectral Scanner Data. Can. J. Remote Sens. 8, 84–106. doi:10.1080/07038992.1982.10855028
Thompson, D. R., Babu, K. N., Braverman, A. J., Eastwood, M. L., Green, R. O., Hobbs, J. M., et al. (2019). Optimal Estimation of Spectral Surface Reflectance in Challenging Atmospheres. Remote Sens. Environ. 232, 111258. doi:10.1016/j.rse.2019.111258
Thompson, D. R., Bohn, N., Brodrick, P. G., Carmon, N., Eastwood, M. L., Eckert, R., et al. (2022). Atmospheric Lengthscales for Global VSWIR Imaging Spectroscopy. J. Geophys. Res. Biogeosci. 127, e2021JG006711. doi:10.1029/2021JG006711
Thompson, D. R., Braverman, A., Brodrick, P. G., Candela, A., Carmon, N., Clark, R. N., et al. (2020). Quantifying Uncertainty for Remote Spectroscopy of Surface Composition. Remote Sens. Environ. 247, 111898.
Thompson, D. R., Natraj, V., Green, R. O., Helmlinger, M. C., Gao, B.-C., and Eastwood, M. L. (2018). Optimal Estimation for Imaging Spectrometer Atmospheric Correction. Remote Sens. Environ. 216, 355–373. doi:10.1016/j.rse.2018.07.003
Keywords: atmospheric correction, topographic correction, radiative transfer modeling, optimal estimation, optimization, surface reflectance, intrinsic reflectance
Citation: Carmon N, Berk A, Bohn N, Brodrick PG, Kalashnikova O, Nguyen H, Thompson DR and Turmon M (2022) Unified Topographic and Atmospheric Correction for Remote Imaging Spectroscopy. Front. Remote Sens. 3:916155. doi: 10.3389/frsen.2022.916155
Received: 08 April 2022; Accepted: 25 May 2022;
Published: 12 July 2022.
Edited by:
Amir Ibrahim, National Aeronautics and Space Administration, United StatesReviewed by:
Andrew Sayer, Goddard Earth Sciences Technology and Research (GESTAR) II, United StatesShi Qiu, University of Connecticut, United States
Copyright © 2022 Carmon, Berk, Bohn, Brodrick, Kalashnikova, Nguyen, Thompson and Turmon. This is an open-access article distributed under the terms of the Creative Commons Attribution License (CC BY). The use, distribution or reproduction in other forums is permitted, provided the original author(s) and the copyright owner(s) are credited and that the original publication in this journal is cited, in accordance with accepted academic practice. No use, distribution or reproduction is permitted which does not comply with these terms.
*Correspondence: Nimrod Carmon, bmltcm9kLmNhcm1vbkBqcGwubmFzYS5nb3Y=
 Nimrod Carmon
 Alexander Berk
 Niklas Bohn
 Philip Gregory Brodrick
 Olga Kalashnikova
 Hai Nguyen1
 David Ray Thompson
 Michael Turmon