
94% of researchers rate our articles as excellent or good
Learn more about the work of our research integrity team to safeguard the quality of each article we publish.
Find out more
ORIGINAL RESEARCH article
Front. Remote Sens., 18 July 2022
Sec. Atmospheric Remote Sensing
Volume 3 - 2022 | https://doi.org/10.3389/frsen.2022.914378
This article is part of the Research TopicAnthropogenic Emission Monitoring with the Copernicus CO2 Monitoring MissionView all 8 articles
 Sha Lu1*
 Jochen Landgraf1
 Guangliang Fu1
 Bastiaan van Diedenhoven1
 Lianghai Wu1Stephanie P. Rusli1,2
 Otto P. Hasekamp1*
In support of the Copernicus Anthropogenic Carbon Dioxide Monitoring (CO2M) mission, this study evaluates the performance of the Remote sensing of Trace gas and Aerosol Product (RemoTAP) algorithm based on synthetic orbit measurements of realistic atmospheric and geophysical scenes over land. To make use of the added value of the multi-angle polarimeter (MAP) aboard the CO2M mission, the RemoTAP algorithm is developed to perform simultaneous retrieval of trace gas and aerosol properties from both MAP and CO2 imager (CO2I) measurements. At the same time, it has the capability to perform the retrieval of trace gas from only CO2I measurements. To set up the baseline tests, we apply a simple filter based on non-scattering retrievals in different CO2I bands which is able to filter out 80% of the cirrus-contaminated pixels, and after posterior filtering based on goodness of fit, 95% of the cirrus-contaminated cases are screened out. The MAP-CO2I retrieval method is able to reduce the aerosol-induced retrieval error in column-averaged dry-air mole fraction of CO2 (XCO2) in terms of RMSE and bias by more than a factor of 2, compared to CO2I-only retrievals on the filtered pixels. A strong correlation between XCO2 error and surface albedo in CO2I-only retrievals is significantly reduced for MAP-CO2I retrievals. Moreover, XCO2 biases in CO2I-only retrievals exhibit a significant spatiotemporal variability caused by a strong dependence on aerosol load. The biases can be up to 2 ppm over some regions, which are much larger than for the global case. It shows that only by the inclusion of MAP measurements, the large aerosol-induced biases can be mitigated, resulting in the retrievals that meet the mission requirement (precision
Carbon dioxide (CO2) is the most important contributor to greenhouse gas (GHG) emission, where fossil CO2 emission is the largest source (Olivier et al., 2017). An operational capacity for monitoring anthropogenic CO2 emissions is being developed under the European Commission’s (EC) Copernicus program (Janssens-Maenhout et al., 2020). Space-borne measurement is a key component of such an observing system to provide evidence of the emission trend and to detect point sources. Therefore, the European Space Agency (ESA), in collaboration with the EC and the European Organization for the Exploitation of Meteorological Satellites (EUMETSAT), will implement the CO2 Monitoring (CO2M) satellite mission as part of the Copernicus program. In order to monitor trends and the effectiveness of the efforts to reduce CO2 emissions, the mission aims to provide observations of column-averaged dry-air mole fraction of CO2 (XCO2), at high spatial resolution (2 × 2 km2) with high precision (
Based on the heritage from existing space-borne GHG observing systems, such as GOSAT-2 and OCO-2, the CO2 imager (CO2I) instrument aboard the CO2M mission observes the Earth reflected radiance in three spectral bands with the spectral ranges of NIR (747–773 nm), SWIR-1 (1595–1675 nm), and SWIR-2 (1990–2095 nm). However, the XCO2 retrievals from CO2I-like spectrometer measurements suffer from significant aerosol-induced errors depending on the atmospheric aerosol load (Mao and Kawa, 2004; Butz et al., 2009; Guerlet et al., 2013; Rusli et al., 2021). To mitigate the aerosol-induced error, a multi-angle polarimeter (MAP) is included in the CO2M mission to provide measurements of aerosol parameters for light path correction and to ensure the required accuracy of XCO2 retrievals is met (Frankenberg et al., 2012; Meijer et al., 2020).
The Remote sensing of Trace gas and Aerosol Product (RemoTAP) algorithm developed by SRON can simultaneously retrieve aerosol and trace gases by including measurements from both CO2I and MAP. RemoTAP algorithm finds its origin in the SRON aerosol retrieval algorithm (or SRON-MAP algorithm) using MAP measurements (Hasekamp et al., 2011; Fu and Hasekamp, 2018; Hasekamp OP. et al., 2019; Fu et al., 2020). The algorithm was recently extended to include spectroscopic measurements and the ability to retrieve trace gas columns (Rusli et al., 2021). This extension is largely based on the RemoTeC algorithm which infers trace gas from spectrometer measurements. RemoTeC was also developed at SRON and is used for GHG retrieval from GOSAT (Butz et al., 2011; Guerlet et al., 2013) as part of ESA’s Climate Change Initiative (CCI) (Buchwitz et al., 2017). It is also applied for XCO2 retrieval from OCO-2 (Wu et al., 2018; Wu et al., 2019; Wu et al., 2020) and methane retrieval from TROPOMI (Hu et al., 2018; Lorente et al., 2021). By combining the capabilities of SRON-MAP and RemoTeC, RemoTAP is flexible to achieve multiple purposes, for example, 1) aerosol retrieval from MAP-only measurements, 2) trace gas retrieval from spectrometer-only measurements, and 3) simultaneous aerosol and trace gas retrieval using MAP and spectrometer measurements. Only the last two processing lines are of interest in this study for GHG retrieval.
The RemoTAP MAP-CO2I retrieval method was tested by Rusli et al. (2021) on an ensemble of 500 pixels using synthetic measurements with randomized atmospheric and geophysical input parameters and retrieval with consistent assumptions between the synthetic measurement simulation and the retrieval algorithm. It shows that the MAP-CO2I retrieval can significantly reduce the error in the XCO2 retrievals compared to the retrievals using measurements from only the CO2I instrument, and there is virtually no dependence of the error on aerosol load.
The present article provides an extension to the study of Rusli et al. (2021) in different ways: 1) we extend the evaluation of the MAP-CO2I and CO2I-only retrievals to an extended and more realistic set of synthetic measurements, where the synthetic measurements are based on a complex and realistic description on aerosol properties and use realistic viewing and solar geometries from an orbit simulator. Performance is evaluated at both global and regional scales. 2) We also include cirrus clouds for the creation of synthetic measurements, and we investigate the capability of CO2M to filter for cirrus-contaminated scenes or to explicitly include cirrus properties in the retrieval state vector. For the latter purpose, RemoTAP was extended to include cirrus in the forward model and inversion. 3) We evaluate the performance of a so-called proxy retrieval (Frankenberg et al., 2006; Schepers et al., 2012; Krings et al., 2013) where the total column of a target species is inferred using a proxy species with its abundance in the atmosphere known from prior sources at high accuracy, by assuming that the light path modifications in the spectral windows of the two species are the same.
The article is organized as follows. Section 3 describes the methodology for both full-physics and non-scattering/proxy retrievals. Section 4 presents the simulation of synthetic measurements. Section 5 gives an extensive analysis of the performance of the CO2I-only, MAP-CO2I, and proxy retrievals. Finally, Section 6 summarizes the results, and conclusions are made.
The CO2M mission comprises a constellation of low Earth orbit satellites in a Sun-synchronous orbit (altitude 740 km, LTDN 11:30), which is planned to be operated over at least 7 years with a target launch date in 2025. The observing system aims to provide policymakers with accurate global mapping of carbon dioxide and methane at various spatial scales. To achieve sufficiently high spatial resolution, the mission combines a swath of 250 km with continuous spatial sampling (2 km × 2 km) which can realize global coverage in 2–3 days with 3 satellites in orbit at the same time (see Table 1).

TABLE 1. Orbits of CO2M satellite and observation geometries for its instruments.
The mission objective of very accurate XCO2 and XCH4 data products requires the use of co-located measurements from multiple instruments. Trace gases can be inferred from measurements of a push-broom imaging spectrometer, which consists of a NIR band, two SWIR bands, and a VIS band. CO2I comprising the first three bands measures CO2 and CH4. The VIS channel, denoted as NO2I, measures NO2, which can serve as a tracer to assist the identification and mapping of high CO2 concentration plumes resulting from fossil-fuel emissions (Kuhlmann et al., 2021). Measurements from MAP will be used for light path correction to ensure an XCO2 data product for scenes with medium to high aerosol load which may occur over cities and areas affected by biomass burning and dust storms. Finally, observations of a 3-band cloud imager (CLIM) can be used as a first cloud clearing step by identifying pixels with a cloud fraction
This study focuses on the synergistic use of CO2I and MAP for a full-physics XCO2 retrieval. CO2I measures top-of-atmosphere spectral radiance and solar irradiance in 3 spectral windows, that is, one NIR band and two SWIR bands. The NIR band, covering the oxygen (O2) A-band, has a spectral range of 747–773 nm at a spectral resolution of 0.12 nm. The two SWIR bands, covering two CO2 and one CH4 absorption bands, have the range of 1,595–1,675 nm at a resolution of 0.3 nm (SWIR-1) and 1,990–2,095 nm at 0.35 nm (SWIR-2). The spectral resolution is defined as the full width at half maximum (FWHM) of the instrument spectral response, and each FWHM is over-sampled by a factor of 3. The precision in the spectrometer measurements, in terms of signal-to-noise ratio (SNR), is determined by
where anoise and bnoise are the spectrometer-specific constants given for each spectral window (Landgraf et al., 2020). The spectral properties and noise parameters are given in Table 2 according to the CO2M instrument specification (Meijer et al., 2020). The average value of SNR for the NIR band is 569, for SWIR-1 is 1,117, and for SWIR-2 is 469.

TABLE 2. Characteristics of the CO2I spectrometer with a spectral sampling ratio of 3.
MAP measures radiance and degree of linear polarization (DoLP) at 6 wavelengths, 410, 443, 490, 555, 670, and 865 nm, and at 43 viewing angles ranging from −60° to 60° on the ground (Meijer et al., 2020). In this study, we use a simplified MAP error model that assumes the total error for radiance and DoLP is given as a random error of 3% and 0.003, respectively, in accordance with the accuracy requirements. The main MAP instrument characteristics are given in Table 3.

TABLE 3. Characteristics of the MAP.
Any retrieval algorithm aims at inferring an atmospheric state vector x from a measurement vector y. The state vector is linked to the measurement vector through a forward model F(x, b) that depends on the state vector x and a vector b containing ancillary parameters that are not retrieved.
where ey represents the measurement error vector. In our case, the measurement vector may consist of multi-spectral, multi-angle measurements of intensity and DoLP performed by the MAP instrument and CO2I spectrometer. In the following, we will omit the dependence of F on b.
For the retrieval procedure, it is needed that the nonlinear forward model is linearized so that the retrieval problem can be solved iteratively. For iteration step n, the forward model is approximated by
where xn is the state vector for the current iteration step, and K is the Jacobian matrix with elements
The radiance and state of polarization of light at a given wavelength can be described by an intensity vector I which has the Stokes parameters I, Q, U, and V as its components (Chandrasekhar, 1960):
Here, T indicates the transposed vector, and the Stokes parameters are defined with respect to a certain reference plane. We will use the local meridian plane as reference plane.
The DoLP can be computed from the Stokes parameters as:
So, in general, the forward model should simulate the Stokes parameters I, Q, and U for different spectral bands/pixels and viewing angles. The Stokes parameters are calculated from the optical properties by the SRON radiative transfer model LINTRAN v2.0 (Schepers et al., 2014). For a given spectral measurement in band/pixel i, the forward model should simulate
where E represents either I, Q, or U, searth is the instrumental spectral response function (ISRF), and λi is the wavelength assigned to spectral measurement i. Application of Eq. 7 requires E(λ) to be computed at high spectral resolution. To avoid time-consuming line-by-line calculations, we use the linear-k method described by Hasekamp and Butz (2008).
If the dependence of E on λ is weak within the spectral range of the ISRF (e.g., at continuum wavelengths or for spectrally smooth absorbing trace gases), we can approximate Eq. 7 by
In any case (Eq. 7 or Eq. 8), we need a radiative transfer (RT) model to compute I(λ), Q(λ), and U(λ) for a given model atmosphere.
For the forward model calculations, the model atmosphere is discretized into a number NRT of homogeneous vertical layers, provided as input at a fixed number of altitude levels zlev above the surface of the atmosphere. In the standard setup, we use 15 vertical layers (2 km spacing between 0 and 20 km, 4 km spacing between 20 and 36 km, and 1 layer above 36 km). First, we determine the pressure at these altitude levels by linear interpolation of the input pressure profile pmet as a function of altitude zmet from a meteorological data source (e.g., from the Copernicus Atmosphere Monitoring Services, CAMS), to the forward model levels zlev + zsurf, where zsurf is the surface height from a digital elevation map (DEM).
Each layer k in the model atmosphere is characterized by the scattering optical thickness τsca,k, absorption optical thickness τabs,k, and scattering phase matrix Pk.
where the underscripts “mol,” “aer,” and “cir” refer to the contributions from molecules, aerosols, and cirrus, respectively, and Θ denotes scattering angle.
We compute τsca,mol,k using the Rayleigh cross-sections from Bucholtz (1995) and the sub-column of air in layer k. For the Rayleigh phase matrix Pmol, we refer to Hansen and Travis (1974). The molecular absorption optical depth is first calculated per absorber (j) and per discretized atmospheric layer (k). To account for the temperature and pressure dependence of the molecular absorptions within a model layer, we divide each model layer k in Nsub,k sublayers, such that the pressure thickness
with the absorption cross-section
where rgas,k,j is the dry-air mixing ratio of gas j in layer k, and Nair,k is the dry-air sub-column in layer k. The total molecular absorption optical depth for model layer k is then given by
The aerosol optical properties τsca,aer,k, τabs,aer,k, and Paer in layer k are computed from their size distribution, refractive index, and shape. Herein, we assume that the aerosol size distributions consist of a number of size modes, where each mode, in principle, has its own refractive index, vertical distribution, and particle shape. The optical properties are computed per mode using the Mie- and T-matrix improved geometrical optics database by Dubovik et al. (2006) along with their proposed spheroid aspect ratio distribution for computing optical properties for a mixture of spheroids and spheres.
The size distribution naer(r) of each aerosol mode is either described by a log-normal or power-law function. The log-normal size distribution is written as:
where r is the radius (or radius of a volume equivalent sphere), rg is the median radius, and σg is the standard deviation. Instead of rg and σg, we use the effective radius reff and effective variance veff because they are less dependent on the actual shape of the size distribution (Hansen and Travis, 1974). reff and veff are related to rg and σg by:
and
The power-law size distribution is given by
The cut-offs are r1 =0.1 μm and r2 = 10 μm, and the constant C is determined from normalization of the size distribution.
The refractive index of aerosols is described as a function of the MAP spectral sampling points and the central wavelengths for each spectrometer band but is assumed constant inside a spectrometer window. Each aerosol mode is assumed to be a mixture of a set of components, such as inorganic component (INORG), organic carbon (OC), black carbon (BC), dust (DU), and water, where the spectral dependence of the real part and imaginary part of each component are predefined based on the standard types of D’Almeida et al. (1991). Therefore, the complex refractive index as a function of wavelength for a given mode is calculated as follows:
where mk(λ) represents prescribed refractive indices of the kth aerosol component and ck is the coefficient of the component.
A normalized Gaussian altitude distribution with a center height zaer and a full width half maximum (FWHM) w0 is used to calculate the number sub-column of aerosols Naer, k, i for layer k and mode i from the total column of aerosol particles Naer, i for mode i. Hence, for model layer k with a layer height zk and a thickness Δzk, the number sub-column yields:
where Naer, i is the aerosol column number for mode i and B is the normalization constant of the Gaussian.
For the setup of the MAP-CO2I retrieval, we use a parametric 3-mode aerosol description, where the size distribution is described by 3 log-normal modes (i.e., Nmodes = 3), with one fine mode and 2 coarse modes (soluble and insoluble). For the fine mode, the state vector includes reff, veff, Naer, fsph, and the refractive index coefficients ck that correspond to the standard refractive index spectra of inorganic aerosol (real part), black carbon (imaginary part), organic carbon (imaginary part), and water. The coarse insoluble mode consists of non-spherical dust. For this mode, the state vector includes reff, Naer, and a coefficient for the imaginary part of the dust refractive index. The fixed parameters are fsph = 0, veff = 0.6, and ck = 1 for the real part dust refractive index. One value for zaer is included which is assumed to be the same for modes 1 and 2, while w0 is fixed at 2,000 m. The third mode is a coarse soluble mode. For this mode, the state vector includes reff, Naer, and a coefficient ck of the inorganic refractive index spectrum. The fixed parameters are fsph = 1, veff = 0.6, and zaer = 500 m. The aerosol parameters in the state vector for MAP-CO2I retrieval are shown in Table 4.
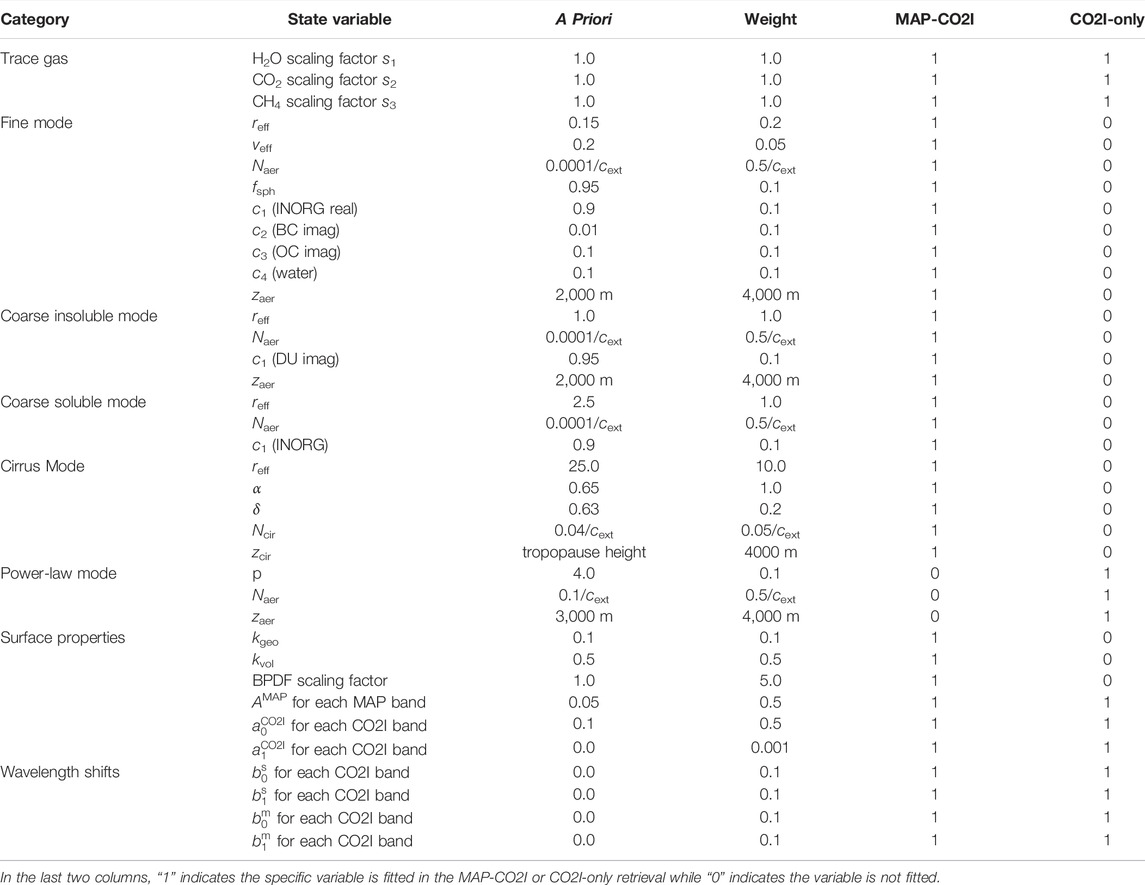
TABLE 4. State variables in the full-physics retrieval, where cext is the cross-section extinction coefficient.
The aerosol size distribution for CO2I-only retrieval is described by a single power-law mode which reflects the information content of the measurements (Butz et al., 2009). Here, Naer and power p are included in the state vector. The refractive index is fixed by 1.4–0.003i for all spectral bands. Furthermore, zaer is included in the state vector and w0 is fixed at 2,000 m.
Optical cirrus properties are computed using the parameterization scheme proposed by van Diedenhoven et al. (2012). It provides extinction cross-section σe, single scattering albedo ω, and scattering phase matrix which are tabulated in a look-up table that stores the optical properties as a function of effective radius reff, hexagonal prism aspect ratio α, degree of crystal distortion δ, and wavelength λ. Linear interpolation is used to obtain optical properties at the actual values of reff, α, δ, and λ. The model uses a description of ice crystals as a mixture of plates with α < 1 as proxies for complex ice crystals. Crystal distortion parameter δ parameterizes the optical effects of crystal complexity from microscales to macroscales (Macke et al., 1996; van Diedenhoven et al., 2014). A maximum of δ = 0.7 is used. The current look-up table contains optical properties at λ =1,589, 1,884, and 2,117 nm. Interpolation leads to moderate positive and negative absorption biases in SWIR-1 and SWIR-2 bands, respectively, which are not expected to substantially affect our sensitivity study. For the vertical distribution of cirrus number column Ncir, Gaussian distribution is also adopted with center height zcir and FWHM w0. The state vector includes reff, α, δ, Ncir, and zcir for cirrus if cirrus is fitted in the retrieval, and w0 is fixed to 1,000 m.
The sub-columns Ngas,k,j of the j different trace gases in layer k of the model atmosphere are given by
where Nstd,k,j is the sub-column for trace gas j corresponding to an a priori vertical profile and sj is the corresponding scaling factor independent on k. The O2 vertical profile follows the pressure profile. For MAP-only retrievals, we fix the scaling factors sj to 1.0, that is, their atmospheric abundance is fixed to the a priori value throughout the retrieval, while for MAP-CO2I and CO2I-only retrievals, we include the scaling factors sj corresponding to CO2, CH4, and H2O in the retrieval state vector.
For retrievals over land, we use the surface reflection matrix (Litvinov et al., 2011) that accounts for the directional and polarization properties of the surface in the form:
where D is the null matrix except D11 = 1. The pairs (θin, φin) and (θout, φout), respectively, denote the incoming and outgoing zenith and azimuth angles.
For the bi-directional reflection distribution function (BRDF) r11, the Ross–Li model given by Eq. 23 is used.
where A is the isotropic scaling parameter, and fgeo and fvol are, respectively, the geometric (Li-Sparse) and volumetric (Ross-Thick) kernels (Wanner et al., 1995).
Rpol in Eq. 22 defines the bi-directional polarization distribution function (BPDF) model (Maignan et al., 2009) to account for the surface polarized reflectance, which is given by
Here, Bpol is a scaling parameter (band-independent). Fp(m, Θ) is the Fresnel scattering matrix with a refractive index m = 1.5. We use ν = 0.1 (Litvinov et al., 2011). μin and μout are the cosines of incoming and outgoing zenith angles, that is, θin and θout, respectively.
The state vector includes kgeo, kvol, and Bpol for MAP-CO2I retrieval, where Bpol is assumed to be spectrally neutral. For CO2I-only retrieval, Lambertian reflection is used, that is, kgeo, kvol, and Bpol are zero. For A(λ), we retrieve one value AMAP for each MAP band, while for the spectrometer windows, we describe the spectral dependence A(λ) within a spectrometer window as a
where λ0 is a reference wavelength chosen as the first wavelength of the spectral window. For each CO2I band, the coefficients for a linear dependence
The spectral calibration of the absorption cross-section data is used as reference, and therefore, the CO2I-measured solar irradiance and radiance need to be recalibrated regarding this reference. The forward model takes consideration of wavelength shifts in both the solar spectrum (δλs) and measurement spectrum (δλm) for the CO2I measurements. The wavelength shifts are also assumed in a polynomial form within a spectrometer window.
The parameterization is denoted as
An overview of the variables included in the state vector x for full-physics retrieval is given in Table 4, where in the last two columns, “1” indicates the specific variable is fitted in the MAP-CO2I or CO2I-only retrieval while “0” indicates the variable is not fitted.
In the inversion procedure, we invert the linearized forward model of Eq. 3 for iteration step n to find the state vector xn+1 for iteration step n + 1. Hereto, we minimize the following cost function (Tikhonov, 1963):
which we transform to
where
The solution of Eq. 27 is given by:
Λ is a filter/damping factor between 0 and 1, which limits the step size for each iteration of the state vector. In this way, we use a Gauss–Newton scheme with reduced step size to avoid diverging retrievals. At each iteration, an optimal combination of γ and Λ is chosen that provides the best match between a simplified (fast) forward model and the measurements via χ2 assessment. χ2 is a measure of goodness of fit given by Eq. 30.
where Nmeas is the total number of measurements, yi is the measurements, Fi is the forward model simulations with the retrieved parameters, and ei is the measurement uncertainties.
The error covariance matrix Sx of the retrieved state vector is given by
where Sr is the regularization error covariance matrix which describes the effect of the a priori error covariance matrix Sa on x,
Sa takes the value of H in this study. Se is the retrieval error covariance matrix that describes the effect of measurement and forward model errors on x,
where D is the contribution or gain matrix
and A is the averaging kernel
The iteration starts with a first guess of the state vector. The first guess of aerosol parameters and surface parameters for MAP bands are obtained using a multimode look-up table (LUT) if MAP measurements are used in the retrieval. Otherwise, the first guess of aerosol parameters is the a priori values. Details of the LUT retrieval are described by Fu and Hasekamp (2018). We use tropopause height (calculated from CAMS data) as the first guess of cirrus layer height if cirrus is retrieved. For the first guess of the BRDF scaling factor at each CO2I band, we use the approximation of a Lambertian reflector for an extinction-free atmosphere:
Here, the first guess A is constant over one spectral window. λcont is the wavelength that gives the maximum reflectance I(λ)/F0(λ) over that spectral band. F0 is the incoming solar irradiance.
The full-physics retrieval process is demonstrated by the flowchart in Figure 1. The a priori values and weights of the state vector for MAP-CO2I and CO2I-only retrievals are given in Table 4.

FIGURE 1. Flowchart of the full-physics retrieval process.
The non-scattering retrieval uses a simplified forward model, ignoring scattering in the atmosphere, and also a simplified inversion procedure. The non-scattering forward model calculates the reflected top-of-atmosphere radiance I as a function of wavelength λ by neglecting scattering:
with the air mass factor:
where A is the Lambertian surface albedo with its spectral dependence in a polynomial form parameterized by Eq. 25. τabs is the absorption optical thickness integrated over vertical layers and molecular species. In addition to the scaling factors for O2, H2O, CO2, and CH4, the linear spectral dependence for Lambertian surface albedo and the wavelength shifts are included in the state vector.
Similar to the full-physics retrieval, the non-scattering inversion is performed iteratively. For each iteration step, we minimize a least-square cost function:
where dn = y − F(xn). Since the non-scattering forward model is sufficiently linear in the state vector x, the cost function can be solved directly without step size reduction by
The non-scattering retrieval is performed to each spectrometer window individually to obtain the total column of the target molecular species of that band according to Table 2. The state vector definition for the non-scattering retrieval is shown by Table 5.

TABLE 5. State variables in the non-scattering retrieval.
The proxy methane product uses the non-scattering output and the a priori estimate of XCO2 (
where total columns CCH4 and CCO2 are retrieved under the non-scattering assumption from the measurements in the SWIR-1 band. Similarly, the proxy XCO2 retrievals can be derived as follows:
The a priori estimates
For the evaluation of the MAP-CO2I and CO2I-only retrievals, we create two sets of synthetic measurements. The first set comprises global data for 4 days, a representative for each season (the 15th of February, May, August, and November), taking into account realistic cloud filtering. The second synthetic data set focuses on spatiotemporal analysis of the retrievals for different regions (China, India, United States, Europe, Sahara, and southern Africa). For this regional data set, we create synthetic measurements from 3 days in each month (the 5th, 15th, and 25th) and ignore cloud coverage to enhance the number of retrievals so we can have a more representative evaluation of the effect of aerosols on the retrieval for each region.
For all synthetic measurements, we take into account the realistic solar and viewing geometry corresponding to a CO2M orbit with the orbit information shown in Table 1. An illustration of the created orbits on the 15th of May for AOT at 563 nm is shown in Figure 2.

FIGURE 2. Illustration of CO2M orbits showing the aerosol optical thickness at 563 nm.
We take the microphysical aerosol properties of our synthetic ensemble from the ECHAM-HAM model (Stier et al., 2005). ECHAM-HAM provides mass-mixing ratio in different vertical layers of the atmosphere of different aerosol species (sulfate, organic carbon, black carbon, dust, and sea salt) in seven different size modes: nucleation soluble (NS), Aitken soluble (KS), accumulation soluble (AS), coarse soluble (CS), Aitken insoluble (KI), accumulation insoluble (AI), and coarse insoluble (CI). Using the air mass in each model layer, we compute the total mass in each layer per species per mode, which is translated into total volume in each layer per species per mode using the specific density per species. Also, for each layer, the sub-column number of aerosol particles and the volume of aerosol water are provided. We sum up the different layers to obtain per mode the total column volume per species (including water), as well as the column number per mode. From the total volume V (all species together) and the column number per mode Naer, we compute the mode radius under the assumption of a log-normal mode description as in Eq. 15 with σg = 1.59 for modes NS, KS, AS, KI, and AI, and σg = 2.0 for modes CS and CI. The refractive index for each mode is obtained using a volume-weighted mean of the refractive index of each species. We take the altitude of the layer with the maximum sub-column number as the aerosol layer height zaer for that mode, and further assume a Gaussian altitude distribution with the center layer height zaer and FWHM w0 = 2,000 m for each mode. ECHAM-HAM does not provide information on the shape of particles. Here, we assume that dust in the mode CI is purely non-spherical and, hence, takes the fraction of non-spherical particles as the volume fraction of dust.
The aerosol optical thickness (AOT) of the ECHAM-HAM ensemble is severely underestimated compared to POLDER-3 satellite retrievals (Tsikerdekis et al., 2021). Therefore, we scale the column number of all fine and coarse modes such that they agree with the fine and coarse mode AOT as retrieved from POLDER-3. Figures 3A–C illustrate a seasonal average over March, April, and May of the total AOT at 563 nm from the POLDER-3 dataset, and a daily average in May of real refractive index (RRI) at 550 nm for the AS mode and the CS mode from ECHAM-HAM.
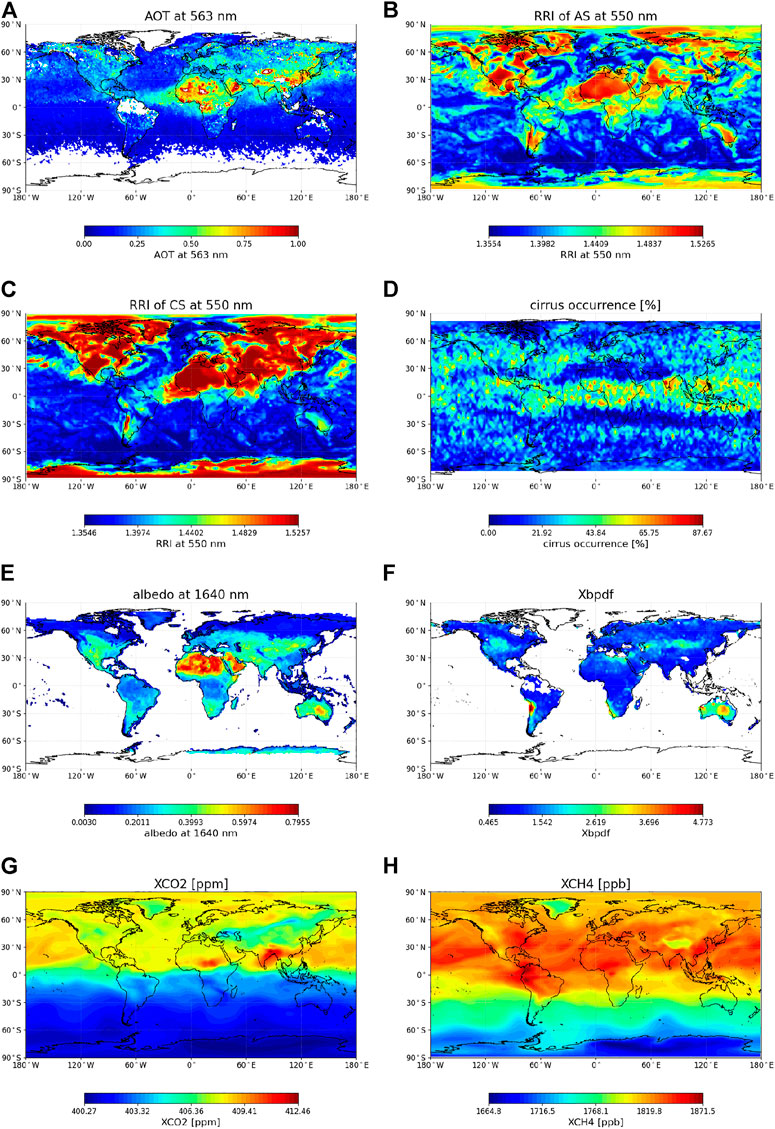
FIGURE 3. Illustration of the ensemble data for aerosol properties (A–C), for cirrus properties (D), for surface properties (E, F), and for trace gases (G, H).
Concerning cirrus properties, we take the median (thin) cirrus optical thickness (COT) and cirrus height from CALIOP data (Winker et al., 2007; Butz et al., 2010). The aspect ratio and distortion are taken from retrievals from POLDER-3/PARASOL by van Diedenhoven et al. (2020). By using an aspect ratio smaller than 1, ice crystals of plates are included in the simulation. The effective radius is randomized in the range between 5 and 50 μm. To get sufficient coverage for both products, we create a monthly mean product gridded on 1° × 1°. Figure 3D shows the cirrus occurrence from the monthly mean of the CALIOP dataset in May.
The BRDF scaling factor A(λ) is derived from GOME-2 (335–772 nm) and MODIS (858–2130 nm) data. The directional parameters kgeo and kvol of the Ross–Li model are also from MODIS observation (Schaaf and Wang, 2015). The land surface BPDF scaling factor
We use the column-averaged dry-air mole fraction of CO2 (XCO2) from the 3-hourly CAMS v18r1 data. XCH4 data are taken from the CAMS v17r1 data. For both data sets, we use the daily mean values (https://apps.ecmwf.int/datasets/data/cams-ghg-inversions/). The vertical profile is adapted from the US standard AFGL database (Shettle and Fenn, 1979). Figures 3G and H depict the daily averages in May for the derived XCO2 and XCH4.
For the simulation of measurements, we assume a linear dependence on wavelength for each CO2I band based on Eq. 26, with
To get a representative coverage for the global retrievals, we apply a cloud mask based on MODIS after we have interpolated all information to the CO2M pixels. Here, we consider a CO2M pixel cloud-free if the MODIS cloud mask indicates “Confidently Clear” for the pixels under consideration as well as for the neighboring pixels.
In this section, we evaluate the performance of the MAP-CO2I and CO2I-only retrievals. The baseline setup of RemoTAP is to not fit cirrus. First, we investigate the capability of non-scattering retrievals in different CO2I bands to filter for cirrus. We then evaluate the global performance of RemoTAP in its baseline setup on cirrus-filtered data. We evaluate the XCO2 errors as a function of the “true” values of solar zenith angle (SZA), AOT at 1,600 nm, COT at 1,600 nm, and the surface albedo at 2,000 nm.
Next, we compare the performance of RemoTAP in baseline setup on cirrus-filtered data against the performance on unfiltered data, against the performance using the setup where we fit cirrus on unfiltered data, and against the performance of the proxy retrieval. Finally, we perform a spatiotemporal evaluation of RemoTAP for different regions.
To generate the a priori vertical profiles for Eq. 21, the a priori total columns are ‘truth’ data scaled by random parameters ranging within [0.95, 1.05], [0.97, 1.03], and [0.94, 1.06] for CO2, H2O, and CH4, respectively (Rusli et al., 2021). Real XCO2 is used as the proxy for XCH4 proxy retrieval in this study, and vice versa.
To keep the numerical efforts within reasonable limits, we perform the global retrievals on 1% of all pixels, which are distributed evenly over each orbit. We also perform tests using a larger fraction of the pixels, and this resulted in virtually the same performance. This means the processing of 1% of the pixels provides a representative view of the performance.
For the filtering of cirrus clouds, we will use the result from non-scattering retrievals in the different spectral bands (NIR, SWIR-1, and SWIR-2) to filter for clouds, following Taylor et al. (2016). Here, we retrieve independent estimates of the CO2 and H2O column abundances using observations taken at 1.61 μm (SWIR-1 weak CO2 band) and 2.06 μm (SWIR-2 strong CO2 band), while neglecting atmospheric scattering (see above). The CO2 and H2O column abundances retrieved in these two spectral regions differ significantly in the presence of cloud and scattering aerosols. Ratios of the retrieved CO2 (RCO2) and H2O (RH2O) column abundances are computed as follows:
where
Cirrus clouds and aerosols modify the optical path length in the two bands differently, producing column abundance ratios significantly different from unity (Taylor et al., 2016). There are two fundamental reasons why the ratio deviates from unity in the presence of scattering. First, for most terrestrial surfaces, albedos in the 1.6 μm band are most often higher than at 2.0 μm. This yields a variable fractional contribution of scattered light to the measured radiances. Second, the 1.6 and 2.06 μm band strengths are very different, resulting in different sensitivities to atmospheric scattering. If no scattering is assumed in the retrieval, a deviation from unity in the ratio thus indicates a substantial variation in the photon path length (PPL) distribution between the two bands, while in the absence of scattering, this ratio approaches unity.
The upper panel of Figure 4 illustrates ratios RCO2 and RH2O as a function of true COT values, showing that most cirrus-free pixels (with COT = 0) have ratio values close to 1, that is, RCO2 < 1.04 and RH2O < 1.06. Moreover, for cirrus-contaminated pixels, RCO2 and RH2O have a positive correlation with COT, whereas the correlation is stronger for RCO2. This suggests the ratios can be applied for the filtering of cirrus.
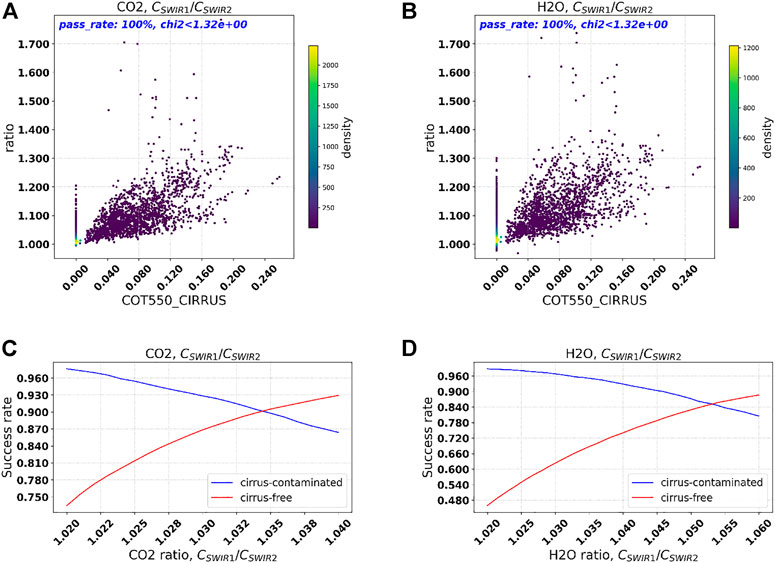
FIGURE 4. Non-scattering retrievals of CO2 ratio and H2O ratio of the column at SWIR-1 band to the column at SWIR-2 band. The upper panel shows the CO2 ratio (A) and H2O ratio (B) as a function of COT. The lower panel shows the success rates of filtering cirrus-contaminated pixels for different cases by different values of CO2 ratio (C) and H2O ratio (D).
To investigate the capability of RCO2 and RH2O for cirrus filtering, we analyze the fraction of ‘correct positives’ fcp, that is, the fraction of cirrus-contaminated pixels that were correctly identified as such, and the fraction of ‘correct negatives’ fcn, that is, the fraction of cirrus-free pixels that were correctly identified as such. The lower panels of Figure 4 show fcp (blue line) and fcn (red line) as a function of RCO2 and RH2O, respectively. Obviously, the goal is to have both fcp and fcn as large as possible. As expected, with larger RCO2 and RH2O, fewer pixels no matter cirrus-contaminated or cirrus-free will be identified as cirrus-contaminated by the filter. Therefore, fcp decreases with the value of the ratios. On the other hand, fcn increases with the larger value of the ratios, but more cirrus-free cases (e.g., with large aerosol load) are incorrectly identified as cirrus-contaminated. So, the optimal value for the ratios is a compromise between the two effects. By using a threshold of RCO2 =1.034, 90% of cirrus-free pixels are preserved and 90% of cirrus-contaminated pixels are filtered out. We consider this a good compromise. A filter based on RH2O is not able to achieve a 90% success rate, so we consider it inferior compared to the filter based on RCO2. Therefore, we apply RCO2 < 1.034 as a cirrus filter to obtain cirrus-free pixels for RemoTAP retrievals in its baseline setup. The cirrus filter will be applied after filtering for thick clouds. In our ensemble, 18.5% of the pixels remain after this first filter step. Then, of the pixels that are free of (thick) clouds, 80% remains after applying the cirrus filter (∼15% of the total).
After applying the cirrus filter, we perform the MAP-CO2I and CO2I-only retrievals for the remaining pixels using RemoTAP in its baseline setup (not fitting cirrus). We apply an a posteriori filter based on goodness-of-fit keeping pixels with χ2 < 1.5 for MAP-CO2I retrievals and χ2 < 1.2 for CO2I-only retrievals.
The upper panel in Figure 5 shows the performance of the MAP-CO2I retrievals. After applying the χ2 < 1.5 filter, about 85% of the processed pixels remain, and 95% of cirrus-contaminated pixels are filtered out. The root mean square error (RMSE) and bias for XCO2 are 0.6303 and 0.0741 ppm, respectively. These small errors are possible because the aerosol properties are accurately retrieved. The RMSE and bias of AOT at 765 nm are 0.0277 and 0.0032, respectively. Table 6 summarizes the retrieval accuracy of the most important aerosol properties. Overall, the listed aerosol properties are accurately retrieved from the MAP-CO2I combination and are mostly within the aerosol requirements formulated for climate research (Mishchenko et al., 2004; Hasekamp O. P. et al., 2019).
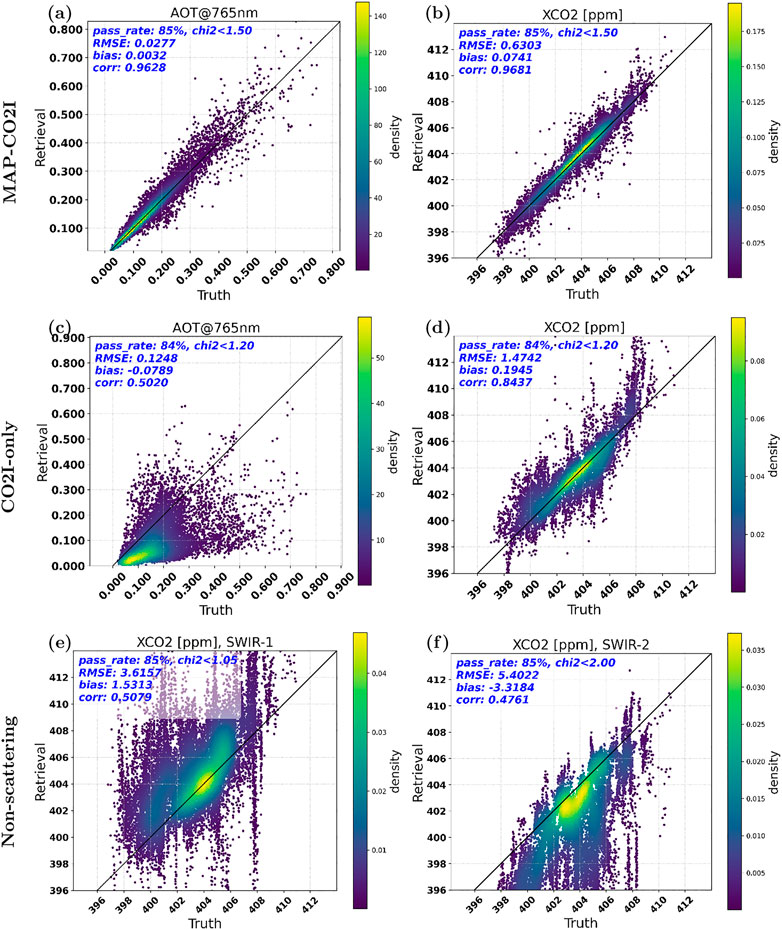
FIGURE 5. The top panel shows the MAP-CO2I retrievals of AOT at 765 nm (A) and XCO2 (B), and the middle panel the CO2I-only retrievals of AOT (C) and XCO2 (D) at non-scattering retrieval filtered cirrus-free pixels by not retrieving cirrus. The bottom panel shows the non-scattering retrievals of XCO2 at SWIR-1 (E) and SWIR-2 bands (F).
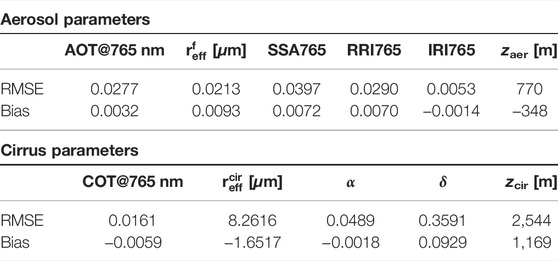
TABLE 6. Retrievals of aerosol parameters for MAP-CO2I baseline case, and retrievals of cirrus parameters at true cirrus-contaminated pixels with true COT
The results of the baseline CO2I-only retrieval are shown in the middle panel of Figure 5. Here, the XCO2 product has an RMSE of 1.4742 ppm and a bias of 0.1945 ppm. So, the accuracy is significantly degraded compared to the MAP-CO2I retrievals, where the RMSE on XCO2 is by a factor of 2.3 larger than MAP-CO2I retrievals. The larger errors are caused by a poor capability to retrieve the atmospheric aerosol, with an RMSE and bias on AOT at 765 nm of 0.12 and −0.08, respectively.
In order to illustrate the effect of light path modification by aerosol, we also show the non-scattering retrievals of XCO2 using measurements of SWIR-1 and SWIR-2 bands in Figures 5E and F, respectively. By applying the filters of χ2 < 1.05 for SWIR-1 and χ2 < 2.0 for the SWIR-2 band, the retrievals can achieve similar passing rates compared to the two cases of full-physics retrievals. Without the light path correction of fitting aerosol, the XCO2 retrievals at the SWIR-1 band have a large positive bias of 1.513 ppm and an RMSE of 3.6157 ppm, while the retrievals at the SWIR-2 band have a larger negative bias of −3.3184 ppm and an RMSE of 5.4022 ppm. By fitting aerosol in the CO2I-only retrieval case, the accuracy of XCO2 retrievals is improved by a factor of 2 and 4, compared to the non-scattering results for SWIR-1 and SWIR-2, respectively, in terms of RMSE, and the magnitudes of biases are reduced by a factor of
Figure 6 shows the dependence of XCO2 errors (ΔXCO2) as a function of SZA, AOT at 1,600 nm, COT at 1,600 nm, and the BRDF scaling factor at 2,000 nm for both retrieval methods (upper panels for MAP-CO2I retrievals and lower panels for CO2I-only retrievals). The fraction of retrievals with an error larger than 3 ppm (the plotting range) is denoted as fout. The MAP-CO2I retrievals show virtually no dependence of ΔXCO2 on SZA and AOT, and only a slight dependence on the surface albedo at 2,000 nm (somewhat larger error at low albedo than at large albedo). Regarding the dependence on surface albedo, it should be noted that aerosols have different effects on the light path for low and high albedo, respectively. For low albedo, aerosols cause a shortening of the light path because the light is reflected back to space at higher altitudes, whereas for high surface albedo, aerosols cause a longer light path because of multiple scattering of light between the surface and the aerosol layer. For the dependence on COT (for the few pixels that were missed by the cirrus filter), we see an underestimation of XCO2 for all COT values. The CO2I-only retrievals show much more pixels with an error larger than 3 ppm. Also, we see a clear dependence of ΔXCO2 on AOT and a much stronger dependence of surface albedo than for the MAP-CO2I retrievals. The dependence of ΔXCO2 on AOT and surface albedo may manifest itself in regional and seasonal dependent biases which hamper accurate quantification of CO2 emissions on a regional/city scale. For the dependence on COT, we also see an underestimation at large COT but more overestimation at smaller COT than for the MAP-CO2I case.
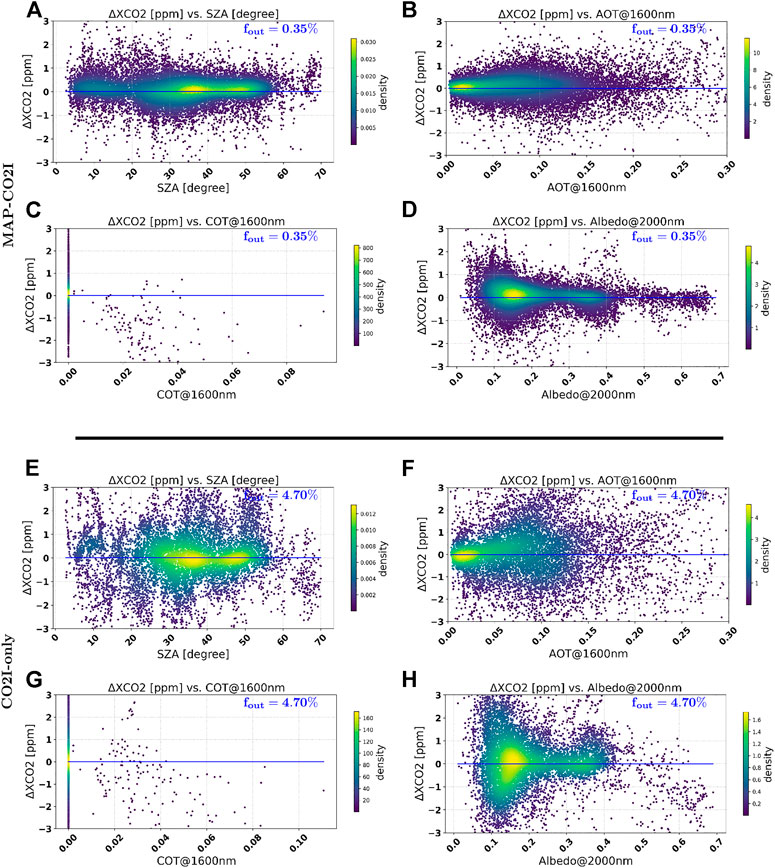
FIGURE 6. (A–D) show the error of MAP-CO2I retrieved XCO2 as a function of solar zenith angle (SZA), AOT at 1600 nm, COT at 1600 nm and BRDF scaling factor at 2000 nm, respectively. (E–F) show th error of CO2I-only retrieved XCO2 as a function of SZA, AOT, COT and BRDF scaling factor, respectively.
Figure 7A shows the RMSE, bias, and fraction of successful retrievals (of processed pixels and of all pixels without a priori filtering) for different RemoTAP setups: MAP-CO2I retrievals in baseline setup on cirrus-filtered (cf) data (“MAP_CO2I_cf”), CO2I-only in baseline setup on cirrus-filtered data (“CO2I_cf”), MAP-CO2I retrievals in baseline setup on all data where a cirrus filter is not applied (“MAP_CO2I_all”), MAP-CO2I retrievals where cirrus properties are fitted (Cir) on all data (“MAP_CO2I_Cir_all”), CO2I-only retrievals on all data (“CO2I_all”), and proxy retrievals on all data (“Proxy_all”). We found that the CO2I-only measurements do not contain sufficient information to include additional cirrus-fitting parameters, so these retrievals are not included in the analysis.
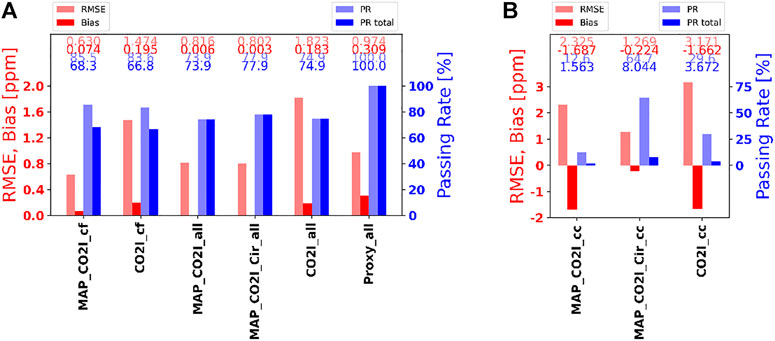
FIGURE 7. Summary of XCO2 retrievals for different cases. (A) shows from left to right the performance of not fitting cirrus in MAP-CO2I and CO2I-only cases on cirrus-filtered pixels, not fitting cirrus in MAP-CO2I case, fitting cirrus in MAP-CO2I case, and CO2I-only case and proxy retrieval on the whole ensemble. (B) shows not fitting cirrus in MAP-CO2I case, fitting cirrus in MAP-CO2I case, and CO2I-only case on true cirrus-contaminated pixels with cirrus mask = 1.
We have already discussed the results for the first two retrieval setups. It can be seen that for MAP-CO2I baseline retrieval, applying the a priori cirrus filter and the a posteriori χ2 filter leads to a fraction of successful retrievals of 85% of the processed pixels, which yields 68% of all pixels (MAP_CO2I_cf). For the MAP-CO2I baseline retrievals on all pixels (MAP_CO2I_all), we see that the fraction of successful retrievals increases to 74% of all pixels, and the RMSE increases to 0.82 ppm. It is important to note that here a lot of cirrus-contaminated pixels are filtered out by the a posteriori χ2 filter. If we include cirrus properties in the retrieval state vector (MAP_CO2I_Cir_all), we see the fraction of successful retrievals further increasing to 78% (of all pixels) with an RMSE of 0.80 ppm. So, compared to the baseline setup (MAP_CO2I_cf), the fraction of successful retrieval is increased by 10 percent points (of all pixels), but also the RMSE on XCO2 is increased by 0.12 ppm. The retrieval accuracy of the cirrus parameters is given in Table 6, where we can see that COT is well retrieved with an RMSE of 0.0161 and a bias of -0.0059. For CO2I-only retrievals, the RMSE increases to 1.82 ppm when applied to all pixels (CO2I_all), and the fraction of successful retrievals is 75% of all pixels.
Next, we consider only the true cirrus-contaminated pixels (cc) (Figure 7B). Here, the MAP-CO2I retrieval in its baseline setup (MAP_CO2I_cc) keeps 12.6% of the cirrus-contaminated pixels (1.6% of all pixels) after χ2 filtering. The RMSE and bias for these specific pixels are large: 2.3 and −1.7 ppm, respectively. When we fit cirrus (MAP_CO2I_Cir_cc), the RMSE and bias for these pixels reduce significantly to 1.27 and −0.22 ppm, respectively, where 65% of the cirrus-contaminated pixels pass the χ2 filter (8% of all pixels). For CO2I-only retrievals on cirrus-contaminated pixels (CO2I_cc), we see that the RMSE and bias are −3.17 and −1.66 ppm, respectively, and 30% of the cirrus-contaminated pixels remain after χ2 filtering (3.7% of all pixels).
We conclude that we can effectively filter out cirrus and get very accurate retrievals when we fit aerosol properties in the MAP-CO2I retrieval. We can also include cirrus properties in the retrieval which will lead to a better coverage but reduced accuracy. In the end, the decision whether to fit cirrus properties or not, that is, the choice between better coverage or better accuracy, should be made based on the evaluation of real retrievals.
For the proxy retrievals, cirrus has little effect on the performance, therefore, neither a cirrus filter nor a χ2 filter is applied. By using the truth for
Figure 8 shows the performance for XCH4 for MAP-CO2I and CO2I-only retrievals with the baseline setup, that is, not retrieving cirrus and applying both cirrus filter and χ2 filter. XCH4 retrievals by the MAP-CO2I method have an RMSE of 3.8395 ppb and a bias of 0.9222 ppb. The RMSE is a factor of 1.6 smaller than for CO2I-only retrievals. This, on a relative scale, agrees very well with the XCO2 performance estimates.
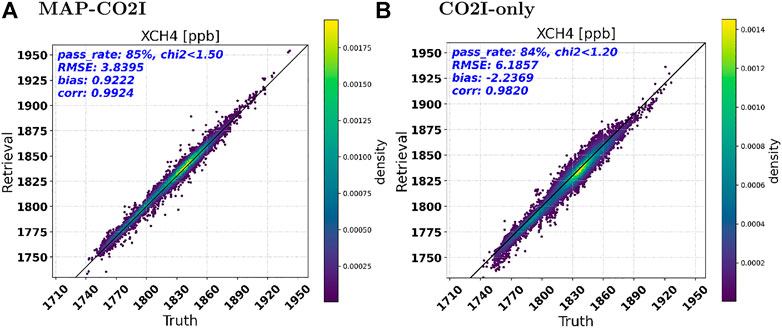
FIGURE 8. Retrieval of XCH4 at non-scattering retrieval filtered cirrus-free pixels by not retrieving cirrus with (A) MAP-CO2I retrievals and (B) CO2I-only retrievals.
The upper panel and lower panel of Figure 9 show, respectively, the RMSE and bias of the MAP-CO2I and CO2I-only retrievals as a function of the month for different regions: China (CN), India (IN), US, Europe (EU), Sahara, and Southern Africa. Also, the monthly mean of AOT is indicated in the upper panel of Figure 9. For China and India, CO2I-only retrievals have a large RMSE for XCO2 (up to 2.8 ppm), and the RMSE roughly follows the variation in AOT. The RMSE exceeds the CO2M precision requirement of 0.7 ppm by a factor of 4. For other regions, the RMSE is smaller and mostly in the range of 1.4–2.0 ppm but still well above the CO2M requirement. MAP-CO2I retrievals show RMSE smaller than the required 0.7 ppm for most regions and months (but not all), and there is no clear correlation with AOT.
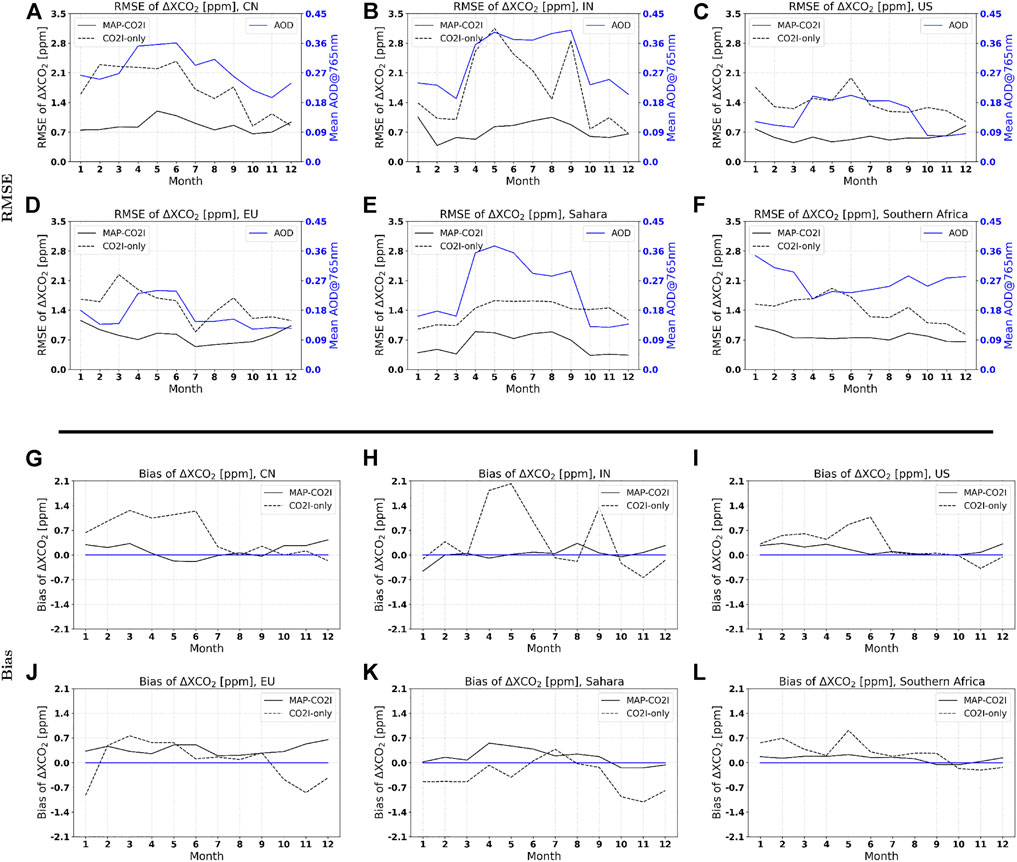
FIGURE 9. (A–F) show the RMSE of XCO2 retrievals distributed over months for China, India, the United States, the Sahara region and the Southern part of Africa, respectively. (G–L) show the bias of XCO2 retrievals distributed over months for China, India, the United States, the Sahara region and the Southern part of Africa, respectively.
For China and India, the bias of the CO2I-only retrieval exceeds the 0.5 ppm bias requirement for many months with a maximum bias of about 2 ppm in India for April/May. For the other regions, the bias for CO2I-only retrievals is significantly smaller but still exceeds the required 0.5 ppm in a number of cases. There is a large spatial variability in the bias distribution for CO2I-only retrievals, for instance, the bias over China is on average positive, but over the Sahara it is negative. This is mostly because the aerosol compositions and loadings are different in different regions, which leads to different optical properties. The difference in aerosol properties in combination with the difference in surface reflectance leads to inter-region differences. In contrast, the bias for the MAP-CO2I retrievals is below 0.5 ppm for virtually all cases. The regional analysis demonstrates even more convincingly than the global analysis the need for a MAP on the CO2M mission.
In this article, we have evaluated the performance of the SRON RemoTAP algorithm for ESA’s CO2M mission using synthetic measurements on scenes that represent realistic combinations of atmospheric composition (trace gases, aerosol, cloud, and cirrus), surface reflection, and viewing geometry. Input parameters of atmospheric and surface properties are obtained from different sources, representing a realistic and challenging test bed for the RemoTAP retrieval performance.
The stringent requirement on the XCO2 bias of 0.5 ppm can only be met when the atmospheric light path modification by aerosols is accounted for with sufficient accuracy, and only the MAP-CO2I combination can achieve this. After filtering for cirrus based on non-scattering CO2 retrievals in the 1.6 and 2.0 μm bands of CO2I, an RMSE of 0.63 ppm can be achieved on a global ensemble. RemoTAP is also capable of retrieving cirrus properties in addition to aerosol, which would increase the fraction of successful retrievals by about 10% (from 68 to 79%) but at the cost of a larger RMSE of 0.8 ppm. The RMSE for CO2I-only retrievals on a global scale is a factor of 2.3 larger than for MAP-CO2I. Looking at RMSE and bias for different regions and months, it is evident that CO2I-only retrievals can exceed the bias and precision requirements (0.5 and 0.7 ppm, respectively) by a factor of 4 in some cases, while MAP-CO2I retrievals are within the requirements under most conditions. In this study, the error estimates for XCO2 retrievals are made by taking account of errors related to the instrument, aerosol, and cirrus, although other error sources, for example, in temperature and pressure profiles, may increase the overall error somewhat. So, our results also confirm for more realistic and challenging conditions (complex synthetic measurements, high aerosol loads, and cirrus), the conclusion of Rusli et al. (2021) that a MAP is needed to meet the accuracy and precision requirements of the CO2M mission.
RemoTAP also has the capability to perform proxy retrievals for XCO2. By using the true XCH4 as a priori, the RMSE is 0.9 ppm, which is smaller than for CO2I-only full-physics retrievals but larger than for MAP-CO2I retrievals. An advantage of proxy retrieval is that it is almost insensitive to cirrus and so may lead to enhanced data coverage. However, it is important to note that the XCO2 proxy error estimates of this study should be considered an overly optimistic estimate because they do not include errors caused by an error in the a priori XCH4, an error term that may be substantial.
The RMSE and bias for XCH4 retrievals for the baseline MAP-CO2I case are 3.8395 and 0.9222 ppb, for the CO2I-only case are 6.1857 and −2.2369 ppb, and for the proxy retrieval case are 4.4114 and −1.3983 ppb, respectively. The retrievals of XCH4 by different methods are on a relative scale in consistence with the XCO2 performance estimates. MAP-CO2I retrievals have the best performance, and the XCH4 proxy product with true XCO2 as a priori is better than CO2I-only retrievals. Also, cirrus has a larger impact on full-physics retrievals of XCH4 than proxy retrievals.
The aerosol model used to create the synthetic measurements (7 size modes, each with its own composition and altitude distribution) is much more complex than the aerosol model used in the retrieval algorithm, and therefore the synthetic retrievals in this article represent a challenging test for the RemoTAP algorithm. On the other hand, the spatial resolution of the input data is coarser than the CO2M pixel size, and therefore the actual variability of aerosol properties may be larger than in our ensemble. Taking this into account, the actual benefit of the MAP-CO2I combination may be larger than that for the synthetic measurement ensemble used here.
The raw data supporting the conclusion of this article will be made available by the authors, without undue reservation.
SL performed the research which was designed by OH, JL, and SL. GF and OH developed the SRON-MAP aerosol retrieval code which was extended to include spectrometer trace gas retrieval by SL, LW, and SR. BvD provided the look-up table to calculate cirrus optical properties. SL wrote the original draft with input from OH. All authors contributed to the writing with comments and suggestions.
This work is funded by EUMSETSAT under the project of GHG Product Processing and Continuous Cal/Val Requirement Definition using RemoTec (Project no. SR6405).
The authors declare that the research was conducted in the absence of any commercial or financial relationships that could be construed as a potential conflict of interest.
All claims expressed in this article are solely those of the authors and do not necessarily represent those of their affiliated organizations, or those of the publisher, the editors, and the reviewers. Any product that may be evaluated in this article, or claim that may be made by its manufacturer, is not guaranteed or endorsed by the publisher.
We would like to thank CAMS for making and maintaining the XCO2 and XCH4 data. We also thank Thanos Tsikerdekis for providing aerosol data from ECHAM. We thank the Netherlands Supercomputing Centre (SURFsara) for providing us with the computing facility, the Spider cluster. We thank the editor and reviewers.
Bucholtz, A. (1995). Rayleigh-scattering Calculations for the Terrestrial Atmosphere. Appl. Opt. 34, 2765–2773. doi:10.1364/ao.34.002765
Buchwitz, M., Reuter, M., Schneising, O., Hewson, W., Detmers, R. G., Boesch, H., et al. (2017). Global Satellite Observations of Column-Averaged Carbon Dioxide and Methane: The Ghg-Cci Xco2 and Xch4 Crdp3 Data Set. Remote Sens. Environ. 203, 276–295. doi:10.1016/j.rse.2016.12.027
Butz, A., Guerlet, S., Hasekamp, O., Schepers, D., Galli, A., Aben, I., et al. (2011). Toward Accurate Co2 and Ch4 Observations from Gosat. Geophys. Res. Lett. 38. doi:10.1029/2011gl047888
Butz, A., Hasekamp, O., Frankenberg, C., Vidot, J., and Aben, I. (2010). Ch4 Retrievals from Space-Based Solar Backscatter Measurements: Performance Evaluation against Simulated Aerosol and Cirrus Loaded Scenes. J. Geophys. Res. Atmos. 115. doi:10.1029/2010jd014514
Butz, A., Hasekamp, O. P., Frankenberg, C., and Aben, I. (2009). Retrievals of Atmospheric CO2 from Simulated Space-Borne Measurements of Backscattered Near-Infrared Sunlight: Accounting for Aerosol Effects. Appl. Opt. 48, 3322–3336. doi:10.1364/AO.48.003322
D’Almeida, G. A., Koepke, P., and Shettle, E. P. (1991). Atmospheric Aerosols: Global Climatology and Radiative Characteristics. Hampton: A Deepak Pub.
Dubovik, O., Sinyuk, A., Lapyonok, T., Holben, B. N., Mishchenko, M., Yang, P., et al. (2006). Application of Spheroid Models to Account for Aerosol Particle Nonsphericity in Remote Sensing of Desert Dust. J. Geophys. Res. 111, D11208+. doi:10.1029/2005jd006619
Frankenberg, C., Hasekamp, O., O’Dell, C., Sanghavi, S., Butz, A., and Worden, J. (2012). Aerosol Information Content Analysis of Multi-Angle High Spectral Resolution Measurements and its Benefit for High Accuracy Greenhouse Gas Retrievals. Atmos. Meas. Tech. 5, 1809–1821.
Frankenberg, C., Meirink, J., Bergamaschi, P., Goede, A., Heimann, M., Körner, S., et al. (2006). Satellite Chartography of Atmospheric Methane from Sciamachy on Board Envisat: Analysis of the Years 2003 and 2004. J. Geophys. Res. Atmos. 111. doi:10.1029/2005jd006235
Fu, G., and Hasekamp, O. (2018). Retrieval of Aerosol Microphysical and Optical Properties over Land Using a Multimode Approach. Atmos. Meas. Tech. 11, 6627–6650. doi:10.5194/amt-11-6627-2018
Fu, G., Hasekamp, O., Rietjens, J., Smit, M., Di Noia, A., Cairns, B., et al. (2020). Aerosol Retrievals from Different Polarimeters during the Acepol Campaign Using a Common Retrieval Algorithm. Atmos. Meas. Tech. 13, 553–573. doi:10.5194/amt-13-553-2020
Guerlet, S., Butz, A., Schepers, D., Basu, S., Hasekamp, O. P., Kuze, A., et al. (2013). Impact of Aerosol and Thin Cirrus on Retrieving and Validating XCO2 from Gosat Shortwave Infrared Measurements. J. Geophys. Res. Atmos. 118, 4887–4905. doi:10.1002/jgrd.50332
Hansen, J. E., and Travis, L. D. (1974). Light Scattering in Planetary Atmospheres. Space Sci. Rev. 16, 527–610. doi:10.1007/BF00168069
Hasekamp, O. P., Gryspeerdt, E., and Quaas, J. (2019b). Analysis of Polarimetric Satellite Measurements Suggests Stronger Cooling Due to Aerosol-Cloud Interactions. Nat. Commun. 10, 5405–5407. doi:10.1038/s41467-019-13372-2
Hasekamp, O. P., and Butz, A. (2008). Efficient Calculation of Intensity and Polarization Spectra in Vertically Inhomogeneous Scattering and Absorbing Atmospheres. J. Geophys. Res. Atmos. 113. doi:10.1029/2008jd010379
Hasekamp, O. P., Fu, G., Rusli, S. P., Wu, L., Di Noia, A., Brugh, J. a. d., et al. (2019a). Aerosol Measurements by Spexone on the NASA PACE Mission: Expected Retrieval Capabilities. J. Quantitative Spectrosc. Radiat. Transf. 227, 170–184. doi:10.1016/j.jqsrt.2019.02.006
Hasekamp, O. P., Litvinov, P., and Butz, A. (2011). Aerosol Properties over the Ocean from Parasol Multiangle Photopolarimetric Measurements. J. Geophys. Res. Atmos. 116. doi:10.1029/2010jd015469
Hu, H., Landgraf, J., Detmers, R., Borsdorff, T., Aan de Brugh, J., Aben, I., et al. (2018). Toward Global Mapping of Methane with Tropomi: First Results and Intersatellite Comparison to Gosat. Geophys. Res. Lett. 45, 3682–3689. doi:10.1002/2018gl077259
Janssens-Maenhout, G., Pinty, B., Dowell, M., Zunker, H., Andersson, E., Balsamo, G., et al. (2020). Toward an Operational Anthropogenic Co2 Emissions Monitoring and Verification Support Capacity. Bull. Am. Meteorological Soc. 101, E1439–E1451. doi:10.1175/bams-d-19-0017.1
Krings, T., Gerilowski, K., Buchwitz, M., Hartmann, J., Sachs, T., Erzinger, J., et al. (2013). Quantification of Methane Emission Rates from Coal Mine Ventilation Shafts Using Airborne Remote Sensing Data. Atmos. Meas. Tech. 6, 151–166. doi:10.5194/amt-6-151-2013
Krings, T., Gerilowski, K., Buchwitz, M., Reuter, M., Tretner, A., Erzinger, J., et al. (2011). MAMAP - a New Spectrometer System for Column-Averaged Methane and Carbon Dioxide Observations from Aircraft: Retrieval Algorithm and First Inversions for Point Source Emission Rates. Atmos. Meas. Tech. 4, 1735–1758. doi:10.5194/amt-4-1735-2011
Kuhlmann, G., Chan, K. L., Donner, S., Zhu, Y., Schwaerzel, M., Dörner, S., et al. (2021). Mapping the Spatial Distribution of No2 with In Situ and Remote Sensing Instruments during the Munich No2 Imaging Campaign. Atmos. Meas. Tech. Discuss. 2021, 1–30. doi:10.5194/amt-2021-303
Lacagnina, C., Hasekamp, O. P., and Torres, O. (2017). Direct Radiative Effect of Aerosols Based on PARASOL and OMI Satellite Observations. J. Geophys. Res. Atmos. 122, 2366–2388. doi:10.1002/2016jd025706
Landgraf, J., Brugh, J., Wu, L., Hasekamp, O., Rusli, S., van Heck, H., et al. (2020). Study on Spectral Sizing for CO2 Observations: Final Report. Utrecht, The Netherlands: Report SRON-CSS-TN-2020-002, SRON Netherlands Insitute for Space Research.
Litvinov, P., Hasekamp, O., and Cairns, B. (2011). Models for Surface Reflection of Radiance and Polarized Radiance: Comparison with Airborne Multi-Angle Photopolarimetric Measurements and Implications for Modeling Top-Of-Atmosphere Measurements. Remote Sens. Environ. 115, 781–792. doi:10.1016/j.rse.2010.11.005
Lorente, A., Borsdorff, T., Butz, A., Hasekamp, O., aan de Brugh, J., Schneider, A., et al. (2021). Methane Retrieved from Tropomi: Improvement of the Data Product and Validation of the First 2 Years of Measurements. Atmos. Meas. Tech. 14, 665–684. doi:10.5194/amt-14-665-2021
Macke, A., Mueller, J., and Raschke, E. (1996). Single Scattering Properties of Atmospheric Ice Crystals. J. Atmos. Sci. 53, 2813–2825. doi:10.1175/1520-0469(1996)053<2813:sspoai>2.0.co;2
Maignan, F., Bréon, F.-M., Fédèle, E., and Bouvier, M. (2009). Polarized Reflectances of Natural Surfaces: Spaceborne Measurements and Analytical Modeling. Remote Sens. Environ. 113, 2642–2650. doi:10.1016/j.rse.2009.07.022
Mao, J., and Kawa, S. R. (2004). Sensitivity Studies for Space-Based Measurement of Atmospheric Total Column Carbon Dioxide by Reflected Sunlight. Appl. Opt. 43, 914–927. doi:10.1364/AO.43.000914
Meijer, Y., Boesch, H., Bombelli, A., Buchwitzh, M., Ciais, P., Crisp, D., et al. (2020). Copernicus CO2 Monitoring Mission Requirements Document. Techreport 3.0, European Space Agency.
Mishchenko, M. I., Cairns, B., Hansen, J. E., Travis, L. D., Burg, R., Kaufman, Y. J., et al. (2004). Monitoring of Aerosol Forcing of Climate from Space: Analysis of Measurement Requirements. J. Quantitative Spectrosc. Radiat. Transf. 88, 149–161. doi:10.1016/j.jqsrt.2004.03.030
Olivier, J. G., Schure, K., and Peters, J. (2017). Trends in Global Co2 and Total Greenhouse Gas Emissions. Netherlands: PBL Netherlands Environmental Assessment Agency, 5.
Rodgers, C. (2000). Inverse Methods for Atmospheric Sounding: Theory and Practice. New Jersey: World Sc.,River Edge.
Rusli, S. P., Hasekamp, O., aan de Brugh, J., Fu, G., Meijer, Y., and Landgraf, J. (2021). Anthropogenic Co2 Monitoring Satellite Mission: the Need for Multi-Angle Polarimetric Observations. Atmos. Meas. Tech. 14, 1167–1190. doi:10.5194/amt-14-1167-2021
[Dataset] Schaaf, C., and Wang, Z. (2015). Mcd43a4 Modis/terra+ Aqua Brdf/albedo Nadir Brdf Adjusted Ref Daily L3 Global-500m V006. Available at: https://ladsweb.modaps.eosdis.nasa.gov/missions-and-measurements/products/MCD43A4.
Schepers, D., aan de Brugh, J. M. J., Hahne, P., Butz, A., Hasekamp, O. P., and Landgraf, J. (2014). LINTRAN v2.0: A Linearised Vector Radiative Transfer Model for Efficient Simulation of Satellite-Born Nadir-Viewing Reflection Measurements of Cloudy Atmospheres. J. Quantitative Spectrosc. Radiat. Transf. 149, 347–359. doi:10.1016/j.jqsrt.2014.08.019
Schepers, D., Guerlet, S., Butz, A., Landgraf, J., Frankenberg, C., Hasekamp, O., et al. (2012). Methane Retrievals from Greenhouse Gases Observing Satellite (Gosat) Shortwave Infrared Measurements: Performance Comparison of Proxy and Physics Retrieval Algorithms. J. Geophys. Res. Atmos. 117. doi:10.1029/2012jd017549
Shettle, E. P., and Fenn, R. W. (1979). Models for the Aerosols of the Lower Atmosphere and the Effects of Humidity Variations on Their Optical Properties. United State: Environmental Research Paper Air Force Geophysics Lab., Hanscom AFB, MA. Optical Physics Div.
Sierk, B., Fernandez, V., Bézy, J.-L., Meijer, Y., Durand, Y., Courrèges-Lacoste, G. B., et al. (2021). “The Copernicus Co2m Mission for Monitoring Anthropogenic Carbon Dioxide Emissions from Space,” in International Conference on Space Optics—ICSO 2020 (International Society for Optics and Photonics), 11852. doi:10.1117/12.2599613
Stier, P., Feichter, J., Kinne, S., Kloster, S., Vignati, E., Wilson, J., et al. (2005). The Aerosol-Climate Model Echam5-Ham. Atmos. Chem. Phys. 5, 1125–1156. doi:10.5194/acp-5-1125-2005
Taylor, T. E., O'Dell, C. W., Frankenberg, C., Partain, P. T., Cronk, H. Q., Savtchenko, A., et al. (2016). Orbiting Carbon Observatory-2 (OCO-2) Cloud Screening Algorithms: Validation against Collocated Modis and Caliop Data. Atmos. Meas. Tech. 9, 973–989. doi:10.5194/amt-9-973-2016
Tikhonov, A. (1963). On the Solution of Incorrectly Stated Problems and a Method of Regularization. Dokl. Akad. Nauk. SSSR 151, 501–504.
Tsikerdekis, A., Schutgens, N. A. J., and Hasekamp, O. P. (2021). Assimilating Aerosol Optical Properties Related to Size and Absorption from Polder/parasol with an Ensemble Data Assimilation System. Atmos. Chem. Phys. 21, 2637–2674. doi:10.5194/acp-21-2637-2021
van Diedenhoven, B., Ackerman, A. S., Cairns, B., and Fridlind, A. M. (2014). A Flexible Parameterization for Shortwave Optical Properties of Ice Crystals*. J. Atmos. Sci. 71, 1763–1782. doi:10.1175/JAS-D-13-0205.1
van Diedenhoven, B., Ackerman, A. S., Fridlind, A. M., Cairns, B., and Riedi, J. (2020). Global Statistics of Ice Microphysical and Optical Properties at Tops of Optically Thick Ice Clouds. J. Geophys. Res. Atmos. 125, e2019JD031811. doi:10.1029/2019jd031811
van Diedenhoven, B., Cairns, B., Geogdzhayev, I. V., Fridlind, A. M., Ackerman, A. S., Yang, P., et al. (2012). Remote Sensing of Ice Crystal Asymmetry Parameter Using Multi-Directional Polarization Measurements - Part 1: Methodology and Evaluation with Simulated Measurements. Atmos. Meas. Tech. 5, 2361–2374. doi:10.5194/amt-5-2361-2012
Wanner, W., Li, X., and Strahler, A. H. (1995). On the Derivation of Kernels for Kernel-Driven Models of Bidirectional Reflectance. J. Geophys. Res. 100, 21077–21089. doi:10.1029/95JD02371
Winker, D. M., Hunt, W. H., and McGill, M. J. (2007). Initial Performance Assessment of Caliop. Geophys. Res. Lett. 34. doi:10.1029/2007GL030135
Wu, L., aan de Brugh, J., Meijer, Y., Sierk, B., Hasekamp, O., Butz, A., et al. (2020). XCO2 Observations Using Satellite Measurements with Moderate Spectral Resolution: Investigation Using Gosat and OCO-2 Measurements. Atmos. Meas. Tech. 13, 713–729. doi:10.5194/amt-13-713-2020
Wu, L., Hasekamp, O., Hu, H., aan de Brugh, J., Landgraf, J., Butz, A., et al. (2019). Full-physics Carbon Dioxide Retrievals from the Orbiting Carbon Observatory-2 (OCO-2) Satellite by Only Using the 2.06 Μm Band. Atmos. Meas. Tech. 12, 6049–6058. doi:10.5194/amt-12-6049-2019
Keywords: XCO2 retrieval, remote sensing, multi-angle polarimeter, spectrometer, greenhouse gas
Citation: Lu S, Landgraf J, Fu G, van Diedenhoven B, Wu L, Rusli SP and Hasekamp OP (2022) Simultaneous Retrieval of Trace Gases, Aerosols, and Cirrus Using RemoTAP—The Global Orbit Ensemble Study for the CO2M Mission. Front. Remote Sens. 3:914378. doi: 10.3389/frsen.2022.914378
Received: 06 April 2022; Accepted: 15 June 2022;
Published: 18 July 2022.
Edited by:
Yongxiang Hu, National Aeronautics and Space Administration, United StatesReviewed by:
Bo-Cai Gao, United States Naval Research Laboratory, United StatesCopyright © 2022 Lu, Landgraf, Fu, van Diedenhoven, Wu, Rusli and Hasekamp. This is an open-access article distributed under the terms of the Creative Commons Attribution License (CC BY). The use, distribution or reproduction in other forums is permitted, provided the original author(s) and the copyright owner(s) are credited and that the original publication in this journal is cited, in accordance with accepted academic practice. No use, distribution or reproduction is permitted which does not comply with these terms.
*Correspondence: Sha Lu, cy5sdUBzcm9uLm5s; Otto P. Hasekamp, by5oYXNla2FtcEBzcm9uLm5s
Disclaimer: All claims expressed in this article are solely those of the authors and do not necessarily represent those of their affiliated organizations, or those of the publisher, the editors and the reviewers. Any product that may be evaluated in this article or claim that may be made by its manufacturer is not guaranteed or endorsed by the publisher.
Research integrity at Frontiers
Learn more about the work of our research integrity team to safeguard the quality of each article we publish.