 Seiji Kato1*
 Tyler J. Thorsen1
 Seung-Hee Ham2
 Norman G. Loeb1
 Richard A. Ferrare1
 David M. Winker1
 Howard Barker3
 Graeme L. Stephens4,5
 Sebastian Schmidt6
 Kerry G. Meyer7
 Brian Cairns8
- 1NASA Langley Research Center, Science Directorate, Hampton, VA, United States
- 2Science Systems and Applications Inc., Hampton, VA, United States
- 3Environment and Climate Change Canada, Toronto, ON, Canada
- 4Jet Propulsion Laboratory, California Institute of Technology, Pasadena, CA, United States
- 5Department of Physics, University of Oxford, Oxford, United Kingdom
- 6Laboratory for Atmospheric and Space Physics, University of Colorado, Boulder, CO, United States
- 7NASA Goddard Space Flight Center, Greenbelt, MD, United States
- 8NASA Goddard Institute for Space Studies, New York, NY, United States
Aerosol optical properties depend on wavelength as well as both mixing ratios and size distributions of components that make up a particular type of aerosol. This study examines impacts on direct aerosol radiative effect (DARE) for desert, clean maritime, and polluted maritime aerosol types over the ocean when their optical properties are determined by various combinations of observations made by active (i.e., lidar) and passive (e.g., shortwave spectrometer) satellite sensors. Spectral optical properties are perturbed by altering mixing ratios of components that define aerosol types with assumptions that components within an aerosol type are fixed and only one aerosol type is present in the atmosphere. When 532 nm depolarization ratio from the lidar is used to identify desert aerosol, the uncertainty in the mean DARE due to spectral optical property variabilities is 10%. When the 532 nm depolarization and lidar ratios are used to identify clean and polluted maritime aerosols, uncertainties in mean DARE are, respectively, 4 and 18%. When scattering optical thicknesses are also known to within ± 3% at four passive imager wavelengths (340 nm, 546 nm, 966 nm, and 1,657 nm), uncertainty in the polluted maritime DARE decreases to 8%. Uncertainties in the instantaneous top-of-atmosphere (TOA) reflected irradiances derived from observed broadband radiances and angular distribution models are also estimated. When TOA irradiances are derived solely from the nadir view, their uncertainties can be reduced if aerosol type can be identified and aerosol type dependence is considered in the radiance to irradiance conversion. This is especially so for aerosols with a large fraction of nonspherical particles, such as desert aerosols.
1 Introduction
Particles suspended in the atmosphere scatter and absorb solar radiation. Some particles are anthropogenic in origin and others are produced naturally, although the separation is not always distinct. The influence of natural and anthropogenic particles on the amount of energy input to Earth is the aerosol direct radiative effect. Because they alter Earth’s radiation budget, it is important to understand how much of aerosol change since the beginning of the Industrial Age can be attributed to changes in the aerosol radiative effect and how predicted changes in aerosol emissions will alter the Earth’s radiation budget in the future (Bellouin et al., 2020). Despite the importance of quantifying the aerosol radiative effect for future climate predictions, estimates have a larger uncertainty. Global annual mean direct aerosol radiative effect estimates range from −3.1 to −0.61 Wm-2 for all-sky and −6.5 to −2.3 Wm-2 for clear-sky conditions (Yu et al., 2006). A similar range of clear-sky direct aerosol radiative effects of −5.5 to −3.8 Wm-2 (±1σ) is also reported in a recent study by Thorsen et al. (2020).
Satellites provide observations of aerosols and radiation on a global scale that can be used to derive an estimate of the aerosol direct radiative effect. Basically, there are two ways to estimate the direct aerosol radiative effect at the top of the atmosphere (TOA) using satellite observations. The first approach is to use a combination of broadband irradiances derived from broadband radiance observations combined with imager (e.g., MODIS) derived aerosol optical thicknesses or modeled irradiances under a pristine condition. This approach was used in, for example, Loeb and Kato (2002), Loeb and Manalo-Smith (2008), and Zhang et al. (2005). Recently, Loeb et al. (2021) used TOA and surface irradiance observations to derive the trend of direct aerosol radiative effects.
The second approach is by computing broadband irradiances with observed aerosol optical thickness and other inferred optical properties (e.g., Boucher and Tanré 2000; Chou et al., 2002; Remer and Kaufman 2006; Bellouin et al., 2013; Su et al., 2013). While aerosol optical thicknesses in practice are derived at discrete wavelengths, this approach requires aerosol optical properties for all computational wavelengths. Generally, aerosol models are used to provide optical properties for all wavelengths. Separate aerosol models are defined for different aerosol types. For example, cloud-aerosol lidar and infrared pathfinder satellite observation (CALIPSO) provides seven aerosol subtypes including clean marine, dust, dusty marine, polluted continental, clean continental, polluted dust, and smoke (Omar et al., 2009; Kim et al., 2018). In addition, an aerosol type is composed of multiple components such as water soluble, insoluble, sea salt, or mineral. For example, the Optical Properties of Aerosols and Clouds (OPAC, Hess et al., 1998) clean marine aerosol type is composed of water soluble, accumulation, and coarse modes of sea salt component. OPAC provides the optical properties of ten aerosol components. Other components include insoluble, soot, three modes of mineral, mineral-transported, and sulfate droplets (Hess et al., 1998).
There are several sources of uncertainties in estimating the direct aerosol radiative effect with observations. For the first approach, the uncertainty is caused by clear-sky identification (e.g., Loeb and Manalo-Smith2005) and the uncertainty in retrieved aerosol optical thickness. In addition, the angular distribution of reflected radiance depends on aerosol type and aerosol optical thickness. The effect of aerosol optical thickness on the angular distribution of radiances is treated in angular distribution models (Su et al., 2015), but the uncertainty in the irradiance due to aerosol type dependent phase function has not been investigated to date. The uncertainty in retrieved aerosol optical thickness affects the estimate of the direct aerosol radiative effect from the second approach more than it affects the first approach. The uncertainty in imager-derived optical thickness is discussed by Kahn et al. (2005, 2009) and Remer et al. (2005). Remer and Kaufman (2006) discuss a known bias in the MODIS-derived aerosol optical thickness (e.g., dust aerosol optical thickness correlated with viewing geometries, cloud contamination, and surface reflectance). In addition, ignoring 3D radiation effects in aerosol optical thickness retrievals introduces additional uncertainty in passive sensor derived aerosol optical thickness over regions where convective clouds are frequently present (e.g., Yang and Di Girolamo 2008; Várnai and Marshak 2012). Furthermore, uncertainties are also associated with single scattering albedo and asymmetry parameters (e.g. Hess et al., 1998; Sinyuk et al., 2003; Bond and Bergstrom 2006; Stier et al., 2007). These uncertainties discussed in earlier studies are caused by measurements and retrievals specific to the wavelengths used for observations. The uncertainty in the direct aerosol radiative effect due to the uncertainty in optical properties at observed wavelengths has been discussed in earlier studies (Remer and Kaufman, 2006; Loeb and Su, 2010; Thorsen et al., 2020).
Another source of uncertainty that has not been investigated very much is the impact of variability in the aerosol optical properties outside the retrieval wavelengths, which is the focus of this study. Even though aerosols are separated by type, the mixing ratio of components and their size distributions vary within each aerosol type, which can cause spectral aerosol properties to vary. When the mixing ratio and size distribution are fixed for an aerosol model, the variability of the mixing ratio and size distribution present in real atmospheres leads to the uncertainty in the direct aerosol radiative effect. The effect of the uncertainty due to spectral variability on the direct aerosol radiative effect was investigated by Thorsen et al. (2020). They show that using observed radiances at 4 wavelengths, 340, 550, 1,020, and 1,640 nm, significantly reduces the uncertainty in the computed broadband direct aerosol radiative effect. The method used by Thorsen et al. (2020) is to interpolate and extrapolate the broadband aerosol properties from those derived from observed discrete wavelengths. However, when a lidar is used to derive aerosol optical properties, optical properties at only one or two wavelengths are derived. Even when aerosol optical thickness at more than 2 wavelengths is derived from collocated imager observations, imagers can only provide column integrated values. When an aerosol type is used to infer broadband aerosol properties, primarily using lidar observations to derive the vertical profile, the spectral variability within an aerosol type contributes to the uncertainty in aerosol’s direct radiative effect. In this study, we extend the analysis of Thorsen et al. (2020) and quantify the uncertainty in the direct aerosol radiative effect associated with spectral variability of aerosol properties within an aerosol type identified by a lidar. We also estimate the effect of retrieved optical thickness at multiple wavelengths by a passive sensor to understand how the uncertainty changes with synergistic observations. Quantifying the uncertainty in direct aerosol radiative effect due to the spectral variability of aerosol optical properties within a given aerosol type is needed to understand the error budget in the direct aerosol radiative effect derived from active and passive sensor observations. Understanding the error budget for different combinations of instruments can be used to plan a synergistic approach to estimating the direct aerosol radiative effect.
We discuss the uncertainty due to spectral variability that arises in the second approach in Sections 2 and 3. Section 2 describes the method to quantify the uncertainty and the results are presented in Section 3. Section 3.1 discusses desert aerosol results and Section 3.2 discusses maritime aerosol results. To address the uncertainty created by the first approach described above, Section 4 demonstrates the importance of considering aerosol type dependence in the radiance to irradiance conversion, which is used in estimating the direct aerosol radiative effect. Section 5 summarizes the results.
2 Methods
To understand how complementary observations reduce the uncertainty in the direct aerosol radiative effect, our method is designed under the assumption that collocated high spectral resolution lidar (HSRL) and imager/spectrometer observations are available. HSRL observations are used to identify an aerosol type. We then examine the uncertainty due to spectral variability for the aerosol type. Imager/spectrometer radiance observations further constrain spectral variability. We consider radiances observed at multiple wavelengths from one viewing angle in this study. We use aerosol types used in OPAC and by Burton et al. (2013), which are similar to those used in CALIPSO (Omar et al., 2009; Kim et al., 2018). We use aerosol components within an aerosol type based on OPAC aerosol components. While more aerosol types and more components within an aerosol type can be present in real atmospheres, we do not consider the uncertainty due to the uncertainty associated with OPAC aerosol type and component uncertainty. Spectrally dependent optical properties are computed with the modeled optical properties of an ensemble of aerosol particles (MOPSMAP, Gasteiger and Wiegner 2018). We assume that particles are spherical except for dust. Dust particles are assumed to be spheroid and oriented randomly (Gasteiger and Wiegner 2018). We also do not consider the uncertainty associated with the refractive indices used in OPAC.
Two to four aerosol components are present within an OPAC aerosol type. For example, the desert aerosol is composed of water soluble particles, nucleation, accumulation, and coarse modes of mineral particles. Water soluble particles originate from gas to particle conversion. They also include organic substances (Hess et al., 1998). All components are assumed to be externally mixed and the spectral optical properties of the mixture are computed with expressions given in Appendix A (found under the Supplementary Material). We multiply the mixing ratio of each OPAC component by a scaling factor ranging from 0.001 to 1,000 by considering all combinations of scaling factors, 0.001, 0.003, 0.01, 0.03, 0.1, 0.3, 1.0, 3.0, 5.0, 10, 30, 100, 300, and 1000 among components. Because the range of the scaling factors is arbitrary, the resulting combinations include unrealistic mixing ratios of components. We, therefore, use the range of observed 532 nm depolarization ratio and 532 nm lidar ratio observed by an HSRL to screen unrealistic mixing ratio combinations. Specifically, we rely on airborne HSRL observations reported by Burton et al. (2013). This process generates a set of spectral extinction coefficients, single scattering albedos, and asymmetry parameters by varying component mixing ratios within an aerosol type identified by an HSRL. An implicit assumption here is that the number concentration of each component varies without changing the shape of the size distribution of a component or the shape of individual particles. However, the overall size distribution (of minerals and sea salt) can change by changing the mixing ratio of nucleation, accumulation, or coarse modes. In addition to the depolarization and lidar ratios, we also use scattering optical thickness derived at multiple wavelengths to subset albedos to understand the effect of retrieved aerosol optical thickness at multiple discrete wavelengths retrieved from discrete narrowband radiances observed by a passive sensor. Generally, extinction optical thickness is retrieved from the radiance observed by a passive sensor. However, the retrieval involves inferring scattering optical thickness with an assumption of single scattering albedo because the observed radiance is scattered radiance. Therefore, we use scattering optical thickness to exclude the effect of the uncertainty associated with single scattering albedo.
To isolate the effects of aerosol, we compute albedo and transmission of the aerosol layer using a two-stream model (Liou, 1974) with a delta assumption (Joseph et al., 1976) for the cosine of solar zenith angle
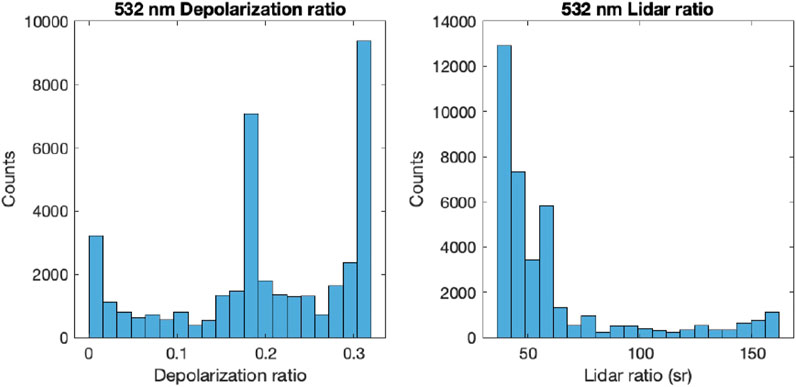
FIGURE 1. Histogram of desert aerosol 532 nm deporalization ratio on the left and 532 nm lidar ratio on the right for all combinations.
3 Results
In this section, we describe the results of desert, maritime clean and maritime polluted aerosols. We highly simplify how aerosols are present in the atmosphere by limiting aerosol types and focusing only over the ocean. Desert aerosol contains minerals that are composed of nonspherical particles. Maritime polluted aerosol includes a highly absorbing component. Clean maritime aerosol contains only spherical, weakly absorbing particles. We also assume that only one aerosol type is present in the atmosphere. These cases provide the variability of the aerosol radiative effect due to the variability of the mixing ratio and size distribution within an aerosol type on direct aerosol radiative effect estimates when an HSRL or combination of an HSRL and a passive sensor (an imager or a spectrometer) is used for the estimates. This process simulates the process of estimating the direct aerosol radiative effect, which is computed with retrieved aerosol properties combined with aerosol optical models.
3.1 Desert Aerosols
The OPAC desert aerosol type is a mixture of water soluble (50% relative humidity is assumed here) and mineral particles of nucleation, accumulation, and coarse modes with a mass mixing ratio of, respectively, 0.018, 0.033, 0.747, and 0.202 (Hess et al., 1998). As mentioned earlier, we alter component mixing ratios within an aerosol type by a scaling factor ranging from 0.001 to 1,000. The overall size distribution of mineral particles is modified by scaling the mixing ratio of the nucleation, accumulation, and coarse modes. In addition, the mass fraction of mineral and soluble particles changes by changing their mixing ratios. The histogram of the depolarization ratio and lidar ratio at 532 nm of all combinations is shown in Figure 1. While the depolarization ratio ranges from 0.0 to 0.32 in Figure 1, the 5th to 95th percentile range of depolarization ratio of pure dust aerosols observed by an HSRL is 0.3–0.35 (Burton et al., 2013). Similarly, the lidar ratio of all combinations ranges from 36 to 160 sr Figure 1. The 5th to 95th percentile range of the lidar ratio of pure dust observed by HSRL is 41–57 sr (Burton et al., 2013).
Figure 2 shows the spectral extinction coefficient, single scattering albedo, and asymmetry parameter and their range (denoted with error bars) after applying the screening by the depolarization ratio from 0.3 to 0.35. Extinction coefficients are normalized by the original OPAC dust aerosol (i.e., unaltered mixing ratio) value at 532 nm. Because of these spectral optical property ranges, the albedo computed by these aerosol properties has a distribution. Figure 3 demonstrates how lidar and imager/spectrometer observations reduce the direct aerosol radiative effect uncertainty due to the variability of spectral optical properties. The histogram of albedos computed with all mixing ratio combinations relative to the albedo computed with the unaltered OPAC desert aerosol is shown in the left plot of Figure 3. Albedos are normalized by the albedo computed with unaltered OPAC desert component mixing ratios (hereinafter, albedo relative difference). When a 532 nm depolarization ratio is used to identify dust aerosol, the range of albedo relative differences is reduced to that shown in the middle plot of Figure 3. The narrower distribution is caused, for example, by selecting cases with a larger mixing ratio of the accumulation mode of the mineral component or screening out cases with a larger mixing ratio of the water soluble component. We also subset mixing ratios by the scattering coefficient at 468 and 642 nm to within ± 3% from those of the original OPAC dust aerosol. This is to simulate a case when the scattering optical thicknesses at 468 and 642 nm are known from the retrieval using observed imager/spectrometer observations. The 3% uncertainty is based on the calibration accuracy of a MODIS-like imager (Butler et al., 2003; Xiong and Butler 2020). We ignore the uncertainty associated with retrieving aerosol optical thickness. When dust aerosol is identified by a HSRL using depolarization ratio and scattering optical thickness retrieved from imager/spectrometer radiance observations at the two wavelengths, the albedo distribution is changed to the one shown in the right plot of Figure 3.
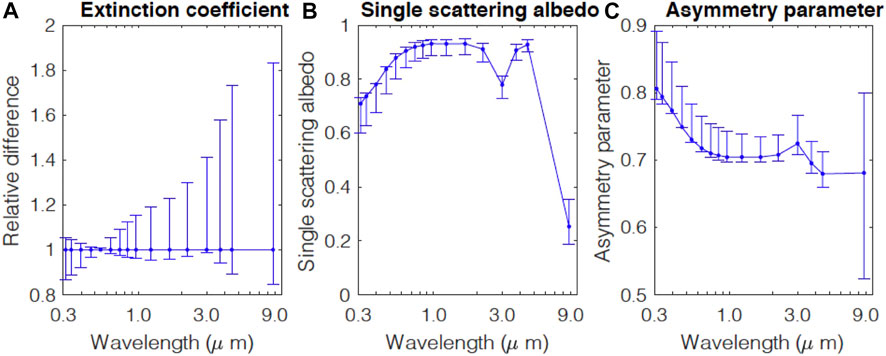
FIGURE 2. (A)Spectral extinction coefficient relative to that of OPAC desert aerosol as a function wavelength (B)single scattering albedo and (C) asymmetry parameter of OPAC desert aerosol as a function of wavelength. Error bars are the range of these values computed by a scaling factor ranging from 0.001 to 1,000 and subsetting the resulting extinction coefficient with a depolarization ration between 0.3 and 0.35. Single scattering albedo and asymmetry parameters are not normalized by the corresponding OPAC desert aerosol values.
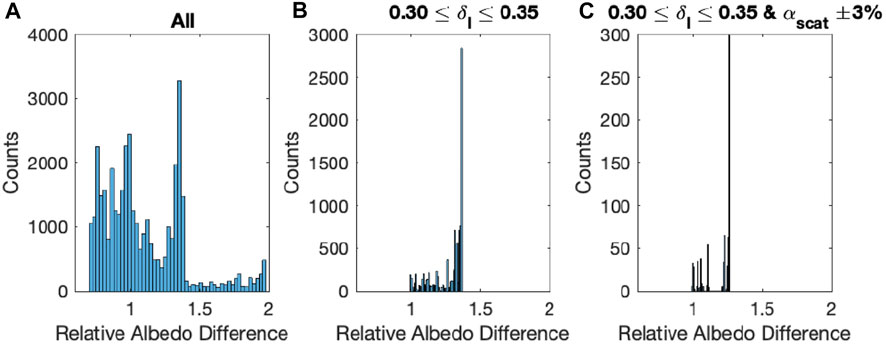
FIGURE 3. Histogram of broadband aerosol radiative effect relative of the OPAC desert aerosol for (A) all mixing ratio combinations and (B) after applying screening by the 532 nm depolarization ratio (0.30<s1<0.35) (C) Depolarization ratio s1 is between 0.3 and 0.35 and the scattering coefficients scat at 468 and 642 nm are within + -3% of that of OPAC desert aerosol are used. The cosine of the solar zenith angle is 0.8 and the surface albedo is 0.05. Note the difference in y-axis.
We can use the difference between maximum and minimum albedo relative differences divided by 2 and the mean of the differences computed for
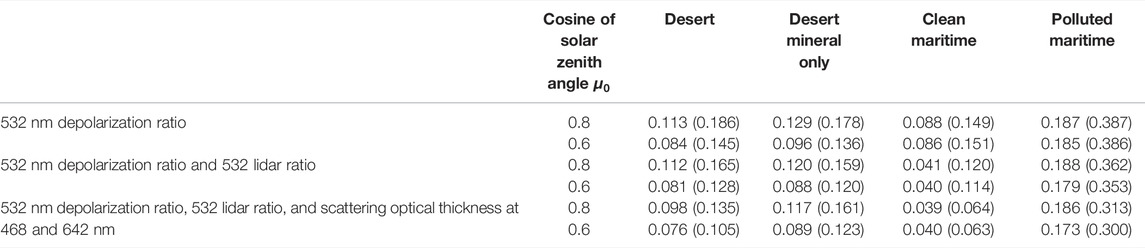
TABLE 1. Standard deviation of relative albedo difference within an aerosol type [Numbers in parenthesis are
The results of desert aerosol are summarized in Figure 4. Figure 4 also shows the standard deviation of the distribution. Although the distribution is not Gaussian, the standard deviation might be used for the uncertainty in the direct aerosol radiative effect by desert aerosols averaged over many cases (e.g., regional monthly or annual means). When dust/desert aerosols are identified using the depolarization ratio, the uncertainty in the mean direct aerosol radiative effect computed with retrieved properties due to spectral variability is, therefore, ±10%. When we combine HSRL and imager/spectrometer observations, the uncertainty is slightly reduced to ±9% [(0.098 + 0.076)/2]. This suggests that an additional constraint by spectral radiance is possible for desert aerosol identified from HSRL observations.
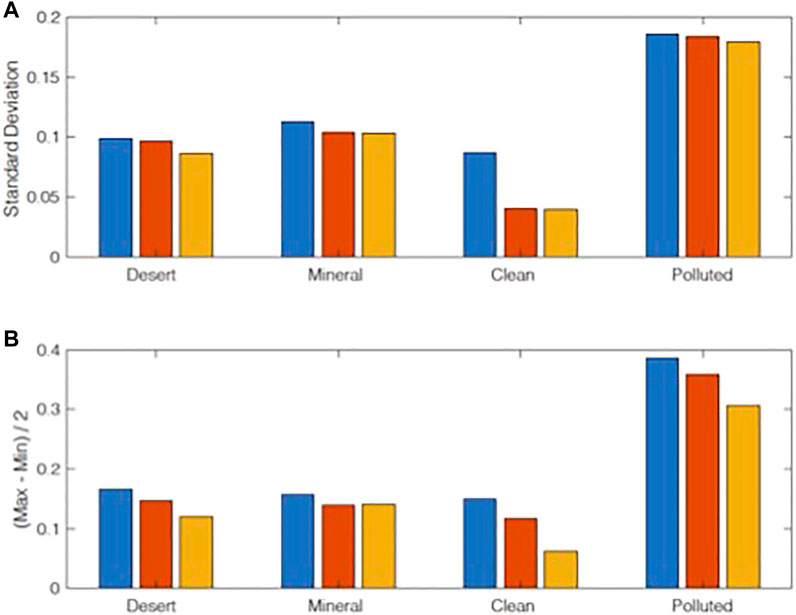
FIGURE 4. (A) Standard deviation of top-of atmosphere albedo relative difference (relative to the albedo of OPAC aerosols) after subsetting by (blue) 532 nm depolarization ratio (red) 532 nm depolarization ratio and lidar ratio (orange) 532 nm depolarization ratio and scattering optical thickness at two wavelengths (468 and 642 nm) are used.for desert mineral aerosols. Also 532 nm depolarization ratio and lidar ratio and scattering optical thickness at two wavelengths are used for clean marine and polluted marine aerosols. The (B) plot is the same as the top plot except that it shows the half of maximum and minimum relative albedo difference, All values are average value of the cosine of the solar zenith angle of 0.8 and 0.6 with a surface albedo of 0.05.
We also use only three modes of mineral component (i.e., excluding the soluble component) and repeat the process discussed above to separate the effect of size distribution variability and the variability of mass mixing ratio of mineral and soluble components. Results are similar to those for the desert aerosol (Table 1 and Figure 4). One difference is that the additional constraint imposed by spectral information is smaller when only mineral components are used.
3.2 Maritime Aerosols
The OPAC clean maritime aerosol is composed of water-soluble particles and accumulation and coarse modes of sea salt. The OPAC polluted maritime aerosol includes soot in addition to these three components of the clean maritime aerosol. Changing the mixing ratio of the clean maritime aerosol changes the size distribution of sea salt and the mass fraction of soluble and sea salt particles. Similarly, the changing mixing ratio of the polluted maritime aerosol changes the size distribution of sea salt and the mass fraction of soluble sea salt and soot particles. We assume that relative humidity is 85%, which is slightly above the observed relative humidity of the marine boundary layer ranging from 67 to 83% by Li-Johns et al. (1998). We derive the range of albedos for clean maritime and polluted maritime aerosols using the depolarization and lidar ratios. For clean maritime aerosol we use the range of 5th and 95th percentile values of the depolarization ratio from -1–13% (for relative humidity greater than ∼60%) and the lidar ratio from 9 to 33 sr, which correspond to those for marine aerosol classified by Burton et al. (2013). The linear polarization ratio is a nonnegative value (Mishchenko and Hovenier 1995). We use, however, the lower limit of the depolarization ratio of -1% instead of 2% because soluble and sea salt particles are assumed to be spherical and we ensure to include cases with slight negative values. For the polluted maritime aerosol, we use the range of the depolarization ratio from -1–6% and the lidar ratio from 27 to 50 sr (Burton et al., 2013).
Similar to desert aerosol, the albedo difference is computed relative to the albedo of the unaltered original OPAC clean maritime and polluted maritime aerosols. We then compute the standard deviation and one half of the difference between maximum and minimum values. Results are also summarized in Figure 4 and Table 1. The standard deviation of the relative albedo difference of polluted maritime aerosol is larger compared to the standard deviation of the relative albedo difference of the other three aerosols. When soot is present, the uncertainty in broadband albedo increases because of the larger variability in spectral optical properties. Using scattering optical thickness at two wavelengths reduces the range of albedo (plot of Figure 4B) for both clean and polluted maritime aerosols.
To test whether increasing the spectral range to derive aerosol scattering optical thickness further reduces the uncertainty in the albedo of polluted maritime aerosol, we use four wavelengths similar to those used in Thorsen et al. (2020), 340 nm, 546 nm, 966 nm, and 1,657 nm, to screen the albedos of polluted maritime aerosol. The standard deviation decreases to 8% when we use four wavelengths (Table 2). The decrease in the standard deviation is primarily caused by the addition of 340 nm. The addition of 1,657 nm reduces the standard deviation, but it is not as effective as 340 nm in reducing the standard deviation (Table 2). This is because the extinction coefficient of soot at 340 nm is nearly one order of magnitude larger than the extinction coefficient at 1,657 nm (5.4 × 10⁻⁶ m−1 for 340 nm versus 7.1 × 10⁻⁷ m−1 for 1,657 nm).
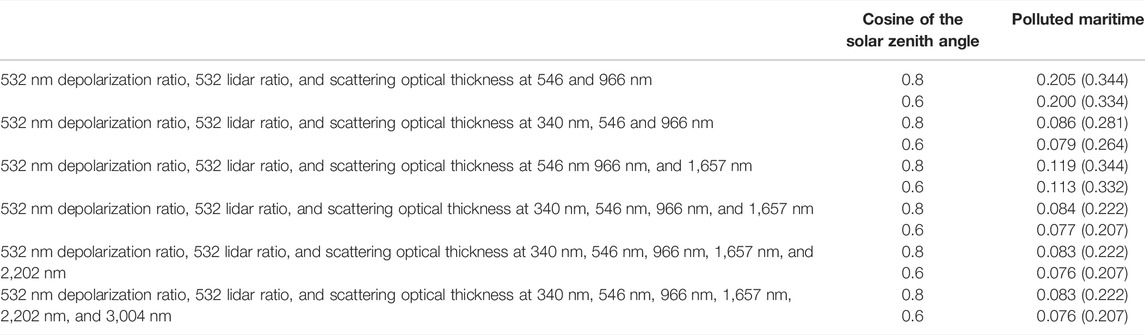
TABLE 2. Standard deviation of relative albedo difference for polluted maritime aerosol. [Numbers in parenthesis are
Note that the two wavelengths (546 and 966 nm) used in Table 2 are different from those used in Figure 4 (468 and 642 nm). However, the standard deviation is similar, indicating that a particular selection of two wavelengths has a smaller impact than the impact of the spectral range. Using wavelengths longer than 1,657 nm does not further reduce the standard deviation (Table 2). Changing the depolarization range to −1 to 5 from −1 to 6 and the lidar ratio to 36 to 45 from 27 to 50 does not reduce the standard deviation (not shown). When the spectral range is sufficiently broad, therefore, the 532 nm depolarization ratio and lidar ratio do not introduce additional constraints to reduce the standard deviation. A caveat is that the scattering optical thickness is derived from narrowband radiance observations and the angular distribution of radiances is not strictly constrained by observations. We consider the impact of the angular distribution of radiance in the next section.
3.3 Conversion of Radiance to Irradiance
We quantified the uncertainty in the direct aerosol radiative effect computed with retrieved aerosol properties in Sections 3.1, 3.2. Observing radiances and scattering optical thickness derived from them at four wavelengths that are sufficiently wide further reduces the uncertainty in deriving broadband radiances. In the introduction section, we mentioned that another way of estimating the direct aerosol radiative effect is to use observed broadband radiances. Converting the broadband radiance to broadband irradiance requires information about the angular distribution of radiances (Loeb et al., 2003). When angular distribution models are used to convert the broadband radiance to broadband irradiance, the uncertainty in the anisotropic factor contributes to the uncertainty in the broadband irradiance. In this section, we illustrate how the information about aerosol type reduces the uncertainty in converting the radiance to irradiance using an extreme example.
Figure 5 shows computed clear-sky radiances at TOA as a function of viewing zenith and relative azimuth angles. All radiances are computed with a Discrete-Ordinate-method Radiative Transfer (DISORT, Stamnes et al., 1988) model with 12-streams. The model uses a sea surface roughness model of Cox and Munk (1954) with a 5 m s−1 wind speed (Vermote et al., 1997), a midlatitude summer standard atmosphere, and a solar zenith angle of 28°. A correction is applied to radiances directly transmitted from the surface to TOA (Kato et al., 2002). Figure 5 shows reflected radiance by desert aerosol with an optical thickness of 1.0 (red line), which roughly corresponds to the climatological mean aerosol optical thickness of Saharan dust over the ocean in July (Remer et al., 2008). It also shows reflected radiance from clean maritime aerosol with an optical thickness of 0.75 (black line) and clean maritime aerosol with optical thickness of 0.15 (green line). At nadir, the broadband radiance from desert aerosol falls between the radiance of maritime clean aerosols with 0.75 and 0.15 optical thicknesses. If the observed radiance
where
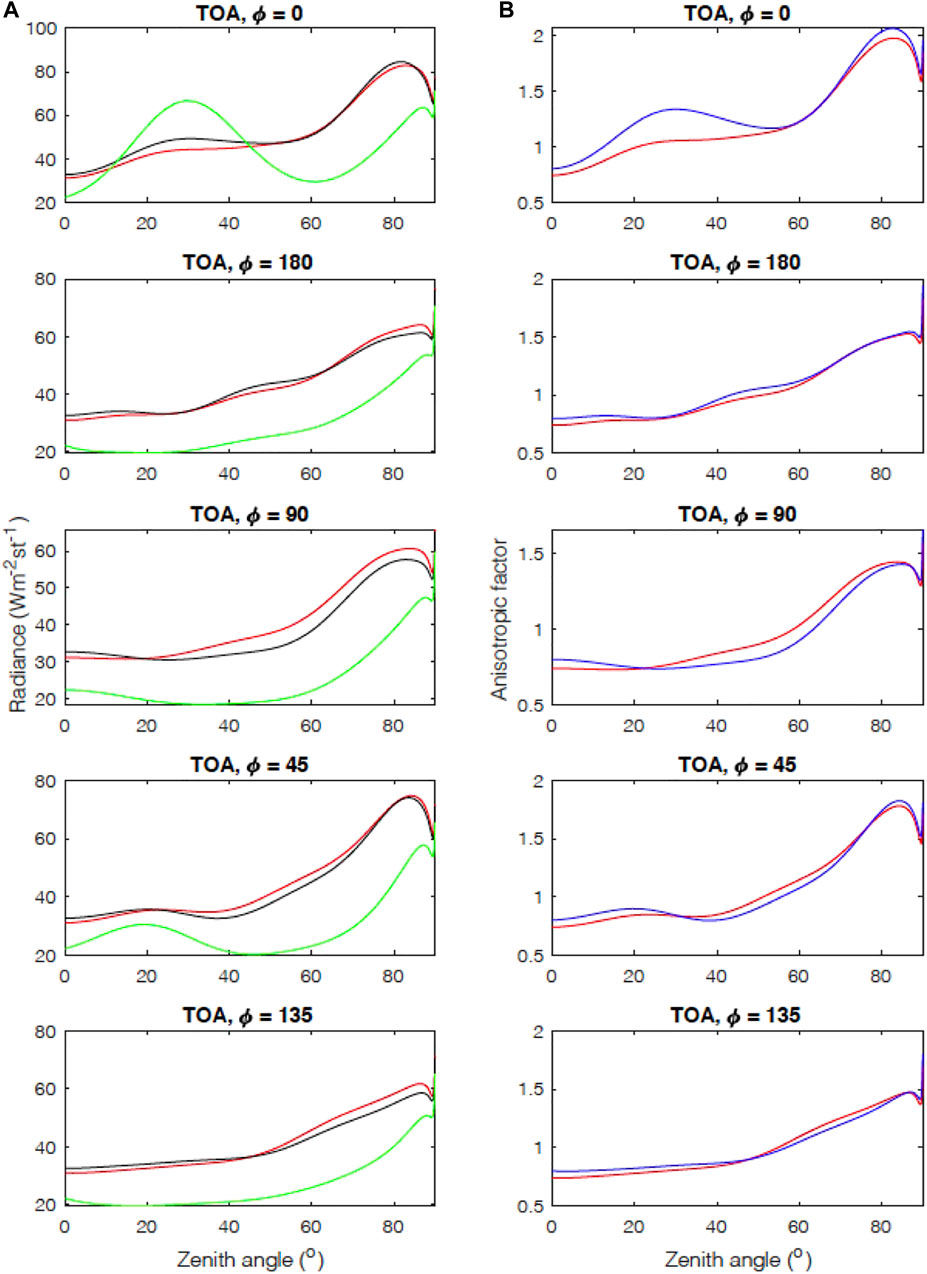
FIGURE 5. Reflected top of atmosphere broadband radiance in Wm-2 st−1 (A) and anisotropic factor (B) as a function of zenith angle. The zenith angle is the angle between viewing direction and the zenith for different azimuth angles o relative to the sun’s position. The sun is at φ =180°. Red line is with dust aerosol (optical thickness of 1.0). Black and green lines on the left plots are maritime clean aerosol with optical thickness of, respectively, 0.75 and 0.15. Blue line on the right plots is interpolated values from the two maritime clean aerosols τ = 0.75 and 0.15 values. Ocean surface with wind speed of 5.0 m s-1 and a midlatitude summer standard atmosphere are used. The solar zenith angle is 28°.
In this example, the anisotropic factor of the desert aerosol at nadir is 0.738. The interpolated anisotropic factor using the clean maritime aerosol angular distribution model is 0.799. Once the clean maritime aerosol angular distribution model is used to derive the irradiance F by interpolating the optical thicknesses, then F = 122 Wm-2. The irradiance of desert aerosol with an optical thickness of 1.0 is 132 Wm-2, which is 8% larger than the irradiance derived from the maritime clean aerosol angular distribution model. The difference is primarily driven by the difference in the phase function of desert and clean maritime aerosols.
The nadir view radiance of the desert aerosol is smaller than the nadir view radiance of the clean maritime aerosol with an optical thickness of 0.75, while the irradiance of the desert aerosol is larger (Table 3). The larger irradiance of the desert aerosol is due to larger radiances at larger viewing angles away from the principal plane (i.e., near relative azimuth angle ϕ = 180°). The error in the irradiance in this example depends on the viewing geometry of the observed radiance. Outside the principal plane, the sign of the anisotropic factor difference between desert and interpolated value from clean maritime aerosol of two optical thicknesses (τ = 0.15 and 0.75) changes from near nadir to oblique angles (Figure 5B). This suggests that when irradiances are derived from a wide range of viewing zenith angles by a cross-track scan and the irradiances are averaged, the bias in the averaged irradiance is smaller. This example of desert and clean maritime aerosols is probably an extreme case. Therefore, the 8% difference in the instantaneous irradiance is perhaps an upper limit. However, the result underscores the impact of the difference in the phase function caused by the shape of particles on the uncertainty in converting the radiance to irradiance using the observed radiance at nadir only. Collocated active sensor observations to identify nonspherical particles and retrieve aerosol type should reduce the uncertainty. In addition, observing radiances from various viewing angles for a fixed scene along the ground track of the satellite can also reduce the uncertainty of the angular distribution of radiances.

TABLE 3. Broadband irradiance, nadir radiance, and anisotropic factor.
This approach that uses broadband radiances to estimate direct aerosol radiative effects is different from the approach that uses retrieved aerosol properties from active and passive sensors, provided that the irradiance under pristine conditions (i.e., no aerosol) is known. This approach is used in the first approach discussed in the introduction section and can derive the direct aerosol radiative effect independently from that derived by the second approach discussed in the introduction section and Section 3. Therefore, the irradiance derived by this approach can be used to evaluate the direct aerosol radiative effect computed with retrieved properties (i.e., radiative closure), if the irradiance is sufficiently accurate. As explained in the next section (Section 4), the accuracy requirement of the broadband irradiance is 1%, which is challenging because this includes both instrument calibration accuracy and the uncertainty in the radiance to irradiance conversion.
4 Radiometer Calibration Accuracy Requirement to Constrain Global Mean Aerosol Direct Radiative Effect or Closure
The expected uncertainty in the aerosol radiative effect derived from lidars only and lidar/polarimeter is determined using the target uncertainties specified in the ACCP SATM (https://aos.gsfc.nasa.gov/docs/ACCP_SATM_Rel_Candidate_G.pdf). Taking the relevant ACCP target uncertainties (e.g., AOD, single scattering albedo, asymmetry parameter, aerosol extinction) and following the approach of Thorsen et al. (2020), results in an uncertainty of 1.1 Wm-2 for all-sky and 1.2 Wm-2 for clear-sky (ACCP narrative doc: https://aos.gsfc.nasa.gov/docs/ACCP_Science_Narrative-2021.07.19.pdf).
The climatological value of global mean clear-sky reflected irradiance derived from CERES observations is 53 Wm-2. Therefore, in order to constrain the global mean aerosol direct radiative effect or perform a radiative closure to test retrieved properties, the radiometer calibration accuracy needs to be less than 2.1% (=1.2/53). Because shortwave radiative effects are computed for daytime only, we divide 2.2% by 2, which gives the radiometer calibration accuracy of 1%. A study by Loeb et al. (2009) indicates that the uncertainty in the irradiance is dominated by the instrument calibration uncertainty. Therefore, we use the relative uncertainty in the irradiance as the calibration uncertainty. The 1% calibration uncertainty of broadband shortwave is equivalent to the calibration uncertainty of CERES instruments (Loeb et al. 2009).
5 Discussions and Summary
We investigate the range of relative differences in the direct aerosol radiative effect due to spectral variability when an HSRL is used to identify the aerosol type. We also investigate how a combination of active sensor and passive sensor observations affects the range. The method used in this study is simple, but the attempt is to simulate a process of computing the direct aerosol radiative effect using active and passive sensor derived aerosol properties combined with aerosol optical models. The range of the direct aerosol radiative effect simulated in this study is comparable to the uncertainty in the direct aerosol radiative effect computed using a fixed aerosol optical model separated by aerosol type to extend optical properties to all computational wavelengths. The uncertainty estimated in this study is due to the variability of the mass mixing ratio of components and size distribution within an aerosol type. When a 532 nm depolarization ratio is used to identify desert aerosol, the uncertainty due to spectral variability in the mean direct aerosol radiative effect is 10%. Spectral radiance observations can reduce the uncertainty slightly. The uncertainty in the mean direct aerosol radiative effect of pure dust (i.e. mineral only) caused by the size distribution variability is similar to that for the desert aerosol. When the depolarization ratio and lidar ratio are used to identify clean and polluted maritime aerosols, the uncertainty due to spectral variability in the mean direct aerosol radiative effect is, respectively, 4 and 18%. Additional information about scattering optical thickness significantly reduces the uncertainty in the direct aerosol radiative effect for the polluted maritime aerosol in which a highly absorbing component (e.g., soot) is present. When the aerosol scattering optical thickness is known to within ±3% at four wavelengths, in addition to the depolarization and lidar ratios, then the uncertainty in the polluted maritime mean direct aerosol radiative effect is reduced to 8%. Although unrealistic larger mixing ratios of soot are not completely filtered out by the depolarization and lidar ratio, this result demonstrates that an additional observational constraint is possible using spectral radiances, especially for aerosol type that contain highly absorbing components. In addition, observing a wider range of spectral radiance reduces the uncertainty in the spectral optical properties. An implicit assumption here is that aerosol components and their refractive indices within aerosol types used for aerosol optical models are accurate. The overall uncertainty in the computed direct aerosol radiative effect includes the uncertainty in the retrieved aerosol optical properties, in the aerosol optical model, and due to radiative transfer modeling, in addition to the uncertainty due to the spectral optical property variability investigated in this study.
Because passive sensors generally do not cover a wide range of viewing geometries in observing radiances, accurate information about the phase function is essential, especially for nonspherical particles such as mineral particles, in reducing the uncertainty in the direct aerosol radiative effect. In an extreme example used in this study, the difference in the phase function can cause an 8% difference in the instantaneous TOA irradiance derived from broadband radiance observed at nadir. Identifying nonspherical particles and aerosol types and using type-dependent radiance to irradiance conversions helps reduce the uncertainty in broadband irradiances derived from observed broadband radiances.
In summary, in quantifying the uncertainty in the direct aerosol radiative effect due to spectral variability, this study illustrates how the synergy of HSRL and imager/spectrometer observations can reduce the uncertainty in the direct aerosol radiative effect. In addition, the study highlights the requirement for broadband radiances and irradiances derived from them to be used to evaluate computed direct aerosol radiative effects using retrieved properties.
Data Availability Statement
The original contributions presented in the study are included in the article/Supplementary Material; further inquiries can be directed to the corresponding author.
Author Contributions
SK wrote the first draft of the manuscript. TT, S-HH, NL, RF, DW, HB, GS, SS, KM, and BC contributed to editing. SK, TT, and S-HH contributed to the analysis.
Funding
The work by SK and SSH is supported by NASA’s CloudSat and CALIPSO science recompete funding and the CERES project.
Conflict of Interest
Author SSH was employed by the company Science Systems and Applications Inc.
The remaining authors declare that the research was conducted in the absence of any commercial or financial relationships that could be construed as a potential conflict of interest.
Publisher’s Note
All claims expressed in this article are solely those of the authors and do not necessarily represent those of their affiliated organizations, or those of the publisher, the editors, and the reviewers. Any product that may be evaluated in this article, or claim that may be made by its manufacturer, is not guaranteed or endorsed by the publisher.
Acknowledgments
We thank Drs. Wenying Su and Gregory Schuster of NASA Langley Research Center for useful discussions. Section 4 is based on discussions during AOS (ACCP) radiation working group meetings.
Supplementary Material
The Supplementary Material for this article can be found online at: https://www.frontiersin.org/articles/10.3389/frsen.2022.904505/full#supplementary-material
References
Bellouin, N., Quaas, J., Gryspeerdt, E., Kinne, S., Stier, P., Watson‐Parris, D., et al. (2020). Bounding Global Aerosol Radiative Forcing of Climate Change. Rev. Geophys. 58, e2019RG000660. doi:10.1029/2019RG000660
Bellouin, N., Quaas, J., Morcrette, J.-J., and Boucher, O. (2013). Estimates of Aerosol Radiative Forcing from the MACC Re-analysis. Atmos. Chem. Phys. 13, 2045–2062. doi:10.5194/acp-13-2045-2013
Bond, T. C., and Bergstrom, R. W. (2006). Light Absorption by Carbonaceous Particles: an Investigative Review. Aerosol Sci. Technol. 40, 27–67. doi:10.1080/02786820500421521
Boucher, O., and Tanré, D. (2000). Estimation of the Aerosol Perturbation to the Earth's Radiative Budget over Oceans Using POLDER Satellite Aerosol Retrievals. Geophys. Res. Lett. 27, 1103–1106. doi:10.1029/1999gl010963
Burton, S. P., Ferrare, R. A., Vaughan, M. A., Omar, A. H., Rogers, R. R., Hostetler, C. A., et al. (2013). Aerosol Classification from Airborne HSRL and Comparisons with the CALIPSO Vertical Feature Mask. Atmos. Meas. Tech. 6, 1397–1412. doi:10.5194/amt-6-1397-2013
Butler, J. J., Brown, S. W., Saunders, R. D., Johnson, B. C., Biggar, S. F., Zalewski, E. F., et al. (2003). Radiometric Measurement Comparison on the Integrating Sphere Source Used to Calibrate the Moderate Resolution Imaging Spectroradiometer (MODIS) and the Landsat. J. Res. Natl. Inst. Stand. Technol. 108 (3), 199–228. doi:10.6028/jres.108.020
Chou, M.-D., Chan, P.-K., and Wang, M. (2002). Aerosol Radiative Forcing Derived from SeaWiFS-Retrieved Aerosol Optical Properties. J. Atmos. Sci. 59, 748–757. doi:10.1175/1520-0469(2002)059<0748:arfdfs>2.0.co;2
Cox, C., and Munk, W. (1954). Measurement of the Roughness of the Sea Surface from Photographs of the Sun's Glitter. J. Opt. Soc. Am. 44, 838–850. doi:10.1364/josa.44.000838
Gasteiger, J., and Wiegner, M. (2018). MOPSMAP v1.0: a Versatile Tool for the Modeling of Aerosol Optical Properties. Geosci. Model. Dev. 11, 2739–2762. doi:10.5194/gmd-11-2739-2018
Ham, S.-H., Kato, S., and Rose, F. G. (2020). Examining Biases in Diurnally Integrated Shortwave Irradiances Due to Two- and Four-Stream Approximations in a Cloudy Atmosphere. J. Atmos. Sci. 77, 551–581. doi:10.1175/JAS-D-19-0215.1
Hess, M., Koepke, P., and Schult, I. (1998). Optical Properties of Aerosols and Clouds: The Software Package OPAC. Bull. Amer. Meteor. Soc. 79, 831–844. doi:10.1175/1520-0477(1998)079<0831:opoaac>2.0.co;2
Joseph, J. E., Wiscombe, W. J., and Weinman, J. A. (1976). The Delta-Eddington Approximation for Radiative Flux Transfer. J. Atmos. Sci. 33, 2453–2459. doi:10.1175/1520-0469(1976)033<2452:tdeafr>2.0.co;2
Kahn, R. A., Gaitley, B. J., Martonchik, J. V., Diner, D. J., Crean, K. A., and Holben, B. (2005). Multiangle Imaging Spectroradiometer (MISR) Global Aerosol Optical Depth Validation Based on 2 Years of Coincident Aerosol Robotic Network (AERONET) Observations. J. Geophys. Res. 110, D10S04. doi:10.1029/2004jd004706
Kahn, R. A., Nelson, D. L., Garay, M. J., Levy, R. C., Bull, M. A., Diner, D. J., et al. (2009). MISR Aerosol Product Attributes and Statistical Comparisons with MODIS. IEEE Trans. Geosci. Remote Sens. 47 (12), 4095–4114. doi:10.1109/TGRS.2009.2023115
Kato, S., Loeb, N. G., and Rutlege, C. K. (2002). Estimate of Top-Of-Atmosphere Albedo for a Molecular Atmosphere over Ocean Using Clouds and the Earth's Radiant Energy System Measurements. J. Geophys. Res. 107, D194396. doi:10.1029/2001JD001309
Kim, M.-H., Omar, A. H., Tackett, J. L., Vaughan, M. A., Winker, D. M., Trepte, C. R., et al. (2018). The CALIPSO Version 4 Automated Aerosol Classification and Lidar Ratio Selection Algorithm. Atmos. Meas. Tech. 11, 6107–6135. doi:10.5194/amt-11-6107-2018
Li-Johns, , Maring, H. B., and Prospero, J. M. (1998). Effect of Relativ Humidity on Light Scattering by Mineral Dust Aerosol as Measured in the Marine Boundary Layer Over the Tropical Ocean. J. Geophys. Res. 103 (D23), 31113–31121.
Liou, K.-N. (1974). Analytic Two-Stream and Four-Stream Solutions for Radiative Transfer. J. Atmos. Sci. 31, 1473–1475. doi:10.1175/1520-0469(1974)031<1473:atsafs>2.0.co;2
Loeb, N. G., and Kato, S. (2002). Top-of-Atmosphere Direct Radiative Effect of Aerosols over the Tropical Oceans from the Clouds and the Earth's Radiant Energy System (CERES) Satellite Instrument. J. Clim. 15, 1474–1484. doi:10.1175/1520-0442(2002)015<1474:toadre>2.0.co;2
Loeb, N. G., Manalo-Smith, N., Kato, S., Miller, W. F., Gupta, S. K., Minnis, P., et al. (2003). Angular Distribution Models for Top-Of-Atmosphere Radiative Flux Estimation from the Clouds and the Earth's Radiant Energy System Instrument on the Tropical Rainfall Measuring Mission Satellite. Part I: Methodology. J. Appl. Meteor. 42, 240–265. doi:10.1175/1520-0450(2003)042<0240:admfto>2.0.co;2
Loeb, N. G., and Manalo-smith, N. (2008). Top-of-atmosphere Direct Radiative Effect of Aerosols over Global Oceans from Merged CERES and MODIS Observations. J. Clim. 18, 3506–3526. doi:10.1175/JCLI3504.1
Loeb, N. G., Su, W., Bellouin, N., and Ming, Y. (2021). Changes in Clear-Sky Shortwave Aerosol Direct Radiative Effects since 2002. J. Geophys. Res. Atmos. 126, e2020JD034090. doi:10.1029/2020jd034090
Loeb, N. G., and Su, W. (2010). Direct Aerosol Radiative Forcing Uncertainty Based on a Radiative Perturbation Analysis. J. Clim. 23, 5288–5293. doi:10.1175/2010jcli3543.1
Loeb, N. G., Wielicki, B. A., Doelling, D. R., Smith, G. L., Keyes, D. F., Kato, S., et al. (2009). Toward Optimal Closure of the Earth's Top-Of-Atmosphere Radiation Budget. J. Clim. 22, 748–766. doi:10.1175/2008JCLI2637.1
Mishchenko, M. I., and Hovenier, J. W. (1995). Depolarization of Light Backscattered by Randomly Oriented Nonspherical Particles. Opt. Lett. 20 (12), 1356–1358. doi:10.1364/ol.20.001356
Omar, A. H., Winker, D. M., Vaughan, M. A., Hu, Y., Trepte, C. R., Ferrare, R. A., et al. (2009). The CALIPSO Automated Aerosol Classification and Lidar Ratio Selection Algorithm. J. Atmos. Ocean. Technol. 26, 1994–2014. doi:10.1175/2009JTECHA1231.1
Remer, L. A., and Kaufman, Y. J. (2006). Aerosol Direct Radiative Effect at the Top of the Atmosphere over Cloud Free Ocean Derived from Four Years of MODIS Data. Atmos. Chem. Phys. 6, 237–253. doi:10.5194/acp-6-237-2006
Remer, L. A., Kaufman, Y. J., Tanré, D., Mattoo, S., Chu, D. A., Martins, J. V., et al. (2005). The MODIS Aerosol Algorithm, Products, and Validation. J. Atmos. Sci. 62 (4), 947–973. doi:10.1175/jas3385.1
Remer, L. A., Kleidman, R. G., Levy, R. C., Kaufman, Y. J., Tanre, D., Mattoo, S., et al. (2008). Global Aerosol Climatology from the MODIS Satellite Sensors. J. Geophys. Res. 113, 661. doi:10.1029-2007JD00966110.1029/2007jd009661
Sinyuk, A., Torres, O., and Dubovik, O. (2003). Combined Use of Satellite and Surface Observations to Infer the Imaginary Part of Refractive Index of Saharan Dust. Geophys. Res. Lett. 30, 1081. doi:10.1029/2002GL016189
Stamnes, K., Tsay, S.-C., Wiscombe, W., and Jayaweera, K. (1988). Numerically Stable Algorithm for Discrete-Ordinate-Method Radiative Transfer in Multiple Scattering and Emitting Layered Media. Appl. Opt. 27, 2502–2509. doi:10.1364/ao.27.002502
Stier, P., Seinfeld, J. H., Kinne, S., and Boucher, O. (2007). Aerosol Absorption and Radiative Forcing. Atmos. Chem. Phys. 7, 5237–5261. doi:10.5194/acp-7-5237-2007
Su, W., Corbett, J., Eitzen, Z., and Liang, L. (2015). Next-generation Angular Distribution Models for Top-Of-Atmosphere Radiative Flux Calculation from CERES Instruments: Methodology. Atmos. Meas. Tech. 8, 611–632. doi:10.5194/amt-8-611-2015
Su, W., Loeb, N. G., Schuster, G. L., Chin, M., and Rose, F. G. (2013). Global All-Sky Shortwave Direct Radiative Forcing of Anthropogenic Aerosols from Combined Satellite Observations and GOCART Simulations. J. Geophys. Res. Atmos. 118, 655–669. doi:10.1029/2012JD018294
Thorsen, T. J., Ferrare, R. A., Kato, S., and Winker, D. M. (2020). Aerosol Direct Radiative Effect Sensitivity Analysis. J. Clim. 33, 6119–6139. doi:10.1175/JCLI-D-19-0669.1
Várnai, T., and Marshak, A. (2012). Analysis of Co-located MODIS and CALIPSO Observations Near Clouds. Atmos. Meas. Tech. 5, 389–396. doi:10.5194/amt-5-389-2012
Vermote, E. F., Tanre, D., Deuze, J. L., Herman, M., and Morcette, J.-J. (1997). Second Simulation of the Satellite Signal in the Solar Spectrum, 6S: An Overview. IEEE Trans. Geosci. Remote Sens. 35, 675–686. doi:10.1109/36.581987
Xiong, X., and Butler, J. J. (2020). MODIS and VIIRS Calibration History and Future Outlook. Remote Sens. 12, 2523. doi:10.3390/rs12162523
Yang, Y., and Di Girolamo, L. (2008). Impacts of 3-D Radiative Effects on Satellite Cloud Detection and Their Consequences on Cloud Fraction and Aerosol Optical Depth Retrievals. J. Geophys. Res. 113, 9095. doi:10.1029/2007JD009095
Yu, H., Kaufman, Y. J., Chin, M., Feingold, G., Remer, L. A., Anderson, T. L., et al. (2006). A Review of Measurement-Based Assessments of the Aerosol Direct Radiative Effect and Forcing. Atmos. Chem. Phys. 6, 613–666. doi:10.5194/acp-6-613-2006
Keywords: direct aerosol radiative effect, spectral, size distribution, mixing ratio, components
Citation: Kato S, Thorsen TJ, Ham S-H, Loeb NG, Ferrare RA, Winker DM, Barker H, Stephens GL, Schmidt S, Meyer KG and Cairns B (2022) Effect of Spectral Variability of Aerosol Optical Properties on Direct Aerosol Radiative Effect. Front. Remote Sens. 3:904505. doi: 10.3389/frsen.2022.904505
Received: 25 March 2022; Accepted: 30 May 2022;
Published: 06 July 2022.
Edited by:
Jing Li, Peking University, ChinaReviewed by:
Husi Letu, Aerospace Information Research Institute (CAS), ChinaChong Shi, Aerospace Information Research Institute (CAS), China
Copyright © 2022 Kato, Thorsen, Ham, Loeb, Ferrare, Winker, Barker, Stephens, Schmidt, Meyer and Cairns. This is an open-access article distributed under the terms of the Creative Commons Attribution License (CC BY). The use, distribution or reproduction in other forums is permitted, provided the original author(s) and the copyright owner(s) are credited and that the original publication in this journal is cited, in accordance with accepted academic practice. No use, distribution or reproduction is permitted which does not comply with these terms.
*Correspondence: Seiji Kato, c2Vpamkua2F0b0BuYXNhLmdvdg==