 Xiaomei Lu1*
 Yongxiang Hu1
 Xubin Zeng2
 Snorre A. Stamnes1
 Thomas A. Neuman3Nathan T. Kurtz3
 Yuekui Yang4
 Peng-Wang Zhai5
 Meng Gao6,7
 Wenbo Sun1Kuanman Xu1Zhaoyan Liu1Ali H. Omar1Rosemary R. Baize1
 Laura J. Rogers1Brandon O. Mitchell2
 Knut Stamnes8Yuping Huang8Nan Chen8Carl Weimer9Jennifer Lee9Zachary Fair3
- 1Science Directorate, NASA Langley Research Center, Hampton, VA, United States
- 2Department of Hydrology and Atmospheric Sciences, College of Science, The University of Arizona, Tucson, AZ, United States
- 3Cryospheric Sciences Lab., NASA GSFC, Greenbelt, MD, United States
- 4Climate and Radiation Lab., NASA GSFC, Greenbelt, MD, United States
- 5Department of Physics, UMBC, Baltimore, MD, United States
- 6Ocean Ecology Lab., NASA GSFC, Greenbelt, MD, United States
- 7Science System and Applications, Inc., Lanham, MD, United States
- 8Department of Physics, Stevens Institute of Technology, Hoboken, NJ, United States
- 9Ball Aerospace and Technologies Corp., Boulder, CO, United States
The application of diffusion theory and Monte Carlo lidar radiative transfer simulations presented in Part I of this series of study suggests that snow depth can be derived from the first-, second- and third-order moments of the lidar backscattering pathlength distribution. These methods are now applied to the satellite ICESat-2 lidar measurements over the Arctic sea ice and land surfaces of Northern Hemisphere. Over the Arctic sea ice, the ICESat-2 retrieved snow depths agree well with co-located IceBridge snow radar measured values with a root-mean-square (RMS) difference of 7.8 cm or 29.2% of the mean snow depth. The terrestrial snow depths derived from ICESat-2 show drastic spatial variation of the snowpack along ICESat-2 ground tracks over the Northern Hemisphere, which are consistent with the University of Arizona (UA) and Canadian Meteorological Centre (CMC) gridded daily snow products. The RMS difference in snow depths between ICESat-2 and UA gridded daily snow products is 14 cm, or 28% of the mean UA snow depth. To better understand these results, we also discuss the possible sources of errors in ICESat-2 derived snow depths, including surface roughness within the laser footprint, atmospheric forward scattering, solar background noise, and detector dark current. Simulation results indicate that the snow depth errors would be less than 5 cm if the standard deviation of pulse spreading due to surface roughness is within 50 cm. Our results demonstrate that the ICESat-2 lidar measurements can be used to reliably derive snow depth, which is a critical geophysical parameter for cryosphere studies including sea ice thickness estimation and also provides important constraints in the modeling of terrestrial hydrological processes.
Introduction
Accurate characterization of snow depth is important for hydroelectric operations, forecasting freshwater, snow melt, and land resource availability for communities, and prediction of climate change impacts (Clark et al., 2011; Zeng et al., 2018; Mortimer et al., 2020; Pulliainen et al., 2020; Tutton and Way, 2021). In the polar regions, knowledge of contemporaneous snow depth on sea ice is important both to constrain the regional climatology and to improve the accuracy of satellite altimeter estimates of sea ice thickness (Brucker and Markus, 2013; Newman et al., 2014; Kwok et al., 2020). Snow depth can be retrieved through in situ (Lejeune et al., 2019; Ménard et al., 2019; Wagner et al., 2021) and remote sensing techniques including satellite passive microwave radiometers such as the Advanced Microwave Scanning Radiometer (AMSR-E/AMSR2) (Markus and Cavalieri, 1998; Kelly, 2009; Kilic et al., 2019); suborbital snow radar such as the airborne IceBridge radar (Kurtz and Farrell, 2011; Kurtz et al., 2013; Kwok et al., 2017); and satellite radar altimeters such as CryoSat-2 and Sentinel-1 (Kwok et al., 2020; Lievens et al., 2022). In situ and suborbital snow measurements with high spatial resolution are typically limited in area, and measurements are especially challenging in remote areas such as mountains and the polar regions. Satellite microwave-based snow depth has relatively coarse spatial resolutions with grid sizes of 12.5 to around 100 km (Kelly, 2009; Takala et al., 2011) and has a tendency to saturate at ∼0.8 m snow depth (Lievens et al., 2022), which limits the usability of applications where higher spatial resolutions and improved accuracies are required. To study snowpack on the ice, current satellite radar altimeters such as CryoSat-2 measure the bottom height of the snow layer, i.e., the snow-ice interface, and needs the snow layer top height information to estimate the snow depth (Kacimi and Kwok, 2020; Kwok et al., 2020).
The Advanced Topographic Laser Altimeter System (ATLAS) instrument, onboard the Ice, Cloud, and land Elevation Satellite-2 (ICESat-2) launched on 15 September 2018, is designed to measure ice-sheet topography and sea ice freeboard as well as atmospheric properties and global vegetation (Markus et al., 2017; Martino et al., 2019). ATLAS is a 532 nm photon-counting laser altimeter with a 10-kHz pulse repetition rate, a nominal 11-m footprint diameter with an along-track sampling interval of 0.7 m at the Earth’s surface (Magruder and Brunt, 2018; Martino et al., 2019; Neumann et al., 2019; Magruder et al., 2020). The ICESat-2 ATLAS measurement scenario is entirely different from two previous Earth science spaceborne lidars, namely ICESat (Abshire et al., 2005) and Cloud-Aerosol Lidar with Orthogonal Polarization (CALIOP) (Hunt et al., 2009). Unlike ICESat and CALIOP, ATLAS uses photomultiplier tubes (PMTs) as detectors in photon counting mode where individual photons reflected from Earth’s surface are timed with approximately 200 ps high temporal precision (Martino et al., 2019). This single-photon-sensitive detection technique used by ATLAS to measure photon time of flight provides the high-quality, high-accuracy topographic measurements required to detect small temporal changes in polar ice elevations (Neumann et al., 2019).
Seasonal snow depths can be estimated using ICESat-2 ATL08 terrain elevation data (Neuenschwander et al., 2021) and multiple reference digital elevation models (DEMs) based on snow-on and snow-off measurements (Shean et al., 2021; Hu X. et al., 2022). However, the snow depth retrievals from currently available altimetry crossovers with snow-on and snow-off measurements are sparse and noisy (Shean et al., 2021). Moreover, the quality and vertical accuracy of reference DEMs (Treichler and Kääb, 2017; Liu et al., 2020), and the spatial resolution differences between ICESat-2 and the reference DEMs, can affect the snow depth retrievals as well.
To overcome these limitations, Hu Y. et al. (2022) developed a novel method of deriving snow depth using vertically resolved and multiple-scattered lidar signals returned from a snow layer. Fortunately, the ICESat-2 ATL03 global geolocated photon data set (Neumann et al., 2021) provides the very high vertical resolution of surface-returned photons including the subsurface photons that penetrate into the snowpack and undergo multiple scattering, which offers a unique and exciting opportunity to study snow depth using ICESat-2 lidar multiple scattering measurements from snow. This article is the second part of our study on deriving snow depth directly from ICESat-2 measured snow surface and subsurface photons. Part I (Hu Y. et al. (2022)) presents the theoretical basis from Monte Carlo lidar radiative transfer simulation and the retrieved snow depth results over Antarctic ice sheet and Arctic sea ice from ICESat-2 lidar multiple scattering measurements. This article (Part II) examines the ICESat-2 derived snow depth via comparisons with co-located suborbital IceBridge measured snow depth values on sea ice (Kurtz et al., 2013), climatological snow depth (Warren et al., 1999), and the terrestrial snow depth products available from the National Snow and Ice Data Center (NSIDC) (Brown and Brasnett, 2010; Zeng et al., 2018). The possible sources of errors in estimating snow depths from ICESat-2 lidar multiple scattering measurements are discussed and quantified to enable further improvements and corrections to the techniques presented in this study, including snow surface morphology, atmospheric aerosol forward scattering, solar background noise, and detector dark current. Using the methodology presented in this study, ICESat-2 is found to be a highly capable system for quantification of global snow depth at very fine spatial scales.
Data Sets
In this section, we provide a brief description of the ICESat-2 ATL03 global geolocated photon data and other snow depth data sets used in this article.
ICESat-2 ATL03 Photon Data
The analysis and snow depth results presented in this work use version 5 of ICESat-2 ATL03 geolocated photon data (Neumann et al., 2021), which are distributed in HDF5 format in granules spanning ∼1/14 of a complete orbit and are publicly available through NSIDC (https://nsidc.org/data/ATL03). The ATL03 product was designed to be a single source for all photon data and ancillary information (e.g., the ATLAS impulse response function) required by one or more higher level data products (Neumann et al., 2018). Each individual photon in the ATL03 product is time tagged and geolocated. We aggregate snow surface returned photons from three strong beams over 10 consecutive laser pulses (∼7 m along-track direction) to increase the signal-to-noise ratio of surface vertical profiles (e.g., Figure 1)
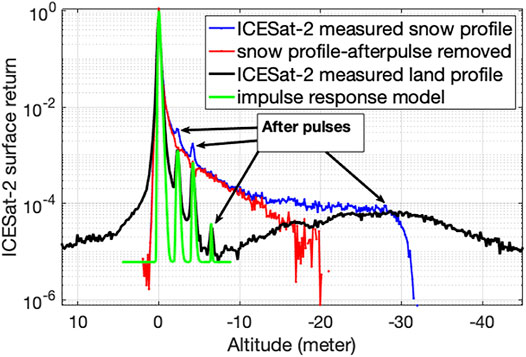
FIGURE 1. Snow profiles measured by ICESat-2 before (blue) and after (red) deconvolution process, and its system impulse response from model (green) and land surface return (black). Altitude zero is the snow surface and altitudes below and above snow surface are negative and positive values, respectively.
IceBridge Snow Depth
The IceBridge airborne radar system measures the return radar signal as a function of time. Snow depth is then determined by detecting the snow-air and snow-ice interfaces within the radar waveform and multiplying the time separation between the interfaces by the speed of light within the snowpack. Details of the snow depth retrieval process from IceBridge snow radar are provided in Kurtz and Farrell (2011), Farrell et al. (2012), Kurtz et al. (2013), and Newman et al. (2014).
The IceBridge product (IDCSI4) available in ASCII format via NSIDC contains three fundamentally important sea ice properties: sea ice freeboard, snow depth, and sea ice thickness (Kurtz et al., 2015). The snow radar has a footprint size of 11 m across track and 14.5 m along track. The snow depth data are averaged in the along-track direction to a 40-m length scale. IceBridge suborbital campaigns were conducted on an annual repeating basis from 2009 to 2019. The snow depth data from IceBridge Arctic campaigns in April 2019 are compared against co-located ICESat-2 retrieved snow depths shown in Methodology.
UA Daily 4 km Gridded Snow Depth From Assimilated In Situ and Modeled Data
The University of Arizona (UA) daily 4 km gridded snow data set (Version 1) used in this study was developed by consistently assimilating 1) in situ measurements of snow water equivalent (SWE) and snow depth at thousands of stations from the U.S. Department of Agriculture Natural Resources Conservation Service and California Department of Water Resources Snow Telemetry (SNOTEL) network (Serreze et al., 1999), 2) Parameter-elevation Regressions on Independent Slopes Model (PRISM) daily 4 km gridded precipitation and temperature data (Daly et al., 2000), and 3) snow depth data from the National Weather Service’s Cooperative Observer (COOP) network (Broxton et al., 2016a; Dawson et al., 2017; Zeng et al., 2018). This snow product provides daily 4 km-spacing snow depth over the conterminous United States from 1981 to 2020, and is available at NSIDC (Broxton et al., 2019). In particular, it has passed five rigorous tests: point-to-point interpolations (Broxton et al., 2016a), point-to-grid interpolations (Broxton et al., 2016b), evaluations against independent snow cover extent data (Dawson et al., 2018), evaluations against independent airborne lidar snow depth measurements (Dawson et al., 2018), and evaluations against independent airborne Gamma SWE measurements (Cho et al., 2020). As a reliable gridded snow product over the conterminous United Sates, the UA daily 4-km gridded snow depth is used to evaluate ICESat-2 retrieved snow depth over mountainous terrain.
Canadian Meteorological Centre Daily Snow Depth (Version 1)
The CMC version 1 snow product includes daily analyzed snow depths, monthly means and climatologies of snow depth, and estimated SWE from 1998 through 2020 over the Northern Hemisphere with a standard 24-km polar stereographic grid (Brown and Brasnett, 2010). The snow depth analysis is performed using real time, in situ daily snow depth observations, and optimal interpolation with a first-guess field generated from a simple snow accumulation and melt mode. The CMC snow depth analysis is not homogeneous in data-sparse regions, such as Arctic and mountain regions. In the locations where there are no observations of snow depth, the snow depth shown in the analysis corresponds to the initial guess field using simplified assumptions regarding snowfall, melt, and aging. Here the CMC daily 24-km gridded snow depth is used to compare with ICESat-2 retrieved terrestrial snow depth in the Northern Hemisphere, where the higher quality UA 4-km gridded snow depth product is not available at latitudes >50°N.
Snow Depth Climatology
The widely used snow depth climatology in the Arctic was developed by Warren et al. (1999) based on stake measurements and survey lines located on multiyear sea ice during the period 1954F02D1991. The monthly mean of snow depth can be obtained from a two-dimensional quadratic function, which was fitted by a least squares procedure to the measured snow depth values (Warren et al., 1999). The climatology of snow depth is most applicable to areas containing a high proportion of multiyear ice, such as north of the coasts of Greenland and Ellesmere Island (Newman et al., 2014). As a result, the climatology may no longer provide accurate snow depth due to the large observed loss of multiyear ice in recent years (Kurtz and Farrell, 2011). In this study, the climatology is used to show the geographical pattern of the snow depth along ICESat-2 ground tracks (e.g., Figure 4).
Methodology
In this section, we describe the methods used to retrieve snow depth from the ICESat-2 measured snow multiple scattering profiles. First, a deconvolution method to remove the time delay due to instrument artifacts is briefly described. The snow depth is then derived from the corrected multiple scattering photon pathlength distribution in snow.
Deconvolution to Remove After Pulses Artifacts on Snow Profiles
One characteristic of ICESat-2 detected photons is the possible presence of after pulses, defined as small amplitude pulses occurring after the primary signal pulse (Martino et al., 2020; Lu et al., 2021b). The after pulses can be orders of magnitude stronger than the subsurface signals. As a result, users of ICESat-2 ATL03 data should use extreme caution when extracting information from the subsurface photons, such as ocean subsurface phytoplankton properties retrievals (Lu et al., 2020b; 2021a).
The ICESat-2 observed signal
Figure 2 shows the ICESat-2 measured snow backscattering signal before (
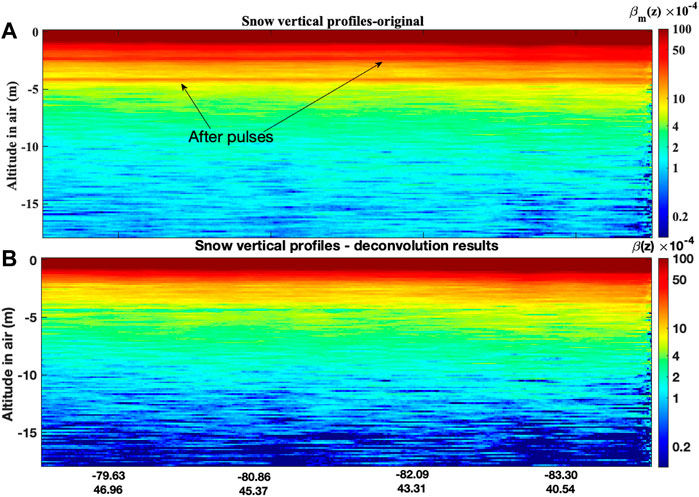
FIGURE 2. Snow profiles derived from ICESat-2 measurements along ground track over Antarctica before (A) and after (B) deconvolution. The after-pulse effects are correctly removed by deconvolution process. The colors represent the photon counts normalized by the snow surface photons. The snow surface is set to be at 0 m. Altitudes below the snow surface are represented as negative values.
Snow Depth Retrieval From ICESat-2 Data
Based on diffusion theory and Monte Carlo simulations, the snow depth (h) can be derived from the first- (method 1), second- (method 2), and third-order (method 3) moments of the snow multiple scattering photon path distribution p(z) measured by ICESat-2 [Hu Y. et al. (2022)]:
where p(z) =
The advantage of the snow depth method, which uses the ICESat-2 measured snow multiple scattering photon path distribution (snow vertical profiles), is that this method does not need 1) local tide and geoid values for surface elevation retrievals, 2) any reference DEM models, and 3) snow-off measurements (Shean et al., 2021; Hu X. et al., 2022). Compared with snow depth from passive microwave radiometers such as AMSR2 snow depth, the proposed ICESat-2 snow depth method can be applied to first year, multiyear sea ice, and terrestrial snow surfaces with a spatial resolution of several meters.
Snow Depth Results
Arctic Snow Results
The technique is applied to snow above Arctic sea ice along ICESat-2 ground tracks on (a) April 12, (b) April 19, and (c) 22 April 2019. The locations of the corresponding ICESat-2 (black lines) and Operation IceBridge (colored lines and curves) field campaign ground tracks are shown in Figure 3. The distances between ICESat-2 and IceBridge ground footprints are up to 4 km. Figure 4 shows the snow depth comparisons from three different sources: ICESat-2 (blue, green, and black curves), IceBridge (gray dots and red), and climatology snow depth (pink) by Warren et al. (1999). The IceBridge snow depths shown in red in Figure 4 are the 3.6-km along track running mean values. The ICESat-2 snow depths in Figure 4 are from the central strong beam measurements (beam 2), which are nearest to IceBridge field campaign (up to 1 km) compared with those from strong beam 1 and beam 3 measurements (up to 4 km).
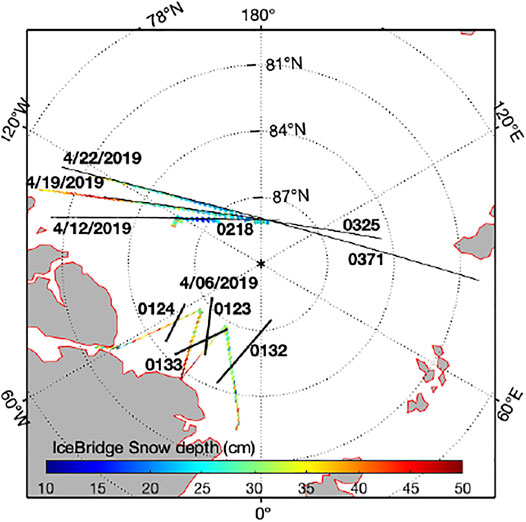
FIGURE 3. The ICESat-2 (black lines labeled with 4 digital numbers indicating the reference ground tracks, RGTs) and IceBridge (colored curves) ground tracks in April 2019 over Arctic sea ice. The color bar represents the IceBridge snow depth in cm.
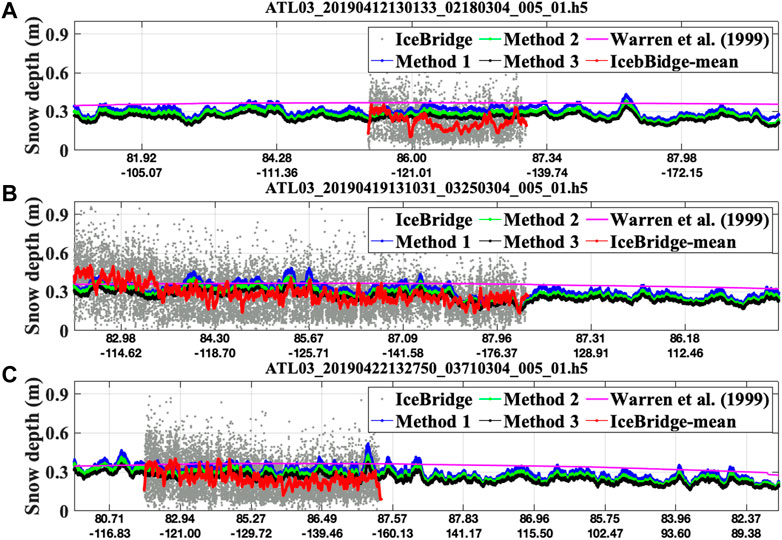
FIGURE 4. Comparison of snow depth from three different sources: ICESat-2 snow depths by Eqs 1–3 (blue, green, and black) from central strong beam, IceBridge snow depth (gray points, red curve), and climatology snow depth (pink) by Warren et al. (1999). The ICESat-2 and IceBridge ground tracks on April 12 (A), 19 (B), and 22 (C), 2019 are shown as black lines in Figure 3.
The proposed snow depth method can be applied to ICESat-2 three strong beams measurements. Figure 5A shows the snow depth comparisons between ICESat-2 (x-axis) and the Operation IceBridge field campaign (y-axis) on April 12, 19, and 22, 2019 from three strong beams where the distances between the two instruments are less than 4 km (for locations see Figure 3). The histograms showing the snow depth distributions and the snow depth differences are given in Figures 5B,C. The statistical results indicate that the mean difference between the two snow depths is ∼1.5 cm with an RMS difference of ∼7.8 cm (or 29.2% of the mean snow depth) and a standard deviation of ∼9.6 cm. On 6 April 2019 (locations shown in Figure 3), 22 crossovers with the distances between ICESat-2 and IceBridge ground tracks less than 15 m are found. Figure 5D shows the scatter plot of snow depth comparison results using the measurements on 6 April 2019. The mean snow depth on 6 April 2019 north of the coasts of Greenland is ∼40 ± 7 cm from ICESat-2, and 41 ± 11 cm from IceBridge (locations shown in Figure 3).
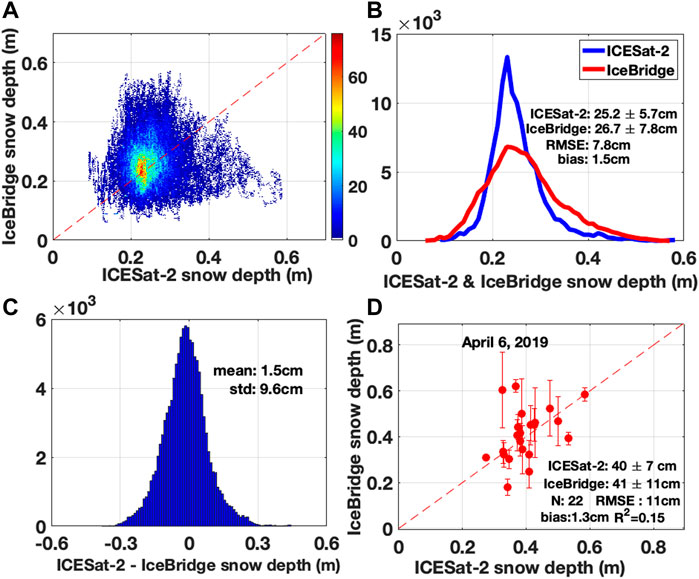
FIGURE 5. (A) Comparison of snow depth: ICESat-2 (x-axis) versus co-located IceBridge snow radar (y-axis). Co-location is found when the footprints distances between two instruments are less than 4 km. The color bar represents the number of co-located observations. (B) Histogram of ICESat-2 and IceBridge snow depth distributions. (C) Histogram showing the snow depth differences between ICESat-2 and IceBridge. (D) Scatter plots between ICESat-2 and IceBridge snow depths at the crossovers on 6 April 2019 (see Figure 3), where the distances between the two instruments are less than 15 m.
Terrestrial Snow Results
An accurate knowledge of snow depth in mountain catchments is critical for applications in hydrology and ecology. This section presents the ICESat-2 retrieved snow depth over land surface including mountainous terrain. Figure 6 shows the snow depth comparisons from three different sources on 27 March 2020: ICESat-2 snow depth by Eq. 1 (blue), UA daily 4 km gridded snow product (red), and CMC daily 24 km gridded snow product (green). The ICESat-2 results in panels a, b, and c are from strong beam 1, 2, and 3 measurements, respectively, which are separated by ∼3.3 km in the across-track direction. The corresponding ICESat-2 ground track is shown as solid black line in Figure 7A, where the background color is the snow depth in meters from UA daily 4 km gridded snow product on 27 March 2020. The ICESat-2 retrieved snow depths are in good general agreement with the daily gridded snow depths.
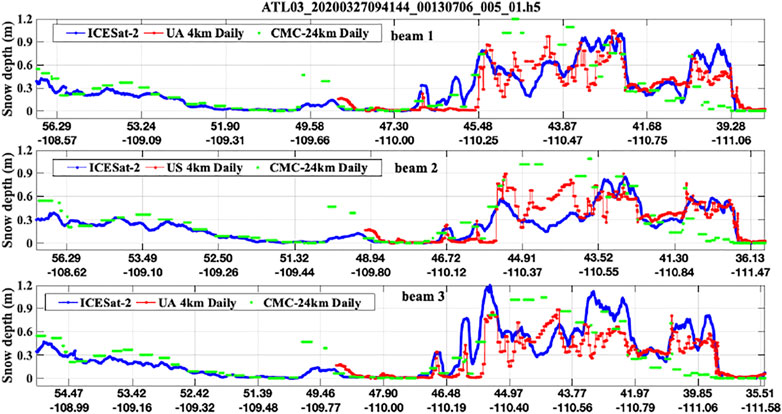
FIGURE 6. The snow depth comparisons on 27 March 2020 from three different sources: ICESat-2 (blue), UA daily 4 km gridded snow product (red), and CMC daily 24 km gridded snow product (green). The ICESat-2 ground track is shown as solid black line in Figure 7A. Note that the locations of x-axis are different in the three panels for ICESat-2 three strong beams, which are separated by ∼3.3 km in the across-track direction.
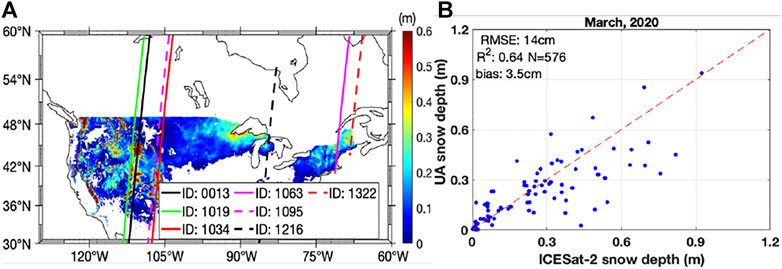
FIGURE 7. (A) ICESat-2 ground tracks (lines) labeled with track RGTs over land surface in March 2020, the background color is the snow depth in meters from UA daily 4 km gridded snow product on 27 March 2020. (B) Scatter plots between ICESat-2 and UA daily gridded snow depths in March 2020. The distances between the ICESat-2 footprints and the center of gridded pixels are less than 50 m.
The results of Figure 6 show that the snow depths can be more than 90 cm or lower than 10 cm over mountainous terrain for latitudes from 39°N to 46°N. The average snow depth between these latitudes from the three panels is 54 ± 23 cm from ICESat-2, 50 ± 17 cm from the UA 4-km product, and 69 ± 49 cm from the CMC 24-km product. The RMS difference between ICESat-2 and UA snow depth is 21 cm, while the RMS difference between UA and CMC snow depth is 37 cm. These results suggest that the agreement between the ICESat-2 and UA data is much better than that between the CMC and UA data. The snow depth disagreement shown in Figure 6 and the errors of ICESat-2 retrieved snow depth due to surface roughness are discussed in Discussion.
Figure 7B presents the snow depth comparisons between ICESat-2 and UA daily 4 km gridded snow product in March 2020, which includes the cases with the distance between ICESat-2 ground track and the center of gridded pixels less than 50 m. The corresponding ICESat-2 ground tracks in March 2020 are shown as lines in Figure 7A. The RMS difference between the two snow depths is ∼14 cm, or 28% of the mean snow depth from the UA 4-km product.
Discussion
The results in Snow Depth Results indicate the overall reasonable performance of snow depth derived from the ICESat-2 lidar multiple scattering measurements. The snow depth disagreement shown in Figure 6 is mainly due to the different spatial resolutions and the snow depth variances within gridded pixels because the daily gridded snow depths are the mean values within each 4 km/or 24 km gridded pixel. On the other hand, the snow depth can vary within 4 km/or 24 km pixels especially over mountain regions. The measurements time differences are another reason for the snow depth disagreement shown in Figure 6. The gridded daily snow depth is the average value within each day, while the ICESat-2 measurement was made at a specific time on each day, such as from 9:42 to 9:50 UTC along ground tracks shown in Figure 6 on 27 March 2020.
We recognize that some of the errors are partly caused by the tracks not exactly overlapping between ICESat-2 and IceBridge (e.g., Figure 5D), and by the inherent differences between a line (from ICESat-2) and a grid box (from the UA data). However, some of the errors may also be caused by noise in the ICESat-2 measured snow profiles. The shape of the ICESat-2 snow profiles (e.g., Figures 1, 2) can be affected primarily by Eq. 1 the system impulse response (e.g., transmitted pulse shape), 2) forward scattering in the atmosphere (e.g., Figures 3, 8), the surface height distribution within the footprint. As a result, the photon path delay due to internal optical reflections in the receiver system (Martino et al., 2020; Lu et al., 2021b), the atmospheric forward scattering (Yang et al., 2011), and the surface roughness or slope within the ICESat-2 laser footprint (∼11 m) are the error sources on the retrieved snow depths from the ICESat-2 measured snow multiple scattering photon pathlength distribution.
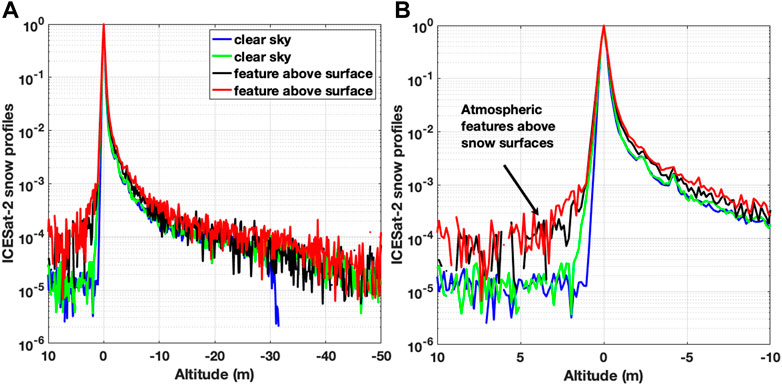
FIGURE 8. (A) Snow profiles derived from the ICESat-2 data under different atmospheric conditions over Antarctica: almost clear sky (blue and green) and non-clear sky (black and red). (B) Same as (A) but zooming in to the altitude range of 10 to −10 m. The pulse stretching of snow profiles due to atmospheric forward scattering can be clearly seen from black and red curves.
Lu et al. (2021b) have demonstrated that the ATLAS system impulse response during different months and over different surface types is essentially identical. The deconvolution method described in Deconvolution to Remove After Pulses Artifacts on Snow Profiles can effectively remove the photon delays due to system after pulses artifacts (see Figures 1, 2). Atmospheric cloud/or aerosol forward scattering can also increase the photon pathlength (Yang et al., 2011). Figure 8 shows the effects of forward atmospheric scattering on the snow profiles over Antarctica (red and black curves). Compared to profiles of clear skies shown in blue and green colors in Figure 8, the snow profiles for non-clear skies are stretched. The roughness and slope characteristics of the snow surface have a similar influence on the reflected pulse shape (Gardner, 1982; Zwally et al., 2002).
As a simplification, the rough snow surface is assumed to be Gaussian as,
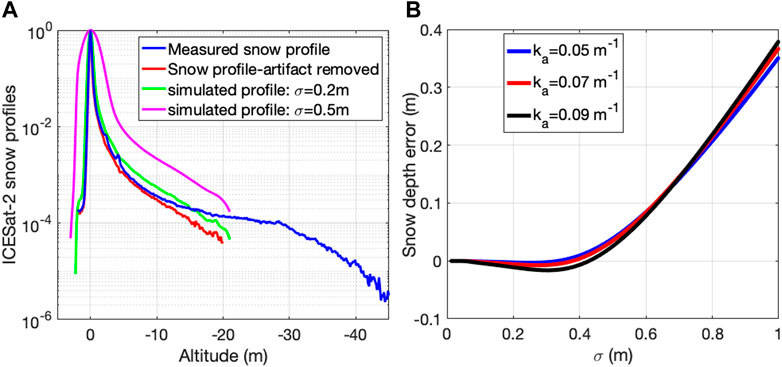
FIGURE 9. (A) The ICESat-2 snow profile before (blue) and after (red) removing after pulses delays, simulated snow profiles with σ = 0.2 m (green) and σ = 0.5 m (pink). (B) Snow depth errors due to the pulse stretching widths with different snow absorption coefficients (ka, m−1).
Another error source on the snow depth retrieval is the photon count noise from the solar background and the detector dark current, which can add noise to the observed snow multiple scattering photon pathlength. Our previous results indicate that the solar background noise is ∼3–4 orders of magnitude lower than the snow surface backscattered signals at 532 nm and is a function of the solar zenith angle (Lu et al., 2021b). The retrieved snow depth can be ∼5–20 cm higher if the solar background is not removed from the ICESat-2 measured snow photon counts during daytime. For the analysis of daytime measurements, we use the solar background photon counts reported in the ATL03 product. The detector dark count is ∼5–6 orders of magnitude lower than the snow surface backscattered signals, which causes biases less than 0.2 cm on the retrieved snow depth.
Summary
In this article, we demonstrated a suite of new methods to retrieve snow depth from ICESat-2 lidar measurements. The proposed methods use the moments of the ICESat-2 photon pathlength distribution, which have the advantage of not requiring additional auxiliary information such as reference DEM models and snow-off measurements.
The ICESat-2 retrieved snow depth over Arctic sea ice and mountain areas are evaluated based on available Operation IceBridge field campaigns and daily gridded snow datasets. The comparisons indicate that the RMS differences of snow depths between ICESat-2 retrieved values and available snow products are ∼7.8 and ∼14 cm over sea ice and mountain areas, respectively, or about 29.2 and 28% of the mean values. Some possible sources of errors on ICESat-2 derived snow depths are discussed and quantified, including the impact of the surface roughness or slope within the laser footprint, atmospheric forward scattering, solar background, and detector dark noises. Our results indicate that we can expect a relatively high accuracy (errors < 5 cm) from ICESat-2 retrieved snow depth during nighttime observations, under clear sky conditions and over relatively smooth snow surfaces where the standard deviation of the snow surface heights is less than 20 cm within the 11 m ICESat-2 footprint.
The maximum snow depth retrieved by the proposed method depends on the waveform of the snow vertical profiles (e.g., Figure 2, Figure 9A), which depends on the signal-to-noise ratio (SNR) of measured photons backscattered from the snowpack. Given the ICESat-2 SNR, the maximum retrievable snow depth can be up to 10 m when more subsurface photons are downlinked with wider downlink bands. While the proposed new method has been shown to provide reasonable performance and advantages, it is challenging to apply to very shallow snowpack when the photons backscattered from the bottom layer (e.g., sea ice or land surface) exist in the snow multiple scattering photon pathlength. More comprehensive evaluations of the ICESat-2 snow depth product and the potential impacts of topography, vegetation canopy, bottom layer effects, and other factors will be done in part III of our study.
With smaller footprints, high quality and high accuracy of measured photons, ICESat-2 represents a source of snow depths at centimeter-scale accuracy and meter-scale spatial resolution in areas where ICESat-2 measurements are available. ICESat-2 can provide unprecedented records of seasonal snow variability and evolution for mountainous terrain. Moreover, ICESat-2 snow depth results have the potential to support and improve the ICESat-2 sea ice thickness retrieval. Our results strongly support the use of ICESat-2 lidar measurements for global snow depths studies.
Data Availability Statement
The original contributions presented in the study are included in the article/Supplementary Material, further inquiries can be directed to the corresponding author.
Author Contributions
The authors confirm contribution to the paper as follows: study conception and design: YH and XL; draft manuscript preparation: XL; analysis and interpretation of results: All authors reviewed the results and approved the final version of the manuscript.
Funding
Funding for the lead author was provided by the NASA ICESat-2 award (grant numbers 80NSSC21K0910).
Conflict of Interest
Author CW and JL are employed by Ball Aerospace Corp. MG is an employee of SSAI.
The remaining authors declare that the research was conducted in the absence of any commercial or financial relationships that could be construed as a potential conflict of interest.
Publisher’s Note
All claims expressed in this article are solely those of the authors and do not necessarily represent those of their affiliated organizations, or those of the publisher, the editors and the reviewers. Any product that may be evaluated in this article, or claim that may be made by its manufacturer, is not guaranteed or endorsed by the publisher.
Acknowledgments
The authors thank the NASA ICESat-2 program, NASA Remote Sensing Theory program, and NASA ESTO’s IIP program for supporting this research.
References
Abshire, J. B., Sun, X., Riris, H., Sirota, J. M., McGarry, J. F., Palm, S., et al. (2005). Geoscience Laser Altimeter System (GLAS) on the ICESat Mission: On-Orbit Measurement Performance. Geophys. Res. Lett. 32, L21S02. doi:10.1029/2005gl024028
Brown, R. D., and Brasnett, B. (2010). Canadian Meteorological Centre (CMC) Daily Snow Depth Analysis Data, Version 1. Boulder Colo. USA: NASA Natl. Snow Ice Data Cent. Distrib. Act. Arch. Cent. doi:10.5067/W9FOYWH0EQZ3
Broxton, P. D., Dawson, N., and Zeng, X. (2016a). Linking Snowfall and Snow Accumulation to Generate Spatial Maps of SWE and Snow Depth. Earth Space Sci. 3, 246–256. doi:10.1002/2016EA000174
Broxton, P. D., Zeng, X., and Dawson, N. (2016b). Why Do Global Reanalyses and Land Data Assimilation Products Underestimate Snow Water Equivalent? J. Hydrometeorol. 17, 2743–2761. doi:10.1175/JHM-D-16-0056.1
Broxton, P., Zeng, X., and Dawson, N. (2019). Daily 4 Km Gridded SWE and Snow Depth from Assimilated In-Situ and Modeled Data over the Conterminous US, Version 1. Boulder Colo. USA: NASA Natl. Snow Ice Data Cent. Distrib. Act. Arch. Cent. doi:10.5067/0GGPB220EX6A
Brucker, L., and Markus, T. (2013). Arctic-scale Assessment of Satellite Passive Microwave-Derived Snow Depth on Sea Ice Using Operation IceBridge Airborne Data. J. Geophys. Res. Oceans 118, 2892–2905. doi:10.1002/jgrc.20228
Cho, E., Jacobs, J. M., and Vuyovich, C. M. (2020). The Value of Long‐Term (40 Years) Airborne Gamma Radiation SWE Record for Evaluating Three Observation‐Based Gridded SWE Data Sets by Seasonal Snow and Land Cover Classifications. Water Resour. Res. 56, e2019WR025813. doi:10.1029/2019WR025813
Clark, M. P., Hendrikx, J., Slater, A. G., Kavetski, D., Anderson, B., Cullen, N. J., et al. (2011). Representing Spatial Variability of Snow Water Equivalent in Hydrologic and Land-Surface Models: A Review. Water Resour. Res. 47. doi:10.1029/2011WR010745
Daly, C., Taylor, G. H., Gibson, W. P., Parzybok, T. W., Johnson, G. L., and Pasteris, P. A. (2000). High-Quality Spatial Climate Data Sets for the United States and beyond. Trans. ASAE 43, 1957–1962. doi:10.13031/2013.3101
Dawson, N., Broxton, P., and Zeng, X. (2017). A New Snow Density Parameterization for Land Data Initialization. J. Hydrometeorol. 18, 197–207. doi:10.1175/JHM-D-16-0166.1
Dawson, N., Broxton, P., and Zeng, X. (2018). Evaluation of Remotely Sensed Snow Water Equivalent and Snow Cover Extent over the Contiguous United States. J. Hydrometeorol. 19, 1777–1791. doi:10.1175/JHM-D-18-0007.1
Farrell, S. L., Kurtz, N., Connor, L. N., Elder, B. C., Leuschen, C., Markus, T., et al. (2012). A First Assessment of IceBridge Snow and Ice Thickness Data over Arctic Sea Ice. IEEE Trans. Geosci. Remote Sensing 50, 2098–2111. doi:10.1109/TGRS.2011.2170843
Gardner, C. S. (1982). Target Signatures for Laser Altimeters: an Analysis. Appl. Opt. 21, 448–453. doi:10.1364/ao.21.000448
Hu, X., Hao, X., Wang, J., Huang, G., Li, H., and Yang, Q. (2022). Can the Depth of Seasonal Snow Be Estimated from ICESat-2 Products: A Case Investigation in Altay, Northwest China. IEEE Geosci. Remote Sensing Lett. 19, 1–5. doi:10.1109/LGRS.2021.3078805
Hu, Y., Lu, X., Zeng, X., Stamnes, S., Neumann, T. A., Kurtz, N. T., et al. (2022). Deriving Snow Depth from ICESat-2 Lidar Multiple Scattering Measurements. Front. Remote Sensing 3, 855159–453. doi:10.3389/frsen.2022.855159
Hunt, W. H., Winker, D. M., Vaughan, M. A., Powell, K. A., Lucker, P. L., and Weimer, C. (2009). CALIPSO Lidar Description and Performance Assessment. J. Atmos. Ocean. Technol. 26, 1214–1228. doi:10.1175/2009JTECHA1223.1
Kacimi, S., and Kwok, R. (2020). The Antarctic Sea Ice Cover from ICESat-2 and CryoSat-2: Freeboard, Snow Depth, and Ice Thickness. The Cryosphere 14, 4453–4474. doi:10.5194/tc-14-4453-2020
Kelly, R. (2009). The AMSR-E Snow Depth Algorithm: Description and Initial Results. J. Remote Sens. Soc. Jpn. 29, 307–317. doi:10.11440/rssj.29.307
Kilic, L., Tonboe, R. T., Prigent, C., and Heygster, G. (2019). Estimating the Snow Depth, the Snow-Ice Interface Temperature, and the Effective Temperature of Arctic Sea Ice Using Advanced Microwave Scanning Radiometer 2 and Ice Mass Balance Buoy Data. The Cryosphere 13, 1283–1296. doi:10.5194/tc-13-1283-2019
Kurtz, N. T., and Farrell, S. L. (2011). Large-scale Surveys of Snow Depth on Arctic Sea Ice from Operation IceBridge. Geophys. Res. Lett. 38, a–n. doi:10.1029/2011GL049216
Kurtz, N. T., Farrell, S. L., Studinger, M., Galin, N., Harbeck, J. P., Lindsay, R., et al. (2013). Sea Ice Thickness, Freeboard, and Snow Depth Products from Operation IceBridge Airborne Data. The Cryosphere 7, 1035–1056. doi:10.5194/tc-7-1035-2013
Kurtz, N. T., Studinger, M., Harbeck, J., Onana, V., and Yi, D. (2015). Boulder Colo. USA: NASA Natl. Snow Ice Data Cent. Distrib. Act. Arch. Cent. doi:10.5067/G519SHCKWQV6IceBridge L4 Sea Ice Freeboard, Snow Depth, and Thickness, Version 1
Kwok, R., Kacimi, S., Webster, M. A., Kurtz, N. T., and Petty, A. A. (2020). Arctic Snow Depth and Sea Ice Thickness from ICESat‐2 and CryoSat‐2 Freeboards: A First Examination. JGR Oceans 125, e2019JC016008. doi:10.1029/2019JC016008
Kwok, R., Kurtz, N. T., Brucker, L., Ivanoff, A., Newman, T., Farrell, S. L., et al. (2017). Intercomparison of Snow Depth Retrievals over Arctic Sea Ice from Radar Data Acquired by Operation IceBridge. The Cryosphere 11, 2571–2593. doi:10.5194/tc-11-2571-2017
Lejeune, Y., Dumont, M., Panel, J.-M., Lafaysse, M., Lapalus, P., Le Gac, E., et al. (2019). 57 years (1960-2017) of snow and meteorological observations from a mid-altitude mountain site (Col de Porte, France, 1325 m of altitude). Earth Syst. Sci. Data 11, 71–88. doi:10.5194/essd-11-71-2019
Lievens, H., Brangers, I., Marshall, H.-P., Jonas, T., Olefs, M., and De Lannoy, G. (2022). Sentinel-1 Snow Depth Retrieval at Sub-kilometer Resolution over the European Alps. The Cryosphere 16, 159–177. doi:10.5194/tc-16-159-2022
Liu, Z., Zhu, J., Fu, H., Zhou, C., and Zuo, T. (2020). Evaluation of the Vertical Accuracy of Open Global DEMs over Steep Terrain Regions Using ICESat Data: A Case Study over Hunan Province, China. Sensors 20, 4865. doi:10.3390/s20174865
Lu, X., Hu, Y., Vaughan, M., Rodier, S., Trepte, C., Lucker, P., et al. (2020a). New Attenuated Backscatter Profile by Removing the CALIOP Receiver's Transient Response. J. Quantitative Spectrosc. Radiative Transfer 255, 107244. doi:10.1016/j.jqsrt.2020.107244
Lu, X., Hu, Y., Yang, Y., Bontempi, P., Omar, A., and Baize, R. (2020b). Antarctic spring Ice-Edge Blooms Observed from Space by ICESat-2. Remote Sensing Environ. 245, 111827. doi:10.1016/j.rse.2020.111827
Lu, X., Hu, Y., Yang, Y., Neumann, T., Omar, A., Baize, R., et al. (2021a). New Ocean Subsurface Optical Properties from Space Lidars: CALIOP/CALIPSO and ATLAS/ICESat‐2. Earth Space Sci. 8, e2021EA001839. doi:10.1029/2021EA001839
Lu, X., Hu, Y., Yang, Y., Vaughan, M., Palm, S., Trepte, C., et al. (2021b). Enabling Value Added Scientific Applications of ICESat‐2 Data with Effective Removal of Afterpulses. Earth Space Sci. 8, e2021EA001729. doi:10.1029/2021EA001729
Magruder, L. A., Brunt, K. M., and Alonzo, M. (2020). Early ICESat-2 On-Orbit Geolocation Validation Using Ground-Based Corner Cube Retro-Reflectors. Remote Sensing 12, 3653. doi:10.3390/rs12213653
Magruder, L. A., and Brunt, K. M. (2018). Performance Analysis of Airborne Photon- Counting Lidar Data in Preparation for the ICESat-2 Mission. IEEE Trans. Geosci. Remote Sensing 56, 2911–2918. doi:10.1109/TGRS.2017.2786659
Markus, T., and Cavalieri, D. J. (1998). “Snow Depth Distribution over Sea Ice in the Southern Ocean from Satellite Passive Microwave Data,” in Antarctic Sea Ice: Physical Processes, Interactions and Variability (American Geophysical Union), 19–39. doi:10.1029/AR074p0019
Markus, T., Neumann, T., Martino, A., Abdalati, W., Brunt, K., Csatho, B., et al. (2017). The Ice, Cloud, and Land Elevation Satellite-2 (ICESat-2): Science Requirements, Concept, and Implementation. Remote Sensing Environ. 190, 260–273. doi:10.1016/j.rse.2016.12.029
Martino, A., Field, C. T., and Ramos-Izquierdo, L. (2020). ICESat-2/ATLAS Instrument Linear System Impulse Response. Earth and Space Science Open Archive. doi:10.1002/essoar.10504651.1
Martino, A. J., Neumann, T. A., Kurtz, N. T., and McLennan, D. (2019). “ICESat-2 mission Overview and Early Performance,” in Proceedings of the SPIE. doi:10.1117/12.2534938
Ménard, C. B., Essery, R., Barr, A., Bartlett, P., Derry, J., Dumont, M., et al. (2019). Meteorological and Evaluation Datasets for Snow Modelling at 10 Reference Sites: Description of In Situ and Bias-Corrected Reanalysis Data. Earth Syst. Sci. Data 11, 865–880. doi:10.5194/essd-11-865-2019
Mortimer, C., Mudryk, L., Derksen, C., Luojus, K., Brown, R., Kelly, R., et al. (2020). Evaluation of Long-Term Northern Hemisphere Snow Water Equivalent Products. The Cryosphere 14, 1579–1594. doi:10.5194/tc-14-1579-2020
Neuenschwander, A., Pitts, K. L., Jelley, B. P., Robbins, J., Klotz, B., Popescu, S. C., et al. (2021). Boulder Colo. USA: NASA Natl. Snow Ice Data Cent. Distrib. Act. Arch. Cent. doi:10.5067/ATLAS/ATL08.005ATLAS/ICESat-2 L3A Land and Vegetation Height, Version 5
Neumann, T. A., Brenner, A., Hancock, D., Robbins, J., Saba, J., Harbeck, K., et al. (2021). Boulder, Colorado USA: NASA National Snow and Ice Data Center Distributed Active Archive Center. doi:10.5067/ATLAS/ATL03.005ATLAS/ICESat-2 L2A Global Geolocated Photon Data, Version 5
Neumann, T. A., Martino, A. J., Markus, T., Bae, S., Bock, M. R., Brenner, A. C., et al. (2019). The Ice, Cloud, and Land Elevation Satellite - 2 mission: A Global Geolocated Photon Product Derived from the Advanced Topographic Laser Altimeter System. Remote Sensing Environ. 233, 111325. doi:10.1016/j.rse.2019.111325
Neumann, T., Brenner, A., Hancock, D., Robbins, J., Saba, J., and Harbeck, K. (2018). ICE, CLOUD, and Land Elevation Satellite - 2 (ICESat-2) Project Algorithm Theoretical Basis Document (ATBD) for Global Geolocated Photons ATL03. NASA Goddard Space Flight CenterGreenbelt. doi:10.5067/T0HGP0893I9R
Newman, T., Farrell, S. L., Richter-Menge, J., Connor, L. N., Kurtz, N. T., Elder, B. C., et al. (2014). Assessment of Radar-Derived Snow Depth over Arctic Sea Ice. J. Geophys. Res. Oceans 119, 8578–8602. doi:10.1002/2014JC010284
Pulliainen, J., Luojus, K., Derksen, C., Mudryk, L., Lemmetyinen, J., Salminen, M., et al. (2020). Patterns and Trends of Northern Hemisphere Snow Mass from 1980 to 2018. Nature 581, 294–298. doi:10.1038/s41586-020-2258-0
Serreze, M. C., Clark, M. P., Armstrong, R. L., McGinnis, D. A., and Pulwarty, R. S. (1999). Characteristics of the Western United States Snowpack from Snowpack Telemetry (SNOTEL) Data. Water Resour. Res. 35, 2145–2160. doi:10.1029/1999WR900090
Shean, D. E., Bhushan, S., Smith, B. E., Besso, H., Sutterley, T. C., Swinski, J.-P., et al. (2021). “Evaluating and Improving Seasonal Snow Depth Retrievals with Satellite Laser Altimetry,” in AGU Fall Meet., C33B–C04.
Takala, M., Luojus, K., Pulliainen, J., Derksen, C., Lemmetyinen, J., Kärnä, J.-P., et al. (2011). Estimating Northern Hemisphere Snow Water Equivalent for Climate Research through Assimilation of Space-Borne Radiometer Data and Ground-Based Measurements. Remote Sensing Environ. 115, 3517–3529. doi:10.1016/j.rse.2011.08.014
Treichler, D., and Kääb, A. (2017). Snow Depth from ICESat Laser Altimetry - A Test Study in Southern Norway. Remote Sensing Environ. 191, 389–401. doi:10.1016/j.rse.2017.01.022
Tutton, R. J., and Way, R. G. (2021). A Low-Cost Method for Monitoring Snow Characteristics at Remote Field Sites. The Cryosphere 15, 1–15. doi:10.5194/tc-15-1-2021
Wagner, D. N., Shupe, M. D., Persson, O. G., Uttal, T., Frey, M. M., Kirchgaessner, A., et al. (2021). Snowfall and Snow Accumulation Processes during the MOSAiC winter and spring Season. Cryosphere Discuss. 2021, 1–48. doi:10.5194/tc-2021-126
Warren, S. G., Rigor, I. G., Untersteiner, N., Radionov, V. F., Bryazgin, N. N., Aleksandrov, Y. I., et al. (1999). Snow Depth on Arctic Sea Ice. J. Clim. 12, 1814–1829. doi:10.1175/1520-0442(1999)012<1814:sdoasi>2.0.co;2
Yuekui Yang, Y., Marshak, A., Palm, S. P., Varnai, T., and Wiscombe, W. J. (2011). Cloud Impact on Surface Altimetry from a Spaceborne 532-nm Micropulse Photon-Counting Lidar: System Modeling for Cloudy and Clear Atmospheres. IEEE Trans. Geosci. Remote Sensing 49, 4910–4919. doi:10.1109/TGRS.2011.2153860
Zeng, X., Broxton, P., and Dawson, N. (2018). Snowpack Change from 1982 to 2016 over Conterminous United States. Geophys. Res. Lett. 45 (12), 940–1012. doi:10.1029/2018GL079621
Keywords: snow depth, snow water equivalent, ICESat-2 lidar, pathlength distribution, multiple scattering
Citation: Lu X, Hu Y, Zeng X, Stamnes SA, Neuman TA, Kurtz NT, Yang Y, Zhai P-W, Gao M, Sun W, Xu K, Liu Z, Omar AH, Baize RR, Rogers LJ, Mitchell BO, Stamnes K, Huang Y, Chen N, Weimer C, Lee J and Fair Z (2022) Deriving Snow Depth From ICESat-2 Lidar Multiple Scattering Measurements: Uncertainty Analyses. Front. Remote Sens. 3:891481. doi: 10.3389/frsen.2022.891481
Received: 07 March 2022; Accepted: 01 April 2022;
Published: 29 April 2022.
Edited by:
Jing Li, Peking University, ChinaReviewed by:
Feng Xu, University of Oklahoma, United StatesFrédéric Frappart, INRAE Nouvelle-Aquitaine Bordeaux, France
Copyright © 2022 Lu, Hu, Zeng, Stamnes, Neuman, Kurtz, Yang, Zhai, Gao, Sun, Xu, Liu, Omar, Baize, Rogers, Mitchell, Stamnes, Huang, Chen, Weimer, Lee and Fair. This is an open-access article distributed under the terms of the Creative Commons Attribution License (CC BY). The use, distribution or reproduction in other forums is permitted, provided the original author(s) and the copyright owner(s) are credited and that the original publication in this journal is cited, in accordance with accepted academic practice. No use, distribution or reproduction is permitted which does not comply with these terms.
*Correspondence: Xiaomei Lu, eGlhb21laS5sdUBuYXNhLmdvdg==