 Joseph S. Schlosser1
 Snorre Stamnes2*
 Sharon P. Burton2
 Brian Cairns3
 Ewan Crosbie2,4
 Bastiaan Van Diedenhoven5
 Glenn Diskin2
 Sanja Dmitrovic6
 Richard Ferrare2
 Johnathan W. Hair2
 Chris A. Hostetler2
 Yongxiang Hu2
 Xu Liu2
 Richard H. Moore2Taylor Shingler2
 Michael A. Shook2Kenneth Lee Thornhill2,4Edward Winstead2,4
 Luke Ziemba2
 Armin Sorooshian1,6,7*
- 1University of Arizona, Department of Chemical and Environmental Engineering, Tucson, AZ, United States
- 2NASA Langley Research Center, Hampton, VA, United States
- 3NASA Goddard Institute for Space Studies, New York, NY, United States
- 4Science Systems and Applications, Inc., Lanham, MD, United States
- 5Netherlands Institute for Space Research, Utrecht, Netherlands
- 6University of Arizona, James C. Wyant College of Optical Sciences, Tucson, AZ, United States
- 7University of Arizona, Department of Hydrology and Atmospheric Sciences, Tucson, AZ, United States
In this study, we propose a simple method to derive vertically resolved aerosol particle number concentration (Na) using combined polarimetric and lidar remote sensing observations. This method relies on accurate polarimeter retrievals of the fine-mode column-averaged aerosol particle extinction cross section and accurate lidar measurements of vertically resolved aerosol particle extinction coefficient such as those provided by multiwavelength high spectral resolution lidar. We compare the resulting lidar + polarimeter vertically resolved Na product to in situ Na data collected by airborne instruments during the NASA aerosol cloud meteorology interactions over the western Atlantic experiment (ACTIVATE). Based on all 35 joint ACTIVATE flights in 2020, we find a total of 32 collocated in situ and remote sensing profiles that occur on 11 separate days, which contain a total of 322 cloud-free vertically resolved altitude bins of 150 m resolution. We demonstrate that the lidar + polarimeter Na agrees to within 106% for 90% of the 322 vertically resolved points. We also demonstrate similar agreement to within 121% for the polarimeter-derived column-averaged Na. We find that the range-normalized mean absolute deviation (NMAD) for the polarimeter-derived column-averaged Na is 21%, and the NMAD for the lidar + polarimeter-derived vertically resolved Na is 16%. Taken together, these findings suggest that the error in the polarimeter-only column-averaged Na and the lidar + polarimeter vertically resolved Na are of similar magnitude and represent a significant improvement upon current remote sensing estimates of Na.
1 Introduction
Aerosol particle number concentration (Na) is an important aerosol microphysical property for many applications including air quality and aerosol–cloud interactions. Historically, Na has been difficult to retrieve from remote sensing measurements that are sensitive to the aerosol scattering cross section, which scales with Na to the first power and particle diameter (D) to a higher power. Thus, uncertainty in the aerosol size distribution translates directly into a much greater uncertainty in the retrieved Na than would be the case when trying to retrieve the higher order moments of the aerosol population (e.g., surface area and volume) (Knobelspiesse et al., 2011; Georgoulias et al., 2020). While still limited to optically-active particles (i.e., D ≳ 150 nm), the combination of next-generation polarimeter and lidar measurements makes the retrieval of Na possible. First, multi-angle, multichannel polarimeter observations, such as those from the research scanning polarimeter (RSP), allow for accurate retrieval of column-averaged fine- and coarse-mode aerosol properties (Cairns et al., 1999; Stamnes et al., 2018). Second, multiwavelength high spectral resolution lidar (HSRL-2) measurements provide accurate, vertically resolved measurements of aerosol extinction and depolarization (Hair et al., 2008). The HSRL-2 observations also provide accurate (within ∼30 m) retrieval of the mixed layer height (MLH, Scarino et al., 2014).
A previous study demonstrated a median relative bias between HSRL-2 lidar- and in situ–derived Na of 33% and 47%; the lidar-derived Na was retrieved by inverting HSRL-2–only aerosol products to produce vertically resolved Na (Sawamura et al., 2017; Müller et al., 2019). In this study, we demonstrate a simple yet powerful method that uses combined lidar and polarimeter aerosol products to derive vertically resolved Na in the troposphere that has a median relative bias of 30%. This lidar + polarimeter method has the benefit of being able to rapidly take advantage of column-averaged fine-mode aerosol cross section retrieved by polarimeters such as the RSP and collocated lidar measurements of aerosol extinction coefficient at 532 nm from HSRL lidar such as the HSRL-2 and HSRL-1. However, the two approaches are complementary, particularly since HSRL-2–type lidar with an added 355 nm channel are capable of retrieving the vertically resolved aerosol effective radius, which is one of the main parameters that determines the aerosol extinction cross section, and can be used together with the column-averaged fine- and coarse-mode effective radii retrieved by polarimeters such as RSP to correct the column-averaged aerosol extinction cross section for vertical changes due to changes in aerosol size. Since the lidar + polarimeter method presented in this study requires only profiles of the extinction coefficient at 532 nm, it can be readily applied to lidar + polarimeter data sets that have high spectral resolution capability at 532 nm, such as the NASA airborne HSRL-1 and HSRL-2 lidar, and the HSRL-1–type lidar system that will be onboard the future NASA atmosphere observing system (AOS) mission that is expected to launch by 2030.
Both aerosol index (AI) and aerosol optical depth (AOD) are commonly used as proxies for vertically variable cloud condensation nuclei (CCN) concentrations to quantify aerosol–cloud interactions, but there are limitations to using such proxies. The aerosol index convolves the Na, size, single-scattering albedo, and complex refractive index into one number, and the accurate retrieval of AI can be subject to accuracy issues depending on which wavelengths are used (Buchard et al., 2015; Hammer et al., 2016). Furthermore, the relationships between AOD (or AI) and cloud drop number concentration (Nd) in pre-industrial and present-day conditions are different, whereas the relationship between CCN and Nd is similar in both of these periods (Gryspeerdt et al., 2017; Grosvenor et al., 2018). It is therefore highly desirable to use observational data to retrieve an aerosol proxy that is as close to CCN as possible since such relationships are expected to be more robust than those using more distant proxies such as AOD and AI (Shinozuka et al., 2015; Hasekamp et al., 2019). A significantly more direct proxy for CCN is the vertically resolved accumulation mode Na.
There have only been a limited number of aerosol–cloud interaction studies that are historically focused on the western North Atlantic Na (Sorooshian et al., 2020), but its gradients of low to high aerosol number concentrations provide an excellent environment to demonstrate the capability to remotely sense Na (Quinn et al., 2019; Dadashazar et al., 2021b,a). For the majority of the year, the western North Atlantic’s persistent cloud cover, only temporarily interspersed with clear-sky conditions of broken cloud fields, makes passive remote sensing measurements of aerosol properties in this region very challenging (Feingold, 2003; Braun et al., 2021; Painemal et al., 2021). Methods to process polarimeter and lidar data that perform well across the extreme situations encountered in the western North Atlantic may be expected to work well globally. For this study, we use measurements from the first two deployments of ACTIVATE in 2020.
The first and second ACTIVATE deployments were carried out from 14 February to 12 March 2020 and from 13 August to 30 September 20, respectively. ACTIVATE features a unique data set collected during 35 joint science flights with two aircraft flying in synchronous flight patterns (Sorooshian et al., 2019). One of the two ACTIVATE aircraft, a Beechcraft King Air, was collecting remote sensing data (i.e., lidar and polarimetry) while flying at high altitudes between 8 and 9 km. Simultaneously, the second aircraft, a HU-25 Falcon, was collecting in situ data while operating between the ocean surface and the top of the PBL. Throughout ACTIVATE, these two aircraft operated with close spatiotemporal proximity (within 6 min and 15 km) to each other whenever possible.
The experimental design and study region of ACTIVATE offer an ideal opportunity to evaluate the reliability of the novel vertically resolved Na developed in this work. First, in Section 2, we present the instrumentation and corresponding measurements used from the each of the two aircraft to both produce and validate vertically resolved Na. In Section 2 we also present the formulation for deriving vertically resolved Na from 1) column-averaged fine- and coarse-mode aerosol particle extinction cross section (σext) from the polarimeter and 2) the total aerosol particle extinction coefficient (αext) from the lidar. Next, we describe the processing of the in situ data that we use to validate the novel Na product presented in this work. After describing the data processing and collocation methods, we show results of the in situ validation of this novel vertically resolved Na performed using case studies that have acceptable collocation and environmental conditions in Section 3. Our conclusions for this method are summarized in Section 4.
2 Methodology
A glossary of all acronyms and symbols used in this study is provided in Table 1.
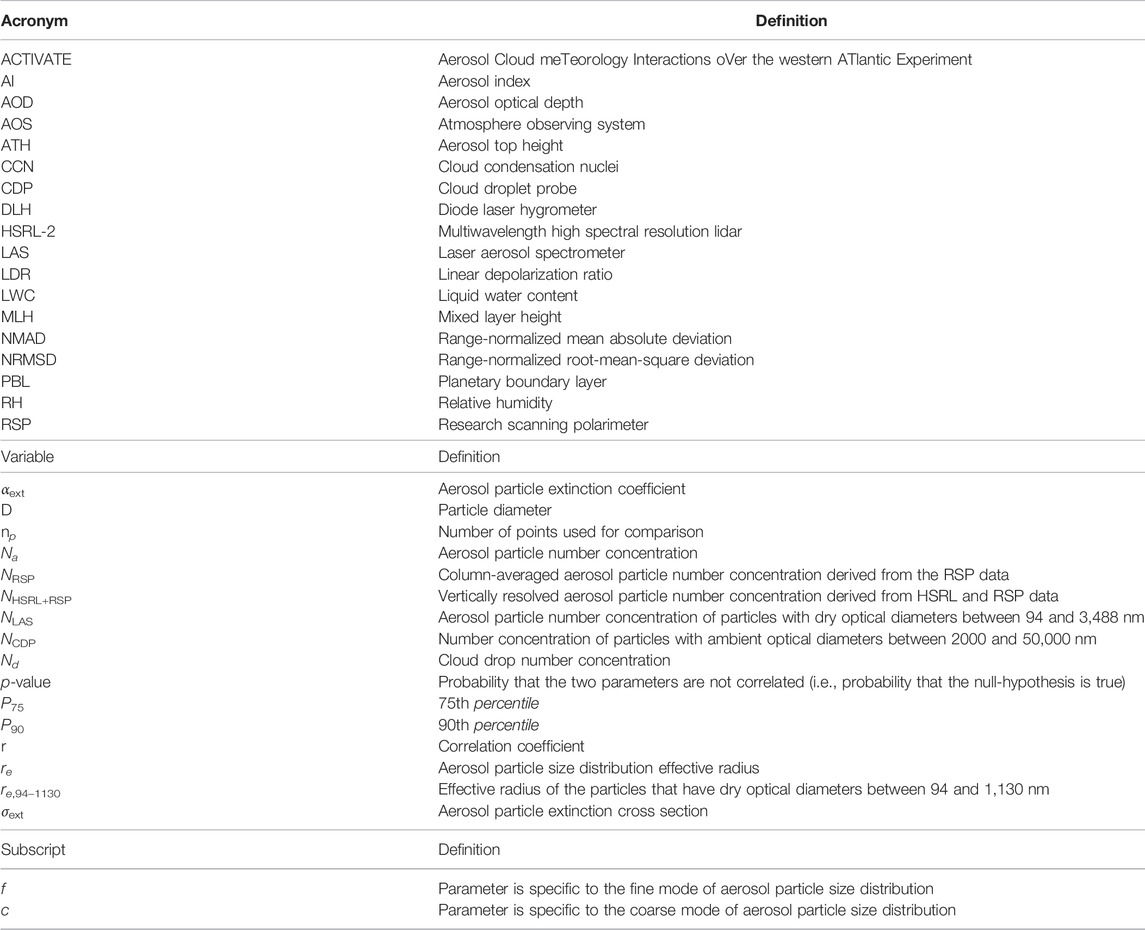
TABLE 1. Definition of acronyms, variables, and optional subscripts used to mark mode-specific parameters in alphabetical order.
2.1 Study Region Description
Figure 1 demonstrates the spatial coverage that was observed during the first two deployments of ACTIVATE. The ACTIVATE study region is characterized as predominately a marine environment impacted by anthropogenic continental outflow (Corral et al., 2021; Painemal et al., 2021). In most marine conditions the coarse-mode aerosol concentrations are composed primarily of sea salt, which accounts for a small percentage of the Na in the troposphere (Murphy et al., 2019). This is especially true when the marine background is influenced by anthropogenic continental outflow where total Na can be on the order of 1,000 cm−3.
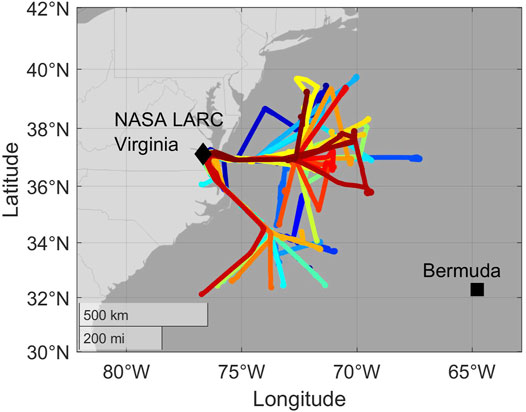
FIGURE 1. Flight tracks from the 35 two-aircraft research flights that were carried out during the first two deployments of ACTIVATE in the winter and summer of 2020. Each flight track color corresponds to a different ACTIVATE research flight.
2.2 Measurement Summary
A list of instruments and corresponding measurements utilized from each of the ACTIVATE aircraft is provided in Table 2. The RSP aerosol product is based on an optimal estimate using the research scanning polarimeter–microphysical aerosol properties from polarimetery (RSP-MAPP) algorithm (Stamnes et al., 2018). Fine- and coarse-mode aerosol optical and microphysical properties are directly retrieved using seven channels that measure the total and polarized radiance across the visible–shortwave spectrum (wavelength = 410–2,260 nm) with over 100 viewing angles between ±55°. The RSP has a field of view of 14 mrad, which results in a ∼126 m footprint for an aircraft at 9 km altitude. This RSP retrieval uses a coupled atmosphere–ocean radiative transfer model to improve the accuracy of the retrieved aerosol properties.
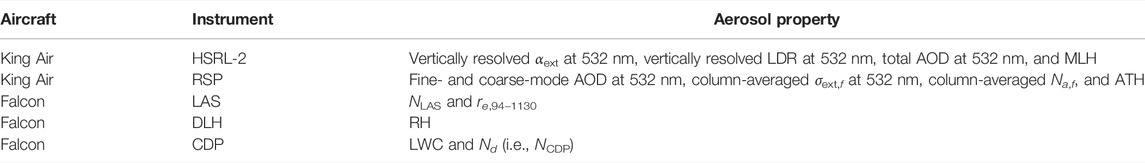
TABLE 2. List of measurement products used in this study, which are grouped by the both the instrument each measurement was derived from and the ACTIVATE aircraft each instrument was mounted on.
The RSP-MAPP retrieval algorithm (v1.48) inverts RSP data under the assumption that the aerosols are bimodal, split into a fine-mode and coarse-mode aerosol, with each mode defined by a lognormal size distribution. This version of RSP-MAPP assumes that the aerosol size distribution has one fine-mode and one coarse-mode comprising non-absorbing sea salt particles. Such a bimodal aerosol model works well over the ocean because the RSP visible to shortwave-infrared channels are not sensitive to particles D ≲ 100 nm. The fine-mode aerosol properties including aerosol absorption are fully retrieved, namely, fine-mode AOD, size distribution parameters of effective radius and effective variance, and complex refractive index. The coarse-mode AOD, effective radius, and effective variance are also retrieved under the assumption that the coarse-mode consists of non-absorbing sea salt particles with a real refractive index close to water. The coarse-mode sea salt aerosol is assumed to be located from the ocean surface to 1 km, while the fine-mode aerosol is assumed to be mixed homogeneously from the ocean surface to the aerosol top height, which is also retrieved. From the aerosol optical and microphysical properties, RSP-MAPP implicitly retrieves the column-averaged fine- and coarse-mode σext (σext,f and σext,c, respectively). The RSP-MAPP algorithm also provides an estimate of fine- and coarse-mode column-averaged Na (Na,f and Na,c, respectively). In cloud-free conditions, RSP and HSRL-2 column AODs have been shown to agree to within 0.02 at 532 nm (Stamnes et al., 2018). The column-averaged aerosol particle number concentration derived from the RSP data (NRSP) is defined as the following:
where we explicitly use a bar to represent the column-averaged polarimeter-retrieved aerosol cross section and number concentration. The AOD and σext are referenced at 532 nm. Both AOD and NRSP are, in part, governed by a retrieval of the aerosol top height (ATH, Wu et al., 2016). RSP-MAPP retrieves the ATH under the assumption that the fine-mode size and composition are uniform throughout the column, and as a result the fine-mode σext is implicitly retrieved as a uniform value.
The HSRL-2 products include ambient vertically resolved lidar backscattering and extinction coefficients and ambient linear depolarization ratio (LDR) at wavelengths of 355, 532, and 1,064 nm (Fernald, 1984; Hair et al., 2008; Burton et al., 2018). The HSRL-2 field of view is 1 mrad, which corresponds to a ∼9 m footprint for an aircraft at 9 km altitude. Similar to the RSP, the HSRL-2 is not very sensitive to particles that fall in or below the Aitken size range (Burton et al., 2016). The HSRL-2 can also provide AOD by using the difference in the molecular channel signals at the top and bottom of the layer. Finally, the HSRL-2 retrieves the MLH (Scarino et al., 2014). To limit the scope of this analysis to spherical particles, LDR is used to filter out non-spherical from the data set (Burton et al., 2013). A LDR threshold of
The measured in situ Na values are used for the validation of the Na product presented in this work. These data are taken from the laser aerosol spectrometer (LAS, Model 3,340, TSI, Inc.), which measures concentrations of particles with dry D ranging in sizes from 94 to 7,500 nm at a 1 Hz temporal resolution. The Na measurements provided by the LAS are provided at standard temperature and pressures (273.15 K and 1,013 mb). While the LAS has a measurement range up to 7,500 nm, the maximum cutoff D of the sample inlet prevents the measurement of particles with ambient D greater than 5,000 nm (McNaughton et al., 2007; Chen et al., 2011). To take into account potential hygroscopic effects, we only include particles with dry optical D up to 3,488 nm in this analysis. The total Na measured by the LAS is referred to from this point forward as NLAS. The lower dry D cutoff of 94 nm is similar to the lower cutoff of the remotely-sensed Na values but the NLAS unavoidably misses some of the coarse-mode Na due to the aforementioned inlet limitations.
The LAS has a low counting efficiency at three low size bins: 94–106 nm, 106–119 nm, and 119–133 nm, which we compensate for by multiplying the number concentration measured in those size ranges by correction factors of 1.90, 1.45, and 1.20, respectively. Losses for the LAS are calculated at nominal cabin temperature (20 °C) and pressure for low-altitude flight segments (900 mb). These correction factors are calculated using the product of losses by impaction, gravitational settling, and diffusion (Baron and Willeke, 2011). All tubing is conductive silicone and flows are laminar from the inlet manifold to both the LAS optical block. In addition to NLAS, the aerosol particle size distribution effective radius (re) of the fine-mode is derived from the corrected LAS and defined as effective radius of the particles that have dry optical diameters between 94 and 1,130 nm (re,94–1130). The re,94–1130 is used primarily to assess the homogeneity of the fine-mode aerosol particles that is assumed to be true for the RSP-MAPP–derived fine-mode σext.
Ambient liquid water content (LWC) and Nd are used to classify in situ data as cloud-free, ambiguous, or cloud. Ambient LWC and Nd are both derived from ambient particle size distribution measured by using a cloud droplet probe (CDP, Droplet Measurement Technologies, Sinclair et al., 2019). The CDP can measure particles in the ambient D size range of 2,000–50,000 nm, and the Nd-CDP derived by the CDP is noted by NCDP. An important limitation with deriving LWC from the CDP is an integration of the particle size distribution assuming unit density and constrained to the real refractive index of water. If the particles are anything other than spherical, with unit density and with real refractive index of 1.33, this LWC number has no meaning. Previous studies of aerosol–cloud interactions in marine environments have used a LWC threshold of
To further illustrate the three cloud classifications (cloud-free, ambiguous, and cloud) used in this study, Figure 2 provides a heat map (with marginal histograms) of all available 1 Hz LWC and NCDP measurements taken during ACTIVATE 2020. In addition to the LWC and Nd thresholds, a sampling inlet flag is used to verify the Falcon aircraft’s sampling inlet was sampling air via the isokinetic inlet or via the counterflow virtual impactor (BMI Inc.; Shingler et al., 2012). The former is used to sample aerosol particles, while the latter is used to sample cloud droplets. Finally, ambient relative humidity (RH) is derived from measurements of the water vapor mixing ratio, which is measured by using a diode laser hygrometer (DLH, Diskin et al., 2002), and of temperature, which is measured by using the turbulent air motion measurement system (TAMMS, Thornhill et al., 2003). Ambient RH is used for an indication of the impacts of water vapor on re,94–1130.
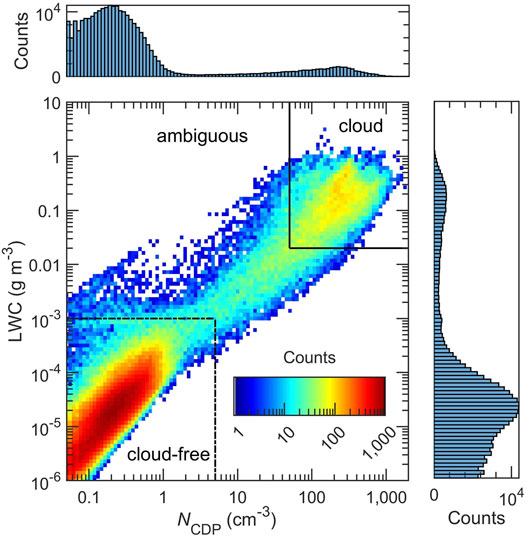
FIGURE 2. Log-log heat map of liquid water content (LWC) and cloud drop number concentration (Nd) with corresponding marginal semi-log histograms generated using all available 1 Hz cloud droplet probe (CDP) data measured during ACTIVATE 2020. The number of points used for comparison (np) on each panel is 465, 292. Points on the heat map that are classified as cloud-free have LWC and Nd values that are below horizontal (at 0.001 g m−3) and vertical (at 5 cm−3) dashed-black lines, respectively. Points on the heat map that are classified as cloud have LWC and Nd values that are above the horizontal (at 0.02 g m−3) and vertical (at 50 cm−3) solid-black lines, respectively. Points on the heat map that fall outside of the cloud or the cloud-free classifications are classified as ambiguous.
2.3 Deriving Vertically Resolved Aerosol Number Concentration
In this section, we describe the mathematical formulation used to derive Na from standard HSRL-2 and RSP products. The formulation to derive Na described in this study has its foundation in the spherical particle Mie theory (Bohren and Huffman, 1983). Using the Mie theory and the environmental setup established in Section 2.1, we describe how column-averaged σext,f (from RSP-MAPP) and vertically resolved αext (from HSRL-2) can be used to calculate vertically resolved Na. We limit this analysis to the 532 nm wavelength for simplicity. While the RSP-derived σext is a column average and is separated into fine- and coarse-modes, we assume the fine- and coarse-mode aerosols are externally mixed as two distinct aerosol types. This assumption allows us to calculate a mixed σext using number concentration weighted averaging as follows:
where we show explicitly the vertically resolved dependence on altitude z. Aerosol particle extinction cross section is related to Na at every altitude layer by αext using the following:
However, we choose cases based on the HSRL-2 and in situ measurements where the coarse-mode αext has a minimal impact, and accordingly simplify the equation to remove the coarse-mode terms. By setting the Na,c and σext,c terms to zero we obtain the following relationship for the aerosol number concentration from Eqs (2), (3), resulting in the method proposed in this study:
where Equation (4) is applied to every altitude bin of the vertically resolved αext measured by the lidar (HSRL-2), while σext,f is set equal to the column-averaged value retrieved by the polarimeter (RSP). The σext,f is dependent on only the fine-mode aerosol size and composition. That the fine-mode aerosol cross section is kept constant is an assumption that the fine-mode aerosol properties do not significantly differ from the column-averaged value in such a way that it significantly biases the retrieval of Na. Another limitation related to this assumption is that both extinction cross section and extinction coefficient are expected to increase with increasing RH. Using an average cross section could cause NHSRL+RSP to biased high/low with an increase/decrease of ambient size.
2.4 Data Handling and Analysis
This section describes how remote sensing and in situ data are processed to apply the Na derivation outlined in Section 2.3. First, we limit the application of the method to observations of spherical aerosol particles using the LDR threshold of
After the remote sensing data are aligned and filtered, the aerosol particle number concentration of particles with dry optical diameters between 94 and 3,488 nm (NLAS) data are filtered for clouds and adjusted to ambient temperature and pressure for direct comparison with the remote sensing observations. From the cloud filtered ambient NLAS data, all available in situ vertical profiles (e.g., spirals, in-line descents, and in-line ascents) are organized for collocation with the remote sensing data. For this collocation stage the remote sensing profiles are collocated with the in situ profiles. The nearest remote sensing profile within 6 min and 15 km to the start or end of the in situ profile is selected for comparison. After collocation, NLAS from each in situ profile is averaged to the same altitude grid as the HSRL-2 data (i.e., altitude bins that are 150 m in depth and extend from 0 to 9 km).
With collocation performed, the HSRL-2 + RSP-derived Na (i.e., NHSRL+RSP) can be equivalently compared to the NLAS at each altitude grid point of each collocated vertical profile. In order to validate the column-averaged Na that is derived from the RSP (i.e., NRSP), the column-averaged NLAS is calculated by taking an arithmetic mean of the entire NLAS profile. With this final step, both NHSRL+RSP and NRSP can be equivalently quantitatively validated using vertically resolved NLAS or column-averaged NLAS, respectively. This study makes use of correlation coefficient (r), range-normalized root-mean-square deviation (NRMSD), range-normalized mean absolute deviation (NMAD), and relative bias, which have been previously used for quantitative validation of aerosol microphysical properties (Sawamura et al., 2017; Stamnes et al., 2018). Each of these statistical metrics has the following formulations:
where X and Y are the set of in situ–derived Na and remote sensing–derived Na, respectively; np is the total number of points for each set; and
3 Results
Out of the 35 two-aircraft flights in the first two deployments of ACTIVATE, there are a total of 42 full vertical profiles successfully collocated using the process described in Section 2.4. In order to be considered as an in situ vertical profile, each of these collocated profiles was required to have measurements across at least four altitude grid points. These 42 profiles are placed into three categories based on whether there are ambiguous- or cloud-flagged in situ data in the profile (see Section 2.2). The three classifications are described as follows: (1, cloud-free profile) vertical profiles where there are no in situ data flagged as ambiguous or cloud; (2, ambiguous profile) vertical profiles that have one or more in situ data point that is flagged as ambiguous but no points flagged as cloud; and (3, cloud profile) vertical profiles where at least one data point was classified as cloud. There are 32 profiles classified as cloud-free, two profiles classified as ambiguous, eight profiles classified as cloud of the profiles classified as cloud-free, and two profiles that featured extended spiral vertical profiles, which are fairly unusual for ACTIVATE, and targeted relatively high aerosol loading. These two “optimal” aerosol profiles extended to at least 5 km in altitude; hence, they offer an unprecedented opportunity to validate the novel NHSRL+RSP. In Section 3.1 we analyze these two optimal profiles with more detail and show that the novel NHSRL+RSP has reasonable closure with NLAS. Following this case study analysis, we analyze the entire in situ validation set in Section 3.2. These result demonstrated in this analysis warrant further study in future ACTIVATE deployments and other missions with combined lidar-polarimeter aerosol measurements.
3.1 Case Study of Optimal Aerosol Profiles
In this section, we examine the two optimal aerosol profiles from the first deployment of ACTIVATE 2020 (Figures 3, 4). For these two profiles, each corresponding research flight took place in a generally cloud-free conditions (both low level and cirrus), that allow for the use of the novel NHSRL+RSP product to create altitude vs. longitude color maps of Na to provide some spatial context to each profile (Figure 3A, Figure 4A). The NHSRL+RSP is gridded into 0.01° longitude bins (maintaining the 150 m altitude bins), but the in situ sampling flight track is displayed in the native 1 Hz resolution for qualitative, observational comparison of NLAS and the NHSRL+RSP. From this qualitative comparison, it is evident that the NLAS and NHSRL+RSP reasonably agree for these two flights that include the optimal profiles. In addition to the qualitative comparison between NLAS and NHSRL+RSP, these vertically resolved profiles illustrate the significant differences in the two profiles.
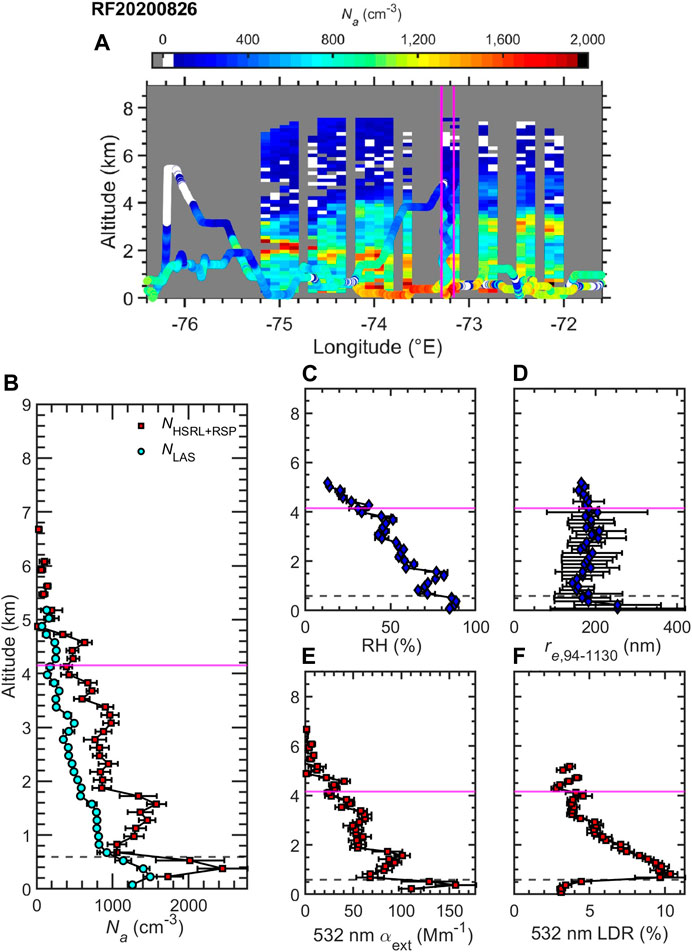
FIGURE 3. Horizontal curtain (A) and vertical profiles (B–F) of remote sensing and in situ data gathered from the ‘optimal’ flight that occurred on 26 August 2020. The vertical profiles were taken from the in situ profile that occurred between 15:46:25 and 15:58:12 (UTC) on 26 August 2020. Panel (A) shows the flight track and surface plot colored by NLAS and NHSRL+RSP, respectively, where the magenta vertical lines mark the start and stop locations of the first optimal vertical in situ profile. Panel (B) show vertical profiles of average aerosol particle number concentration (derived from the various methods), (C) RH, (D) re,94–1130, (E) 532 nm αext, and (F) 532 nm LDR; where the whiskers mark ± one standard deviation. The horizontal dashed-black and solid-magenta lines mark the MLH and the ATH, respectively.
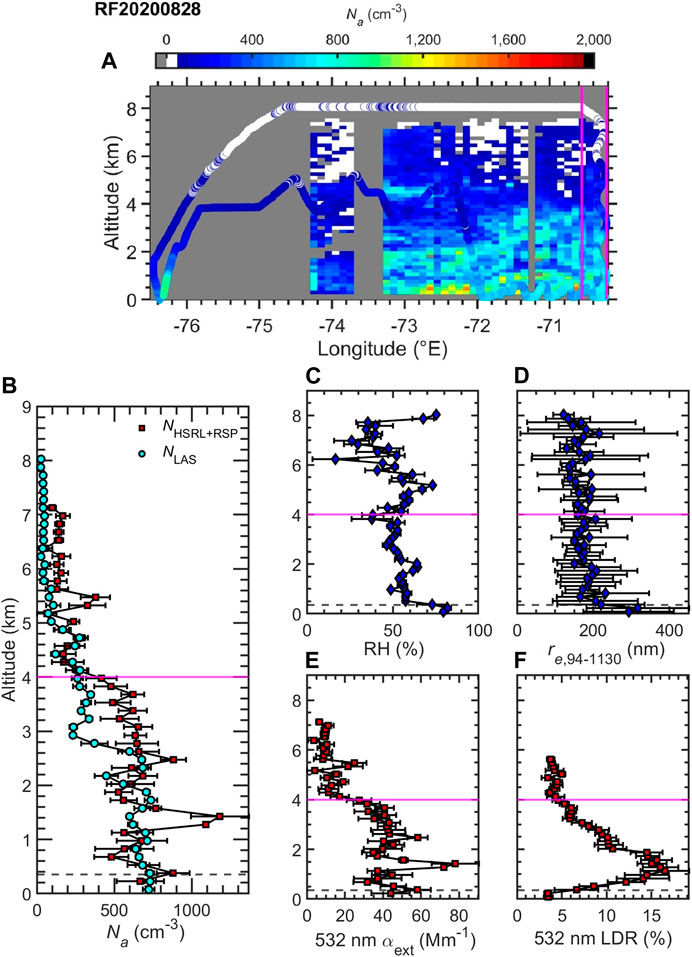
FIGURE 4. Horizontal curtain (A) and vertical profiles (B–F) of remote sensing and in situ data gathered from the ‘optimal’ flight that occurred on 28 August 2020. The vertical profiles were taken from the in situ profile that occurred between 17:35:18 and 17:54:11 (UTC) on 28 August 2020. Panel (A) shows the flight track and surface plot colored by NLAS and NHSRL+RSP, respectively, where the magenta vertical lines mark the start and stop locations of the first optimal vertical in situ profile. Panel (B) show vertical profiles of average aerosol particle number concentration (derived from the various methods), (C) RH, (D) re,94–1130, (E) 532 nm αext, and (F) 532 nm LDR, where the whiskers mark ± one standard deviation. The horizontal dashed-black and solid-magenta lines mark the MLH and the ATH, respectively.
The first optimal profile’s research flight occurred from 13:52:27 to 17:08:12 on 26 August 2020 (Figure 3). This first optimal flight appears to have had two aerosol layers, one below 1 km and one between 1 and 2 km (e.g., smoke aerosol), as well as NLAS and NHSRL+RSP ranges that reached as high as 2,508 and 9,103 cm−3, respectively. The second optimal flight occurred from 16:45:10 to 20:01:40 on 28 August 2020 (Figure 4) and had lower maximum NLAS and NHSRL+RSP (1,031 and 4,209 cm−3, respectively), relative to the first optimal flight. The second optimal profile’s research flight had possibly more than one aerosol layer between 1 and 4 km, in addition to a homogeneous aerosol layer up to 1 km. Both of these profiles were observed to have detached aerosol layers above the PBL (e.g., smoke aerosol). Smoke aerosol was found to be present in this region on 26 August (Mardi et al., 2021) and on 28 August (Sorooshian et al., 2021).
Another contrast between the two optimal flight study regions was the MLH, which had the ranges of 0:00–0:88 km and 0:00–0:67 km for the first and second optimal flights, respectively. Both flights had similar RSP-ATH ranges that were 1:14–4:83 km and 1:83–4:85 km for the first and second optimal flights, respectively. In order to better analyze the closure between NLAS and NHSRL+RSP, we examine the closure statistics that result from the optimal profiles (Figure 3B, Figure 4B) where the aircraft horizontal-temporal separation is constrained (see Section 2.4).
The horizontal spatial and temporal aircraft separation of the first and second optimal profiles is 1.94 km–3.79 min and 11.99 km–5.97 min, respectively. The MLH of the first and second optimal profiles are at 0.59 and 0.35 km, respectively. The ATH of the first and second optimal profiles are at 4.15 and 4.00 km, respectively. The median relative bias, NMAD, and NRMSD observed in the first case study were generally worse (median relative bias = 64%, NMAD = 29%, and NRMSD = 33%), relative to the second case study (median relative bias = 42%, NMAD = 21%, and NRMSD = 28%). The r between NHSRL+RSP and NLAS for the first and second optimal flights are 0.92 and 0.81, respectively, and both profiles are among those that have the most statistically significant correlations in the set of collocated profiles (i.e., r
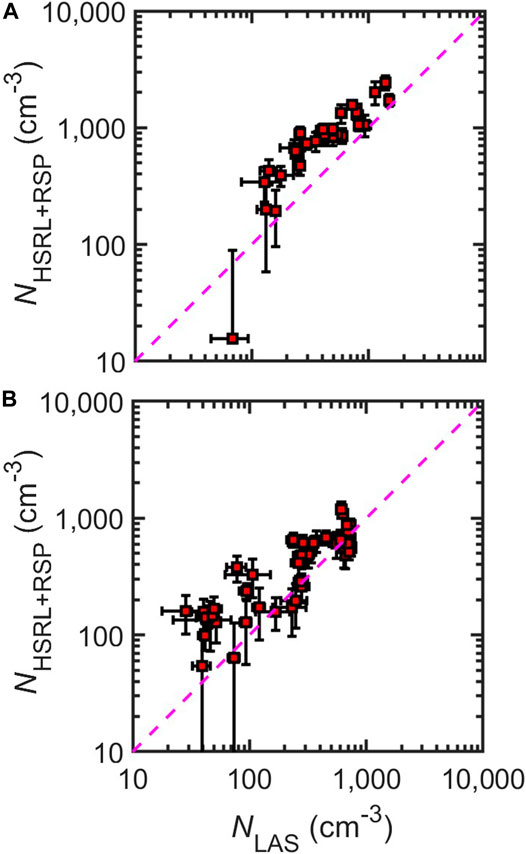
FIGURE 5. Log-log plots of NHSRL+RSP versus NLAS from (A) optimal in situ profile that occurred between 15:46:25 and 15:58:12 (UTC) on 26 August 2020 and (B) optimal in situ profile that occurred between 17:35:18 and 17:54:11 (UTC) on 28 August 2020. The goodness of fit statistics that correspond to panel (A) are r = 0.92, median relative bias = 64%, NMAD = 29%, NRMSD = 33%, and np = 34. The goodness of fit statistics for panel (B) are r = 0.81, median relative bias = 42%, NMAD = 21%, NRMSD = 28%, and np = 47.
To provide insight into the reasons for differences in the NLAS-NHSRL+RSP closure, we examine the differences in the vertical profiles of RH, re,94–1130, αext, and LDR that correspond to the optimal profile that occurred on 26 August 2020 (Figures 3C–F) and the optimal profile that occurred on 28 August 2020 (Figures 4C–F). The RH sampled in the first optimal profile overall decreases with increasing altitude up the ATH at
In addition to examining the profiles to identify multiple aerosol layers, the αext profile, in combination with re,94–1130 and RH profiles, allow us to examine the assumption of using a single fine-mode σext to derive vertically resolved NHSRL+RSP. The narrow re,94–1130 range observed in the second profile suggests that there is no significant change in the fine-mode aerosol composition and size distribution. Because re,94–1130 can be dependent on NLAS, and RH can indicate the mixing state of the atmosphere, the positive correlation between both NLAS and RH with re,94–1130 near the surface (≤200 km altitude) seen in each profile may indicate that changes in re,94–1130 for near the surface are partly related to atmospheric mixing rather than composition change.
These findings from the analysis of the first optimal profile suggest that method is robust in that the correlation for NHSRL+RSP is high despite a ∼60% bias at elevated Na and despite the separate smoke aerosol observed in the first profile. The analysis of the LDR profile suggests that non-spherical particles are not impacting the retrieval of NHSRL+RSP significantly. In the next section, we combine data from these optimal profiles with the remaining cloud-free collocated profiles of NHSRL+RSP and NLAS to further support these findings and strengthen the validation of the NHSRL+RSP product.
3.2 Statistical Validation
Following the initial validation with the optimal case studies, we use all collocated vertically resolved NLAS data to perform a more statistically weighted validation of NHSRL+RSP product using Figure 6A. Furthermore, we show that this error is generally similar to the error observed in the validation of NRSP with column-averaged NLAS (Figure 6B). Finally we examine Figures 6C,D and Table 3 to demonstrate the improvements gained in validation of both vertically resolved and column-averaged Na by removing profiles where cloud presence is detected in the column.
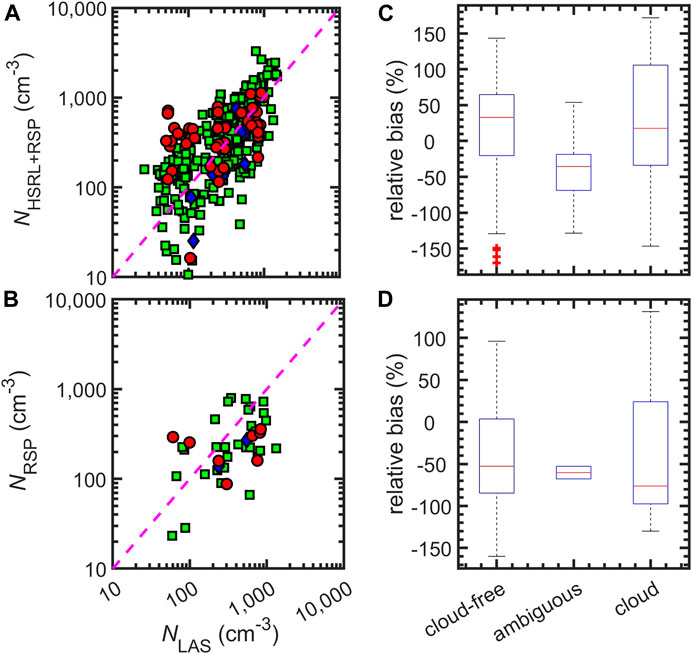
FIGURE 6. Log-log plots of (A) vertically resolved NHSRL+RSP vs. in situ NLAS and (B) column-averaged NRSP vs. in situ NLAS. The collocated vertical profile data come from ACTIVATE 2020. The green squares correspond to data from vertical profiles where all in situ data are classified as cloud-free, blue diamonds correspond to the vertical profiles that have one or more in situ data point that is classified as ambiguous but no points classified as cloud, and the red circles correspond to data from vertical profiles where at least one data point was classified as cloud. The dashed-magenta line indicates the one-to-one line. Panels (C) and (D) are box plots illustrating the spread in relative bias of panel (A) and panel (B), respectively. Data for these box plots correspond to the same categories as panels (A) and (B) (i.e., cloud-free, ambiguous, and cloud). Additional goodness of fit statistics for panels (A) and (B) are shown in Tbl. 3. Red markers on panels (C) or (D) are points that were flagged as statistical outliers. An outlier is a value that is more than 1.5 times the interquartile range away from the bottom or top of box.
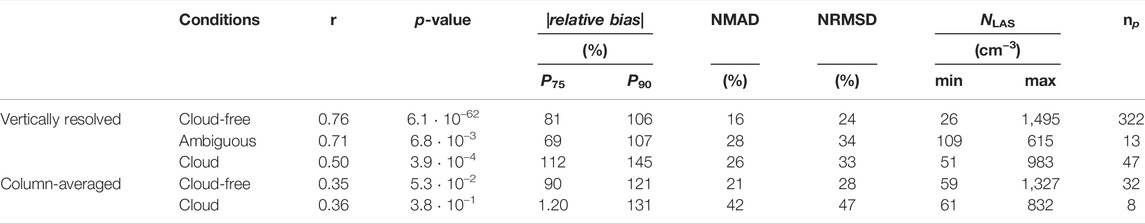
TABLE 3. Comparison statistics resulting from the comparison of vertically resolved NLAS with NHSRL+RSP and resulting from the comparison of column-averaged NLAS with NRSP for the in situ profiles that were classified as cloud-free, ambiguous, and cloud. The statistics presented for each category are as follows (from left to right): r, p-value, P75 and P90 of the absolute relative bias (i.e., |relative bias|), NMAD, NRMSD, minimum and maximum NLAS (either vertically resolved or column-averaged), and np.
As noted above, there are 32 cloud-free profiles, two ambiguous profiles, and eight cloud profiles, which contain 322, 13, and 47, respectively, vertically resolved points for the comparison validation of NHSRL+RSP and NLAS. The r, median relative bias, NMAD, and NRMSD that result from the comparison of the points contained in the cloud-free profiles are 0.76, 33%, 16%, and 24%, respectively. Additionally, this cloud-free data set resulted in a P90 of 106% in absolute relative bias. Data from both the ambiguous profiles and the cloud profiles resulted in worse, i.e., increases in NMAD (28% and 26%, respectively) and NRMSD (34% and 33%, respectively), relative to the NMAD and NMAD that resulted from the data cloud-free profiles. Relative to the cloud-free profile dataset, the r (0.71) and P90 in absolute relative bias (107%) did not change much for the ambiguous profile data set but r decreases to 0.50 and P90 in absolute relative bias increases to 145% for the cloud profile dataset.
Due to the limited number of column-averaged Na points (np = 2) that are classified as ambiguous, the validation statistics for this set is not meaningful and will be omitted here. The validation statistics resulting from the comparison of the column-averaged Na points classified as cloud-free and cloud are similar to that resulting from the vertically resolved Na closure, with the exception of relative bias. The NMAD improves, i.e., decreases, from 42% to 21% and the NRMSD decreases from 47% to 28%. In contrast to the vertically resolved Na, the median relative bias resulting from the column-averaged Na comparison of the eight collocated points is −0.76, which improves to −0.53 for the 32 profiles from the column-averaged cloud-free dataset. In addition, the P90 in absolute relative bias of the column-averaged cloud data set is larger (131%), relative to the column-averaged cloud-free data set (121%). These findings suggest that the significantly improved performance of one set over the other, which is likely due to the fact that the retrieval of column-averaged Na is more sensitive to deviations from ideal cloud-free conditions than the vertically resolved Na. It is also possible that the retrieval of column-averaged Na is more sensitive to separated aerosol layers that are possibly present. However, due to the relatively limited number of collocated points and profiles, wider application is needed to definitively conclude the main reason for the difference.
4 Conclusion
In this study we provide a simple and direct approach to derive vertically resolved aerosol number concentration from collocated polarimeter–lidar measurements. This method has the benefit of rapidly taking advantage of column-averaged polarimeter-derived aerosol cross section from the RSP and collocated lidar measurements of the aerosol extinction coefficient at 532 nm. Since this method only requires profiles of the extinction coefficient at 532 nm, it can be readily applied to lidar + polarimeter datasets provided that the lidar has a 532 nm high spectral resolution channel such as the NASA airborne HSRL-1 and HSRL-2 lidar, and the HSRL-1–type lidar system that will be onboard the future NASA AOS mission. We characterize the retrieval error that is observed from vertically resolved NHSRL+RSP, which is derived from column-averaged σext from polarimeter retrievals and vertically resolved αext from HSRL-2 measurements. We demonstrate that the vertically resolved NHSRL+RSP product has a median relative bias, P90 in absolute relative bias, NMAD, and NRMSD that are 0.33, 106%, 16%, and 24%, respectively. Our results also suggest that the vertically resolved NHSRL+RSP product has similar NMAD and NRMSD as the column-averaged NRSP. We demonstrate that column-averaged NRSP validation is more sensitive than the vertically resolved NHSRL+RSP to deviations from ideal conditions (e.g., cloud-free with a single aerosol layer), however elevated LDR
Although a fully combined polarimeter–lidar retrieval is expected to provide the optimal retrieval of aerosol optical and microphysical properties including aerosol number concentrations, this method provides a simple and direct approach to corroborate the results from such complex retrievals, particularly for simpler cases of single or two-layer aerosol systems. The ACTIVATE field campaign features combined polarimeter (RSP) and lidar (HSRL-2) remote sensing measurements with collocated in situ aerosol measurements from a second, low-flying aircraft. The ACTIVATE datasets of simultaneous remote and in situ measurements of aerosols in clear-sky conditions will enable us to extensively test the approach outlined here, as well as perform detailed closure studies for relating dry-wet aerosol microphysical and optical properties across passive, active, and in situ aerosol measurement techniques. The promise shown by the NHSRL+RSP method can be further explored by applying the method to the rest of the ACTIVATE datasets (i.e., 2021 and 2022 flights) and to future analyses that can incorporate retrievals of the vertical structure of Na in the atmosphere to study Na-Nd relationships for aerosol–cloud interactions. Further application will also allow for in-depth examination of the validity of the assumption of column-averaged extinction cross sections, and the impact of scattering by coarse-mode aerosols such as sea salt aerosol on the retrieved aerosol number concentration. The hope is that the NHSRL+RSP product can be a robust method to provide required vertical profiles of Na for many research applications ranging from aerosol–cloud interactions to improving estimates of air quality parameters such as PM2.5.
Data Availability Statement
Publicly available datasets were analyzed in this study. This data can be found at: https://doi.org/10.5067/SUBORBITAL/ACTIVATE/DATA001.
Author Contributions
Algorithm development: JS, SS, and BC. Data: RM, LZ, BC, CH, RF, JH, and AS. Text: all authors.
Funding
This work was supported through the ACTIVATE Earth Venture Suborbital-3 (EVS-3) investigation, which is funded by NASA’s Earth Science Division and managed through the Earth System Science Pathfinder Program Office. Partial support was also provided by ONR grant N00014-21-1-2115.
Conflict of Interest
Author EC is employed by Science Systems and Applications, Inc.
The remaining authors declare that the research was conducted in the absence of any commercial or financial relationships that could be construed as a potential conflict of interest.
Publisher’s Note
All claims expressed in this article are solely those of the authors and do not necessarily represent those of their affiliated organizations, or those of the publisher, the editors, and the reviewers. Any product that may be evaluated in this article, or claim that may be made by its manufacturer, is not guaranteed or endorsed by the publisher.
Acknowledgments
We wish to thank the pilots and aircraft maintenance personnel of NASA Langley Research Services Directorate for their work in conducting the ACTIVATE flights.
References
Baron, P. A., and Willeke, K. (2011). Aerosol Measurement: Principles, Techniques, and Applications. Wiley.
Bohren, C. F., and Huffman, D. R. (1983). Absorption and Scattering of Light by Small Particles. Wiley.
Braun, R. A., McComiskey, A., Tselioudis, G., Tropf, D., and Sorooshian, A. (2021). Cloud, Aerosol, and Radiative Properties over the Western North Atlantic Ocean. J. Geophys Res. Atmos. 126, e2020JD034113. doi:10.1029/2020JD034113
Buchard, V., da Silva, A. M., Colarco, P. R., Darmenov, A., Randles, C. A., Govindaraju, R., et al. (2015). Using the Omi Aerosol Index and Absorption Aerosol Optical Depth to Evaluate the Nasa Merra Aerosol Reanalysis. Atmos. Chem. Phys. 15, 5743–5760. doi:10.5194/acp-15-5743-2015
Burton, S. P., Chemyakin, E., Liu, X., Knobelspiesse, K., Stamnes, S., Sawamura, P., et al. (2016). Information Content and Sensitivity of the 3<i>β</i> + 2<i>α</i> Lidar Measurement System for Aerosol Microphysical Retrievals. Atmos. Meas. Tech. 9, 5555–5574. doi:10.5194/amt-9-5555-2016
Burton, S. P., Ferrare, R. A., Vaughan, M. A., Omar, A. H., Rogers, R. R., Hostetler, C. A., et al. (2013). Aerosol Classification from Airborne Hsrl and Comparisons with the Calipso Vertical Feature Mask. Atmos. Meas. Tech. 6, 1397–1412. doi:10.5194/amt-6-1397-2013
Burton, S. P., Hostetler, C. A., Cook, A. L., Hair, J. W., Seaman, S. T., Scola, S., et al. (2018). Calibration of a High Spectral Resolution Lidar Using a Michelson Interferometer, with Data Examples from Oracles. Appl. Opt. 57, 6061–6075. doi:10.1364/AO.57.006061
Cairns, B., Russell, E. E., and Travis, L. D. (1999). “Research Scanning Polarimeter: Calibration and Ground-Based Measurements,” in SPIE’s International Symposium on Optical Science, Engineering, and Instrumentation (Denver, Colorado: International Society for Optics and Photonics), 186–196.
Chen, G., Ziemba, L. D., Chu, D. A., Thornhill, K. L., Schuster, G. L., Winstead, E. L., et al. (2011). Observations of Saharan Dust Microphysical and Optical Properties from the Eastern Atlantic during Namma Airborne Field Campaign. Atmos. Chem. Phys. 11, 723–740. doi:10.5194/acp-11-723-2011
Corral, A. F., Braun, R. A., Cairns, B., Gorooh, V. A., Liu, H., Ma, L., et al. (2021). An Overview of Atmospheric Features over the Western North Atlantic Ocean and North American East Coast - Part 1: Analysis of Aerosols, Gases, and Wet Deposition Chemistry. J. Geophys Res. Atmos. 126. doi:10.1029/2020JD032592
Dadashazar, H., Alipanah, M., Hilario, M. R. A., Crosbie, E., Kirschler, S., Liu, H., et al. (2021a). Aerosol Responses to Precipitation along North American Air Trajectories Arriving at bermuda. Atmos. Chem. Phys. 21, 16121–16141. doi:10.5194/acp-21-16121-2021
Dadashazar, H., Painemal, D., Alipanah, M., Brunke, M., Chellappan, S., Corral, A. F., et al. (2021b). Cloud Drop Number Concentrations over the Western North Atlantic Ocean: Seasonal Cycle, Aerosol Interrelationships, and Other Influential Factors. Atmos. Chem. Phys. 21, 10499–10526. doi:10.5194/acp-21-10499-2021
Dadashazar, H., Wang, Z., Crosbie, E., Brunke, M., Zeng, X., Jonsson, H., et al. (2017). Relationships between Giant Sea Salt Particles and Clouds Inferred from Aircraft Physicochemical Data. J. Geophys. Res. Atmos. 122, 3421–3434. doi:10.1002/2016JD026019
Diskin, G. S., Podolske, J. R., Sachse, G. W., and Slate, T. A. (2002). “Open-path Airborne Tunable Diode Laser Hygrometer,” in Diode Lasers and Applications in Atmospheric Sensing. Editor A. Fried (Seattle, Washington D.C.: International Society for Optics and Photonics), 4817, 196–204. doi:10.1117/12.453736
Feingold, G. (2003). Modeling of the First Indirect Effect: Analysis of Measurement Requirements. Geophys. Res. Lett. 30. doi:10.1029/2003GL017967
Fernald, F. G. (1984). Analysis of Atmospheric Lidar Observations: Some Comments. Appl. Opt. 23, 652–653. doi:10.1364/ao.23.000652
Georgoulias, A. K., Marinou, E., Tsekeri, A., Proestakis, E., Akritidis, D., Alexandri, G., et al. (2020). A First Case Study of Ccn Concentrations from Spaceborne Lidar Observations. Remote Sens. 12, 1557. doi:10.3390/rs12101557
Grosvenor, D. P., Sourdeval, O., Zuidema, P., Ackerman, A., Alexandrov, M. D., Bennartz, R., et al. (2018). Remote Sensing of Droplet Number Concentration in Warm Clouds: A Review of the Current State of Knowledge and Perspectives. Rev. Geophys. 56, 409–453. doi:10.1029/2017RG000593
Gryspeerdt, E., Quaas, J., Ferrachat, S., Gettelman, A., Ghan, S., Lohmann, U., et al. (2017). Constraining the Instantaneous Aerosol Influence on Cloud Albedo. Proc. Natl. Acad. Sci. U.S.A. 114, 4899–4904. doi:10.1073/pnas.1617765114
Hair, J. W., Hostetler, C. A., Cook, A. L., Harper, D. B., Ferrare, R. A., Mack, T. L., et al. (2008). Airborne High Spectral Resolution Lidar for Profiling Aerosol Optical Properties. Appl. Opt. 47, 6734–6752. doi:10.1364/ao.47.006734
Hammer, M. S., Martin, R. V., van Donkelaar, A., Buchard, V., Torres, O., Ridley, D. A., et al. (2016). Interpreting the Ultraviolet Aerosol Index Observed with the Omi Satellite Instrument to Understand Absorption by Organic Aerosols: Implications for Atmospheric Oxidation and Direct Radiative Effects. Atmos. Chem. Phys. 16, 2507–2523. doi:10.5194/acp-16-2507-2016
Hasekamp, O. P., Gryspeerdt, E., and Quaas, J. (2019). Analysis of Polarimetric Satellite Measurements Suggests Stronger Cooling Due to Aerosol-Cloud Interactions. Nat. Commun. 10, 5405. doi:10.1038/s41467-019-13372-2
Knobelspiesse, K., Cairns, B., Ottaviani, M., Ferrare, R., Hair, J., Hostetler, C., et al. (2011). Combined Retrievals of Boreal Forest Fire Aerosol Properties with a Polarimeter and Lidar. Atmos. Chem. Phys. 11, 7045–7067. doi:10.5194/acp-11-7045-2011
MacDonald, A. B., Dadashazar, H., Chuang, P. Y., Crosbie, E., Wang, H., Wang, Z., et al. (2018). Characteristic Vertical Profiles of Cloud Water Composition in Marine Stratocumulus Clouds and Relationships with Precipitation. J. Geophys. Res. Atmos. 123, 3704–3723. doi:10.1002/2017JD027900
Mardi, A. H., Dadashazar, H., Painemal, D., Shingler, T., Seaman, S. T., Fenn, M. A., et al. (2021). Biomass Burning over the united states East Coast and Western North Atlantic Ocean: Implications for Clouds and Air Quality. JGR Atmos. 126, e2021JD034916. doi:10.1029/2021JD034916
McNaughton, C. S., Clarke, A. D., Howell, S. G., Pinkerton, M., Anderson, B., Thornhill, L., et al. (2007). Results from the Dc-8 Inlet Characterization Experiment (Dice): Airborne versus Surface Sampling of Mineral Dust and Sea Salt Aerosols. Aerosol Sci. Technol. 41, 136–159. doi:10.1080/02786820601118406
Müller, D., Chemyakin, E., Kolgotin, A., Ferrare, R. A., Hostetler, C. A., and Romanov, A. (2019). Automated, Unsupervised Inversion of Multiwavelength Lidar Data with Tiara: Assessment of Retrieval Performance of Microphysical Parameters Using Simulated Data. Appl. Opt. 58, 4981–5008. doi:10.1364/AO.58.004981
Murphy, D. M., Froyd, K. D., Bian, H., Brock, C. A., Dibb, J. E., DiGangi, J. P., et al. (2019). The Distribution of Sea-Salt Aerosol in the Global Troposphere. Atmos. Chem. Phys. 19, 4093–4104. doi:10.5194/acp-19-4093-2019
Painemal, D., Corral, A. F., Sorooshian, A., Brunke, M. A., Chellappan, S., Afzali Gorooh, V., et al. (2021). An Overview of Atmospheric Features over the Western North Atlantic Ocean and North American East Coast-Part 2: Circulation, Boundary Layer, and Clouds. Geophys Res. Atmos. 126. doi:10.1029/2020JD033423
Quinn, P. K., Bates, T. S., Coffman, D. J., Upchurch, L., Johnson, J. E., Moore, R., et al. (2019). Seasonal Variations in Western North Atlantic Remote Marine Aerosol Properties. J. Geophys. Res. Atmos. 124, 14240–14261. doi:10.1029/2019JD031740
Sawamura, P., Moore, R. H., Burton, S. P., Chemyakin, E., Müller, D., Kolgotin, A., et al. (2017). Hsrl-2 Aerosol Optical Measurements and Microphysical Retrievals vs. Airborne In Situ Measurements during Discover-Aq 2013: an Intercomparison Study. Atmos. Chem. Phys. 17, 7229–7243. doi:10.5194/acp-17-7229-2017
Scarino, A. J., Obland, M. D., Fast, J. D., Burton, S. P., Ferrare, R. A., Hostetler, C. A., et al. (2014). Comparison of Mixed Layer Heights from Airborne High Spectral Resolution Lidar, Ground-Based Measurements, and the Wrf-Chem Model during Calnex and Cares. Atmos. Chem. Phys. 14, 5547–5560. doi:10.5194/acp-14-5547-2014
Shingler, T., Dey, S., Sorooshian, A., Brechtel, F. J., Wang, Z., Metcalf, A., et al. (2012). Characterisation and Airborne Deployment of a New Counterflow Virtual Impactor Inlet. Atmos. Meas. Tech. 5, 1259–1269. doi:10.5194/amt-5-1259-2012
Shinozuka, Y., Clarke, A. D., Nenes, A., Jefferson, A., Wood, R., McNaughton, C. S., et al. (2015). The Relationship between Cloud Condensation Nuclei (Ccn) Concentration and Light Extinction of Dried Particles: Indications of Underlying Aerosol Processes and Implications for Satellite-Based Ccn Estimates. Atmos. Chem. Phys. 15, 7585–7604. doi:10.5194/acp-15-7585-2015
Sinclair, K., van Diedenhoven, B., Cairns, B., Alexandrov, M., Moore, R., Crosbie, E., et al. (2019). Polarimetric Retrievals of Cloud Droplet Number Concentrations. Remote Sens. Environ. 228, 227–240. doi:10.1016/j.rse.2019.04.008
Sorooshian, A., Corral, A. F., Braun, R. A., Cairns, B., Crosbie, E., Ferrare, R., et al. (2020). Atmospheric Research over the Western North Atlantic Ocean Region and North American East Coast: A Review of Past Work and Challenges Ahead. J. Geophys Res. Atmos. 125, e2019JD031626. doi:10.1029/2019JD031626
Sorooshian, A., Anderson, B., Bauer, S. E., Braun, R. A., Cairns, B., Crosbie, E., et al. (2019). Aerosol-Cloud-Meteorology Interaction Airborne Field Investigations: Using Lessons Learned from the U.S. West Coast in the Design of ACTIVATE off the U.S. East Coast. Bull. Am. Meteorological Soc. 100, 1511–1528. doi:10.1175/BAMS-D-18-0100.1
Sorooshian, A., Atkinson, J., Ferrare, R., Hair, J., and Ziemba, L. (2021). Taking Flight to Study Clouds and Climate. EOS 102. doi:10.1029/2021EO158570
Stamnes, S., Hostetler, C., Ferrare, R., Burton, S., Liu, X., Hair, J., et al. (2018). Simultaneous Polarimeter Retrievals of Microphysical Aerosol and Ocean Color Parameters from the "MAPP" Algorithm with Comparison to High-Spectral-Resolution Lidar Aerosol and Ocean Products. Appl. Opt. 57, 2394–2413. doi:10.1364/ao.57.002394
Thornhill, K. L., Anderson, B. E., Barrick, J. D. W., Bagwell, D. R., Friesen, R., and Lenschow, D. H. (2003). Air Motion Intercomparison Flights during Transport and Chemical Evolution in the Pacific (Trace-p)/ace-asia. J. Geophys. Res. 108. doi:10.1029/2002JD003108
Wang, Z., Sorooshian, A., Prabhakar, G., Coggon, M. M., and Jonsson, H. H. (2014). Impact of Emissions from Shipping, Land, and the Ocean on Stratocumulus Cloud Water Elemental Composition during the 2011 E-Peace Field Campaign. Atmos. Environ. 89, 570–580. doi:10.1016/j.atmosenv.2014.01.020
Wu, L., Hasekamp, O., van Diedenhoven, B., Cairns, B., Yorks, J. E., and Chowdhary, J. (2016). Passive Remote Sensing of Aerosol Layer Height Using Near-Uv Multiangle Polarization Measurements. Geophys. Res. Lett. 43, 8783–8790. doi:10.1002/2016GL069848
Keywords: RSP, HSRL-2, column-averaged Na, vertically resolved Na, AOD, ACTIVATE, EVS-3, aerosol
Citation: Schlosser JS, Stamnes S, Burton SP, Cairns B, Crosbie E, Van Diedenhoven B, Diskin G, Dmitrovic S, Ferrare R, Hair JW, Hostetler CA, Hu Y, Liu X, Moore RH, Shingler T, Shook MA, Thornhill KL, Winstead E, Ziemba L and Sorooshian A (2022) Polarimeter + Lidar–Derived Aerosol Particle Number Concentration. Front. Remote Sens. 3:885332. doi: 10.3389/frsen.2022.885332
Received: 28 February 2022; Accepted: 11 April 2022;
Published: 13 May 2022.
Edited by:
Qiangqiang Yuan, Wuhan University, ChinaReviewed by:
Weizhen Hou, Aerospace Information Research Institute (CAS), ChinaXiaoguang Xu, University of Maryland, United States
Copyright © 2022 Schlosser, Stamnes, Burton, Cairns, Crosbie, Van Diedenhoven, Diskin, Dmitrovic, Ferrare, Hair, Hostetler, Hu, Liu, Moore, Shingler, Shook, Thornhill, Winstead, Ziemba and Sorooshian. This is an open-access article distributed under the terms of the Creative Commons Attribution License (CC BY). The use, distribution or reproduction in other forums is permitted, provided the original author(s) and the copyright owner(s) are credited and that the original publication in this journal is cited, in accordance with accepted academic practice. No use, distribution or reproduction is permitted which does not comply with these terms.
*Correspondence: Snorre Stamnes, c25vcnJlLmEuc3RhbW5lc0BuYXNhLmdvdg==; Armin Sorooshian, YXJtaW5AYXJpem9uYS5lZHU=