 Terence Conlon
 Christopher Small
 Vijay Modi1
- 1Department of Mechanical Engineering, Columbia University, New York City, NY, United States
- 2Lamont Doherty Earth Observatory, Columbia University, Palisades, NY, United States
In presenting an irrigation detection methodology that leverages multiscale satellite imagery of vegetation abundance, this paper introduces a process to supplement limited ground-collected labels and ensure classifier applicability in an area of interest. Spatiotemporal analysis of MODIS 250 m enhanced vegetation index (EVI) timeseries characterizes native vegetation phenologies at regional scale to provide the basis for a continuous phenology map that guides supplementary label collection over irrigated and non-irrigated agriculture. Subsequently, validated dry season greening and senescence cycles observed in 10 m Sentinel-2 imagery are used to train a suite of classifiers for automated detection of potential smallholder irrigation. Strategies to improve model robustness are demonstrated, including a method of data augmentation that randomly shifts training samples; and an assessment of classifier types that produce the best performance in withheld target regions. The methodology is applied to detect smallholder irrigation in two states in the Ethiopian Highlands, Tigray and Amhara, where detection of irrigated smallholder farm plots is crucial for energy infrastructure planning. Results show that a transformer-based neural network architecture allows for the most robust prediction performance in withheld regions, followed closely by a CatBoost model. Over withheld ground-collection survey labels, the transformer-based model achieves 96.7% accuracy over non-irrigated samples and 95.9% accuracy over irrigated samples. Over a larger set of samples independently collected via the introduced method of label supplementation, non-irrigated and irrigated labels are predicted with 98.3 and 95.5% accuracy, respectively. The detection model is then deployed over Tigray and Amhara, revealing crop rotation patterns and year-over-year irrigated area change. Predictions suggest that irrigated area in these two states has decreased by approximately 40% from 2020 to 2021.
1 Introduction
Between 1970 and 2008, global irrigated area increased from 170 million to 304 million hectares (Vogels M. F. A. et al., 2019). In sub-Saharan Africa however, as little as 4–6% of cultivated area is irrigated, given the lack of electric grid infrastructure and the high cost of diesel (Wiggins et al., 2021). Locating isolated irrigation identifies areas that can support higher quality energy provision services—e.g., a grid connection or minigrid installation—as these sites can sustain higher energy demands and the attendant electricity costs (Conlon et al., 2020). Facilitated through informed planning, irrigation expansion has a direct impact on poverty reduction: In Ethiopia, one study found that the average income of irrigating households was double that of non-irrigating households (Gebregziabher et al., 2009).
In data poor locations, satellite imagery provides a source of detailed synoptic observations of irrigated agriculture (Pervez et al., 2014). A previous irrigation mapping effort in Ethiopia used three 1.5 m resolution SPOT6 images to distinguish between large-scale and smallholder irrigation in the Ethiopian rift (Vogels M. F. A. et al., 2019). This approach was then adapted to intake timeseries of 10 m Sentinel-2 imagery to predict irrigation presence across the horn of Africa (Vogels M. et al., 2019). While both studies demonstrated high accuracies over collected observations, limited labels precluded a more rigorous performance assessment over the entire area of interest. Other studies have used multiscale imagery to detect irrigation, including one that fuses MODIS and Landsat imagery to identify irrigated extent, frequency, and timing in northwestern China (Chen et al., 2018). Here, unique advantages of satellite imagery products at different resolutions are exploited: 250 m MODIS imagery is valuable for characterizing vegetation over large areas (Huete et al., 1999), while decameter resolution imagery from Landsat or Sentinel-2 missions can better discern plot extent (Phiri et al., 2020).
Deep learning techniques have become widely used for land process classification, as they uncover intricate structures in large, complex datasets (Lecun et al., 2015); and provide a robust method of handling phenological variability (Zhong et al., 2019). However, despite increasing availability of remotely sensed imagery, computing resources, and advanced algorithms for information extraction, high-quality labels remain scarce and expensive to acquire. Methods of overcoming label scarcity generally fall into one of four categories: 1) Using pretrained networks; 2) unsupervised and self-supervised learning; 3) data augmentation; or 4) additional label collection (Li et al., 2018). Even as pretrained networks like ImageNet (Deng et al., 2009) are highly effective for true-color image classification, these networks’ weights do not translate to tasks that intake multispectral or hyperspectral imagery (Tao et al., 2022). Unsupervised learning techniques, including those that ensemble different clustering methods—e.g., Banerjee et al. (2015)—have been shown to effectively organize unlabeled imagery. Existing work has also demonstrated that training a Generative Adversarial Network (GAN)—itself a type of unsupervised learning—has allowed for improved change detection performance on multispectral imagery, e.g., Saha et al. (2019). For data augmentation, three techniques are often implemented: Image translation, rotation, and flipping (Yu et al., 2017; Stivaktakis et al., 2019); however, these techniques do not have obvious analogues for pixel-based classification.
In assessing the impact of training dataset size on land cover classification performance, Ramezan et al. (2021) finds that investigating multiple types of classifiers is recommended, as the performance of specific classifiers is highly dependent on the number of training samples. A number of other studies have introduced methods for obtaining training samples, including collection via hand-engineered rules (Abbasi et al., 2015); normalized difference in vegetation index (NDVI) thresholding (Bazzi et al., 2021); finding neighboring pixels that are highly similar to labeled pixels (Naik and Kumar, 2021); and visual inspection of high-resolution (Vogels M. et al., 2019) and decameter resolution (Wu and Chin, 2016) imagery. Lastly, while larger training datasets generally yield better model performance, condensing input samples via dimensionality reduction has been demonstrated to increase land cover classification accuracy (Stromann et al., 2020; Sivaraj et al., 2022).
Another lingering issue in land process mapping is determining the conditions under which a model can be utilized in locations beyond where it was trained. Site-specific methods may not be easily transferable to other places or climes (Ozdogan et al., 2010; Bazzi et al., 2020), and the performance of transferred models can often only be assessed after full implementation in a novel setting (de Lima and Marfurt, 2020). Therefore, processes that yield insights about model transferability before training and inference offer benefits to researchers seeking to understand the maximum spatial applicability of their approaches.
As current methods primarily focus on already well-understood areas of interest with existing datasets, new techniques and products need to be developed for parts of the world lacking labeled data. In the realm of irrigation detection, new methodologies and mapping products can help identify locations for further energy system planning and investment, as these areas contain latent energy demands that can make higher quality energy services cost-effective and increase incomes. To this end, the following paper presents a multiscale methodology that leverages 250 m MODIS imagery for regional phenological characterization and 10 m Sentinel-2 imagery for irrigation detection on smallholder plots. This approach is then applied to the 205,000 km2 Ethiopian Highlands, whereby it introduces a novel method of label collection; an evaluation of different classifier architectures and training strategies that ensure model applicability within the area of interest; and an assessment of irrigated area in the Tigray and Amhara states of Ethiopia for 2020 and 2021.
2 Background
Identification of dry season greening as potentially irrigated agriculture must take into account spatiotemporal variations in native vegetation phenological cycles. The complex topography of the Ethiopian Highlands and East African rift system, combined with the latitudinal movement of the InterTropical Convergence Zone (ITCZ) and seasonal upwelling of the Somali current in the Arabian Sea produces a diversity of rainfall patterns that control annual vegetation phenological cycles in the study area1. In order to provide phenological context with which to identify anomalous dry season greening, a regional vegetation phenology map is derived from spatiotemporal analysis of timeseries of vegetation abundance maps. Using the spatiotemporal characterization and temporal mixture modeling approach given by (Small, 2012) applied to timeseries of MODIS enhanced vegetation index (EVI) maps, four temporal endmember (tEM) phenologies are identified that bound the temporal feature space of all vegetation phenology cycles observed on the East African Sahel. These four tEM phenologies form the basis of a linear temporal mixture model that can be inverted to provide tEM fraction estimates for each pixel’s vegetation phenology. Figure 1 presents a spatiotemporal phenological characterization for the country, created from 16-day 250 m MODIS EVI imagery between 1 June 2011 and 1 June 2021.
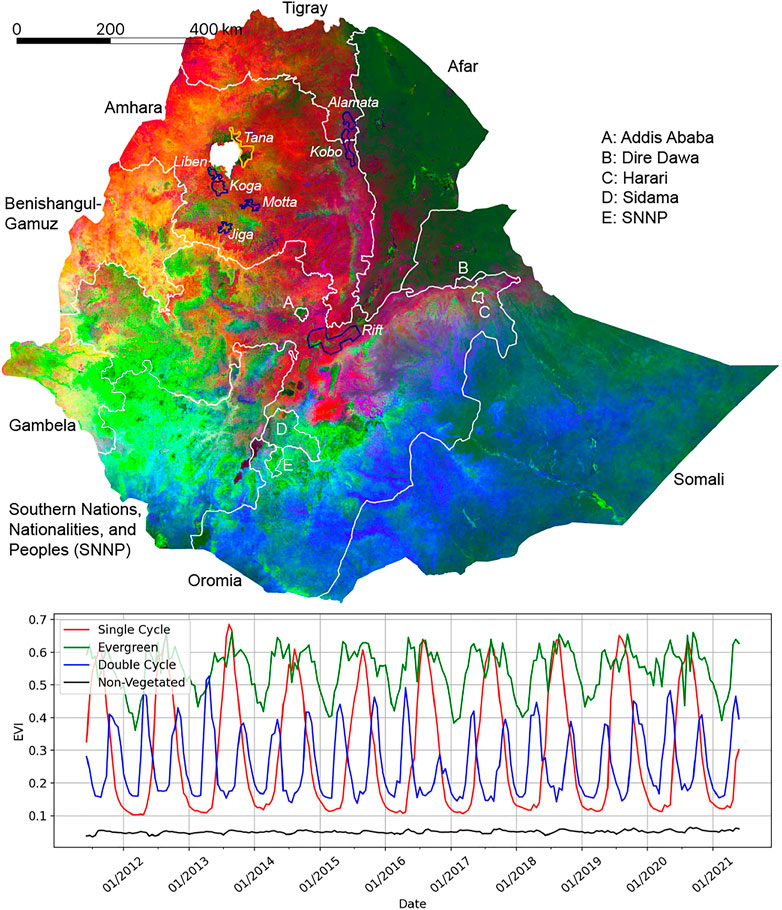
FIGURE 1. Continuous endmember fraction map derived from a temporal mixture model of 250 m MODIS enhanced vegetation index (EVI) timeseries. Smooth gradients and abrupt transitions in phenology are primarily related to topography and variations in precipitation. Region names showing locations of labeled polygons are italicized: The region containing ground collection (GC) labels is delineated in gold; the regions containing visual collection (VC) labels are delineated in blue.
The four tEMs extracted for Ethiopia are as follows: a single cycle tEM, representing a single annual vegetation cycle per year that peaks in September/October; an evergreen tEM, representing perennial vegetation; a double cycle tEM, representing semiannual vegetation cycles observed on the Somali peninsula; and a non-vegetated tEM, representing barren or non-existent vegetation. The ensuing phenology map in Figure 1 contains unmixing root mean square (RMS) error less than 10% for 90% of the pixels; additional unmixing error statistics and the locations of the extracted tEMs in principal component (PC) feature space are shown in Supplementary Figures S1, S2.
Figure 1 roughly divides into 4 quadrants. In the northeast quadrant, Afar appears as dark green, indicating that none of the 4 tEMs contribute significantly to phenologies in this part of the country: The vegetation that does exist in this mostly barren area is represented by low levels of evergreen tEM abundances. In the southeast quadrant, dominated by Somali and a portion of Oromia, vegetation patterns cycle twice annually. This is an area with bimodal rainfall but low total annual precipitation that results in the double cycle tEM containing peak vegetation abundances lower than those of the single cycle and evergreen tEMs. It follows that southeast Ethiopia is more pastoral with sparser vegetation than other parts of the country.
The southwest quadrant—covering Southern Nations, Nationalities, and Peoples’ (SNNP) Region, Sidama, and the western portion of Oromia—contains significant amounts of evergreen vegetation, as is demonstrated by its bright green hue. Here, evergreen vegetation is supported by bimodal rainfall with higher levels of annual precipitation than in eastern Ethiopia. In contrast, the northwest quadrant of the phenology map contains red-dominant color gradients, indicating phenologies similar to the single cycle tEM. This portion of the country, known as the Ethiopian Highlands and comprising of Amhara and Tigray, is highly agricultural; the main cropping season lasts from June to October and coincides with the primary kiremt rains, with some secondary cropping following the lighter belg rains from March to May. Accordingly, cropping that occurs during the dry season between November and March is likely to be irrigated.
In presenting a map of dominant vegetation phenologies in Ethiopia, Figure 1 provides a guide for land cover classification applicability within the country. For instance, a dry season irrigation detector trained in Amhara will perform poorly in SNNP, as phenological patterns differ significantly across these states, and dry season crop cycles exhibit different vegetation signatures. In contrast, a dry season irrigation detector developed across Amhara can be transferred to Tigray or Benishangul-Gamuz, due to regional phenological similarities.
The named, italicized outlines in Figure 1 represent the 8 areas containing labels used in this paper, referred to as regions: The yellow outline indicates a region where labels were collected via a ground survey, and the purple outlines indicate regions where labels were collected by means of visual interpretation and timeseries inspection. Full information on the labeled data collection process is presented in Section 3.
3 Materials and Methods
The data collection portion of this paper’s methodology consists of pairing Sentinel-2 imagery with labeled polygons to train an irrigation detector. Here, a pixel timeseries paired with a binary irrigation/non-irrigation label constitutes a sample. Irrigation is defined as such: A pixel is irrigated if its phenology includes at least one non-perennial vegetation cycle during the dry season, 1 December to 1 April for the Ethiopian Highlands. Conversely, a pixel is non-irrigated if its phenology demonstrates only vegetation growth that can be attributed to the area’s known rainy seasons. Irrigated areas are only of interest if they contain dry season vegetation cycles; this strict definition of irrigation excludes supplemental irrigation practices and perennial crops that may be consistently irrigated throughout the year.
3.1 Sentinel-2 Imagery Collection
The following analysis uses bottom-of-atmosphere corrected (processing level L2A) Sentinel-2 temporal stacks—four dimensional arrays created by stacking a set spatial extent of imagery bands over multiple timesteps—using the Descartes Labs (DL) platform, a commercial environment for planet-scale geospatial analysis. Images are collected at a 10-day time resolution. To focus on the 2020 and 2021 dry seasons, the time period of interest is defined as between 1 June 2019, and 1 June 2021. Given the 10-day timestep, 72 image mosaics are collected—36 per year. Additional information on the imagery download process is available in the Supplementary Material.
3.2 Label Collection
Two types of labeled data are leveraged for irrigation mapping: ground collection (GC) labels, acquired via an in-person survey; and visual collection (VC) labels, acquired via visual identification of dry season vegetation from Sentinel-2 imagery using the DL platform and subsequent cleaning via timeseries clustering. The locations of these GC and VC regions are shown in italics in Figure 1, with all labels collected for the 2021 dry season. A description of the ground collection survey is presented in the Supplementary Material. As the GC labels constitute our highest quality irrigation observations, verified by in situ visits to individual plots, we do not use them for training during the model sensitivity analysis, instead reserving them for validation of classifier performance.
3.2.1 Visual Label Collection
To supplement the GC labels located in Tana, visually collected labels are acquired for seven separate regions via a three-step process of 1) visual inspection, 2) EVI timeseries confirmation, and 3) cluster cleaning. Each of these steps is described in its eponymous subsection below.
3.2.1.1 Visual Inspection
The first step in the VC labeling process involves drawing polygons around locations that either: 1) Present as cropland with visible vegetation growth (for the collection of irrigated samples), or 2) present as cropland with no visible vegetation growth (for the collection of non-irrigated samples), based on dry-season, false-color Sentinel-2 imagery presented on the DL platform. Sub-meter resolution commercial satellite imagery from Google Earth Pro is also used to confirm the existence of cropland in the viewing window. For the collection of non-irrigated labels, polygons are restricted to areas that contain non-perennial cropland; however, because only phenologies that contain dry season vegetation cycles are considered irrigated, non-irrigated polygons occasionally overlap other types of land cover—e.g., perennial crops, fallow cropland, or areas with human settlement—with any overlap likely to improve training robustness.
3.2.1.2 Enhanced Vegetation Index Timeseries Confirmation
After drawing a polygon around a suspected irrigated or non-irrigated area, the second step in the VC label acquisition process entails inspection of the median Sentinel-2 EVI timeseries of all pixels contained within the polygon; this step is shown in the plot windows of Figure 2. Here, all available Sentinel-2 imagery with less than 20% cloud cover between 1 June 2020, and 1 June 2021 is retrieved; a cubic spline is then fit to all available data to generate continuous EVI timeseries. For potential irrigated polygons, if the EVI timeseries shows a clear peak above 0.2 during the dry season, it is confirmed as irrigated. Similarly, for potential non-irrigated polygons, an EVI timeseries that demonstrates a single vegetation cycle attributable to Ethiopia’s June to September rains is taken as confirmation of a non-irrigated VC polygon. However, if the EVI timeseries does not confirm the expected irrigated/non-irrigated class, or if the plotted EVI error bars (representing ±one standard deviation of the EVI values at that timestep) indicate a level of signal noise within the polygon that prevents the identification of a clear vegetation phenology, the polygon is discarded.
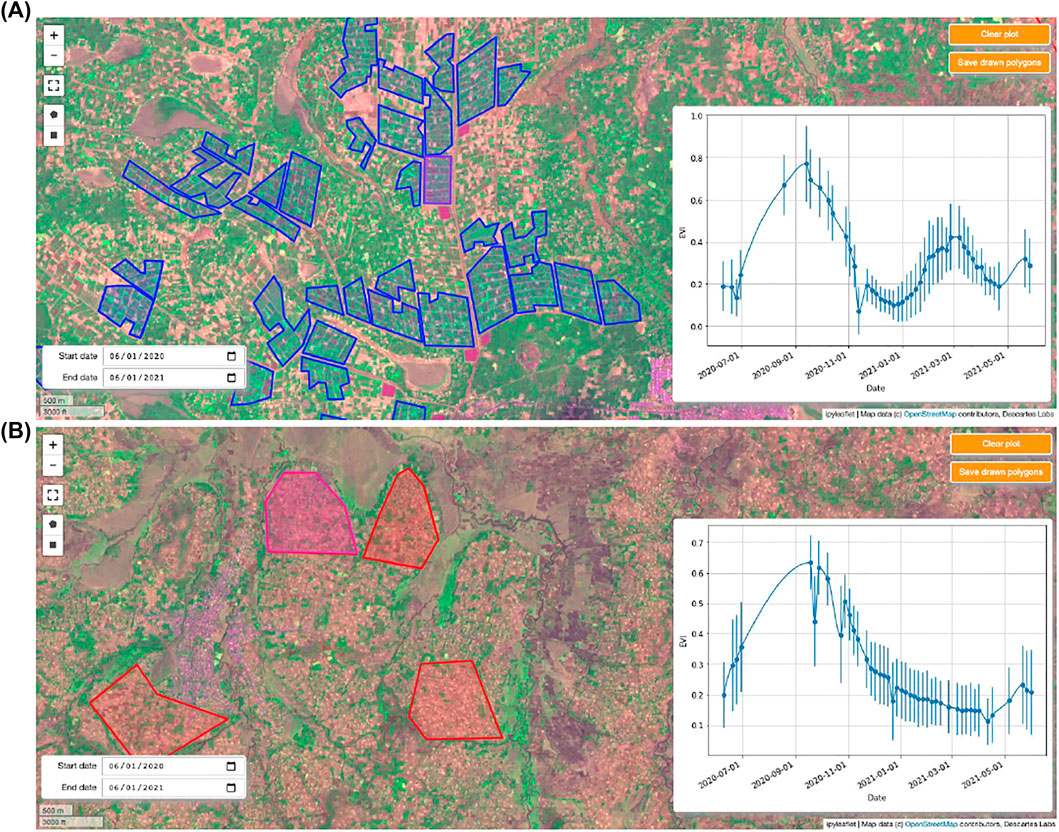
FIGURE 2. Example of the visual collection (VC) labeling process in Koga using the Descartes Labs platform. Blue polygons denote areas determined to be irrigated; red polygons are determined to be non-irrigated. Background imagery is a false-color Sentinel-2 image taken in March 2021: Red, near-infrared, and blue bands are presented in the RGB channels, respectively. In (A), the Sentinel-2 enhanced vegetation index (EVI) timeseries is shown for the drawn purple rectangle in the middle of the window; in (B), the Sentinel-2 EVI timeseries is shown for the drawn pink, semi-octagonal polygon in the top left of the window. Both timeseries present the median EVI values for all pixels contained within the drawn polygon; the error bars show one standard deviation of these values above and below the median. In both figures, the drawn polygons are confirmed as VC labels, since they meet the definitions of irrigation/non-irrigation, respectively.
Figure 2A demonstrates an example of irrigated VC label collection in the Koga region—here, the double vegetation peak present in the EVI timeseries confirms the purple polygon in the center of the window as irrigated (blue polygons indicate areas already saved as irrigated VC labels). Figure 2B demonstrates the same process for non-irrigated VC labels, also in Koga: The single EVI peak in October 2020 confirms the pink polygon in the top left of the window as non-irrigated (red polygons indicate areas already saved as non-irrigated VC labels).
3.2.1.3 Cluster Cleaning
The third step in the VC label acquisition process involves bulk verification of the collected timeseries by means of cluster cleaning. For each VC region, all pixels that reside within labeled polygons are collected and split based on the irrigated/non-irrigated class labels of the polygons. Fifteen-component Gaussian mixture models are fit to each class’s data to extract the dominant phenologies contained within the region’s samples; the EVI timeseries representing the cluster centroids are then plotted, with the plot legend displaying the number of samples per cluster. Figure 3A presents the results of this initial clustering for the Koga region.
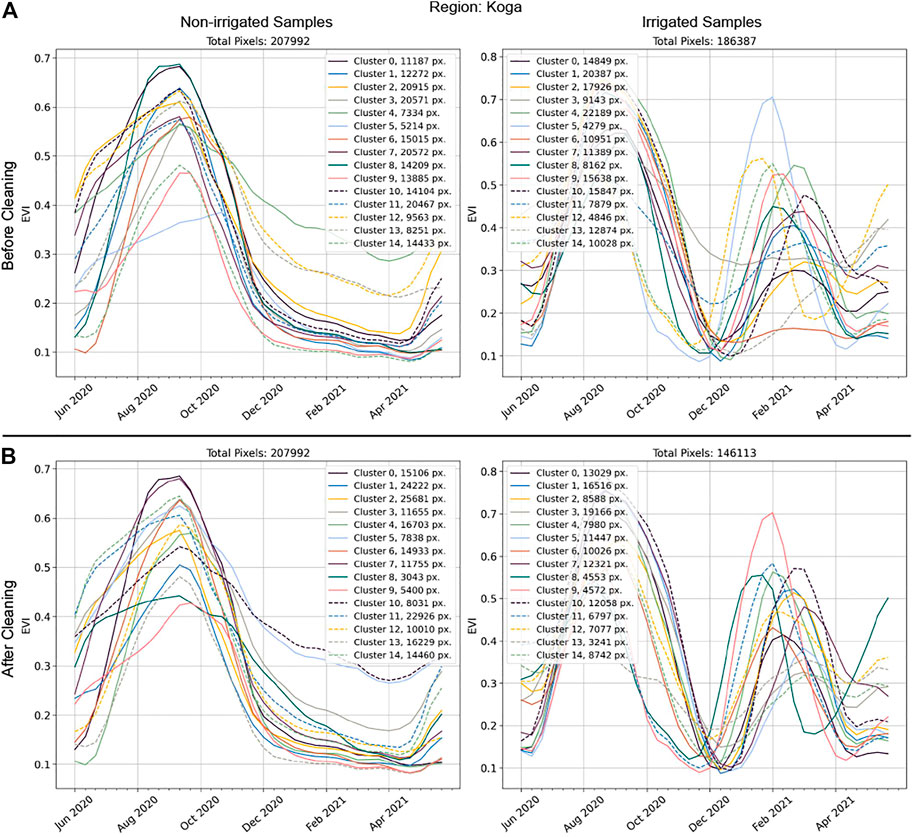
FIGURE 3. Clustered enhanced vegetation index (EVI) timeseries before and after cluster cleaning for the Koga visual collection (VC) region. Before and after cleaning, pixels are grouped into one of 15 randomly indexed clusters. In (A), Clusters 3, 6, and 13 of the irrigated samples are discarded due to either (6, 13) not containing a clear EVI peak above 0.2 during the dry season (December 1st to April 1st); or (3) not containing successive EVI values below 0.2. All non-irrigated clusters display a single vegetation peak aligned with the main rainy season, and the irrigated clusters after cleaning (B) all display a vegetation cycle during the dry season.
From the initial cluster timeseries, an iterative process begins to ensure that all cluster timeseries align with the specified class label. For an irrigated cluster timeseries to be kept, it must contain multiple successive EVI values above and below 0.2, and it must contain a clear EVI peak above 0.2 during the dry season. Analogously, non-irrigated cluster timeseries are discarded if they display a clear dry-season EVI peak above 0.2. If these conditions are not met—as is the case for Clusters 3, 6, and 13 of the Koga irrigated samples, which do not contain a clear EVI peak above 0.2 between 1 December 2020 and 1 April 2021 (Clusters 6 and 13) or do not senesce below an EVI threshold of 0.2 for successive timesteps (Cluster 3)—all pixel timeseries associated with that cluster are discarded from the labeled data. This process is repeated until all 15 clusters for both classes demonstrate EVI signals that meet the non-irrigated/irrigated class definitions. The final, cleaned cluster timeseries for the Koga region are shown in Figure 3B.
Cluster-cleaning is performed for all regions’ labeled data, including labeled data collected from the GC region, Tana. For increased visibility into the labeled data collected and used for training, these regions’ clusters before and after cleaning are included in Supplementary Appendix SA of the Supplementary Material.
A summary of the number of collected polygons and cleaned pixel timeseries samples in each region is shown in Supplementary Tables S2, S3: In total, 1,207,233 non-irrigated samples and 907,887 irrigated samples are used, taken from 1702 to 750 labeled polygons, respectively. For model training and evaluation, data are divided among training, validation, and test splits2. Here, polygons in each labeled region are split according to a 70/15/15 training/validation/test ratio; this method ensures that highly similar pixels from within the same polygon do not exist across training configurations, a division of data that would artificially inflate model performance for the task of predicting irrigation over pixel timeseries unseen by the model. All training, validation, and testing is performed pixelwise (i.e., having removed the spatial relationships of samples).
The Supplementary Material contain additional information about the labeled data distributions, including a statistical evaluation of the similarity of labeled samples across region and class (Supplementary Tables S4, S5).
3.3 Prediction Admissibility Criteria
Given that irrigated phenologies exist over a small fraction of the total land area of the Ethiopian Highlands, and that there are many types of land cover that do not fall within this paper’s non-irrigated/irrigated cropland dichotomy, a set of criteria are imposed to exclude pixel phenologies that are not cropland or are highly unlikely to be irrigated. Table 1 presents five criteria that must all be met for a pixel timeseries to be potentially irrigated and the motivation behind each.
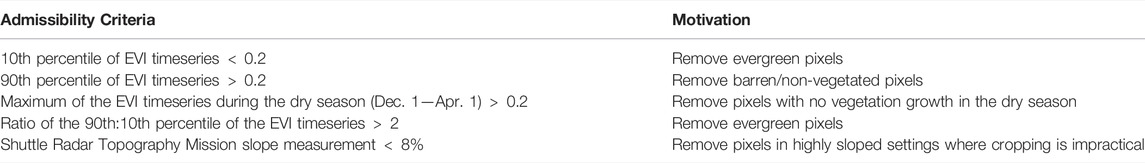
TABLE 1. Prediction admissibility criteria. All criteria need to be satisfied for a prediction to be admitted as irrigated.
These vegetation-specific criteria are informed by the EVI distributions of labeled irrigated samples for all label collection regions: Supplementary Figure S3 contains cumulative distribution functions (CDFs) for the 10th and 90th EVI timeseries percentiles, the 90th:10th EVI timeseries percentile ratio, and the maximum EVI value during the dry season. CDFs are presented for all regions’ irrigated samples, including for a set of polygons collected over evergreen land cover areas.
The criteria in Table 1 are also used to create a reference irrigation classifier that does not rely on machine learning. For this reference classifier, if all 5 conditions are met, the sample is deemed irrigated; if any of the conditions is not satisfied, the sample is deemed non-irrigated.
3.4 Model Training
3.4.1 Model Architectures
Five separate classifier types are compared to determine the model architecture with the most robust irrigation detection performance across regions. The first two classifiers are decision tree-based: A random forest with 1000 trees (Breiman, 2001); and a CatBoost model that uses gradient boosting on up to 1000 trees (Dorogush et al., 2017). The other three classifiers are neural networks (NN): A baseline network, a long short-term memory (LSTM)-based network, and a transformer-based network. For comparability, these three classifier architectures are designed to have similar structures, based on the strong baseline model structure proposed in (Wang et al., 2017); as seen in Figure 4, they differ only in the type of encoding blocks used.
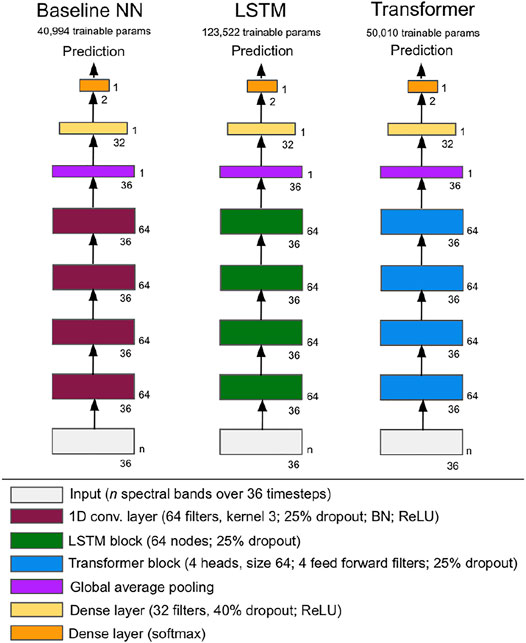
FIGURE 4. Neural network (NN) model architectures tested as irrigation detection classifiers. Model architectures are consistent by design; only encoding blocks differ across networks.
3.4.2 Model Training Strategy
The implemented model training strategy addresses two potential pitfalls among training processes: 1) Imbalanced samples across region and class; and 2) high similarity among samples within a region that may not reflect the sample distributions across all regions. Consistent with best practices in dealing with imbalanced data, this first issue is addressed with 1) class balancing weights specific to each region, based on the “balanced” heuristic inspired by King and Zeng (2001); and 2) a region-specific weight equal to the ratio of the maximum number of samples in any region to the number of samples for the region in question. Both class-balancing and region-balancing weights are used in all training configurations.
To address potential redundancy and time-specificity among samples within a region, random shifts are applied to all input timeseries. The sizes of these random shifts vary between −3 and +3 timesteps (corresponding to between −30 and +30 days), with an equal probability of all 7 possible shifts occurring (including a shift by 0 timesteps). Random shifts are applied to all samples in the training and validation sets and differ for each sample every time it is seen by the model. No shifts are applied to the samples in the testing sets.
The primary metric for performance evaluation is the F1 score on the test datasets of regions withheld from training. Accordingly, performance is assessed in a manner that prioritizes classifier robustness—i.e., performance in regions unseen during training—and not in a manner that could be inflated by close similarity of samples within a region. For reference, the F1 score balances prediction precision and recall, and is calculated per Eq. 1.
The training strategy differs for the tree-based classifiers and for the neural network-based classifiers. As training the tree-based classifiers occurs across a single batch with no iteration across epochs, there is no need for separate validation and testing datasets: The training and validation datasets of all included regions are therefore combined to create a single training dataset. After training on this combined dataset, performance is evaluated across the test datasets.
In contrast, training neural network-based models takes place by batch across epochs, and a validation set is required to guide the training process. For a given training step, one batch from each region is concatenated, with the combined output shuffled before model intake. After the epoch is finished, performance is assessed on the validation set of each region included in training. If the minimum F1 score among all regions’ validation sets has increased from its previous maximum, the model weights are saved; however, if the minimum F1 score has not increased from its previous high point, the model weights are discarded. Minimum F1 score across all validation regions is selected as the weight update criteria to ensure model robustness: Consistent performance across the entire area of interest is desired, not high performance in one set of regions and poor performance in another. Training concludes once the minimum validation region F1 score has not improved for 10 training epochs, or after 30 epochs have been completed. After training, model weights are loaded from the epoch with the highest minimum validation region F1 score; performance of this model on the test datasets of all regions is then reported. For all training runs, a binary cross-entropy loss, a learning rate of 1e-4, and an Adam optimizer (Kingma and Ba, 2015) are specified. Inputs are standardized to a mean of 0 and standard deviation of 1 using statistics from the entire set of labeled samples.
4 Results
4.1 Model Sensitivity
Figure 5 presents withheld VC region test dataset F1 scores for three different types of model input—one that includes all spectral bands for all timesteps; one that includes only the EVI layer for all timesteps; and one that includes only the EVI layer for all timesteps with the random sample shift applied. Here, the performance of models trained on all combinations of VC regions is evaluated; these results are organized along the x-axis by the number of VC regions included during training. Each x-axis tick label also includes in parentheses the number of withheld VC region test dataset evaluations, n, for all models trained on x included VC regions3. Mean and 10th percentile values of the n performance evaluations are displayed for each x between 1 and 6. All results are presented for the transformer model architecture; however, these findings are agnostic to the classifier architecture selected.
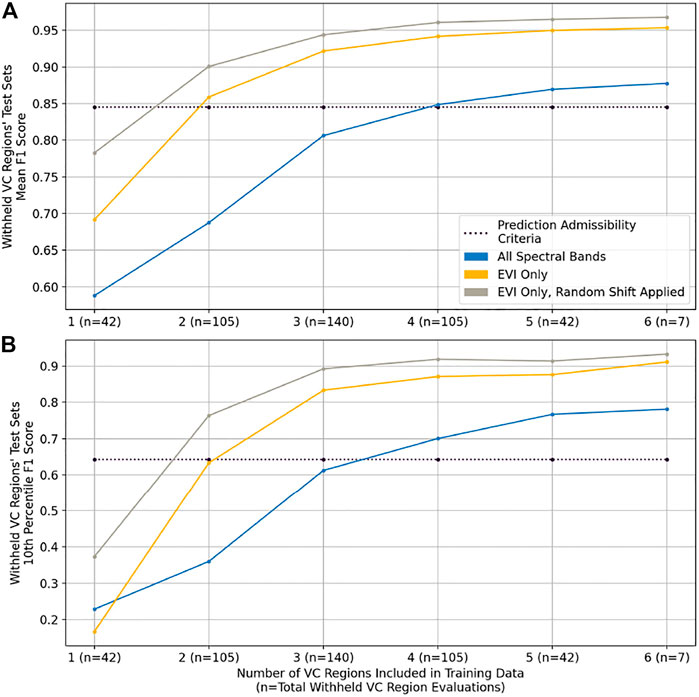
FIGURE 5. Withheld region test dataset performance for different types of model input, organized along the x-axis by the number of regions included during training. (A) presents mean F1 score over the withheld regions; (B) presents the 10th percentile F1 score over the withheld regions. Results indicate that model inputs of randomly shifted enhanced vegetation index (EVI) timeseries yield the best classifier performance. F1 scores from classification based on the prediction admissibility criteria are presented for reference.
Figure 5 demonstrates that models trained on samples containing only EVI timeseries outperform those that include all spectral bands at all timesteps, both on average Figure 5A and in low performing regions Figure 5B. The 10th percentile of withheld regions’ F1 scores is shown in order to understand the low-end of model performance without accounting for outliers. For reference, classifier performance based on the prediction admissibility criteria is also included. Figure 5 shows that explicitly feeding classification models information about samples’ vegetation content—i.e., feature engineering—allows for better performance compared to models that intake the 10 Sentinel-2 L2A spectral bands containing ground information. Introducing a random temporal shift to the EVI timeseries further increases performance; by increasing the sample variance seen by the model, randomly shifting the input timeseries improves model transferability. Supplementary Figure S4 provides additional evidence of the benefits of this training strategy: A gradient class-activation map shows that a classifier trained on randomly shifted timeseries better identifies dry season vegetation as predictive of irrigation presence.
Taken together, randomly shifted EVI timeseries increase withheld region F1 scores by an average of 0.22 when only 2 VC regions are included in the training data, compared to models that use all spectral bands. As performance begins to plateau with 4 or more VC regions included in the training data, this gap shrinks to an improvement of 0.10. Similar results can be seen in Figure 5B for the low-end of performance: Extracting and randomly shifting EVI timeseries increase the 10th percentile of withheld region F1 scores by 0.40 when 2 VC regions are included in the training data, a difference that shrinks to approximately 0.14 with 5 or more VC regions in the training data. Two additional findings are gleaned from the results for the models trained on randomly shifted EVI timeseries (i.e., the grey curve). First, a classifier trained on data from 2 VC regions or more outperforms the pixel filtering baseline. Second, increasing the number of VC regions included in the training set improves withheld region prediction performance up until 4 VC regions before tapering off.
Figure 6 displays Figure 6A mean and Figure 6B 10th percentile F1 score for all combinations of VC regions included in training for the 5 classification models tested, along with the reference classifier based on the prediction admissibility criteria. Figure 6 demonstrates that the transformer architecture is most robust for all combinations of VC training regions, followed closely by the CatBoost architecture for all training configurations with 2 or more VC regions. Moreover, for models with 5 or 6 VC regions included in training, mean and low-end F1 scores for these two architectures are practically indistinguishable at 0.97 and 0.92, respectively. The Supplementary Material contain further comparisons between Transformer and CatBoost performance (see Supplementary Table S6), showing that when each model is trained on all 7 VC regions’ training data, the two models demonstrate an average regional prediction alignment of 98.9%. Moreover, an ablation study on training dataset size finds that reducing the proportion of polygons in the training set from 70 to 15% has minimal impact on prediction performance (Supplementary Figure S5). Lastly, Figure 6 shows that the LSTM architecture does not noticeably improve performance compared to the baseline neural network, and that the trained Random Forest models yield the worst performance in withheld regions.
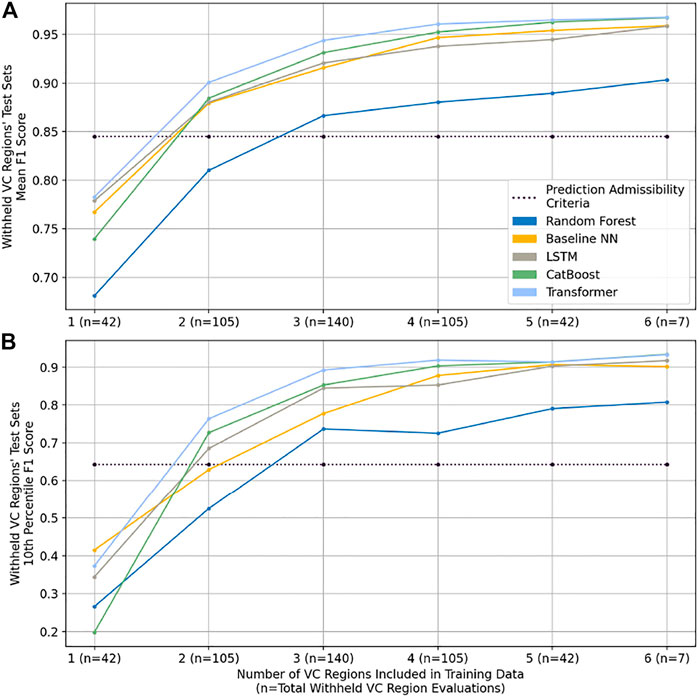
FIGURE 6. Withheld region test dataset performance for different classifier models, organized along the x-axis by the number of regions included during training. (A) presents mean F1 score over the withheld regions; (B) presents the 10th percentile F1 score over the withheld regions. Results indicate that the transformer based classifier yields the best performance, followed closely by the CatBoost model. F1 scores from classification based on the prediction admissibility criteria are presented for reference.
Next, prediction performance over the unseen ground-collected samples in Tana is assessed. As the transformer model demonstrates the most robust performance over withheld regions’ samples, it is selected for prediction, achieving 96.7% accuracy over irrigated samples (88,128/91,898) and 95.9% accuracy over non-irrigated samples (33,954/35,121) for an F1 score of 0.932. It is again worth noting that these high accuracies are achieved over the GC samples without the classification model seeing any labeled data from the Tana region during training.
4.2 Model Inference
For model inference, the transformer architecture is trained on the randomly shifted EVI timeseries of the labeled data from the 7 VC and 1 GC regions. The trained model is then deployed over Tigray and Amhara for the 2020 and 2021 dry seasons (using imagery collected between 1 June 2019 and 1 June 2020; and between 1 June 2020 and 1 June 2021, respectively). Two post-processing steps are then taken: 1) The prediction admissibility criteria are applied, and 2) contiguous groups of predicted irrigated pixels smaller than 0.1 Ha are removed in order to ignore isolated, outlier predictions.
During inference, another step is taken to verify the accuracy of irrigation predictions. Here, five additional enumerators collect 1601 labeled polygons for the 2020 and 2021 dry seasons—1082 non-irrigated polygons covering 3,807 Ha and 519 irrigated polygons covering 582 Ha—across the extent of Amhara via the same labeling methodology used to collect the training, validation, and testing data. The locations of these independently labeled polygons are shown in Supplementary Figure S6. After cluster cleaning and applying the prediction admissibility criteria, these polygons yield 361,451 non-irrigated samples and 48,465 irrigated samples. An F1 score of 0.917 is achieved over these samples—98.3% accuracy over non-irrigated samples and 95.5% accuracy over irrigated samples—performance that remains in line with the reported test dataset metrics from Figure 6 and accuracies over the withheld Tana ground-collected labels.
Due to text constraints, Figures 7, 8 present bitemporal irrigation maps at a resolution far coarser than their native 10 m. The full resolution, georeferenced irrigation maps are available from the corresponding author upon request.
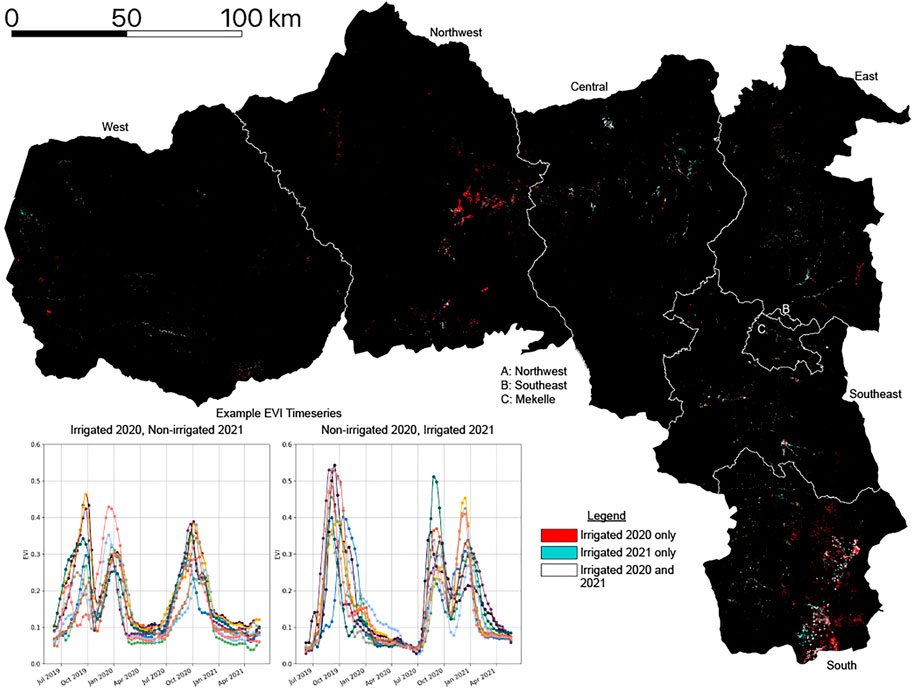
FIGURE 7. Bitemporal irrigation map for Tigray. Figure inset contains example EVI timeseries predicted as irrigated in either 2020 or 2021. A predominance of red indicates that many parts of Tigray contain irrigation detected in 2020 but not in 2021.
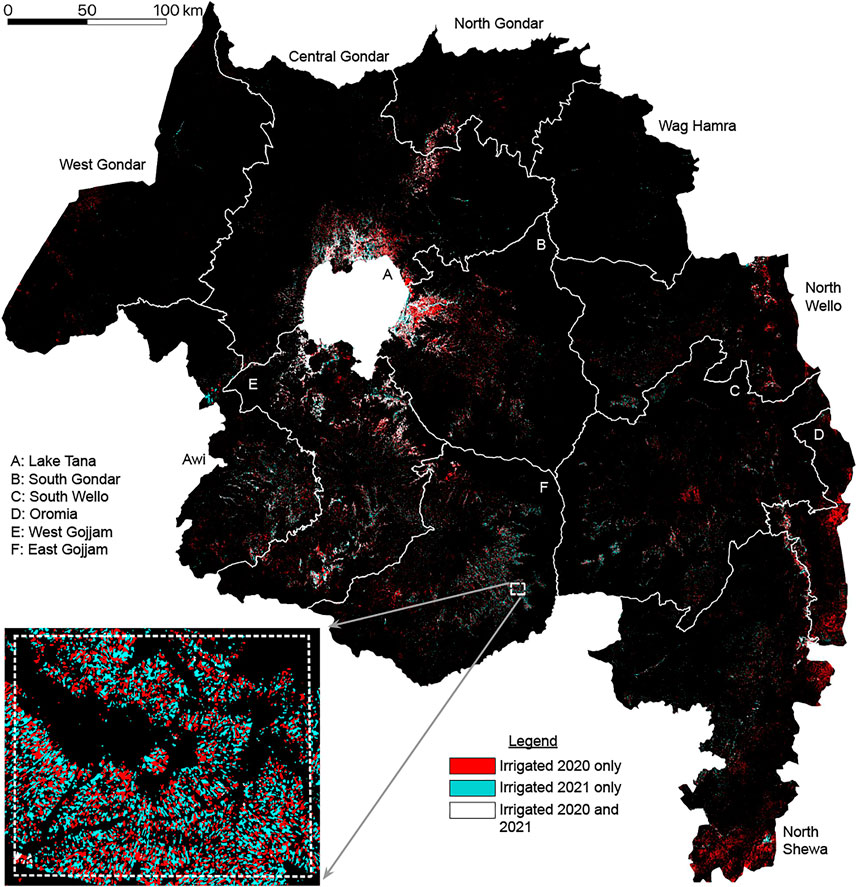
FIGURE 8. Bitemporal irrigation map for Amhara. Figure inset contains example predictions around Choke Mountain displaying interannual irrigation patterns. A predominance of red indicates that many parts of Amhara contain irrigation detected in 2020 but not in 2021.
4.2.1 Tigray
Figure 7 presents predicted irrigated areas in Tigray for 2020 and 2021, with 2020 irrigation predictions in red and 2021 irrigation predictions in cyan. To better understand the nature of changing vegetation phenologies across this time period, the inset of Figure 7 contains example timeseries that produced an irrigation prediction in one of 2020 or 2021. These example timeseries show that a second crop cycle with vegetation growth peaking in January is associated with a positive irrigation prediction; in contrast, the non-existence of this cycle is associated with non-irrigated prediction. Table 2 displays the total predicted irrigated area for Tigray for 2020 and 2021, along with the total land area, organized by zone. Between 2020 and 2021, Table 2 quantifies a 39.8% decline in irrigated area in Tigray.

TABLE 2. Predicted irrigated area statistics in Tigray for 2020 and 2021, organized by zone.
4.2.2 Amhara
Figure 8 presents a bitemporal irrigation map for Amhara, also with 2020 irrigation predictions in red and 2021 irrigation predictions in cyan. This map contains large clusters of irrigated predictions around Lake Tana in the zones of Central Gondar, South Gondar, and West Gojjam, an intuitive finding given the availability of water from Lake Tana and the rivers that extend off it. Irrigation is also detected in the portions of Amhara’s easternmost zones that fall within the Main Ethiopian Rift (MER); as the valley formed by the MER extends north into Tigray, irrigation predictions in the North Wello, Oromia, and North Shewa zones align with irrigation predictions in the Southern zone of Tigray shown in Figure 7. Table 3 displays the total predicted irrigated area for Amhara for 2020 and 2021, along with the total land area, organized by zone. From 2020 to 2021, Table 3 quantifies a 41.6% decline in irrigated area in Amhara.
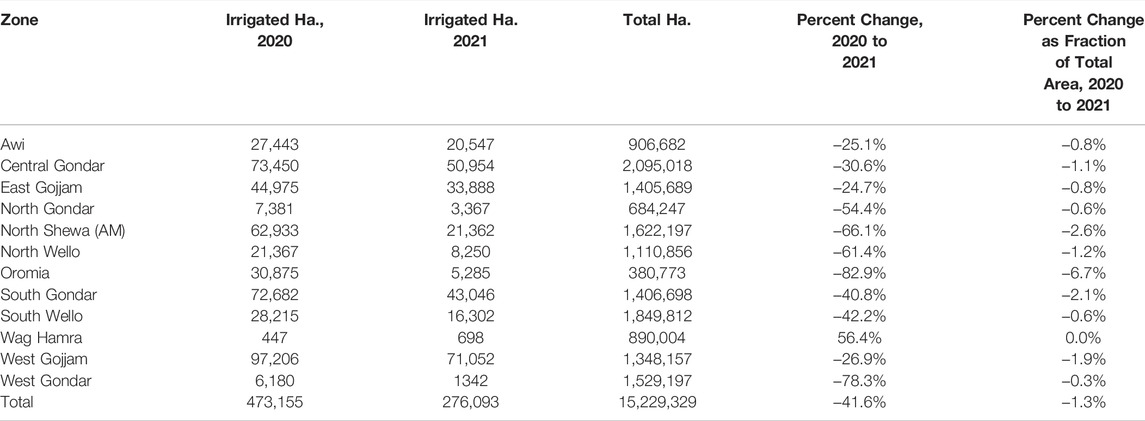
TABLE 3. Predicted irrigated area statistics in Amhara for 2020 and 2021, organized by zone.
The inset of Figure 8 presents interannual irrigated cropping patterns for an area southwest of Choke Mountain. Interlocking red and cyan plots indicate the spatial rotation of irrigated crops from 2020 to 2021; no white plots are observed, which would signify dry season crop growth in both years.
5 Discussion
This paper makes a set of contributions to the literature for learning from limited labels. First, it demonstrates a process of collecting training data to supplement ground-collected labels that improves on previous methods of sample collection—such as using imagery from a single timestep or simple vegetation content heuristics—as it verifies the existence or non-existence of full vegetation cycles during the dry season. Second, an evaluation of inputs, classifier architectures, and training strategies is presented for achieving irrigation classifier applicability to a larger area. Results indicate that enhanced vegetation index (EVI) timeseries outperform a full set of spectral bands as inputs; that randomly shifting input timeseries prevents classifier models from overfitting to region-specific input features; and that a transformer-based neural network produces the highest prediction accuracies in unseen target regions. Due to the close similarity of performance metrics and alignment of predictions, the faster training, more easily interpretable CatBoost architecture is also shown as a suitable alternative for irrigation mapping efforts.
Prediction results indicate strong classifier performance over sample timeseries from regions not seen during training. On data from withheld target regions, transformer-based classifiers achieve mean F1 scores above 0.95 when four or more regions’ data are included during training; using labels from all 7 visual collection (VC) regions, the transformer-based classifier achieves an F1 score of 0.932 on the ground collection (GC) labels around Lake Tana. Over an independently collected set of more than 400,000 samples collected for performance assessment, the same classifier achieves 98.3% accuracy over non-irrigated samples and 95.5% accuracy over irrigated samples, demonstrating strong performance throughout the entire Ethiopian Highlands.
Deploying a transformer-based classifier trained on samples from all 8 label collection regions yields insight into changing irrigation patterns. Results suggest that from 2020 to 2021, irrigation in Tigray and Amhara decreased by 40%. In Tigray, this decline was most precipitous in the Northwest and Southern zones, which saw percent changes in irrigated area of −72.3% and −51.1%, respectively. The Western zone of Tigray was the only zone to see an increase in irrigated area from 2020 to 2021; even so, this increase amounted to 279 Ha in a zone with a total area of 1,331,652 Ha. Amhara is predicted to have had similar decreases in irrigated area: Apart from the Wag Hamra zone, which was predicted to have less than 0.08% of its area irrigated in 2020 or 2021, all zones in Amhara experienced a change in irrigated area between −25.0% and -82.3%. The largest declines by area occurred in North Shewa (−41,572 Ha), South Gondar (−29,636 Ha), and West Gojjam (−26,154 Ha). Combined, results for Tigray and Amhara predict severe reductions in dry season crop growth from 2020 to 2021, findings that align with recent reports of food insecurity following the eruption of civil conflict in Ethiopia in late 2020.
Despite presented performance metrics indicating high levels of prediction accuracy, there are a few limitations to the proposed methodology that are important to mention. First, the study area is limited to the Ethiopian Highlands, a highly agricultural, climatologically consistent area that is dominated by rainfed cropped phenologies. As the irrigation classifiers are only trained to separate dry season crop cycles from rainfed vegetation cycles—associating identified dry-season cropping with irrigation presence—they will perform poorly in settings with different rainfall and phenological patterns. Relatedly, the trained irrigation classifiers do not identify irrigation used to supplement rainy season precipitation, irrigation of perennial tree crops, evergreen vegetation in riparian areas, or irrigation that supports continuous cropping, as the phenological signatures of these types of vegetation are difficult to distinguish from evergreen, non-cropped signatures. This discrimination task is left for future work. Lastly, classifiers are trained only on cropped phenologies, which constitute a portion of the vegetation signatures that exist in the area of interest. To manage the other phenologies present at model inference, prediction admissibility criteria are implemented. Nevertheless, these criteria are imperfect: There are surely irrigated pixels which have been mistakenly assigned a non-irrigated class label, along with non-cropped pixels which have evaded the admissibility criteria.
While the presented methodology is applied only for the task of irrigation identification in the Ethiopian Highlands, the strategy of regional phenological characterization to provide context for geographically informed selection of training samples and model applicability can be transferred more broadly to a range of land process mapping objectives. The suitability of this approach in the field of machine learning with limited labels is supported by results comparing classifier architectures and hyperparameter choice to assess the question of result uniqueness that overshadows all land cover classifications. As discussed by Small (2021), what is presented as the map is often just a map—one of many different products that can be obtained from the same set of inputs with different classifiers and hyperparameter settings. By assessing multiple classifier architectures and quantifying prediction sensitivity, this approach demonstrates consistency in results and indicates the uncertainty that can be expected of the resulting irrigation maps; as such, it provides a process for building robust classifiers in settings with scarce labeled data.
Data Availability Statement
The raw data supporting the conclusion of this article will be made available by the authors, without undue reservation.
Author Contributions
TC and VM conceived of the study, which was led by VM. TC developed and implemented the methodology, analyzed the results, and produced the data visualizations. CS introduced the concept of multiscale phenological context and devised the spatiotemporal mixture model. VM consulted in all steps of these processes. TC is the primary author of the paper, which was prepared with editorial assistance from CS and VM.
Funding
Partial support for this effort was provided by the National Science Foundation (INFEWS Award Number 1639214), Columbia World Projects, Rockefeller Foundation (eGuide Grant 2018POW004), OPML United Kingdom (DFID) and Technoserve (BMGF).
Conflict of Interest
The authors declare that the research was conducted in the absence of any commercial or financial relationships that could be construed as a potential conflict of interest.
Publisher’s Note
All claims expressed in this article are solely those of the authors and do not necessarily represent those of their affiliated organizations, or those of the publisher, the editors and the reviewers. Any product that may be evaluated in this article, or claim that may be made by its manufacturer, is not guaranteed or endorsed by the publisher.
Acknowledgments
The authors are grateful to Jack Bott, Yinbo Hu, Hasan Siddiqui, and Yuezi Wu for their assistance in labeling. The authors would like to thank Gunther Bensch (RWI), Andrej Kveder (OPML), Abiy Tamerat (EthioResource Group), Yifru Tadesse (ATA Ethiopia), and Esther Kim (Technoserve) for their assistance with field data collection efforts; Rose Rustowicz for guidance in using of Descartes Labs platform; and colleagues Jay Taneja (UMass Amherst), Markus Walsh (AfSIS), and Edwin Adkins (Columbia) for their continued stimulating discussions and guidance.
Supplementary Material
The Supplementary Material for this article can be found online at: https://www.frontiersin.org/articles/10.3389/frsen.2022.871942/full#supplementary-material
Footnotes
1See Wakjira et al. (2021) for a fuller discussion of rainfall patterns in Ethiopia.
2In splitting the labeled data, the training/validation/testing terminology standard in machine and deep learning literature is adopted.
3An example helps explain the calculation of n values: Given x = 2 VC regions included in training, there remain 5 VC regions unseen by the classifier. As there are
References
Abbasi, B., Arefi, H., Bigdeli, B., and Roessner, S. (2015). Automatic Generation of Training Data for Hyperspectral Image Classification Using Support Vector Machine. Int. Arch. Photogramm. Remote Sens. Spat. Inf. Sci. XL-7/W3 (7W3), 575–580. doi:10.5194/isprsarchives-XL-7-W3-575-2015
Banerjee, B., Bovolo, F., Bhattacharya, A., Bruzzone, L., Chaudhuri, S., and Mohan, B. K. (2015). A New Self-Training-Based Unsupervised Satellite Image Classification Technique Using Cluster Ensemble Strategy. IEEE Geosci. Remote Sensing Lett. 12 (4), 741–745. doi:10.1109/LGRS.2014.2360833
Bazzi, H., Baghdadi, N., Amin, G., Fayad, I., Zribi, M., Demarez, V., et al. (2021). An Operational Framework for Mapping Irrigated Areas at Plot Scale Using sentinel-1 and sentinel-2 Data. Remote Sensing 13 (13), 2584–2612. doi:10.3390/rs13132584
Bazzi, H., Baghdadi, N., Fayad, I., Zribi, M., Belhouchette, H., and Demarez, V. (2020). Near Real-Time Irrigation Detection at Plot Scale Using sentinel-1 Data. Remote Sensing 12 (9), 1456. ISSN 20724292. doi:10.3390/RS12091456
Chen, Y., Lu, D., Luo, L., Pokhrel, Y., Deb, K., Huang, J., et al. (2018). Detecting Irrigation Extent, Frequency, and Timing in a Heterogeneous Arid Agricultural Region Using MODIS Time Series, Landsat Imagery, and Ancillary Data. Remote Sensing Environ. 204 (2017), 197–211. ISSN 00344257. doi:10.1016/j.rse.2017.10.030
Conlon, T., Wu, Y., Small, C., Siddiqui, H., Adkins, E., and Modi, V. (2020). “A Novel Method of Irrigation Detection and Estimation of the Effects of Productive Electricity Demands on Energy System Planning,” in AGU Fall Meeting Abstracts (IEEE), GC034–08.
Deng, J., Dong, W., Socher, R., Li, L-J., Li, K., and Fei-Fei, L. (2009). “ImageNet: A Large-Scale Hierarchical Image Database,” in 2009 IEEE Conference on Computer Vision and Pattern Recognition (Miami, FL, USA: IEEE), 248–255. doi:10.1109/cvprw.2009.5206848
Dorogush, A. V., Gulin, A., Gusev, G., Kazeev, N., Prokhorenkova, L. O., and Vorobev, A. (2017). Fighting Biases with Dynamic Boosting. Computing Research Repository, abs/1706.09516. http://arxiv.org/abs/1706.09516.
Gebregziabher, G., Namara, R. E., and Holden, S. (2009). Poverty Reduction with Irrigation Investment: An Empirical Case Study from Tigray, Ethiopia. Agric. Water Manag. 96 (12), 1837–1843. ISSN 03783774. doi:10.1016/j.agwat.2009.08.004
Huete, A., Justice, C., and Van Leeuwen, W. (1999). MODIS Vegetation Index (MOD13) Algorithm Theoretical Basis Document. Earth Observing Syst. 3 (213), 295–309.
King, G., and Zeng, L. (2001). Logistic Regression in Rare Events Data. Polit. Anal. 9 (2), 137–163. ISSN 15487660. doi:10.1093/oxfordjournals.pan.a004868
Kingma, D. P., and Ba, J. L. (2015). “Adam: A Method for Stochastic Optimization,” in 3rd International Conference on Learning Representations, ICLR 2015-Conference Track Proceedings (IEEE), 1–15.
Lecun, Y., Bengio, Y., and Hinton, G. (2015). Deep Learning. Nature 521 (7553), 436–444. ISSN 14764687. doi:10.1038/nature14539
Li, Y., Zhang, H., Xue, X., Jiang, Y., and Shen, Q. (2018). Deep Learning for Remote Sensing Image Classification: A Survey. Wires Data Mining Knowl Discov. 8 (6), 1–17. ISSN 19424795. doi:10.1002/widm.1264
Liew Soo Chin, Y., and Chin, L. S. (2016). “A Simplified Training Data Collection Method for Sequential Remote Sensing Image Classification,” in 4th International Workshop on Earth Observation and Remote Sensing Applications, EORSA 2016-Proceedings (IEEE), 329–332. doi:10.1109/EORSA.2016.7552823
Naik, P., and Kumar, A. (2021). A Stochastic Approach for Automatic Collection of Precise Training Data for a Soft Machine Learning Algorithm Using Remote Sensing Images. Singapore: Springer, 285–297. doi:10.1007/978-981-16-2712-5_24
Ozdogan, M., Yang, Y., Allez, G., and Cervantes, C. (2010). Remote Sensing of Irrigated Agriculture: Opportunities and Challenges. Remote Sensing 2 (9), 2274–2304. ISSN 20724292. doi:10.3390/rs2092274
Phiri, D., Simwanda, M., Salekin, S., Nyirenda, V., Murayama, Y., and Ranagalage, M. (2020). Sentinel-2 Data for Land Cover/use Mapping: A Review. Remote Sensing 12 (14), 2291. ISSN 2072-4292. doi:10.3390/rs12142291
Pires de Lima, R., and Marfurt, K. (2020). Convolutional Neural Network for Remote-Sensing Scene Classification: Transfer Learning Analysis. Remote Sensing 12 (1), 86. ISSN 20724292. doi:10.3390/rs12010086
Ramezan, C. A., Warner, T. A., Maxwell, A. E., and Price, B. S. (2021). Effects of Training Set Size on Supervised Machine-Learning Land-Cover Classification of Large-Area High-Resolution Remotely Sensed Data. Remote Sensing 13 (3), 368–395. doi:10.3390/rs13030368
Saha, S., Solano-Correa, Y. T., Bovolo, F., and Bruzzone, L. (2019). “Unsupervised Deep Learning Based Change Detection in Sentinel-2 Images,” in 2019 10th International Workshop on the Analysis of Multitemporal Remote Sensing Images, MultiTemp (IEEE), 0–3. doi:10.1109/Multi-Temp.2019.8866899
Shahriar Pervez, M., Budde, M., and Rowland, J. (2014). Mapping Irrigated Areas in Afghanistan over the Past Decade Using MODIS NDVI. Remote Sensing Environ. 149, 155–165. ISSN 0034-4257. doi:10.1016/J.RSE.2014.04.008
Sivaraj, P., Kumar, A., Koti, S. R., and Naik, P. (2022). Effects of Training Parameter Concept and Sample Size in Possibilistic C-Means Classifier for Pigeon Pea Specific Crop Mapping. Geomatics 2 (1), 107–124. doi:10.3390/geomatics2010007
Small, C. (2021). Grand Challenges in Remote Sensing Image Analysis and Classification. Front. Remote Sens. 1 (4), 1–4. doi:10.3389/frsen.2020.605220
Small, C. (2012). Spatiotemporal Dimensionality and Time-Space Characterization of Multitemporal Imagery. Remote Sensing Environ. 124, 793–809. ISSN 00344257. doi:10.1016/j.rse.2012.05.031
Stivaktakis, R., Tsagkatakis, G., and Tsakalides, P. (2019). Deep Learning for Multilabel Land Cover Scene Categorization Using Data Augmentation. IEEE Geosci. Remote Sensing Lett. 16 (7), 1031–1035. ISSN 15580571. doi:10.1109/LGRS.2019.2893306
Stromann, O., Nascetti, A., Yousif, O., and Ban, Y. (2020). Dimensionality Reduction and Feature Selection for Object-Based Land Cover Classification Based on Sentinel-1 and Sentinel-2 Time Series Using Google Earth Engine. Remote Sensing 12 (1), 76. doi:10.3390/RS12010076
Tao, C., Qi, J., Lu, W., Wang, H., and Li, H. (2022). Remote Sensing Image Scene Classification with Self-Supervised Paradigm under Limited Labeled Samples. IEEE Geosci. Remote Sen. Lett. 19, 1–5. doi:10.1109/LGRS.2020.3038420
Vogels, M., de Jong, S., Sterk, G., Douma, H., and Addink, E. (2019b). Spatio-temporal Patterns of Smallholder Irrigated Agriculture in the Horn of Africa Using GEOBIA and Sentinel-2 Imagery. Remote Sensing 11 (2), 143. ISSN 20724292. doi:10.3390/rs11020143
Vogels, M. F. A., de Jong, S. M., Sterk, G., and Addink, E. A. (2019a). Mapping Irrigated Agriculture in Complex Landscapes Using SPOT6 Imagery and Object-Based Image Analysis - A Case Study in the Central Rift Valley, Ethiopia -. Int. J. Appl. Earth Observation Geoinformation 75 (2018), 118–129. ISSN 1872826X. doi:10.1016/j.jag.2018.07.019
Wakjira, M. T., Peleg, N., Anghileri, D., Molnar, D., Alamirew, T., Six, J., et al. (2021). Rainfall Seasonality and Timing: Implications for Cereal Crop Production in Ethiopia. Agric. For. Meteorology 310, 108633. ISSN 01681923. doi:10.1016/j.agrformet.2021.108633
Wang, Z., Yan, W., and Oates, T. (2017). Time Series Classification from Scratch with Deep Neural Networks: A strong Baseline. Proc. Int. Jt. Conf. Neural Networks 2017, 1578–1585. doi:10.1109/IJCNN.2017.7966039
Wiggins, S., Glover, D., and Dorgan, A. (2021). Agricultural Innovation for Smallholders in Sub-saharan Africa. London, United Kingdom: Technical Report.
Yu, X., Wu, X., Luo, C., and Ren, P. (2017). Deep Learning in Remote Sensing Scene Classification: a Data Augmentation Enhanced Convolutional Neural Network Framework. GIScience & Remote Sensing 54 (5), 741–758. ISSN 15481603. doi:10.1080/15481603.2017.1323377
Keywords: spatiotemporal modeling, irrigation detection, multiscale imagery, machine learning, Ethiopia
Citation: Conlon T, Small C and Modi V (2022) A Multiscale Spatiotemporal Approach for Smallholder Irrigation Detection. Front. Remote Sens. 3:871942. doi: 10.3389/frsen.2022.871942
Received: 08 February 2022; Accepted: 18 March 2022;
Published: 14 April 2022.
Edited by:
Sudipan Saha, Technical University of Munich, GermanyReviewed by:
Jonathan Prexl, Technical University of Munich, GermanyParth Naik, University of Trento, Italy
Copyright © 2022 Conlon, Small and Modi. This is an open-access article distributed under the terms of the Creative Commons Attribution License (CC BY). The use, distribution or reproduction in other forums is permitted, provided the original author(s) and the copyright owner(s) are credited and that the original publication in this journal is cited, in accordance with accepted academic practice. No use, distribution or reproduction is permitted which does not comply with these terms.
*Correspondence: Terence Conlon, dGVyZW5jZS5jb25sb25AY29sdW1iaWEuZWR1