 Susanne Kratzer
 E. Therese Harvey
 Elisabetta Canuti
- 1Department of Ecology, Environment and Plant Sciences, Stockholm University, Stockholm, Sweden
- 2NIVA Denmark Water Research, Copenhagen S, Denmark
- 3Norwegian Institute for Water Research (NIVA), Oslo, Norway
- 4Water and Marine Resources Unit, Directorate for Sustainable Resources Joint Research Centre, European Commission, Ispra, Italy
Chlorophyll-a is an essential climate variable. Chlorophyll-a in situ measurements are usually used for the validation of satellite images. Previous intercomparisons have shown that there can be substantial differences between in situ laboratories. In order to shed light on these differences, we arranged international chlorophyll-a intercomparisons with eight participating laboratories during 1–2 July 2021. We performed two dedicated transects through Bråviken bay (NW Baltic proper) and sampled four stations in each transect along a chlorophyll-a gradient. We took three surface replicates per laboratory and per station, i.e., 24 samples per laboratory. The samples were filtered through Whatman GF/F filters, and filters were frozen in liquid nitrogen and distributed in dry ice to all laboratories together with chlorophyll-a standards. The results between labs compared quite well. The mean normalized bias (MNB) of the standard measurements ranged between −23% and +19% for all laboratories and −7% to +19% for the Baltic Sea laboratories compared to high-performance liquid chromatography. The MNB of the two Bråviken transects ranged between −23 and +17% for all laboratories (compared to the median of all spectrophotometric and fluorometric measurements) and between −2 and +17% for the Baltic Sea laboratories. On average, the chlorophyll-a concentrations measured by the fluorometric method were about 13% higher than those measured by spectrophotometry, and fluorometry samples tended to have more scatter. The largest uncertainties seem to be caused by variable storage and extraction methods and are not fully captured in this intercomparison. This is demonstrated by analyzing historical comparisons revealing very large uncertainties (root mean square difference (RMSD) up to 109% and bias up to 68%), possibly due to too low filtration volumes and due to different extraction and storage methods. Our recommendation is to flash-freeze samples in liquid nitrogen and store them at −80°C. After storage, they should be extracted and measured at room temperature within 6–24 h. Our results also indicate that ethanol is much more efficient in extracting Chl-a than acetone. Last but not least, we would like to point out that the uncertainties in measuring chlorophyll-a by satellite are now within the range of in situ data, as shown here by comparing the in situ results from this study with published remote sensing results from the literature.
1 Introduction
Phytoplankton constitutes the basis of aquatic food webs and the primary production of these minute organisms makes up about 50% of the global primary production (Longhurst et al., 1995). As the main photosynthetic pigment, chlorophyll-a (Chl-a) is present in all phytoplankton species, it is widely used as an indicator of phytoplankton biomass and is also an important input into primary production models (Behrenfeld et al., 2006; Tilstone et al., 2009). Furthermore, Chl-a is used as one of the key parameters for ecological status assessment in aquatic management and is applied to both in situ (Pasztaleniec and Poniewozik, 2010; Harvey et al., 2019) and satellite-derived data (Gohin et al., 2008).
There are several established methods to derive Chl-a in the laboratory. The most frequently used methods in routine oceanographic monitoring are fluorometric (Holm-Hansen et al., 1965) and spectrophotometric (Jeffrey and Humphrey, 1975) determination of Chl-a. A more sophisticated analytical method is high-performance liquid chromatography (HPLC), which can be used to determine a wide range of phytoplankton pigments (Jeffrey et al., 1997; Van Heukelem and Thomas, 2001; Sørensen et al., 2007). Furthermore, HPLC is recommended for validating Chl-a data derived from satellites (Bidigare et al., 2002).
For routine in situ monitoring using fluorometric or spectrophotometric methods, one generally aims at errors within 20% (Sørensen et al., 2007). State-of-the-art measurements using HPLC can reach accuracies of 5% (Claustre et al., 2004) or even lower (Hooker et al., 2010). However, HPLC is very expensive and requires highly specialized staff, which is not feasible within routine monitoring programs. Also, because of their complexity, in practice, non-state-of-the-art HPLC measurements are often prone to have much higher errors than generally perceived, e.g., 7%–40% coefficient of variance, as shown in Hooker et al. (2010) and Canuti et al. (2016).
Sørensen et al. (2007) also found that the main errors in the Chl-a determination of natural samples are usually introduced by inadequate storing and extraction methods. The errors due to storage can be minimized by flash-freezing the samples in liquid nitrogen at −196°C, where they can be kept safely for up to 328 days (Jeffrey et al., 1997). Alternatively, the samples can be kept in a −80°C freezer for up to 12 months after flash-freezing in liquid nitrogen (Roy et al., 2011). The filters should not be stored for more than 1 week at −20°C, since, thereafter, oxidative degradation processes can lead to significant pigment loss and the production of chlorophyllide-a and esters in organic solvents such as acetone or methanol (Jeffrey et al., 1997). Samples can be kept in dry ice (i.e., at −78°C) for up to 1 month, e.g., for medium-term storage and/or distribution between laboratories.
Several organic solvents can be used for Chl-a extraction from natural water samples. The JGOFS Core Measurement Protocols (IOC, 1994) recommended s aqueous acetone (usually 90% acetone) for the Chl-a extraction from marine samples. Sonication of the samples under ice-cooling is recommended (Jeffrey et al., 1997), especially in the presence of cyanobacteria which have rather strong cell walls and are very common in the Baltic Sea during summer. However, in the Baltic Sea area, HELCOM guidelines have introduced the extraction of Chl-a in 96% ethanol (HELCOM Combine Manual 2 for Marine Monitoring, 2017) as ethanol is less toxic. Besides this, ethanol is much less volatile than acetone. An initial comparison showed that the various monitoring laboratories in the Baltic Sea region use very different methods for measuring Chl-a (see Table 1, Labs 2–6). The only common nominator seems to be the use of GF/F filters (either 25 or 47 mm in diameter) during filtration.
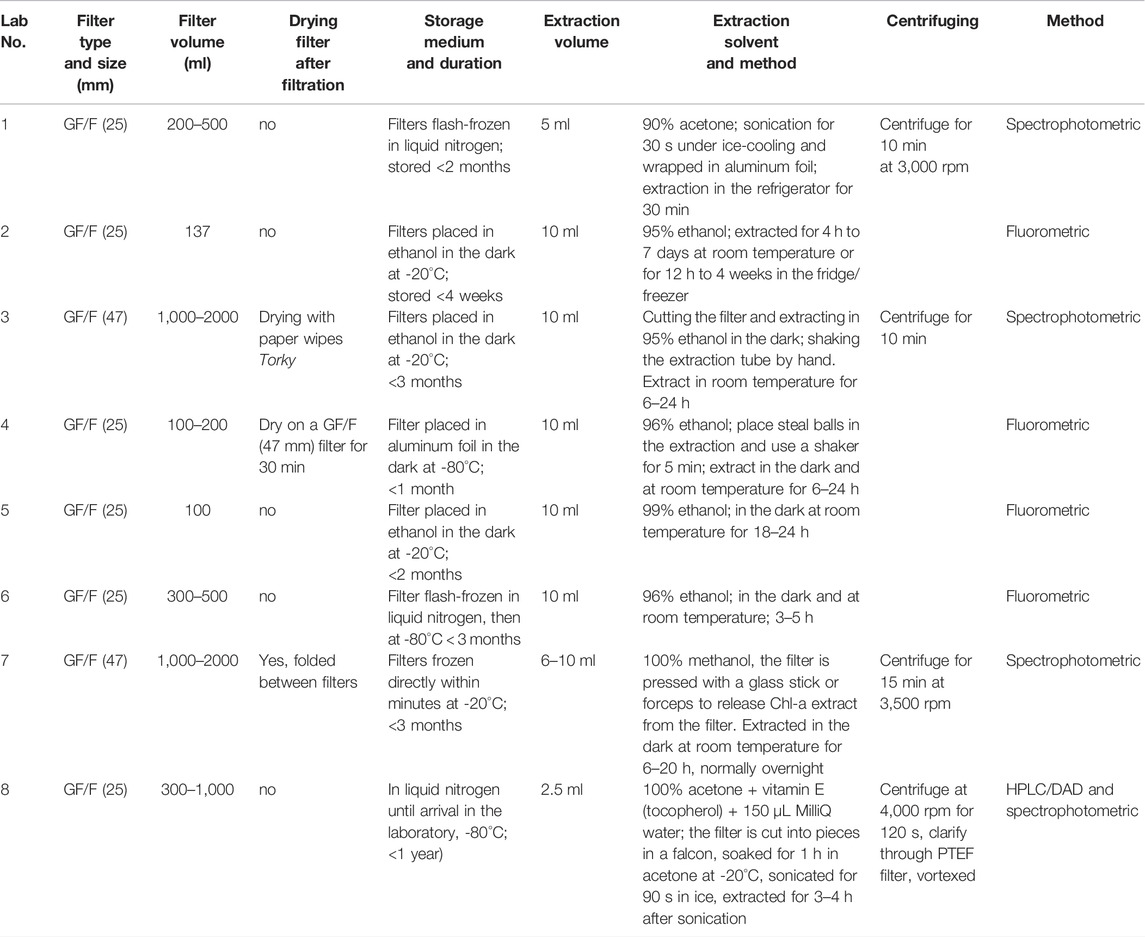
TABLE 1. Key characteristics for chlorophyll-a measurements for the participating laboratories, Swedish monitoring laboratories: Labs 2–5.
Chl-a can also be derived from satellite observations, and for optical case 1 waters where the optical properties are mostly determined by Chl-a and covarying colored dissolved organic matter (CDOM), Chl-a can be determined within 35% accuracy (Mueller and Austin, 1995).
Darecki and Stramski (2004) showed that regional tuning of bio-optical algorithms for MODIS and SeaWiFS allowed for the reliable retrieval of Chl-a in the Baltic Sea within 30% of the open sea. However, due to their coarse spatial resolution of 1 km, both MODIS and SeaWiFS generally are not ideal for monitoring nearshore coastal areas. The Chl-a retrieval from satellite data over inner coastal areas was substantially improved by the ESA MERIS Envisat (2002–2012) and the ESA OLCI Sentinel-3 mission (since 2016). One of the main reasons is that both sensors have an increased spatial resolution (300 m as opposed to the standard of 1 km in Ocean Colour remote sensing) and improved spectral resolution. Recent research in the Baltic Sea has shown that Chl-a products derived from MERIS and OLCI have a mean normalized bias (MNB) within ± 30%, dependent on the processor applied (Beltrán-Abaunza et al., 2014; Kyryliuk and Kratzer, 2019; Kratzer and Plowey, 2021).
With the satellite data becoming increasingly accurate, it is also important to evaluate the uncertainties in the in situ validation data. The data measured within the Swedish pelagic monitoring program are delivered to a common database (www.sharkweb.smhi.se), sustained by the Swedish Meteorological and Hydrological Institute (SMHI). When using data from this portal for satellite validation, it is important to understand how comparable the data quality is between laboratories. There may be systematic differences between laboratories which may cause significant uncertainties in the match-up analysis between satellite data and in situ data.
An initial evaluation of 2 Swedish monitoring labs during field campaigns performed in 1998, 2011, and 2020 showed that there can be substantial differences between two labs, e.g., Lab 2 and Lab 3 (Supplementary Figure S1A), reaching up to about 77% between laboratories. The performance of these two monitoring laboratories was evaluated against Lab 1, which is usually used for the validation of satellite data and has regularly been compared to HPLC data measured by Lab 7 (Supplementary Figure S2), indicating an overestimation of Chl-a of about 9–10% by Lab 1 (see also Sørensen et al., 2007). After careful evaluation of the results, it was found that the 24% underestimation of Lab 3 against Lab 1 was caused by six measurements with Chl-a values above 10 μg L−1, indicating blooms and also patchiness in the water body. After removing those data points (Supplementary Figure S1A), the measurements of Lab 3 were situated much closer to the 1:1 line, and there was no longer a significant difference between Lab 3 and Lab 1 (as confirmed by a Student t-test). The differences between Lab 2 and Lab 3 were subsequently reduced from about 77% to about 55% (Supplementary Figure S1B). However, the uncertainties for Lab 2 remained rather high and were recently confirmed during another Chl-a intercomparison performed in autumn 2020 on R/V Svea (Supplementary Figures S1A, S1B).
The main aim of this study is to further evaluate the uncertainties of the in situ Chl-a data measured within the Swedish monitoring program in order to have an overview of the magnitude of differences between different monitoring labs that we could expect in the in situ data. Three international European monitoring labs were also engaged in comparing the results on an international level and seeing how the Swedish labs perform in an international context and introduce additional expertise. This information is important to know when using in situ data for the validation of satellites.
In this intercomparison, the assessment of uncertainties was performed for Chl-a samples measured in a natural coastal gradient in Bråviken bay (north-western Baltic proper) and compared against the median of the whole group. Furthermore, Chl-a standard solutions prepared in the laboratory were used to evaluate the uncertainties caused by the analytical method itself without taking into account possible degradation due to handling, storage, and extraction. As Lab 1 has been extensively used for the validation of satellite data in the Baltic Sea, and also in previous intercomparisons as a reference laboratory, we also use it here as a reference for investigating the uncertainties of the monitoring laboratories. Furthermore, all laboratories were evaluated against the HPLC measurements performed by Lab 8 (Canuti et al., 2016) as part of the intercomparison of Chl-a standards.
An overall goal of the intercomparison was to work towards harmonizing methods and approaches for the Swedish monitoring laboratories to improve the reliability and intercomparability of Chl-a measurements within the Swedish monitoring program and three international agencies and research institutes involved in Baltic Sea research and monitoring. Another more general aim was to learn from the results of the different laboratories and to make recommendations for improvements to the various laboratories involved.
2 Methods
2.1 Bråviken Campaign
The intercalibration campaign was carried out in Bråviken bay on Stockholm Universities’ R/V Electra af Askö, NW Baltic proper, during 1–2 July 2021. Two transects (with four stations each) were sampled in Bråviken bay each during 1 and 2 July 2021 (Figure 1).
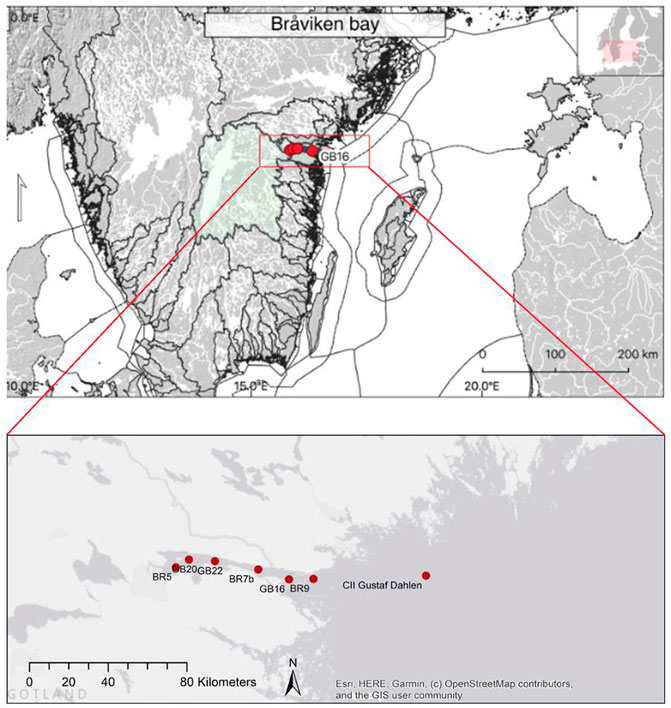
FIGURE 1. Bråviken bay is situated in the NW Baltic proper. Eight stations were sampled in total; station GB16 was sampled twice: during 1 July 2021, on the transect into the bay, and during 2 July 2021, on the transect out of the bay. The overview map (upper panel) was taken from Kratzer et al. (2019, Figure 1 upper panel, license agreement CC BY 4.0).
Five Swedish and three international laboratories participated: the Swedish marine monitoring groups based at SMHI, Gothenburg University (GU), Umeå University (UMU), Stockholm University (MG-SU) as well as the Marine Remote Sensing Group (MRSG, SU), the Leibniz Institute for Baltic Sea Research (IOW, Germany), the Norwegian Institute for Water Research (NIVA) together with NIVA Denmark Water Research, and the Joint Research Centre (JRC) in Ispra, Italy. Because of COVID-19 restrictions, only a limited number of laboratories could participate physically in the campaign. Therefore, only staff from Stockholm University, NIVA Denmark, and SMHI participated and filtered the samples for the other laboratories as well.
At each station, three samples per laboratory were taken from the surface with Niskin bottles operated on a rosette sampler, transferred to sampling bottles, and filtered onto GF/F filters (100–350 ml for 25 mm filters; 0.5–1 L for 47 mm filters), after shaking. The filters were flash-frozen in liquid nitrogen within about 10–40 min after filtration and stored in a dewar for approximately 2 months. The Dewar flask had a nominal holding time of 2 months, but the liquid nitrogen in the Dewar was replenished every 3 weeks to avoid that it would run short of liquid nitrogen. In total, 24 filter samples/filters per laboratory were posted in dry ice on Monday, 6 September 2021, to all participants with the aim of all laboratories performing the measurements on Wednesday, 8 September 2021.
2.2 Preparation of Chlorophyll-a Standard Solutions
Chl-a standards were prepared as an additional independent evaluation to estimate the measurement uncertainties of each laboratory and method without additional errors being caused by storage and by various pigment extraction methods (e.g., use of sonicator vs. passive extraction). First, 1 mg of Chl-a standard (Sigma-Aldrich, CAS) was dissolved in 90% acetone (HPLC grade, both acetone, and ultrapure water) using a 250 ml volumetric flask (+/−0.15 ml) wrapped in aluminum foil to make up the mother solution of 4,000 μg L−1. This mother solution was then further diluted to 160 μg L−1 for the acetone and ethanol extracts and to 240 μg L−1 for the methanol extract. Thus, the final standards were distributed in 90% acetone (Lab 1 and Lab 8), 95.96% ethanol (Labs 2, 3, 4, 5, and 6), and 99.94% methanol (Lab 7). The Chl-a standards were prepared for all laboratories by the principal investigator on 3 September 2021, and kept in a refrigerator (4°C) in amber, well-sealing glass reagent bottles. Three aliquots of standards were pipetted under subdued light into well-sealing 10 ml polypropylene centrifuge tubes with screw caps (all Labs, apart from Lab 8) or into 2 ml glass vials (Lab 8), using variable Eppendorf pipettes (1–10 ml). Both the standards (centrifuge tubes and glass vials) and the 24 filters (per laboratory) with field samples were wrapped well in both aluminum foil and bubble wrap and posted to all participating laboratories in thermal Styrofoam boxes filled with 4–5 kg of dry ice.
2.3 Laboratory Analyses
All laboratories analyzed their samples according to their normal protocols (Table 1) on 8 September 2021, except for the staff from Lab 4 who received the samples later than anticipated and kept them at −80°C for 1 week until analysis. For deriving the concentration of the standards, the ratio of the filtered volume (given in L) and the extraction volume (given in mL) were both set to the same volume, e.g., by defining the filtered volume as 0.001 L and the extraction volume as 1 ml. The results were all returned to the principal investigator within 1–2 weeks.
The fluorometric methods for the determination of Chl-a are based on Holm-Hansen et al. (1965) and the HELCOM Combine Manual 2 for Marine Monitoring (2017), which uses ethanol as a solvent. The spectrophotometric method is based on the trichromatic method by Jeffrey and Humphrey (1975), also described in Parsons et al. (1984). Some modifications are implemented; Lab 1 stores the samples in liquid nitrogen and uses sonication under ice-cooling for extraction; Lab 3 uses ethanol as a solvent (and subsequent passive extraction), while Lab 7 uses methanol as a solvent. The method applied by Lab 8 for the determination of phytoplankton pigments is the HPLC-DAD method developed by Van Heukelem and Thomas (2001). The method implemented has been validated through regular participation in international round-robin and comparison exercises (Hooker et al., 2010; Canuti et al., 2016).
2.4 Statistical Analysis of the Field Samples
2.4.1 Data Quality Control
For data quality control, the median (x̃) and the standard deviation (σ) of each laboratory were derived and the coefficient of variation was derived as CV = σ/x̃. Furthermore, all data were screened for outliers, defined as x̃ ± 3*σ (Sørensen et al., 2007). None of the laboratories were found to have any such outliers.
2.4.2 Correlation Plots
The median of all laboratories was derived to get an initial overview and visualize any difference in the medians and ranges of values per laboratory; a box plot was created. Further, the results from each laboratory were plotted against the median of all spectrophotometric and fluorometric laboratories in correlation plots (one plot per laboratory). All graphs were set to the same maximum value for the x- and y-axis (10 μg L−1) and the 1:1 line was plotted on each graph in order to evaluate the scatter of the data and to see if the respective laboratory generally over- or underestimated the Chl-a concentrations or was placed well around the 1:1 line. Pearson’s correlation coefficient (r) and the MNB, i.e., the offset from the 1:1 line and the Root Mean Square Difference (RMSD), i.e., the scatter of the data (also termed relative error), were calculated for each laboratory against the median values:
2.4.3 Youden Plots
A Youden plot is commonly used for a graphical interpretation by plotting results from the same method conducted by different laboratories in the same graph (Martín et al., 2017). It is a type of scatter plot that aims to uncover biases in the measurements. It can provide an overview if the results from the laboratories are equivalent, which labs may have outliers compared to the median, and if inconsistencies are primarily between laboratories (reproducibility problems) or within one laboratory (repeatability problems). The y- and x-axis represent the results from 2 reported pairs of values (in this study, two stations), and each point represents one replicate of the sample results from each lab. The horizontal and vertical lines represent the median values for all replicates for each station. At the intersection of the medians, a 45° reference line is drawn for indications of over- or underestimations compared to the medians (similar to the 1:1 line in a correlation plot).
A circle is drawn around the intersection based on the algebraic average difference of the values to the medians. Multiplying the average of the absolute values of these differences by sqrt(π)/2 gives an estimate of the standard deviation and multiplication of the standard deviation by 2.45 provides the radius of the circle that should include 95% of the laboratories if individual constant errors could be eliminated. Hence, the circle indicates which observations fall within the 95% confidence interval and the laboratories falling outside are said to provide biased results and may indicate systematic errors (Martín et al., 2017 and references therein) if repeatedly placed outside the 95% confidence limit. The stations were paired based on the similarities between the medians (Martín et al., 2017).
3 Results
3.1 Results, Field Samples
There was a fair mix of laboratories using either the spectrophotometric (Labs 1, 3, 7, and 8) or fluorometric method (Labs 2, 4, 5, and 6). Overall, the results from the laboratories measuring primarily in the Baltic Sea (Lab1 to Lab 6) compared quite well (Figure 2).
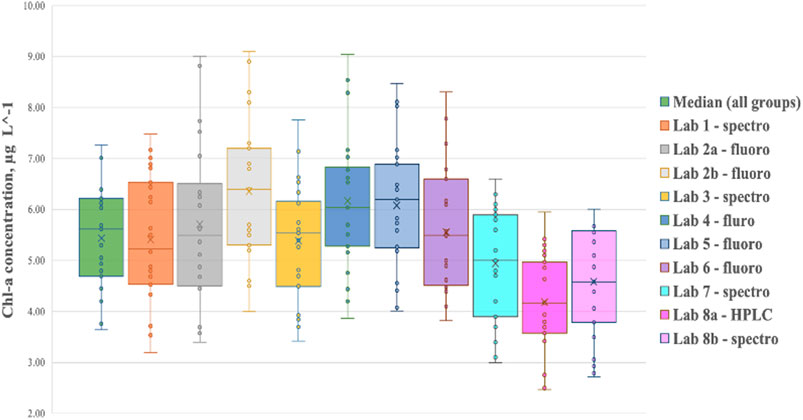
FIGURE 2. Box plots of the derived chlorophyll-a concentrations measured by all participating labs in the Bråviken campaign. Each laboratory measured three replicates from the surface taken at eight stations (i.e., 24 samples each per laboratory). Note that Lab 2 conducted flash-freezing (2a) and their normal sampling procedure (2b).
The results for Lab 2 are shown both for the storage protocol followed in this intercalibration, flash-freezing in liquid nitrogen and postage in dry ice to Lab 2 (2a, shown in dark grey), and for their normal sampling routine (2b, shown in light grey). The difference in the median of all spectrophotometric and fluorometric measurements was clearly reduced due to flash-freezing and direct measurements after receiving the samples by post.
The correlation plots in Figure 3 allow for a direct comparison of the uncertainties of each laboratory in determining Chl-a. All results are plotted against the median of all spectrophotometric and fluorometric measurements. However, it must be noted that the median was somewhat more driven by the fluorometric measurements, which tended to be higher than the median, while the spectrophotometric and HPLC measured values fell below the median. The uncertainties against the median are largely due to the uncertainties in the various methods themselves. For a perfect fit, all values would be placed on the 1:1 line. The MNB indicates the % offset from the 1:1 line, while the Root Mean Square Difference (RMSD) is a measure of the data scatter (i.e., relative error). If the MNB is positive, it means that the majority of values are placed above the 1:1 line if it is negative, it means that the majority of values are placed below the 1:1 line. Note that the results shown here represent the reliability of each laboratory when using flash-freezing and storage in liquid nitrogen as a preservation and storage method and do not include additional errors caused by, e.g., different ways of storing or extracting the Chl-a samples. The statistical results of the correlation analyses are summarized in Table 2.
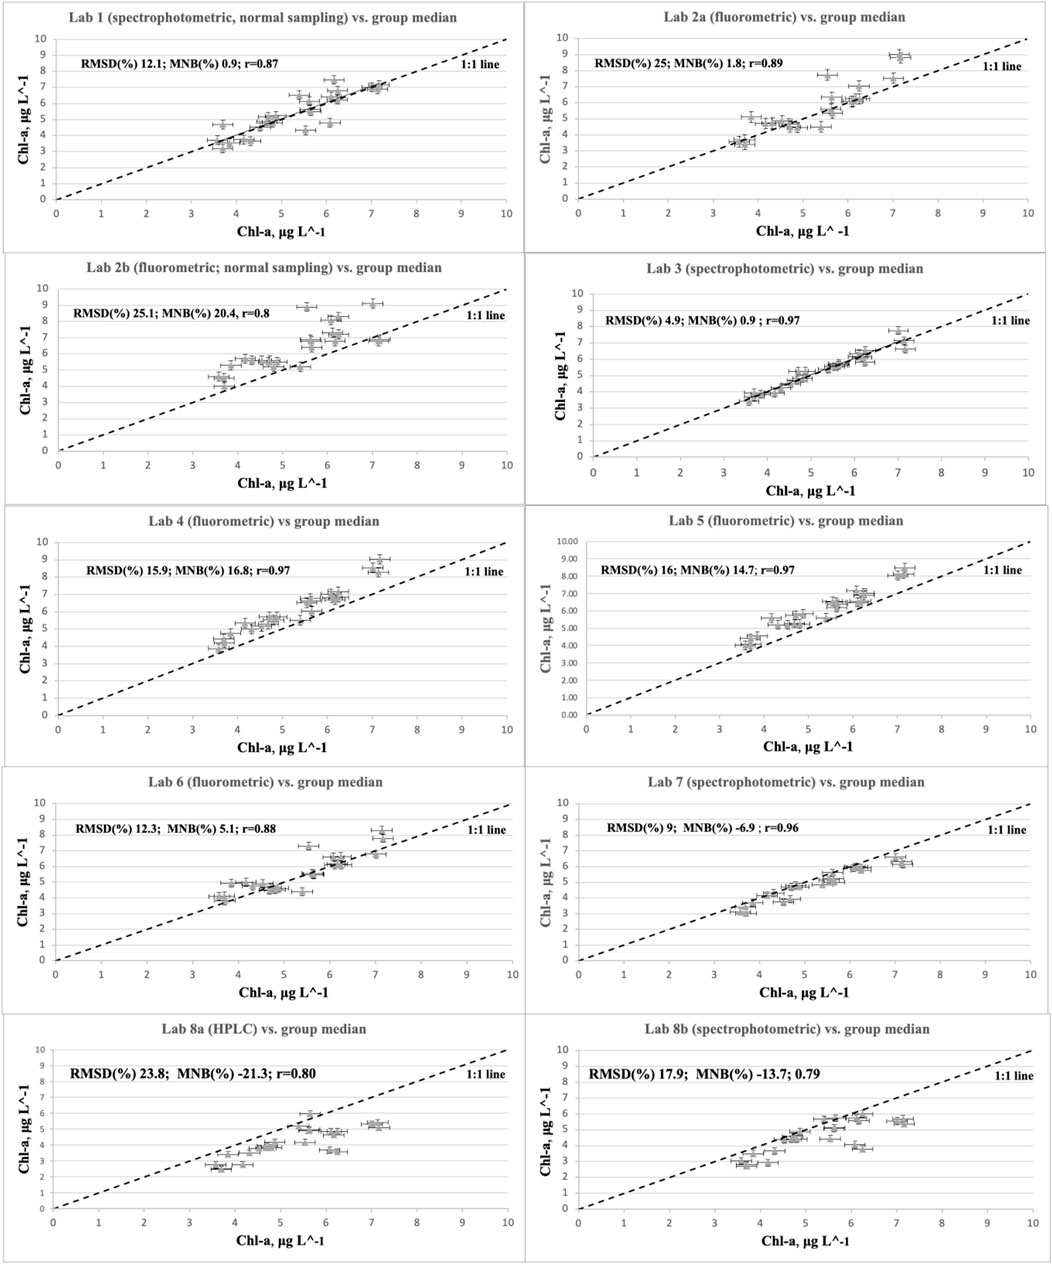
FIGURE 3. Result of the correlation analysis per laboratory. The 1:1 line was plotted here to allow for a visual comparison between laboratories. The results from each laboratory (y-axis) were plotted against the median value of all spectrophotometric and fluorometric laboratories (x-axis). The HPLC measurements lie, on average, 23% below the spectrophotometric and fluorometric measurements. The statistics are summarized in Table 2 for a quick and easy comparison.
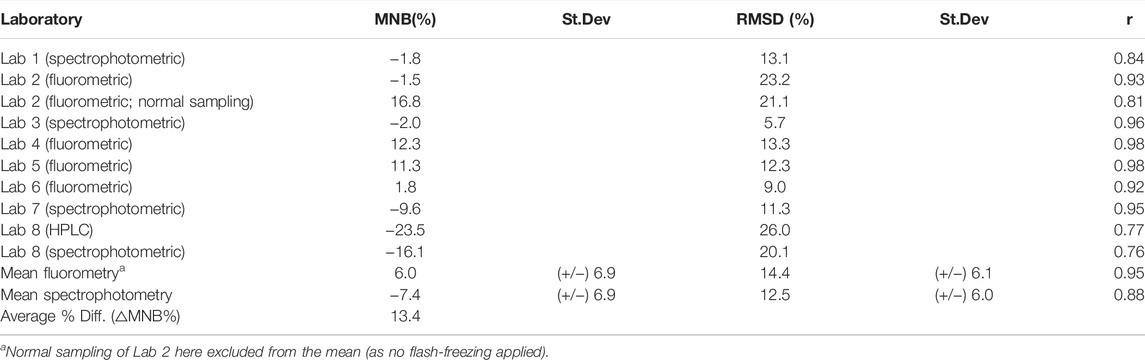
TABLE 2. Statistical results of the correlation analyses (each laboratory was assessed against the median of all spectrophotometric and fluorometric laboratories). Any differences
The MNB ranged between −24% and +17% for all laboratories (in relation to the median of all laboratories) and between −2 and 17% for the Baltic Sea laboratories. The MNB was, on average, + 6% for fluorometric and −7.4% for the spectrophotometric method. The fluorometric measurements are, on average, significantly higher than the fluorometric measurements, with an average % difference of 13.4%. On average, the relative error (RMSD) was 14.4% for the fluorometric laboratories and 12.5% for the spectrophotometric laboratories. There are two laboratories with a relatively high scatter (above 20%): Lab 2 and Lab 8 (HPLC); see Table 2.
Usually, the uncertainties are dependent on the concentration, and this cannot be evaluated in the correlation analysis (Figure 3). Another way of analyzing the uncertainties of each laboratory is in the form of Youden plots (Figure 4), which is a graphical method. The observations of sample pairs of similar concentrations are shown here in relation to the median values of the observation pairs. The circle around the median cross in Figure 4 indicates the 95% confidence interval. A systematic error is indicated if a laboratory is repeatedly found in the equivalent rectangle outside the circle along the diagonal line, and random errors are shown if a laboratory is only found casually outside the circle. The HPLC results (Lab 8a) were excluded from this plot as HPLC measurements of natural water samples are normally not compared to spectrophotometric and/or fluorometric measurements. Results for Lab 2 (normal sampling method, i.e., Lab 2b) were also excluded as the in situ field handling was not part of the intercomparison.
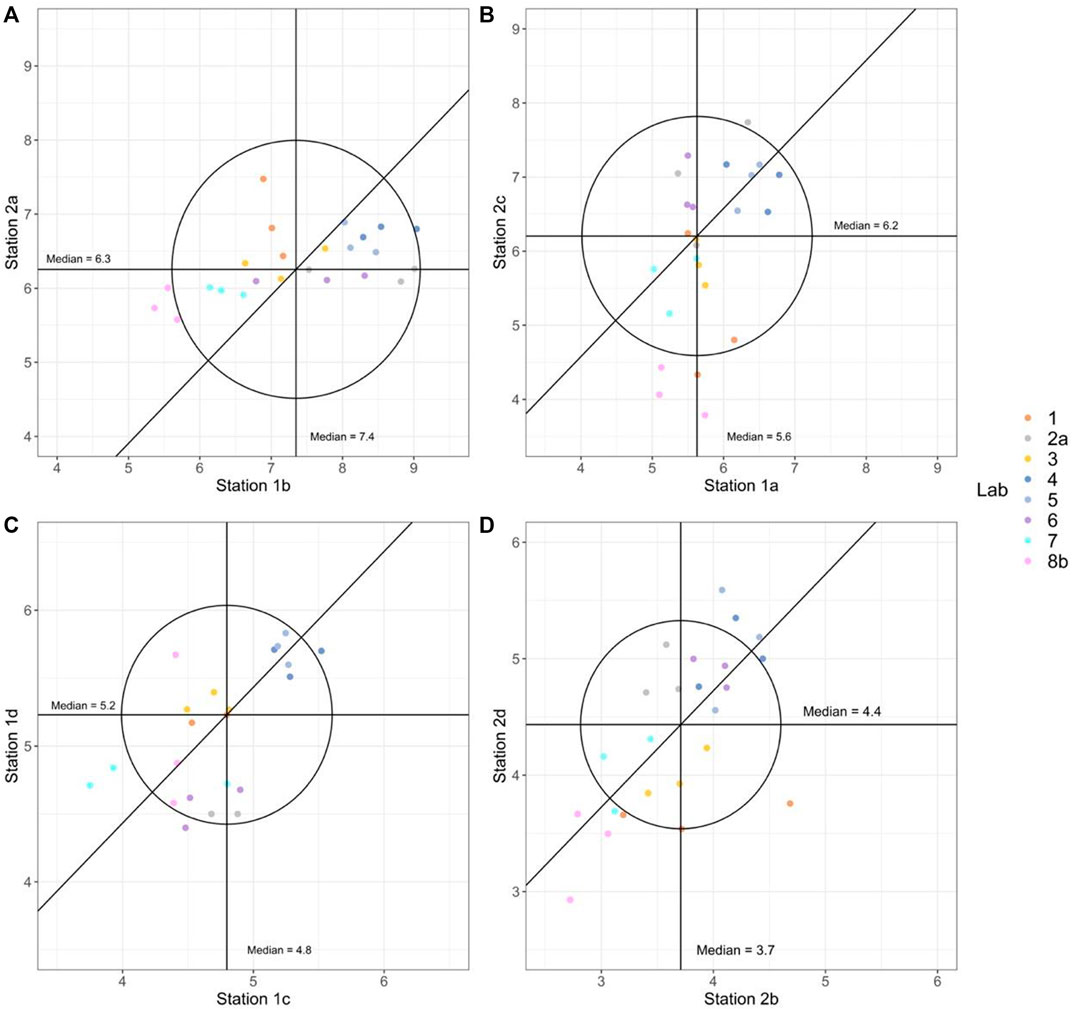
FIGURE 4. Youden plots of paired stations of similar concentrations. The horizontal line represents the median values (indicated in the plots) of all samples from the station on the x-axis and the vertical line represents the median values (indicated in the plots) of all samples from the station on the y-axis. A 45° reference line is drawn based on the two median values. The distance from the reference line indicates the proportion of random errors and the distance from the median centroid indicates the proportion of systematic errors. The circle indicates which observations fall within the 95% confidence interval with no bias or else outside.
The results from the Youden plots show that the three replicates from each laboratory most often align close to each other for all station comparisons, indicating high repeatability for each of the laboratories. The comparison between laboratories is also very good, with generally small deviations from the medians. However, a few observations deviated for all labs, as expected with natural samples and due to random errors, are also reflected in the RMSE presented in Figure 3 and Table 2.
Some minor general patterns can be seen in the Youden plots, where most observations fall inside the 95% confidence interval in Figures 4A,C. The variability (both within and between the labs) was higher for the stations with lower Chl-a concentrations (Figures 4B,D), where more observations fall outside the 95% confidence interval. The results from Lab 8b seem to underestimate the Chl-a compared to the overall median values and have a systematic offset for two station pairs (Figures 4B,D). Labs 4 and 5 seem to have a small bias towards higher values, whereas Lab 7 and Lab 8b show opposite results with a small bias towards lower values. The interpretation of the results in the Youden plots confirms what the individual correlations in Figure 3 and Table 2 have shown.
3.2 Results: Chlorophyll-a Standards
Overall, the results of the Chl-a standards compared quite well between laboratories (Figure 5). The MNB of the standard measurements ranged between −23% and +19% for all laboratories (Table 4) compared to the mean of the measured HPLC concentrations (165 μg L−1), with the exception of Lab 7 (methanol). For the Baltic Sea laboratories, the range was even smaller: −7% to +19% compared to the mean HPLC concentration. Table 3 gives an overview of the statistics of the Chl-a standard measurements. Note that the results for Lab 7 cannot really be compared here, as Chl-a is very unstable in methanol, and the very low standard concentrations are most likely due to the breakdown of Chl-a within the 5 days between standard preparation and measurements.
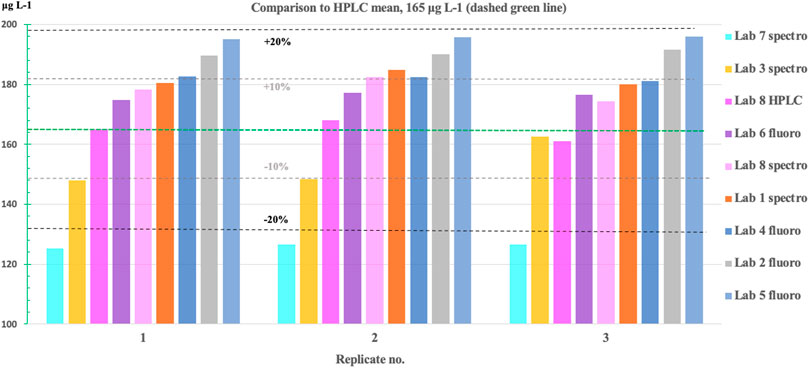
FIGURE 5. Results for the Chl-a standard concentrations measured by the different laboratories. The mean concentration of the HPLC measurements (Lab 8) is indicated by the dashed green line. The measurements of the Baltic Sea monitoring laboratories are within about −7% to +19% error (±2–3%). Note that Lab 7 uses methanol for extraction in which Chl-a is rather unstable, leading to −23% underestimation. As the Chl-a standards were only measured after 5 days, it is likely that a large proportion of the Chl-a molecules had already been degraded.
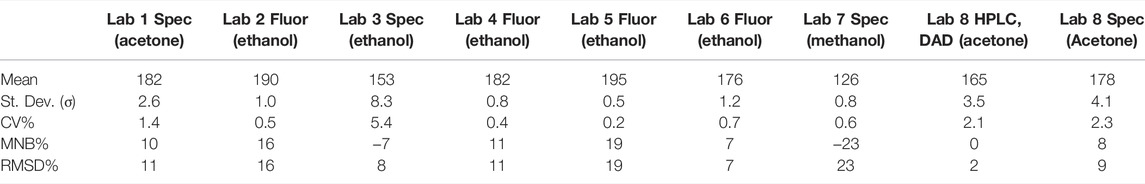
TABLE 3. Statistical results of the Chl-a standards (µg L−1). For each laboratory, the mean value, the standard deviation (σ), and the coefficient of variation (CV%) were derived from the three replicates. The RMSD% and the MNB% were derived here mathematically in relation to the mean concentration measured by HPLC, which has an error of about 2–3% (Canuti et al., 2016).
4 Discussion
The present study aims at evaluating the uncertainties of the Swedish monitoring laboratories in terms of Chl-a determination. As shown here, measuring Chl-a is not as straightforward as it may seem to be. The fluorometric method is known to be influenced by other pigments than just Chl-a (Gibbs, 1979; Welschmeyer, 1994), while the spectrophotometric trichromatic method, although recommended by specialists (Jeffrey and Welschmeyer, 1997), gave overestimates, compared to HPLC methods, by about 15–20% (Sørensen et al., 2007). Overall, it was not all that simple to compare the results from the different laboratories. One of the main challenges we found was the very large variety of methods, and the summary in Table 1 was an attempt to capture this variability. Besides the differences in analytical methods, we also found a large range in storage and extraction methods. As mentioned before, these are usually the main causes of uncertainties (Sørensen et al., 2007).
For the Baltic Sea laboratories, the range of the standard measurements was: −7% to +19% compared to the mean concentration derived by HPLC. However, it must also be kept in mind that the various laboratories are optimized in different ways to their respective normal ranges of values. This is usually done by adjusting the filtering and/or extraction volume. For example, if there is low phytoplankton biomass, one tends to filter larger volumes to get enough phytoplankton cells on the filter, thus increasing the sensitivity. On the other hand, in bloom situations, one usually filters less water and/or increases the extraction volume. Supplementary Table S1 tries to capture these differences when measuring the same standard by deriving the nominal field sample concentration (per laboratory) from the concentration factor for the respective laboratory. The results of the Chl-a standard measurements should be interpreted with these differences in mind. Depending on instrumentation and method, the concentration range should be chosen in order to achieve a linear range of calibration so as to avoid sensor saturation. In hindsight, it would have been beneficial to distribute a range of different standard concentrations to all participating laboratories so that the uncertainties could have been tested for different standard concentrations (e.g., 40 µgL−1, 160 μg L−1, and 400 μg L−1) as the different laboratories are optimized in different ways and were shown to have very varying nominal field concentrations (Supplementary Table S1). In order to derive Youden plots for the standards, one would need additionally two sets of standards in a similar concentration range, e.g., 160 μg L−1 and 170 μg L−1.
Overall, the results from the field measurements in Bråviken were also very encouraging. The MNB ranged between −23% and +17% for all laboratories (in relation to a median of all spectrophotometric and fluorometric laboratories) and between −2 and 17% for the Baltic Sea laboratories, which is somewhat lower than for the standard comparison. The RMSD ranged overall from 6 to 26%. The lowest RMSD was achieved by Lab 3 (6%) and Lab 7 (9%). This may be partially due to well-trained staff and partially also due to using alcohols as solvents which are much less volatile than acetone. However, Lab 2 and Lab 8 have rather high relative errors (RMSD: 23 and 26%, respectively), which may need some consideration.
Table 2 shows that the overestimation by Lab 2 was substantially reduced (i.e., from 17% to −2%), simply by freeze-drying the samples, storing them in liquid nitrogen, and direct analysis shortly after receiving the samples in dry ice. So, following the results presented here, flash-freezing is highly recommended. The statistical results for the field measurements from Bråviken are generally very reasonable, considering we are analyzing natural biological samples in coastal, dynamic waters where we should expect a high variability (Rantajärvi et al., 1998). Nevertheless, the results are a bit misleading because most laboratories did not follow their normal procedures for storing and extraction. Larger differences are to be expected during normal sampling and we would like to recommend repeating the exercise with all the laboratories, following their normal sampling procedure, i.e., by participating physically in the campaign, like it was done here by Lab 2 in addition to the Bråviken sampling and storage procedure, including flash-freezing. It must be noted here also, that Lab 1, Lab 6, and Lab 8 actually did follow their normal protocol as they all normally flash-freeze their samples, although Lab 6 and Lab 8 first flash-freeze their samples and then move them into a −80°C freezer after the cruise which has been recommended by Wasmund et al. (2006). Flash-freezing is becoming more and more the norm in the international literature and already had been recommended in the 1990s by the protocols of the Joint Global Ocean Flux Study (JGOFS) of the Intergovernmental Oceanographic Commission (IOC, 1994) and also by Wright et al. (1997).
Figure 6 compares the uncertainties of Labs 2, 3, 4, and 6 against Lab 1. For comparison, Table 4 shows the values for the uncertainties of these laboratories and Lab 8/HPLC (not shown in Figure 6). Table 4 gives the uncertainties for Lab 2 when compared to Lab 1 for different years (Figure 6A shows all years combined). It is interesting that Lab 6 (fluorometric method) has very similar results to two of the spectrophotometric laboratories, Lab 1 and Lab 3 (Figure 6D). This means that one can achieve quite similar results despite different analytical methods. These laboratories also use different storing and extraction methods: Lab 1 stores the samples in liquid nitrogen and extract them in acetone with sonication under subdued light and ice-cooling and Lab 3 extracts the filters in 95% ethanol and freezes them at −20°C for up to 3 months. Lab 4 stores the filters at −80°C (no flash-freezing but drying of the filter before deep-freezing) and extracts them for 6 to 24 h in 96% ethanol. Note that the scatter in these plots is caused by the uncertainties of both labs plotted against one another. The scatter in the correlations shown in Figure 3 is reduced as deriving the median reduces the overall scatter (also shown in the box plots, Figure 2). It must also be noted that the samples for the historical comparisons between Lab 2 and Lab 1 (Figure 6A) were taken across different seasons (spring, summer, and autumn) and also included open sea vs. coastal areas.
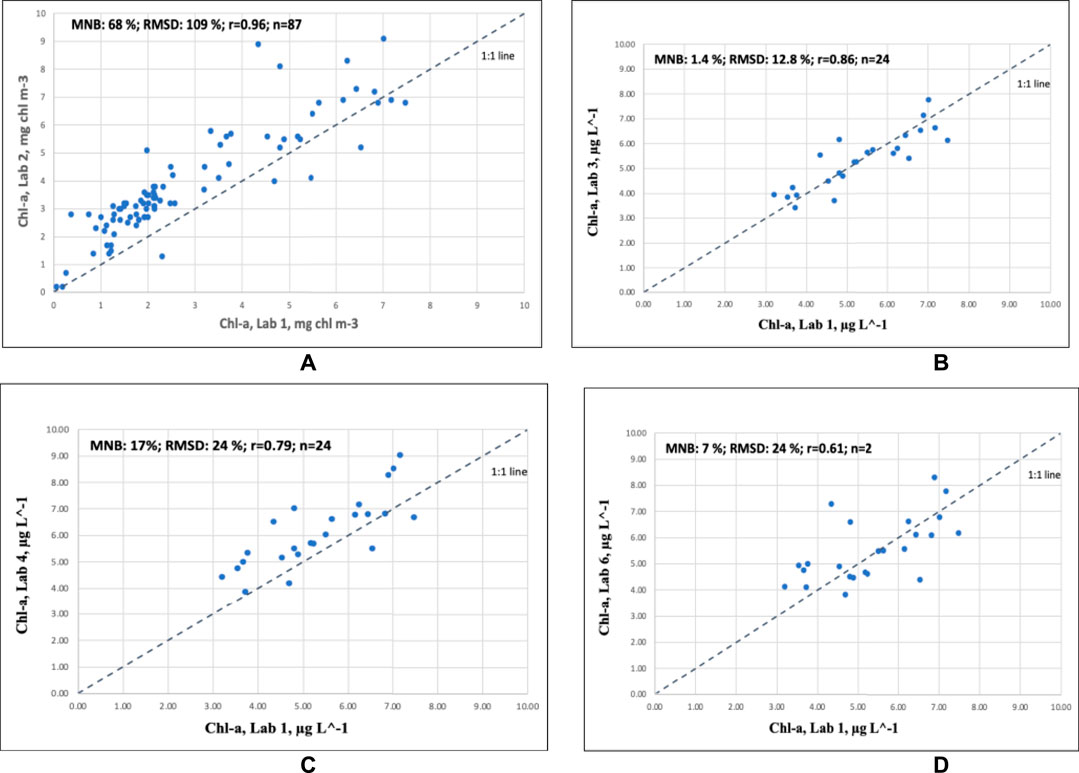
FIGURE 6. Uncertainties of Chl-a measurements of (A) Lab 2 vs. Lab 1 (1998, 2020, and 2021 normal sampling procedures), (B) Lab 3 vs. Lab 1 (2010 and 2021), (C) Lab 4 vs. Lab 1 (Bråviken), and (D) Lab 6 vs. Lab 1 (Bråviken).
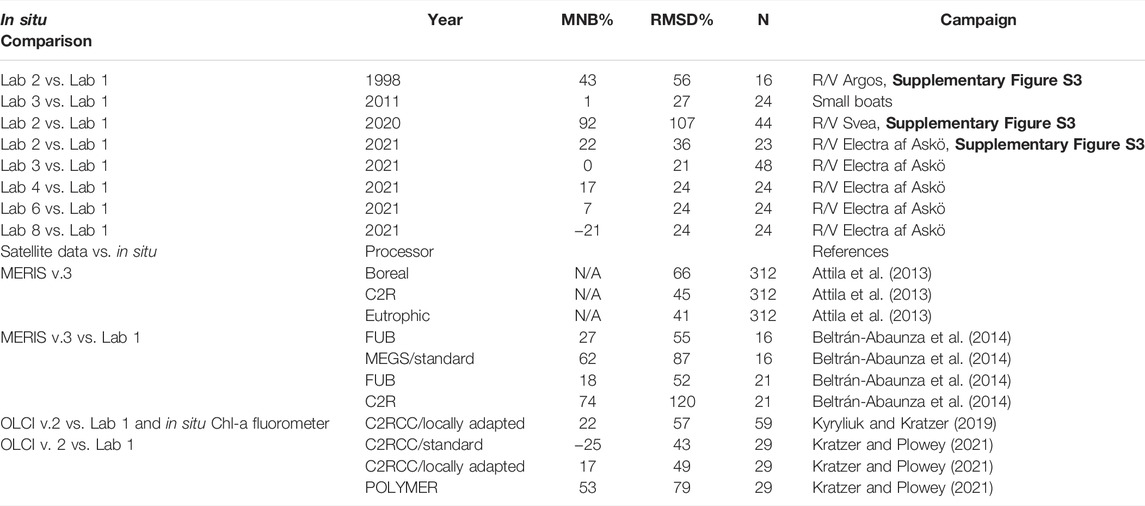
TABLE 4. Evaluation of uncertainties in the Chl-a measurements of Labs 2, 3, 6, and 8, each vs. Lab 1, as well as uncertainties of various satellite Chl-a products derived from MERIS and OLCI vs. Lab 1. The best satellite processors have an MNB within 17–27% (in bold).
Supplementary Figure S4 shows that the overestimation is consistent over the seasons but somewhat lower in coastal areas.
The statistics listed in Table 4 demonstrate that the uncertainties of satellite data are now well within the range of the uncertainties of in situ Chl-a measurements and sometimes even better. The consistently best processors for MERIS and OLCI are: The case 2 processor from the Free University of Berlin (FUB) and the Case-2 Regional Coast Colour (C2RCC) processor. Both of these processors apply a Neural Network (NN) inversion (Schroeder et al., 2007; Brockmann et al., 2016). The MNB was within 25–30% for FUB and the locally-adapted C2RCC. When correcting for the 9% overestimation of Lab 1 compared to HPLC, the satellite data lies actually within 7–18% of the in situ values both for MERIS-FUB and also for locally-adapted OLCI-C2RCC data, even in such an optically-complex water body as the Baltic Sea with relatively high CDOM absorption (Kowalczuk et al., 2006; Kratzer and Tett, 2009). The RMSD is generally not much lower than 50% when assessing the uncertainties in Case-2 waters (personal communication with Dr. Roland Doerffer, 2013). This can partially be explained by the difference in scale (300 m pixels vs. sampling bottle or sampling bucket) and partially by natural biological variability.
Lab 2 had consistently higher values, both in the standard concentrations (MNB: 16%) and in the Bråviken measurements when following their normal sampling procedure (MNB: 17%). In previous intercomparisons at lower Chl-a concentrations (about 0.2–3 μg L−1), the MNB was substantially higher (Supplementary Figure S4): Lab 2 gave overestimates by about 43% in autumn 1998 and by as much as 92% in autumn 2020 when compared to Lab 1, and the RMSD (scatter) in 1998 was 56% and in 2020 it was 107%. However, when analyzing the data from the Bråviken campaign separately (Supplementary Figure S4, lower panels), an interesting result becomes apparent. When following their normal sampling procedure in Bråviken with higher Chl-a concentrations (about 3–8 μg L−1), the uncertainties were here substantially lower compared to Lab 1 (i.e., MNB: 22% and RMSD: 36%). The samples had been extracted in ethanol in the dark and were measured within a week. The MNB for Lab 2 improved further with flash-freezing and storage in liquid nitrogen (i.e., MNB: 1.4% and RMSD: 13%) compared to Lab 1 (Supplementary Figure S4, lower right panel). A two-tailed Student t-test showed that there was no significant difference between Lab 2 and Lab 1 when flash-freezing (p = 0.43).
The observed overestimations by Lab 2 already shown in the historical comparisons can be due to various reasons. One obvious reason might be that Lab 2 usually filters too low a volume of water sample: 137 ml standard based on a specific filtering set-up and filtering procedure that does not allow for varying the sampling volume. In total, 137 ml is likely to capture too little phytoplankton during open sea measurements, as indicated by the high uncertainties in the intercomparison with Lab 1 between 1998 and 2020 (Supplementary Figure S4, upper panels). The results from Lab 6, which also uses fluorometry, show much lower uncertainties that seem to be related to the use of both flash-freezing of the samples and the filtration of larger water volumes (300–500 ml, see Table 1). Generally, it is assumed that the fluorometric method is up to 50% more sensitive than the spectrophotometric method (Jeffrey et al., 1997). However, the results shown here imply that larger volumes lead to lower uncertainties also for fluorometric measurements. Thus, Lab 2 should consider filtering substantially more water volume than the standard 137 ml when sampling in the open sea, thereby adapting the filtered volume to the abundance of phytoplankton.
One way of establishing how much to filter is to initially filter a test volume of about 350 ml (25 mm diameter filter). If this is filtered through very quickly, one may require more volume. If it does not fully filter through within 10–15 min, one should discard the sample and filter a smaller volume. Additionally, one can check the hue of the filter after the first filtration and evaluate if more filtration is required to get enough material for the reliable determination of Chl-a (based on experience). Another indication one can use is the Secchi depth at the respective station to make an educated guess on what volume to filter (also based on previous filtering and measuring experience). Another possible reason for the relatively high values of Lab 2 may lie within the fluorometric method itself. The study by Dos Santos et al. (2003) conducted with 120 samples suggests that the fluorometric method always overestimates the concentrations compared to the spectrophotometric method. Besides this, direct storage in ethanol and subsequent freezing may also be one of the reasons for the overestimation, as our results indicate that this method is more efficient in extracting Chl-a (see also the discussion below regarding the uncertainties of Lab 3).
Wasmund et al. (2006) evaluated the use of smaller (250 ml) vs. the use of larger filtration volumes (600 ml) and found that smaller volumes are to be preferred as larger volumes may cause too much stress on the phytoplankton due to long filtration time and subsequently lead to Chl-a degradation. However, from our experience, we found that one can usually filter volumes between 200 and 500 ml onto a 25 mm GF/F filter with acceptable filtration times, dependent on biomass. The international oceanographic Lab 6 and Lab 8 quotes range 300–500 ml (Baltic Sea) and 300–1,000 ml (Mediterranean, Baltic, and Black Seas), respectively. It cannot be excluded that some of the uncertainties caused by the fluorometric Labs 2, 4, and 5 are caused by the low filtration volumes.
Secondly, storage and extraction procedures must be taken into account. The Bråviken samples were measured soon after arrival in the laboratory in dry ice. As they had been flash-frozen, it was unlikely that the Chl-a pigment was degraded. Table 1 shows that Lab 2 has a rather variable way of storing and extracting its samples: either the samples are extracted directly at room temperature in the dark and measured after 4 h to 7 days, or else the extracts are stored for 12 h to 4 weeks in the fridge/freezer. The latter method of storing the extracts for up to 30 days in the freezer was recommended by Wasmund et al. (2006). However, leaving the samples at room temperature for up to 7 days at room temperature is likely to cause pigment degradation (Jeffrey et al., 1997). This may partially explain the high scatter shown in Figure 6A (RMSD 109%). It must be noted that all other labs have a consistent way of storing and extracting their samples, and if they extract their samples passively at room temperature in the dark, they measure them usually within 6–24 h (see Table 1). Wasmund et al. (2006) recommend extraction in 96% ethanol for 3 to 24 h. Longer extraction times at room temperature lead to pigment loss. For extracts in acetone, additional methods are required to extract pigments efficiently. Jeffrey et al. (1997) recommend sonication under subdued light and under ice-cooling to avoid pigment degradation.
Furthermore, it is known that the fluorometric method is not only specific to Chl-a, as Chl-a and Chl-c have partially overlapping fluorescence spectra, resulting in an overestimation of Chl-a at higher concentrations of Chl-c (Gibbs, 1979; Jeffrey et al., 1997), i.e., during diatoms and dinoflagellates blooms. This is also true for the presence of Chl-b (Welschmeyer, 1994), which also partially overlaps with Chl-a as it has an absorption shoulder at 430 nm, which is used for exciting Chl-a fluorescence. The results from the HPLC analysis (Lab 8) show that several of the stations during the Bråviken campaign had phytoplankton containing both Chl-b and Chl-c (Supplementary Table S2), which partially may also explain the relative high RMSD of Lab 2. The very high RMSD in the historical intercomparisons of Lab 2 vs. Lab 1 (Supplementary Figure S4 and Table 4) may thus be due to the interference of other chlorophyll pigments.
Furthermore, there might also be interference from chlorophyllide-a. Friedrich and Spukerman (2009) found that chlorophyllide-a may result in an overestimation of “true Chl-a” by about 10–27%. According to Jeffrey et al. (1997), the excitation and emission wavelengths of Chl-a are 430 and 664 nm (Ex/Em 430/668), respectively, in acetone. The fluorometer used by Lab 2 excites at 427 nm and measures the emission at 664 nm (Ex/Em 427/664). This is rather close to the excitation and emission wavelengths of chlorophyllide-a, which is 426/667 in acetone (Jeffrey et al., 1997). Although no chlorophyllide-a was detected by the HPLC measurements in Bråviken (Supplementary Table S2), chlorophyllide-a might still have been present during the measurements evaluated in the historical comparisons (Supplementary Figure S4, upper panels), possibly explaining some of the high variability in the data (RMSD: 109%) caused by the degradation of Chl-a to chlorophyllide-a, which is usually related to inadequate storage or extraction of pigments (Wright et al., 1997). As the Chl-a degradation during extraction is dependent on the taxonomic group, this may add to the variability when comparing samples over large areas and/or at different times of the year. However, this still does not explain the relatively large systematic offset (MNB: 68%) possibly caused by calibration and/or instrument errors.
The results from Bråviken demonstrated that Lab 3 has a low MNB (−2%) compared to the median of all spectrophotometric and fluorometric measurements (Figure 3 and Table 2) and a low RMSD of 6%. The results from Bråviken show that the reliability of the Chl-a determination was even further increased when flash-freezing the samples first in liquid nitrogen before extracting them passively overnight. Flash-freezing reduced the scatter for Lab 3 vs. Lab 1 (2011 dataset) from 27% RMSD to 13% (Supplementary Figure S5, left panel), which is a substantial difference. There was no significant difference in the MNB (−0.7% in 2011 and 1.4% in 2021) as the difference between the two values was below 5%. Thus, the pigment retrieval using ethanol seems already rather efficient despite the lack of sonication (which, on the contrary, is done by Lab 1). Likely, the use of ethanol is also partially a reason for the relatively low scatter of Lab 3, as ethanol does not evaporate as easily as acetone. However, the results of the standards showed that Lab 3 underestimated the standard concentrations by −7%, which indicates some sort of instrument error, which seems to be somehow compensated for by the efficient extraction method when using ethanol. It cannot be excluded that the passive extraction in ethanol may lead to the development of chlorophyllide-a, which cannot be distinguished from Chl-a by spectrophotometry. Lab 3 may also need to oversee their filtering volume when measuring in phytoplankton bloom situations (Supplementary Figure S1B). It is likely that during measurements in phytoplankton blooms with very high Chl-a values (above 10 μg L−1), the spectrophotometer reaches its absorbance maximum. Therefore, Lab 3 should filter a substantially lower volume during phytoplankton blooms (e.g., 0.5 L instead of the usual 1.5 L for 47 mm filters). Alternatively, a higher extraction volume could be used (e.g., 20–30 ml instead of 10 ml).
Lab 1 had an MNB of 10% and a RMSD of 11% for the standards and a −2% MNB difference from the median for the Bråviken samples (with a RMSD of 13%), which is overall quite good. It must be noted that this is a full uncertainty evaluation of Lab 1 as it followed its normal storage procedure (flash-freezing in liquid nitrogen for up to 2 months and extraction by ice-cooled sonication under subdued light). The Youden plots showed that Lab 1 sometimes has erratic values. This has been observed before and is usually compensated for by always sampling triplicates during normal sampling and excluding the outlier when deriving the sample mean.
Lab 1 underestimated the concentrations by about 2% during the Bråviken sampling when compared to the median of all laboratories (MNB: −2%). In a previous intercomparison performed by the MERIS validation team (Sørensen et al., 2007), Lab 1 was found to overestimate the concentrations by about 9–10% compared to the other spectrophotometric methods. However, our current intercomparison included both spectrophotometric and fluorometric methods, and we found that the spectrophotometric methods gave, on average, about 13% lower values than the fluorometric methods (Table 2).
Additional previous intercomparisons of Lab 1 with the HPLC method of Lab 7 (following the method by Jeffrey et al., 1997) showed an overestimation of Lab 1 by about 9% (see Supplementary Figure S2A), while the HPLC method by Lab 7 lies in the range of +14–15% difference to the Van Heukelem and Thomas (2001) HPLC method applied by Lab 8 (Canuti et al., 2016). So, overall, the differences found in this intercomparison are also quite consistent with historical international intercomparisons, as Lab 8 (HPLC) had an MNB of about −23% (Table 2) when compared to the median of all spectrophotometric and fluorometric measurements in Bråviken and −21% when directly compared to Lab 1 (Table 4). Furthermore, a comparison in 2016 of Lab 1 with an Estonian laboratory (Lab 9, trichromatic spectrophotometric method by Jeffrey and Humphrey (1975), filters extracted in 96% ethanol) showed that both laboratories have very comparable results (Supplementary Figure S2B), with Lab 9 showing a 4% overestimation compared to Lab 1. However, the comparison between Lab 9 and Lab 1 is only based on 6 sample pairs (each derived from triplicate measurements per station) and more data are required to make statistically viable statements. The comparison between Lab 3 and Lab 1 (Supplementary Figure S1B) demonstrates that Jeffrey and Humphrey (1975) provided good results even when applied to ethanol extracts, although the algorithm was developed for 90% acetone. The correlation graphs in Figure 3 clearly show that Lab 3 has a comparatively low scatter (RMSD: 6%), while Lab 1 has a higher scatter (RMSD: 13%), albeit it is still rather low when compared to that of Lab 2 and Lab 8. This somewhat higher RMSD of Lab 1 (compared to Lab 3) is most likely caused by the fact that Lab 1 uses acetone as a solvent which is highly volatile. This may lead to evaporation during measurements, which may lead to an increased concentration of the samples and also to differences between replicates if the exposure time during sonication and scanning is variable. This may also explain the spurious measurements by Lab 1 shown in the Youden plots (Figure 4).
In a recent cruise in Bråviken during 28–29 April 2022, Lab 1 assessed the use of acetone extraction (samples extracted in 90% acetone under ice-cooled sonification) against the storage and extraction method applied by Lab 3, i.e., placing the filters into 95% ethanol directly after filtration, storing them in a −20°C freezer for up to 3 weeks, and extracting them for 6–24 h in room temperature prior measurements. The results revealed that the extraction in ethanol yields about 18% higher Chl-a concentrations than extraction in acetone (Supplementary Figure S2C), despite the use of sonication during acetone extraction. The analysis of the samples measured in a Shimadzu scanning spectrophotometer (UVPC-2401) showed that the spectral signatures were rather similar (Supplementary Figure S3), with only a slight shift in the blue peak, i.e., from 435 nm (acetone extracts) to 436 nm (ethanol extracts), while the peak wavelength in the red remained the same. The demonstrated higher efficiency of the Chl-a extraction in ethanol may also partially explain the higher Chl-a values of the fluorometric laboratories compared to the mean of the use of ethanol for extraction (Figure 3). However, it also must be noted that the extraction of ethanol may lead to a systematic overestimation at higher values (Supplementary Figure S2C) and should therefore be further assessed, given that the HELCOM guidelines recommend ethanol extraction.
Lab 4 had an MNB of 11% for the standards and a 12% difference from the median for the Bråviken samples, which is overall quite good. The results from Bråviken for Lab 4 are very similar to those of Lab 5 (also a fluorometric method), and the standard results are quite similar to Lab 1, which is using spectrophotometry. Lab 4 showed a low CV% of 0.4 for the standards, indicating very good repeatability. However, it remains to be tested what the uncertainties are when assessing the effect of freezing the samples at −80°C without prior flash-freezing. Although the filters are first dried on a 47 mm GF/F filter for 30 min, ice crystals could still develop during the freezing process, leading to possible destruction of the chloroplast membrane and possible pigment degradation during extraction (Jeffrey et al., 1997). The recommendation is to first flash-freeze and then move into a −80°C freezer (see Jeffrey et al., 1997; Wasmund et al., 2006).
Lab 5 had 19% MNB and RMSD for the standards (both somewhat high) and 11% MNB and 12% RMSD for the Bråviken samples. The differences between standard and field samples might be due to the different ranges of Chl-a: the nominal field concentration for the standard was very high for Lab 5: 16 μg L−1, whereas the range in Bråviken was from about 3 to 8 μg L−1. Lab 5 showed a very low CV% of 0.2 for the standards, indicating very good repeatability. As Lab 5 usually extracts the samples directly after filtration and freezes the extracts at −20°C, the samples should be quite well preserved. However, the evaluation of Lab 3 (Supplementary Figure S4) showed that prior flash-freezing can substantially decrease the RMSD (in this comparison, from 27% to about 13%). So, we would still like to recommend flash-freezing if possible.
Lab 6 had 7% MNB and RMSD for the standards and 2% MNB and 9% RMSD for the Bråviken samples. These are overall very good and consistent results, which may be partially due to the fact that the nominal field concentration for the standard for Lab 6 was 4 μg L−1 which is well within the range of the Bråviken campaign, leading to similar uncertainties for both tests. Furthermore, Lab 6 uses flash-freezing with liquid nitrogen and subsequent storage at −80°C for up to 3 months, which means that the assessed uncertainties shown here should overall represent the full uncertainties as Lab 6 could almost follow their normal protocol. Various studies have shown that flash-freezing in liquid nitrogen and subsequent storage at −80°C preserve the samples for up to about 1 year (Wright et al., 1997; Roy et al., 2011). So, this laboratory may even be able to relax the storage criteria and extend the limitation from 3 to 12 months at −80°C.
Lab 7 uses methanol, which is known to be less volatile than acetone but more volatile than ethanol. We do not recommend using methanol because it is highly toxic and also because Chl-a is very unstable in methanol and degrades very quickly (Wright et al., 1997). This also explains the strong underestimation of the Chl-a standard concentration by -23% (Table 3 and Figure 5), despite the use of the spectrophotometric method, which should lead to an overestimation (Sørensen et al., 2007). However, the correlation plots of the natural water samples (Figure 3) showed a smaller underestimation of about −10%, presumably because the Bråviken samples were measured shortly after receiving the samples in dry ice, while the standards had been prepared 5 days before the measurements, which explains the large underestimation of the standards. The Youden plots showed that Lab 7 has a systematic underestimation, which is likely due to the use of methanol. Although Lab 7 usually freezes the samples after filtration at −20°C (and after drying between clean filters), it cannot be excluded that ice crystals may develop, which in turn can initiate the development of chlorophyllase, which may degrade the Chl-a pigment (Jeffrey et al., 1997). So, a full uncertainty estimation is still to be recommended, including the uncertainties due to freezing the filters at −20°C. Nusch (1999) found a 25% degradation when storing filters at −20°C for 30 days, while no significant degradation was observed when the filters were first extracted and then stored for 30 days. Graff and Rynearson (2011), found a pigment loss of 51–62% when storing at -20°C for up to 70 days and the C.V. also increased from 3.4 to 13.1.
Lab 8 (HPLC) has an MNB of 0% for the standards (as it was set as the standard) and 2% RMSD for the Bråviken samples. However, for the field measurements, Lab 8 has generally lower values due to the use of the Van Heukelem and Thomas (2001) HPLC method, which usually has lower values than those of the method by Wright et al. (1997) and Jeffrey et al. (1997) as shown in Canuti et al. (2016); see also section above discussing the results of Lab 1 in relation to historical measurements and intercomparisons. The relatively high scatter of the results of Lab 8 (RMSD of 26%) may be due to the fast evaporation of acetone and may need further attention.
5 Conclusion
The intercomparison of Chl-a field measurements between the five Swedish and three international laboratories has shown that despite Chl-a being difficult to measure, the variation of laboratory measurements was still within about 20–25% uncertainties in the Chl-a standard and field intercomparisons when taking both the absolute (i.e., MNB) and relative differences (RMSD) into account. For the Baltic Sea laboratories, the MNB differed from −7% to +19% for the standards and −2% to +17% for the field samples, indicating that differences in extraction and handling procedures can compensate for some of the uncertainties caused by instrument errors. Based on the results from this study and historical data, our recommendation is to flash-freeze samples in liquid nitrogen and store them at −80°C, which is in line with the international IOCCG standard protocols.
However, it must be kept in mind that these intercomparisons do not fully capture the variation of the measurement uncertainties. When analyzing data from additional intercomparisons, the results look much more variable. For example, Lab 2 and Lab 3 have been compared repeatedly to Lab 1 over the last two decades. The results for Lab 2 need some special attention as the RMSD and MNB for this laboratory are much higher than anticipated (RMSD: 109%; MNB: 68%) when analyzing data from comparisons spanning over two decades. Some of these differences may be simply caused by seasonal variations and a change of methods and staff. However, it is likely that the varying treatment of samples in terms of storage and extraction methods may play a major role in the high variability. Another important factor to take into account is to adapt the filtration volume to the phytoplankton biomass at a given station. This can be done by first checking the Secchi depth, which can give an initial idea about phytoplankton biomass, as well as by doing a first trial filtration and adapting the filtration volume according to the filtration rate and the hue of the filters. Furthermore, the results show that the spectrophotometric method overall leads to lower uncertainties, while the fluorometric method seems to be influenced by other pigments than Chl-a, increasing the relative errors.
Although the results of the Bråviken comparisons are very encouraging, they could still be improved, e.g., by distributing Chl-a standards of varying concentrations, so that one can take into account that the different laboratories are optimized in different ways by adjusting the filtration and extraction volume to their normal sampling range. Also, most of the Baltic Sea field intercomparisons discussed in this study have been done during summer and autumn, and it might be necessary to make additional comparisons during spring as the results might depend on the phytoplankton composition, which varies during different times of the year. For example, in spring, diatoms and dinoflagellate are dominant, while in summer, filamentous cyanobacteria are dominant in the Baltic Sea. The additional evaluation performed by Lab 1 in spring 2022 indicates that ethanol extracts Chl-a much more efficiently than acetone in Baltic Sea waters, even when sonicating the samples during acetone extraction. There are two important conclusions to be drawn from this. First of all, the Baltic Sea laboratories following the HELCOM recommendation of extraction in ethanol may need to do further investigate how this procedure compares to the international recommendations for marine waters (i.e., flash-freezing and extraction in 90% acetone under ice-cooled domination; see JGOF’s protocols (IOC (1994)) and Jeffrey et al. (1997). On the other hand, the marine community may benefit from evaluating the use of ethanol for Chl-a extraction as the results presented in this study indicate that ethanol is much more efficient for this purpose. Besides this, the use of ethanol is environmentally more friendly and less toxic to human health.
Last but not least, by comparing the results from this study to published studies on the evaluation of satellite data, we found that the uncertainties for MERIS and OLCI are now well within the range of those of in situ measurements. This is a very promising result as the use of satellite data substantially improves both the temporal and the spatial coverages of Chl-a, which have been designated as essential climate variables. Given that ESA has already launched OLCI-A and OLCI-B, the spatial and temporal coverage is likely to improve even more with OLCI-C and OLCI-D planned to be launched within the coming 2–6 years. Furthermore, the results presented here show that spectrophotometric and fluorometric methods are viable alternatives for satellite validation when using flash-freezing and consistent extraction procedures and when the instruments are well calibrated and the methods are well intercompared.
Data Availability Statement
The original contributions presented in the study are included in the article/Supplementary Material; further inquiries can be directed to the corresponding author.
Author Contributions
SK had the original idea. SK and TH sought the funding. SK, EC, and TH contributed to the conception and design of the study. SK coordinated field and lab work. SK and EC participated in laboratory measurements. SK, EC, and TH participated in the data analysis. SK compiled the data and did most of the data analysis. SK and TH performed the statistical analysis. SK wrote the first drafts of the manuscript. TH and EC wrote sections of the manuscript. All authors contributed to manuscript revision, read, and approved the submitted version.
Funding
The authors would like to thank the Swedish Agency for Marine and Water Management (SwAM) for cofunding this chlorophyll-a intercomparison (Project No. 538-21). Additional financial support was received from the Swedish National Space Agency (SNSA, Dnr. 175/17), as well as internal funding from the Norwegian Institute for Water Research (NIVA) and the Joint Research Centre (JRC) in Italy.
Conflict of Interest
The authors declare that the research was conducted in the absence of any commercial or financial relationships that could be construed as a potential conflict of interest.
Publisher’s Note
All claims expressed in this article are solely those of the authors and do not necessarily represent those of their affiliated organizations, or those of the publisher, the editors and the reviewers. Any product that may be evaluated in this article, or claim that may be made by its manufacturer, is not guaranteed or endorsed by the publisher.
Acknowledgments
Great thanks are due to Lucille Buchenhorst for helping with the cruise logistics, for participation in both field and laboratory work, as well as assisting with data analysis and compilation. Moreover, thanks are due to Jenny Lycken, Kristin Andreasson, and Noemi Marsico for participation in both field and laboratory work. The authors thank the technical staff from the various pelagic/marine monitoring laboratories: Johanna Honkanen, Åsa Hallberg, Isabel Casties, Svetlana Pakhomova, Christian Burmeister, and their colleagues for measuring and deriving chlorophyll-a. The authors thank Jakob Walve, Helena Höglander, Siv Huseby, Joakim Ahlgren, Peter Tiselius, Anke Kremp, Elisabeth Sahlsten, and Mikael Krysell for discussions and support.
Supplementary Material
The Supplementary Material for this article can be found online at: https://www.frontiersin.org/articles/10.3389/frsen.2022.866712/full#supplementary-material
References
Attila, J., Koponen, S., Kallio, K., Lindfors, A., Kaitala, S., and Ylöstalo, P. (2013). MERIS Case II Water Processor Comparison on Coastal Sites of the Northern Baltic Sea. Remote Sens. Environ. 128, 138–149. doi:10.1016/j.rse.2012.07.009
Behrenfeld, M. J., O’Malley, R. T., Siegel, D. A., McClain, C. R., Sarmiento, J. L., Feldman, G. C., et al. (2006). Climate-driven Trends in Contemporary Ocean Productivity. Nature 444 (7120), 752–755. doi:10.1038/nature05317
Beltrán-Abaunza, J. M., Kratzer, S., and Brockmann, C. (2014). Evaluation of MERIS Products from Baltic Sea Coastal Waters Rich in CDOM. Ocean. Sci. 10, 377–396. doi:10.5194/os-10-377-2014
Bidigare, R. R., Van Heukelem, L., and Trees, C. C. (2002). “HPLC Phytoplankton Pigments: Sampling, Laboratory Methods, and Quality Assurance Procedures,” in NASA Ocean Optics Protocols for Satellite Ocean Color Sensor Validation, Revision Greenbelt, Maryland: NASA Goddard Space Flight Center. Editors J. L. Mueller, and G. S. Fargion (NASA), 258–268.
Brockmann, C., Doerffer, R., Peters, M., Stelzer, K., Embacher, S., and Ruescas, A. (2016). “Evolution of the C2RCC Neural Network for Sentinel 2 and 3 for the Retrieval of Ocean Colour Products in Normal and Extreme Optically Complex Waters,” in Proceedings of the Living Planet Symposium 2016 (Prague: Czech Republic), 54.
Canuti, E., Ras, J., Grung, M., Röttgers, R., Costa Goela, P., Artuso, F., et al. (2016). HPLC/DAD Intercomparison on Phytoplankton Pigments (HIP-1, HIP-2, HIP-3 and HIP-4). Ispra, Italy: JRC Technical Reports, DG Joint Research Centre, Publication Office of the European Union, Luxembourg. doi:10.2788/47099
Claustre, H., Hooker, S. B., Van Heukelem, L., Berthon, J.-F., Barlow, R., Ras, J., et al. (2004). An Intercomparison of HPLC Phytoplankton Pigment Methods Using In Situ Samples: Application to Remote Sensing and Database Activities. Mar. Chem. 85, 41–61. doi:10.1016/j.marchem.2003.09.002
Darecki, M., and Stramski, D. (2004). An Evaluation of MODIS and SeaWiFS Bio-Optical Algorithms in the Baltic Sea. Remote Sens. Environ. 89 (3), 326–350. doi:10.1016/j.rse.2003.10.012
Dos Santos, A. C. A., Calijuri, M. D. C., Moraes, E. M., Adorno, M. A. T., Falco, P. B., Carvalho, D. P., et al. (2003). Comparison of Three Methods for Chlorophyll Determination: Spectrophotometry and Fluorimetry in Samples Containing Pigment Mixtures and Spectrophotometry in Samples with Separate Pigments through High Performance Liquid Chromatography. Acta Limnol. Bras. 15 (3), 7–18.
Friedrich, S., and Spukerman, E. (2009). Chlorophyll a Fluorescence and Absorption in Two Chlamydomonas Species. Ecol. Chem. Eng. A 16 (11), 1501–1513.
Gibbs, C. (1979). Chlorophyll B Interference in the Fluorometric Determination of Chlorophyll a and 'Phaeo-Pigments'. Mar. Freshw. Res. 30 (5), 597–606. doi:10.1071/MF9790597
Gohin, F., Saulquin, B., Oger-Jeanneret, H., Lozac'h, L., Lampert, L., Lefebvre, A., et al. (2008). Towards a Better Assessment of the Ecological Status of Coastal Waters Using Satellite-Derived Chlorophyll-A Concentrations. Remote Sens. Environ. 112 (8), 3329–3340. doi:10.1016/j.rse.2008.02.014
Graff, J. R., and Rynearson, T. A. (2011). Extraction Method Influences the Recovery of Phytoplankton Pigments from Natural Assemblages. Limnol. Oceanogr. Methods 9 (4), 129–139. doi:10.4319/lom.2011.9.129
Harvey, E. T., Walve, J., Andersson, A., Karlson, B., and Kratzer, S. (2019). The Effect of Optical Properties on Secchi Depth and Implications for Eutrophication Management. Front. Mar. Sci. 5, 496. doi:10.3389/fmars.2018.00496
HELCOM Combine Manual 2 for Marine Monitoring (2017). Part C, Annex C-4, Phytoplankton Chlorophyll-A. Downloaded at: https://helcom.fi/media/publications/Manual-for-Marine-Monitoring-in-the-COMBINE-Programme-of-HELCOM.pdf (Accessed January 28, 2022).
Holm-Hansen, O., Lorenzen, C. J., Holmes, R. W., and Strickland, J. D. H. (1965). Fluorometric Determination of Chlorophyll. ICES J. Mar. Sci. 30 (1), 3–15. doi:10.1093/icesjms/30.1.3
Hooker, S. B., Thomas, C. S., Van Heukelem, L., Schluter, L., Ras, J., Claustre, H., et al. (2010). The Forth SeaWiFS HPLC Analysis Round-Robin Experiment (SeaHARRE-4). Greenbelt, Maryland: NASA Tech. Memo. 2010-215857, NASA Goddard Space Flight Center, 74.
IOC (1994). “Protocols for the Joint Global Ocean Flux Study (JGOFS) Core Measurements,” in Scientific Committee on Oceanographic Measurements. IOC Manuals and Guides 29 (Paris: UNESCO), 190.
Jeffrey, S. W., Mantoura, R. F. C., and Wright, S. W. (1997). Phytoplankton Pigments in Oceanography, Monographs on Oceanographic Methodology. UNESCO.
Jeffrey, S. W., and Humphrey, G. F. (1975). New Spectrophotometric Equations for Determining Chlorophylls a, B, C1 and C2 in Higher Plants, Algae and Natural Phytoplankton. Biochem. Physiol. Pflanz. 167 (2), 191–194. doi:10.1016/s0015-3796(17)30778-3
Jeffrey, S. W., and Welschmeyer, N. A. (1997). “Appendix F: Spectrophotometric and Fluorometric Equations in Common Use in Oceanography,” in Phytoplankton Pigments in Oceanography, Monographs on Oceanographic Methodology. Editors S. W. Jeffrey, R. F. C. Mantoura, and S. W. Wright (Paris, France: UNESCO).
Kowalczuk, P., Stedmon, C., and Markager, S. (2006). Modeling Absorption by CDOM in the Baltic Sea from Season, Salinity and Chlorophyll. Mar. Chem. 101 (1-2), 1–11. doi:10.1016/j.marchem.2005.12.005
Kratzer, S., and Plowey, M. (2021). Integrating Mooring and Ship-Based Data for Improved Validation of OLCI Chlorophyll-A Products in the Baltic Sea. Int. J. Appl. Earth Observation Geoinformation 94, 102212. doi:10.1016/j.jag.2020.102212
Kratzer, S., and Tett, P. (2009). Using Bio-Optics to Investigate the Extent of Coastal Waters: A Swedish Case Study. Hydrobiologia 629, 169–186. doi:10.1007/s10750-009-9769-x
Kyryliuk, D., and Kratzer, S. (2019). Evaluation of Sentinel-3A OLCI Products Derived Using the Case-2 Regional Coast Colour Processor over the Baltic Sea. Sensors 19 (16), 3609. doi:10.3390/s19163609
Longhurst, A., Sathyendranath, S., Platt, T., and Caverhill, C. (1995). An Estimate of Global Primary Production in the Ocean from Satellite Radiometer Data. J. Plankton Res. 17 (6), 1245–1271. doi:10.1093/plankt/17.6.1245
Martín, J., Velázquez, N., and Asuero, A. G. (2017). “Youden Two-Sample Method,” in Quality Control and Assurance-An Ancient Greek Term Re-mastered (London: IntechOpen) Editor L. Kounis. doi:10.5772/63135
Mueller, J. L., and Austin, R. W. (1995). Ocean Optics Protocols for SeaWiFS Validation, Revision 1. Oceanogr. Lit. Rev. 9 (42), 805.
Nusch, E. A. (1999). “Chlorophyllbestimmung – Photometrisch,” in Methoden der biologischen Wasseruntersuchung, Band 2, Biologische Gewässeruntersuchung. Editors W. V. Tümpling, and G. Friedrich (Jena: Gustav Fischer), 368–375.
Parsons, T. R., Maita, Y., and Lalli, C. M. (1984). A Manual of Chemical and Biological Methods for Seawater Analysis. Oxford, United Kingdom: Pergamon Press.
Pasztaleniec, A., and Poniewozik, M. (2010). Phytoplankton Based Assessment of the Ecological Status of Four Shallow Lakes (Eastern Poland) According to Water Framework Directive - a Comparison of Approaches. Limnologica - Ecol. Manag. Inland Waters 40 (3), 251–259. doi:10.1016/j.limno.2009.07.001
Rantajarvi, E., Olsonen, R., Hällfors, S., Leppänen, J.-M., and Raateoja, M. (1998). Effect of Sampling Frequency on Detection of Natural Variability in Phytoplankton: Unattended High-Frequency Measurements on Board Ferries in the Baltic Sea. ICES J. Mar. Sci. 55 (4), 697–704. doi:10.1006/jmsc.1998.0384
Roy, S., Llewellyn, C., Egeland, E., and Johnsen, G. (2011). Phytoplankton Pigments: Characterization, Chemotaxonomy and Applications in Oceanography (Cambridge Environmental Chemistry Series). Cambridge: Cambridge University Press. doi:10.1017/CBO9780511732263
Schroeder, T., Behnert, I., Schaale, M., Fischer, J., and Doerffer, R. (2007). Atmospheric Correction Algorithm for MERIS above Case-2 Waters. Int. J. Remote Sens. 28 (7), 1469–1486. doi:10.1080/01431160600962574
Sørensen, K., Grung, M., and Röttgers, R. (2007). An Intercomparison of In Vitro Chlorophyll a Determinations for MERIS Level 2 Data Validation. Int. J. Remote Sens. 28 (3-4), 537–554. doi:10.1080/01431160600815533
Tilstone, G., Smyth, T., Poulton, A., and Hutson, R. (2009). Measured and Remotely Sensed Estimates of Primary Production in the Atlantic Ocean from 1998 to 2005. Deep Sea Res. Part II Top. Stud. Oceanogr. 56 (15), 918–930. doi:10.1016/j.dsr2.2008.10.034
Van Heukelem, L., and Thomas, C. S. (2001). Computer-assisted High-Performance Liquid Chromatography Method Development with Applications to the Isolation and Analysis of Phytoplankton Pigments. J. Chromatogr. A 910 (1), 31–49. doi:10.1016/S0378-4347(00)00603-4
Wasmund, N., Topp, I., and Schories, D. (2006). Optimising the Storage and Extraction of Chlorophyll Samples. Oceanologia 48 (1).
Welschmeyer, N. A. (1994). Fluorometric Analysis of Chlorophyll a in the Presence of Chlorophyll B and Pheopigments. Limnol. Oceanogr. 39 (8), 1985–1992. doi:10.4319/lo.1994.39.8.1985
Keywords: fluorometry, spectrophotometry, HPLC, measurement uncertainties, flash-freezing, recommendations (guidelines), ethanol extraction, chlorophyll-a
Citation: Kratzer S, Harvey ET and Canuti E (2022) International Intercomparison of In Situ Chlorophyll-a Measurements for Data Quality Assurance of the Swedish Monitoring Program. Front. Remote Sens. 3:866712. doi: 10.3389/frsen.2022.866712
Received: 31 January 2022; Accepted: 15 June 2022;
Published: 18 July 2022.
Edited by:
Griet Neukermans, Ghent University, BelgiumReviewed by:
Aimee Neeley, Goddard Space Flight Center, United StatesYulong Guo, Henan Agricultural University, China
Copyright © 2022 Kratzer, Harvey and Canuti. This is an open-access article distributed under the terms of the Creative Commons Attribution License (CC BY). The use, distribution or reproduction in other forums is permitted, provided the original author(s) and the copyright owner(s) are credited and that the original publication in this journal is cited, in accordance with accepted academic practice. No use, distribution or reproduction is permitted which does not comply with these terms.
*Correspondence: Susanne Kratzer, U3VzYW5uZS5LcmF0emVyQHN1LnNl