
94% of researchers rate our articles as excellent or good
Learn more about the work of our research integrity team to safeguard the quality of each article we publish.
Find out more
ORIGINAL RESEARCH article
Front. Remote Sens., 13 April 2022
Sec. Remote Sensing Time Series Analysis
Volume 3 - 2022 | https://doi.org/10.3389/frsen.2022.856903
This article is part of the Research TopicOur Changing Planet: Half-a-Century Landscape Dynamics Observed From SpaceView all 7 articles
 Peter Potapov1*
 Matthew C. Hansen1
 Amy Pickens1
 Andres Hernandez-Serna1
 Alexandra Tyukavina1
 Svetlana Turubanova1Viviana Zalles1
 Xinyuan Li1
 Ahmad Khan1
 Fred Stolle2Nancy Harris2
 Xiao-Peng Song3
 Antoine Baggett1
 Indrani Kommareddy1
 Anil Kommareddy1
Recent advances in Landsat archive data processing and characterization enhanced our capacity to map land cover and land use globally with higher precision, temporal frequency, and thematic detail. Here, we present the first results from a project aimed at annual multidecadal land monitoring providing critical information for tracking global progress towards sustainable development. The global 30-m spatial resolution dataset quantifies changes in forest extent and height, cropland, built-up lands, surface water, and perennial snow and ice extent from the year 2000 to 2020. Landsat Analysis Ready Data served as an input for land cover and use mapping. Each thematic product was independently derived using locally and regionally calibrated machine learning tools. Thematic maps validation using a statistical sample of reference data confirmed their high accuracy (user’s and producer’s accuracies above 85% for all land cover and land use themes, except for built-up lands). Our results revealed dramatic changes in global land cover and land use over the past 20 years. The bitemporal dataset is publicly available and serves as a first input for the global land monitoring system.
The implementation of global initiatives towards sustainable development, climate change mitigation, and maintaining biodiversity and ecosystem functions, such as the United Nations Framework Convention on Climate Change (UNFCCC), the Paris Agreement and COP26 Glasgow Declaration, the Convention on Biological Diversity, the UN Sustainable Development Goals, and others depends on the timely provision of relevant data on land cover and land use change (LCLUC) at global, national, and local scales. The need for globally consistent LCLUC data has long been a priority of the scientific community, with the promise of improved quantification made possible through the use of remote sensing data (Townshend, 1992). The growing and diverse user community requires globally consistent yet locally relevant LCLUC data for the development and implementation of land use policies, for monitoring sustainable development, conservation, and restoration initiatives, and for Earth systems modeling applications. The LCLUC data requirements include free and open public access, operational updates that reflect the most recent changes, suitability for multidecadal historical analysis, spatial resolution sufficient for local scale applications, thematic detail relevant to Earth systems modeling, and customization capabilities to support a wide range of practical applications. Recently, several new global land cover and land use (LCLU) datasets have been created to support such needs, including Esri 2020 Land Cover (Karra et al., 2021) and European Space Agency WorldCover 2020 (Zanaga et al., 2021). While these new datasets have unprecedentedly high spatial details and sufficiently high mapping accuracy, they lack multidecadal LCLUC monitoring capabilities and land cover typology customization, which are required for many national and regional applications.
The LCLUC data user community requires diverse thematic data for their applications. Earth resources and climate change scientists, national land management and reporting agencies, non-government environmental organizations, and civil society all need different thematic products that are impossible to provide using a single LCLU classification system (Saah et al., 2020). The LCLU products that attribute global land cover as a few discrete types may not be suitable for most scientific and practical applications. Class-based LCLU maps provide limited information on vegetation structure and dynamics, which may impair climate modeling and ecosystem functions analysis where the information on gradients of vegetation characteristics is required (DeFries et al., 1995). At the national scale, the differences between global and national LCLU definitions make global maps ineffective or inappropriate for land use management, monitoring, and reporting (Fritz and See, 2008; Saah et al., 2020).
A suite of thematic maps that reflects LCLU composition, structure, and dynamics at the product cell (pixel) scale is an alternative to discrete-legend characterization. The Vegetation Continuous Fields (VCF) approach provides per-pixel continuous fractional cover of the major land cover types, namely woody vegetation, herbaceous vegetation, and non-vegetated land cover. The VCF products were created at global and national scales using Moderate Resolution Imaging Spectroradiometer (MODIS) (Hansen et al., 2003; DiMiceli et al., 2021) and Landsat data (Hansen et al., 2011). The VCF approach provides rich information on vegetation structure for various applications and can be transformed into a custom LCLU classification scheme (DiMiceli et al., 2021). A similar approach, a modular Regional Land Cover Monitoring System (RLCMS) architecture, represents a set of thematic layers called “primitives” (Saah et al., 2020). The biophysical layers that reflect forest structure, vegetation cover, and water dynamics are aggregated with land use themes that can be directly mapped using Landsat data (croplands, settlements) into a single land monitoring system. The RLCMS approach was successfully implemented at the regional scale, providing information for the national land management and reporting agencies (https://landcovermapping.org/en/landcover/). The RLCMS allows users to select specific data tailored for their applications, such as forest monitoring (Potapov et al., 2019), and to apply custom definitions of LCLU classes.
The Landsat program jointly operated by the United States Geological Survey (USGS) and the National Aeronautics and Space Administration (NASA) provides the only satellite data record that enables multidecadal LCLUC assessment at medium spatial resolution (Wulder et al., 2012). Landsat optical data has limitations compared to the modern Earth Observations systems. Sentinel-2 and Planet constellations provide data at higher spatial resolution and with shorter repeat intervals. However, Landsat is the only publicly available medium resolution (30 m) global satellite data source available before 2016, allowing spatiotemporally consistent historical LCLUC assessment. Other benefits of Landsat include thermal sensing capabilities (which are important for cloud screening and land phenology assessment), consistent band combination and data structure that allow data integration from modern and retired sensors, and consistently processed and easy to access public data archive. With the recent successful launch of the Landsat 9 satellite, the program ensures the future provision of high-quality public data for operational LCLUC monitoring.
Recent advances in Landsat data processing into analysis-ready data enhanced our capacity to map LCLUC globally with higher precision and thematic detail. The Landsat analysis-ready data processing and machine learning algorithms were successfully employed for global forest monitoring (Hansen et al., 2013), forest structure mapping (Potapov et al., 2019; Potapov et al., 2021a), non-vegetated lands assessment (Ying et al., 2017), cropland area and crop type mapping (Potapov et al., 2021b; Khan et al., 2021; Song et al., 2021) and surface water dynamic assessment (Pickens et al., 2020). Here, we present the first results of global LCLUC mapping using Landsat data archive over two decades, 2000–2020. We characterize global LCLUC using a set of thematic bitemporal map that reflects distribution, properties, and change of the dominant LCLU types, including tree cover, croplands, built-up land, open water, and perennial snow and ice. Each thematic product can be used separately, or the products can be integrated to create a comprehensive LCLUC map using custom class definitions (Hansen et al., 2021). Each product was validated using a statistical sample of reference data. The individual datasets and the global LCLUC maps are publicly available from the dedicated web portal https://glad.umd.edu/dataset/GLCLUC2020/.
We derived most global thematic products, except open water, using consistently processed Landsat Analysis Ready Data (Potapov et al., 2020) produced by the Global Land Analysis and Discovery laboratory (GLAD) at the University of Maryland, hereafter referred to as GLAD ARD (Supplementary Figure S1). The annual GLAD ARD data time series were integrated into a set of phenology metrics that enabled global model calibration and application. We used a separate supervised classification model to map each thematic class. Individual decision tree models calibrated with manually collected training data were implemented for cropland and perennial snow and ice mapping. Forest height was estimated using a regression tree model calibrated with Global Ecosystem Dynamics Investigation Lidar (GEDI) forest structure measurements. Built-up lands were mapped using a deep learning convolution neural network (CNN) algorithm trained with Open Street Map (OSM) data. The models were calibrated locally (for forest height and cropland mapping) or regionally (other products). Surface water mapping utilized per-scene Landsat data classification and time series analysis in Google Earth Engine. We independently validated each global thematic product using statistical sample analysis. The sample reference data were collected through visual interpretation of the best available high-resolution satellite images and Landsat time series.
The Landsat data archive enabled multidecadal LCLUC monitoring at global extent and medium (30 m per pixel) spatial resolution. For all thematic products except water, we used the spatiotemporally consistent Landsat GLAD ARD inputs available from https://glad.umd.edu/ard as the source data for global LCLU mapping. The GLAD ARD product consists of 16-day global Landsat normalized surface reflectance and brightness temperature composites combined from the best quality observations. The entire Landsat Collection 1 Tier 1 data archive over the land area between 75°N and 56°S from 1997 to 2020 was processed. Small islands, Arctic islands (e.g., Novaya Zemlya), and Greenland were excluded from the GLAD ARD extent due to the absence of high-quality Tier 1 data or a short growing season (Figure 1A). In temperate and boreal regions, we processed only observations during the snow-free season defined using the MODIS Snow Cover product (MOD10CM V6). The GLAD ARD image processing consist of 1) observation quality assessment, 2) reflectance normalization to reduce effects of atmospheric scattering and absorption, and land surface anisotropy, and 3) best quality data aggregation into 16-day composites. Each 16-day composite includes the normalized surface reflectance for visible, near-infrared, and shortwave infrared Landsat bands and brightness temperature, along with the data quality layer. The data quality layer indicates the presence of atmospheric contamination (clouds, haze), cloud and topographic shadows, open water, and snow/ice coverage. The GLAD ARD data is stored in geographic coordinates with a pixel size of 0.00025° organized as 1 × 1° tiles. The product is available free of charge and is regularly updated, supporting operational annual LCLU mapping. The GLAD ARD data processing algorithm and data format are described in detail in Potapov et al. (2020).
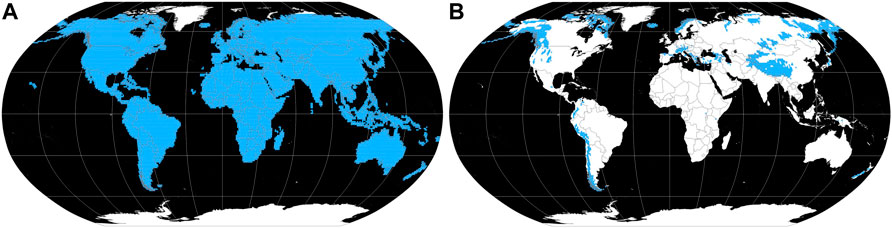
FIGURE 1. (A) Landsat GLAD ARD data extent (highlighted in blue). (B) Extent of perennial snow and ice mapping (highlighted in blue).
We integrated the annual GLAD ARD 16-day clear-sky time series into a set of rank-based statistics, hereafter named phenology metrics, that enabled the application of the multitemporal classification and regression models. Observations contaminated by cloud and cloud shadows were excluded. To avoid data inconsistency and gaps in cloudy regions (where only a few clear-sky observations per year are available) we implemented a gap-filling technique. For the forest structure and perennial snow/ice mapping, we added observations collected during three preceding years (e.g., 1997–1999 for the year 2000) in case a gap between clear-sky observations was longer than a month. For cropland mapping, we integrated all available 16-day data into an annualized time series for 2000–2003 and 2016–2019 intervals. To create phenology metrics, we ranked the annual gap-filled clear-sky observation time series by 1) reflectance value, 2) corresponding brightness temperature value, and 3) the corresponding value of vegetation indices: normalized difference vegetation index, NDVI (Tucker, 1979), and normalized difference water index, NDWI, (Gao, 1996). From each ranking, we extracted a set of statistics that include selected ranks (minimum, maximum, quartiles), inter-rank averages (minimum – first quartile, first – third quartiles, third quartile–maximum), and amplitudes (minimum to maximum, minimum to the median, median to maximum). A set of NDVI-based metrics that represent main phenology stages (start, end, peak of the growing season) were calculated as well. For each metric, we used the original per-pixel value along with the 3 × 3-pixels average value. The metric methodology is presented in detail in Potapov et al. (2020). The list of metrics used for forest height, snow/ice, and cropland mapping is provided in Potapov et al. (2021a). The metric list for built-up mapping includes interquartile averages from the red, near-infrared, and both shortwave infrared bands. Forest disturbances, a part of the forest extent and dynamics product, were mapped using a set of multitemporal metrics that highlight abrupt land cover change (Potapov et al., 2020).
We augmented the Landsat reflectance metrics with topographic metrics, including elevation and slope. These metrics were derived from the Shuttle Radar Topography Mission (SRTM) 90-m Digital Elevation Data downloaded from http://srtm.csi.cgiar.org south of 60°N and the Terra Advanced Spaceborne Thermal Emission and Reflection Radiometer (ASTER) Global Digital Elevation Model Version 3 (ASTGTM) downloaded from https://lpdaac.usgs.gov/products/astgtmv003/ north of 60°N.
We mapped the height of woody vegetation for the years 2000 and 2020 using the approach of Potapov et al. (2021a). The minimum height of woody vegetation included in our height product is 3 m. To enable forest area comparison with the data provided by the Food and Agriculture Organization of the United Nations (FAO), we specified forest as an area with tree height ≥5 m at the Landsat pixel scale. Out definition includes wildland, managed, and planted forests, agroforestry, orchards, and natural tree regrowth. This definition differs from the one used by the FAO by the inclusion of trees outside forests and the exclusion of temporarily unstocked forest areas (FAO 2020). Unlike FAO, we did not employ the tree canopy cover criterion to define forest extent.
We employed the global Landsat-based woody vegetation height mapping model calibrated for the year 2019 using GEDI observations (Potapov et al., 2021a). The GEDI 95th percentile of waveform energy relative to the ground elevation (RH95) metric (Dubayah et al., 2020) was used as training data. To exclude non-woody vegetation from the training, we assigned the zero height to all GEDI observations with RH95 values below 3 m. The GEDI calibration data were filtered to exclude low-quality observations and possible errors and gridded to the Landsat ARD pixels. We used the year 2019 GEDI RH95 as a dependent variable and the Landsat multitemporal metrics from the same year as independent variables to calibrate the regression tree ensembles. A separate model was calibrated for each Landsat ARD tile (1 × 1°) using training data collected within neighboring tiles. For the boreal regions north of 52°N, where GEDI data were absent, we used a set of regional models. Three separate models were calibrated for North America, Europe, and Northern Asia. The training data for each model were aggregated from GEDI observations between 40°N and 52°N and manually collected samples of treeless wetlands and tundra areas. The model calibrated for the year 2019 was applied to 2000, 2001, 2003, 2017, 2019, and 2020 annual metrics (the selection of years was determined by the technical capacity at the time of data processing).
The forest disturbance data for the 2001–2020 interval is the result of the combination of two datasets: the Global Forest Loss (GFL) data V1.8 (Hansen et al., 2013), available from https://storage.googleapis.com/earthenginepartners-hansen/GFC-2020-v1.8/download.html, and the new provisional annual forest loss data derived using the approach of Potapov et al. (2019) globally. To create the provisional annual forest loss product, we applied the V1.8 regional forest loss model to the 2001–2020 annual change detection metrics. The new annual forest loss product has the potential to improve the temporal inconsistency of the original GFL dataset, specifically, forest loss omission before the year 2015 (Palahí et al., 2021). The new forest loss data also enables the detection of repeated forest change events, which is important for the forest change analysis over long time intervals. We aggregated both datasets to create a single map of forests that experienced disturbance from 2001 to 2020.
The woody vegetation height values for the years 2000 and 2020 were calculated as the median of 2000, 2001, 2003, and 2017, 2019, 2020 products, respectively, unless forest loss for the years 2001–2003 or 2017–2020 was indicated by the forest disturbance data (in such case, only the year 2000 or 2020 product value was used, respectively). To reduce errors and noise in the model outputs due to remaining atmospheric contamination and differences in the radiometric resolution of Landsat sensors, we implemented extensive filtering of the output products. Pixels that have no indication of forest loss and that had an overlap of ranges of modeled forest height for 2000–2003 and 2017–2020 intervals were considered stable. For such pixels, we ignored the difference between height values for the years 2000 and 2020. Manual masks were used to correct forest loss and gain overestimation, especially in short seasonal forests.
We produced the year 2000 and 2020 forest extent maps by attributing pixels with ≥5 m forest height as the “forest” land cover class. The forest extent change (net forest extent loss and gain) was derived directly from the year 2000 and 2020 map comparison. The woody vegetation heigh maps were used to stratify forest extent by height classes. The forest height increase and decrease maps employed conservative definition of height change to eliminate noise in the annual model application. We calculated the net forest height increase only if a pixel had height ≥5 m in 2020 and 1) had forest height <5 m in 2000 or 2) had net forest height increase from the year 2000–2020 by ≥100%. Similarly, the net forest height loss was calculated only for pixels with year 2000 forest heigh ≥5 m if forest height reduced below 5 m or the net height reduction was by ≥50% of the year 2000 value. Areas with small differences between the years 2000 and 2020 forest height data that have no indication of forest disturbance are considered stable forests in this prototype product.
Cropland was defined as land used to produce annual and perennial herbaceous crops for human consumption, forage, and biofuel (Potapov et al., 2021b). Our definition excludes tree crops, permanent pastures, and shifting cultivation. The fallow length was limited to 4 years for the cropland class. Our definition is consistent with the FAO arable land category (FAO, 2005) and the FAO herbaceous crops land cover type (Conchedda and Tubiello, 2021), except for the temporary meadows and pastures that are included in the FAO arable land definition and are excluded from our cropland class. Cropland mapping was performed for two 4-year epochs, 2000–2003 and 2016–2019. For each epoch, we attributed a GLAD ARD pixel as cropland if a growing crop was detected during any year within the interval.
The cropland mapping model was calibrated with manually delineated training areas which were extrapolated in space and time through a three-stage algorithm (Potapov et al., 2021b). Supervised classification (bagged decision tree ensembles) was implemented at each of these three steps. At the first step, we selected 924 GLAD ARD tiles that represent crop type and agricultural techniques diversity. For each tile, we calibrated an individual cropland mapping model using manually collected training data and 2016–2019 multitemporal metrics. At the second stage, we used the resulting crop maps as training data to calibrate regional models for the 2016–2019 interval. These models were applied to a set of time intervals to create a cropland map time series prototype. At the last step, we used the stable cropland and no cropland pixels from different time intervals as training to calibrate a set of local cropland mapping models. This way we created a set of individual cropland models (one for each 1 × 1° tile) that allowed us to map cropland areas consistently for the 2000–2003 and 2016–2019 intervals. The final products were filtered by removing artifacts and cropland patches smaller than 0.5 ha.
Built-up land consists of man-made land surfaces associated with infrastructure, commercial and residential land uses. At the Landsat spatial resolution, we define the built-up land class as pixels that include man-made surfaces, even if such surfaces do not dominate within the pixel (Hansen et al., 2021). Due to the contextual nature of built-up lands, particularly settlements, we employed a deep learning convolution neural network (CNN) algorithm to map this thematic class. We utilized the U-Net CNN architecture (Ronneberger et al., 2015) which has proven to work robustly over a variety of tasks in remote sensing (Feng et al., 2019; Brandt et al., 2020). The training data were collected from Open Street Map (OpenStreetMap contributors, 2021). Specifically, we used the building outlines and roads resampled to Landsat resolution. Additional training data were collected manually through Landsat and high-resolution satellite data interpretation. To facilitate the deep learning application, we employed interquartile average metrics from the red, near infrared, and both shortwave infrared bands of GLAD ARD. The year 2020 annual Landsat input metrics were related to the training data through the U-Net architecture. For parameterizing the algorithm, we randomly sampled patches with a size of 128 × 128 GLAD ARD pixels. Weight decay and data augmentation were utilized in the form of downsampling, rotations, and flips for the gradient-based optimization of the U-Net parameters. A moving window approach at 10 × 10° tiles was employed to better fit local development patterns. Final 2000 and 2020 per-pixel class presence probabilities were generated, and validation data were used to assist in the final thresholding of the layers in depicting 2000 and 2020 extents and 2000–2020 gain in built-up lands. Loss of built-up lands, which represents a small proportion of the year 2000 class area, was not mapped by this provisional product.
Open surface water, or simply water, is defined as inland water that covers ≥50% of a pixel and is not obscured by objects above the surface (e.g., tree canopy, floating aquatic vegetation, bridges, or ice). The presented multidecadal surface water change product is based on the annual water presence dataset produced by Pickens et al. (2020). Water presence is a percent of Landsat observations classified as surface water of all annual clear-sky observations calculated per pixel.
The water dynamics analysis had three major steps: 1) per-scene Landsat data classification 1999–2020, 2) production of the annual water presence time series, and 3) multidecadal water dynamics characterization. The Landsat data for the water mapping was processed differently than for the other thematic products (Pickens et al., 2020). Instead of the GLAD ARD, the algorithm employed the original Collection 1 Tier 1 Landsat 5, 7, and 8 scenes from 1999 to 2020. We processed the Landsat data using the Google Earth Engine system. We classified each Landsat scene into land, water, and unusable data classes using an ensemble of hierarchical, bagged classification trees developed for ARD data processing (Potapov et al., 2020).
The annual water presence time series was derived from the counts of clear-sky water and land observations. To account for intra-annual variation in clear-sky observation frequency, we first calculated water presence per meteorological season. These products were integrated into annual water presence time series using seasonal weighting, for more details see (Pickens et al., 2020). Temporal filters and manual masks were applied to remove noise and errors from annual maps.
The annual water presence maps were used to characterize the 1999–2020 water dynamics (Pickens et al., 2020). The annual time series data were first smoothed using a 3-year mean moving window. From a resulting 1999–2020 time series we calculated the distribution statistics of annual water presence values. Pixels with a range of ≤33% and a mean of ≤10% or ≥90% water presence values were labeled permanent land and water, respectively. Change pixels were identified as pixels with a range of ≥50%, and all other pixels were labeled as stable seasonal water, characterized by having little or no inter-annual variation in water presence and consistent intra-annual variation. By an analysis of all local maxima and minima in the time series, pixels labeled as change were further characterized into the following main change types: net water gain, net water loss, dry period (water-land-water), wet period (land-water-land), and high-frequency (three or more) land-water transitions during the 22 years of observation.
The perennial snow and ice layer includes land covered by glaciers and snow which remains during the entire year. The map is limited to the GLAD ARD tiles where perennial snow and ice areas were detected using the ARD observation quality layer. To define the mapping area, we first generated preliminary annual snow and ice maps by selecting the ARD pixels where 16-day observation quality layers show the presence of snow and ice and the absence of snow-free land or water within the year. Using these annual maps, we selected GLAD ARD tiles which contain perennial snow and ice in the year 2000 or 2020 (Figure 1B).
We mapped permanent snow and ice using regionally calibrated supervised classification models (decision tree ensembles). Overall, we used 14 models, one model per mountain system or geographic region. Each classification model was calibrated with manually collected training data from multitemporal Landsat metrics. We used the Landsat data from the years 2000, 2010, and 2020 for training data collection. For each year, we compiled composites from Landsat observations during the peak land surface temperature and peak NDVI to separate perennial and annual snow cover. The training data were delineated using visual interpretation and integrated from 3 years to calibrate a single regional model. We iterated the models by assessing the classification output and adding training data. The final model was applied to the years 2000 and 2020, and the results were filtered using a set of rules to remove noise and artifacts.
We validated each thematic product separately using an independently collected reference sample. The individual Landsat GLAD ARD pixel (0.00025° × 0.00025°) served as a sampling unit. The sampling region consists of the thematic product mapping area which is equal to the GLAD ARD extent for forests, water, and built-up lands (Figure 1A), and represents a subset of the ARD extent for croplands (Potapov et al., 2021b) and perennial snow and ice (Figure 1B) maps. Sample units were allocated using a stratified random sampling design. We used different strata for each thematic product to target not only the LCLU class of interest but also areas with likely class omission errors (Olofsson et al., 2014, 2020). For product validation, the map and reference data were presented as discrete LCLU classes (see details in the respective sub-sections below). The map accuracy metrics include overall accuracy (the proportion of correctly mapped sample pixels), user’s accuracy of the LCLU class (which reflects the commission of this class in the map), and producer’s accuracy of the LCLU class (which reflects class omission). Map accuracy statistics were accompanied by the standard error of the estimate (s.e.). From the reference sample we also estimated the areas of LCLU classes (stable class area for a single date and change area between two dates) with the corresponding confidence intervals. These estimates are further referred to as “sample-based estimates.” Map accuracy metrics, sample-based class areas, and their respective uncertainty statistics were calculated using well-established methods (Cochran, 1977; Stehman, 2014; Pickens et al., 2020). LCLU class areas computed via counting of map pixels are referred to as “map-based.”
To estimate the accuracy of forest height mapping, we compared the forest height map for the year 2020 with the GEDI RH95 metric values within the extent of stable forests (forests that had map-based tree height ≥5 m in both years 2000 and 2020 and no indication of forest disturbance, degradation, or enhancement). We used the GEDI Collection 2 data collected between April 2019 and September 2020 for this comparison. Unlike the Collection 1 data that were used for model calibration (Potapov et al., 2021a), the Collection 2 data have better geometric precision and thorough quality assessment that excludes low-quality observations. In total, 104.7 million GEDI footprints were selected within the stable forests for this comparison.
To validate the forest extent and change product derived from the forest height dataset using the ≥5 m forest class definition, we used five strata designed to target stable and dynamic forests. The strata represented pixels which were characterized by the map time series as 1) stable non-forest; 2) stable forest; 3) forest extent loss; 4) forest extent gain; 5) forest that experienced disturbance, net loss, or gain of forest height, or was within a 30-m buffer of strata 3 or 4. We allocated 1,000 sample pixels in each of the strata equally, 200 sample pixels per stratum. To account for the latitude difference in GLAD ARD pixel area, we performed sampling of pixels with inclusion probabilities proportional to their area (Hartley and Rao, 1962; Pickens et al., 2020). A team of image analysts performed the reference data collection by interpreting each sample pixel using the Landsat GLAD ARD 16-day time series data, annual and bimonthly image composites, and high resolution image time series from Google Earth (Potapov et al., 2019). A sample pixel was assigned to the forest class if at least 50% of the pixel area was covered with trees with interpreted height of ≥5 m, or if the pixel was located within a homogeneous natural forest area with the average tree height ≥5 m. Each sample pixel was interpreted independently by two experts, and the disagreements were discussed by the team to find the consensus interpretation.
The strata design for the cropland map time series represents the intersection of seven geographic regions (North and Central America, South America, Africa, Europe and Northern Asia, Southwest Asia, Southeast Asia, Australia and New Zealand) and five cropland change scenarios, including stable cropland and no cropland, cropland gain and loss, and possible cropland omission (Potapov et al., 2021b). In total, we used 3,500 reference sample pixels equally allocated per stratum (35 strata, 100 pixels in each). We performed simple random sampling within each region following Ying et al. (2017), because the cropland strata in each region were located within a limited latitudinal extent, reducing the variation of the pixel size. The reference data were collected through Landsat and high-resolution image interpretation. Each sample pixel was interpreted by two experts independently and the disagreements were discussed and resolved by the team.
The built-up map validation followed the same principles as forest extent validation. We defined four strata, including 1) stable built-up land, 2) low and 3) high confidence built-up gain, and 4) other lands. In each stratum, we randomly allocated 100 sample pixels (400 pixels total) that were interpreted using Landsat image composites and high-resolution data from Google Earth. A sample pixel was assigned to the built-up class if the analyst detected the presence of a building or an infrastructure object within the pixel area. Two map classes were validated separately: stable built-up and built-up land expansion. The reference sample data were used to select the best threshold of built-up class likelihood (by balancing user’s and producer’s accuracies) in addition to map validation.
The surface water 1999–2018 product validation was performed using a sample of 600 reference pixels allocated using a stratified random design created by Pickens et al. (2020). The strata represent permanent land, permanent water, stable seasonal water, water loss, water gain, wet period dynamics, dry period dynamics, high frequency water, probable permanent water, probable permanent land, sparse data, and a 1 km buffer around all areas with detected water presence to quantify class omission. The reference data were collected through visual sample interpretation of a random Landsat scene per month 1999–2018, resulting in up to 240 observations per sample pixel, with interpretation aided by high-resolution images provided by Google Earth. Each month was labeled as water, land, or no-data. Annual water percent and the dynamics classes were calculated from the monthly reference data following the same methodology as for the maps.
For the perennial snow and ice product validation, we implemented a stratified sampling design with five strata: 1) stable snow/ice presence and 2) absence, 3) snow/ice gain and 4) loss between 2000 and 2020, and 5) a 30-m buffer around all detected snow/ice areas to quantify class omission. We randomly allocated 500 sample pixels (100 pixels per stratum) and interpreted these pixels using Landsat time series data. To ensure the correct separation of perennial and seasonal snow cover for each year, we used the 16-day Landsat ARD data composite with the highest brightness temperature for sample visualization and interpretation.
The global thematic map extent is limited by the land area where the Landsat ARD data was available (Figure 1A). Using global thematic maps, we quantified LCLU extent and change at the global, continental, and national scales. To estimate the area of LCLU classes, we applied thresholds to convert continuous products (e.g., forest height) into thematic classes. Since our raster Landsat ARD-based maps are in geographic coordinates, the pixel area changes with latitude. To account for the unequal pixel area, we calculated the spherical surface area of each pixel and summarized pixel areas by thematic class for each region of analysis.
We summarized the LCLU area and change by country and continent. Country boundaries were obtained from the Database of Global Administrative Areas (GADM V3.6, https://gadm.org). We delineated continents using national and administrative boundaries. We divided North and South America by the boundary between Panama and Colombia. We divided Europe and Asia by the Russian southern border and by the boundary of Russian administrative regions along the Ural Mountains. Australia includes New Zealand and Pacific Islands and is separated from Asia by the Indonesia/Papua-New Guinea country border.
We compared our map-based estimates with the official forest and cropland data provided by the FAO. The FAO Forest Resource Assessment 2020 (FAO, 2020) provides data on national forest areas for the years 2000 and 2020. The FAOSTAT year 2018 national arable land area and the year 2019 global herbaceous crop area were used to compare against our cropland area estimates (FAO, 2021).
The recently published global Sentinel-based 2020 WorldCover 2020 (Zanaga et al., 2021) developed by the European Space Agency was used for comparison with our Landsat-based data. We compared the national areas of relevant thematic classes (forest extent, cropland, built up, surface water, and snow/ice). The WorldCover product was resampled to a geographic pixel grid with a spatial resolution of 0.0001°, and the national areas were calculated using the same approach as for our product. In addition, we compared our new forest height map with the former Landsat-based tree canopy cover product for the year 2000 (Hansen et al., 2013). A detailed spatial product intercomparison was beyond the objectives of this manuscript.
To analyze the carbon emissions due to the forest loss, we estimated the average aboveground biomass carbon (AGC) density for each forest height and type strata using the harmonized global AGC map for the year 2010 (Spawn et al., 2020). The average AGC estimation was done at the spatial resolution of the AGC map resampled to the 0.0025 × 0.0025° cell grid (approximately 300 m at the Equator). To account for forest type differences, we estimated mean AGC separately for each biome obtained from the Global Ecological Zones (GEZ) map (FAO, 2012). Forest AGC strata were created by the intersection of four forest biomes (Boreal, Temperate, Subtropical and Tropical) with forest height categories that include short (5–9 m), medium-height (10–19 m), and tall (≥20 m) forests, creating 12 strata total. The forest height strata thresholds are informed by the pan-tropical AGC change estimation study (Tyukavina et al., 2015). To create a mask of 0.0025° cells suitable for the mean AGC estimation, we calculated the percent of stable forests (forests that have no indication of canopy height change or disturbance between 2000 and 2020) by each AGC strata within each grid cell. Only grid cells that had 100% of stable pixels that belong to the same forest strata were used for the mask. We randomly selected a set of 1,000 grid cells from each stratum and calculated sample-based average AGC. The per-stratum average AGC was used to estimate the total AGC for the years 2000 and 2020 and the AGC change from the corresponding strata areas calculated from the original 30-m spatial resolution data.
We performed a LCLUC hotspot analysis to highlight regions that have the highest intensity of the 2000–2020 change. Hotspots were selected for the four thematic LCLUC categories that have the highest environmental and social value: deforestation (defined as net forest loss for 2000–2020); forest AGC reduction for 2000–2020 (estimated using forest AGC strata area for years 2000 and 2020 and the per-strata mean AGC); net cropland gain for 2003–2019; and built-up area expansion for 2000–2020. The regions were defined using the Icosahedral Snyder Equal Area aperture 3 Hexagon Geodesic Discrete Global Grid System (ISEA3H GDGGS) (Sahr et al., 2003). We generated the global hexagon map at resolution 6 using the dggridR package in R (https://rdrr.io/cran/dggridR/). The grid has a nearly equal-area cell size of 70,000 km2 on average (standard deviation 1,000 km2). We calculated the 2000–2020 net quantity change for each thematic class per grid cell. For each class separately, we ranked the cells by the value of the net change. We defined hotspots as a group of cells with the highest net change quantity that together are responsible for 50% of the total change quantity. I.e., to make the deforestation hotspots map, we ranked all grid cells by their net forest change area in reverse order (from the highest loss to highest gain) and selected the cells from the top of the list until the total forest loss for the selected cell is equal 50% of the global total net forest loss.
Our global bitemporal maps portray changes in the Earth’s land cover and land use during the first 20 years of the century. The results show the reduction of global tree cover extent and expansion of cropland and settlements. LCLU dynamics have distinct regional patterns reflecting the expansion and abandonment of intensive land management. Surface water dynamics have pronounced regional variation linked to hydropower projects and depletion of natural lakes in dry climates. The area of perennial snow and ice declined dramatically in a warming climate. The global and regional LCLUC areas were obtained directly from the maps, therefore regional area estimates may be biased due to map errors. Our global maps can facilitate the national and sub-national reporting provided that an additional statistical sampling approach and independent reference data collection are employed.
We define forest as land cover with tree canopy height ≥5 m, including natural and planted trees. In the year 2020, the global forest area was 40.2 million km2, which makes up 31% of the analyzed land area (land area within the Landsat ARD product extent excluding inland water). During the last two decades, 2000–2020, forest extent decreased by 1 million km2, or by 2.4% of the year 2000 forest area (Table 1). The net forest loss is a result of the imbalance between the gross forest loss (2.3 million km2), defined as forest area of the year 2000 cleared permanently or temporarily by the year 2020, and gross forest gain (1.3 million km2), defined as forests established or recovered by the year 2020 within the year 2000 non-forest land. Of the year 2000 forest area, 5.6% was cleared (forest loss) and another 8% affected by stand-level disturbances or experienced forest height reduction by ≥50% (forest disturbance and degradation). The global forest loss and disturbance pattern (Figure 2D) highlights agricultural expansion frontiers, timber production regions, and the effects of stand-replacement wildfires. Of the year 2020 forest area, 3.3% was made up of forest stands established since the year 2000 (forest gain), and 1% was made up of forest stands where tree height increased by ≥100% (forest enhancement).
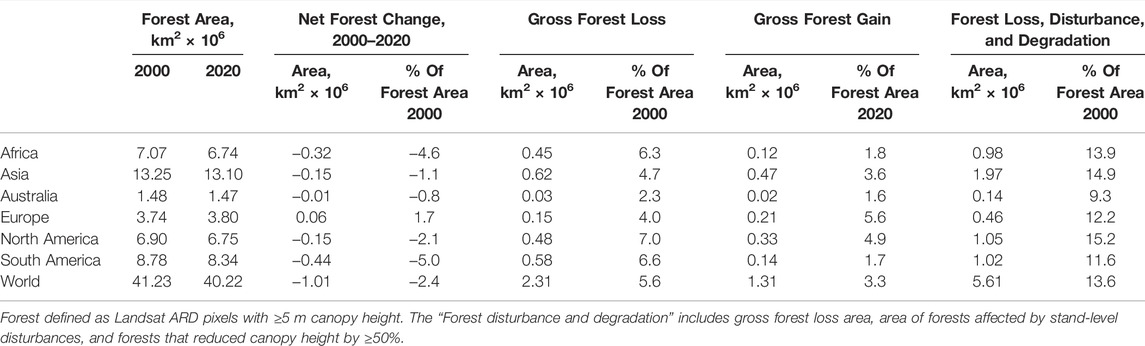
TABLE 1. Map-based forest area and change, 2000–2020.
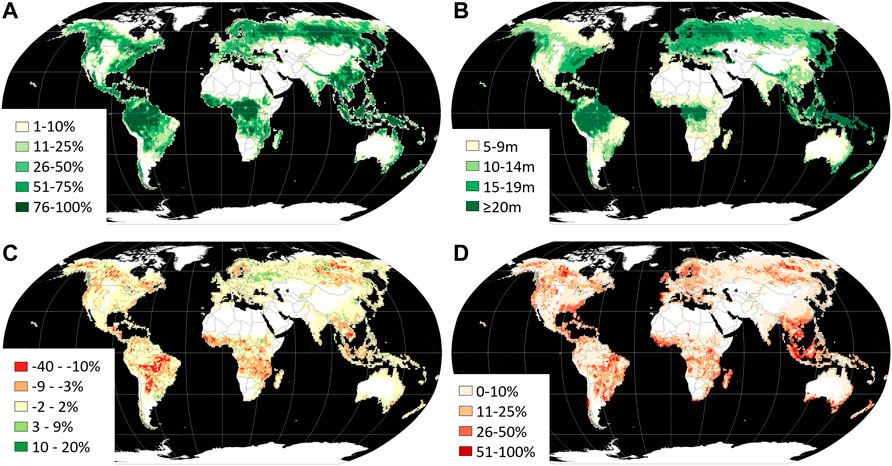
FIGURE 2. Forest extent, structure, and dynamics for each 1 × 1° grid cell. (A) Forest area 2020, % cell area. Forest defined as Landsat ARD pixels with ≥5 m canopy height. (B) Mean forest height 2020, meters. (C) Net forest area change, 2000–2020, % cell area. (D) Forest loss, disturbance, and degradation 2000–2020, % year 2000 forest area within a cell.
Asia and South America had the largest shares of global forest extent in 2020 (33 and 21%, respectively), while Europe and Australia’s shares were the least (9 and 4%) (Table 1; global forest distribution shown in Figure 2A). Compared to the continent’s land area, South America and Europe had the largest forest proportion (48 and 40%, respectively), while Australia has the lowest (17%). South America had the highest rate of 2000–2020 net forest loss (5% of the year 2000 forest area, or 0.44 million km2), followed by Africa (4.6%, or 0.32 million km2). The gross forest gain in Africa and South America compensated less than 30% of their respective gross forest loss area. In South America, net forest loss is concentrated along agricultural expansion frontiers surrounding remaining intact Amazonian rainforests, while in Africa it is spread over the forest extent of the continent (Figure 2C). Asia has the largest area of gross forest area change, both loss and gain. Forest loss hotspots in Asia are related to fires and logging in Siberia and agricultural clearing in the Lower Mekong region (Figure 2C). In Asia, Australia, and North America, forest gain area compensates 70–80% of the forest loss, resulting in a moderate net forest area reduction by 1–2%. Europe was the only continent that increased its forest area (by 1.7% of the year 2000 forest area, or 64,000 km2). Forest gain in Europe was concentrated within the Russian “Nechernozemie” (non-chernozem soils) region that had the highest agricultural abandonment rate and subsequent forest encroachment over former croplands and pastures. North America had the highest rate of forest change (15.2% of the year 2000 forest area), including gross forest loss, stand-replacement disturbance, and forest height reduction as a result of forest management or degradation.
Most of the global forest area (99.8%) is within the 135 countries that have at least 5,000 km2 of forests. Just five countries, Russia, Brazil, Canada, USA, and China, together share more than 50% of the global forest area. Of the 135 countries, 60 countries lost more than 1% of their forest area while only 17 countries increased their forest area by more than 1%. The largest net forest loss area was found in Brazil, followed by Canada, the Democratic Republic of the Congo, and Paraguay. The highest rate of forest area loss (compared to the year 2000 forest area) was in Cambodia (−26%), Paraguay (−25%), and Uganda (−23%). The largest net forest gain area was in China, followed by India, Uruguay, and East European countries Poland, Ukraine, and Belarus. The highest forest area increase compared to the year 2000 forest area was in Uruguay (+54%) and Ireland (+34%). Forest area increase in both these countries is due to the rapid expansion of commercial timber plantations made up mostly by introduced tree species (Eucalyptus in Uruguay and Sitka spruce in Ireland).
Our forest height maps provide information on land cover dynamics that is relevant for carbon monitoring. Here, we separated forest extent into three strata by forest height: short (5–9 m), medium-height (10–19 m), and tall (≥20 m) forests. Most of the world’s forests have canopy heights of 10 m and higher. Of the total year 2020 forest area, short forests made up 24% while medium-height and tall forests made up 38% each (Figures 2B, 3A and Table 2). Most of the forests in Europe and South America (≥62%) are tall, while in Africa short forests represent 45% of total forest area. South America, Asia, and Europe together comprise 75% of global tall forests.
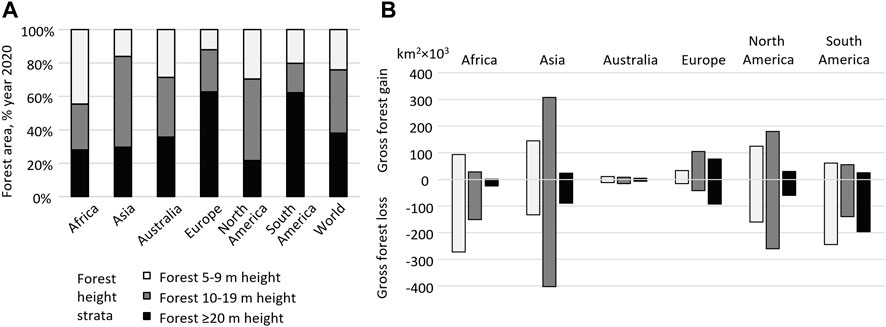
FIGURE 3. (A) Percent of each forest height strata within the year 2020 forest area. (B) Gross forest area loss and gain 2000–2020 by forest height strata.
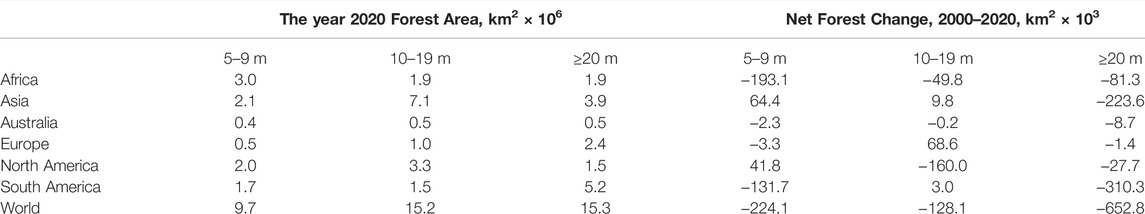
TABLE 2. Map-based forest area and change, 2000–2020, by forest height strata.
Gross loss and gain dynamics affect short and medium-height forests more than tall forests. Of the global gross forest loss and gain area, only 20 and 12%, respectively, were found within tall forests. However, the ratio of gross forest gain to loss is lower for tall forests (0.34) than for short and medium-height forests (0.56 and 0.68, respectively). As a result, net forest loss area is highest for the tall forests strata (0.65 million km2, or 4.1% of the year 2000 forest area) (Table 2). Net loss within short and medium-height forests was 2.3 and 0.8% of the respective year 2000 strata area; both estimates are below the global net forest area reduction of 2.4%.
Intensive gross forest loss and gain in short and medium-height forests of Asia are nearly balanced and resulted in a small net area gain (Figure 3B). In North America, gross forest change in short forests is also balanced, but medium-height forests experienced net area loss. Intensive forest dynamics on both these continents are due to timber plantations and agroforestry management in the south and forest fires in the north. The gain of short forests in Asia and North America can be explained by the timber plantation management, establishment of tree plantations (oil palm, rubber) in tropical and subtropical forests, and forest restoration over old burned areas in the boreal forests. Forest change in Africa and South America shows the loss and gain imbalance for all forest height strata, leading to a net forest area reduction. Earlier research (Tyukavina et al., 2015; Tyukavina et al., 2017; Tyukavina et al., 2018; Curtis et al., 2018; Turubanova et al., 2018; Zalles et al., 2021) suggested that the expansion of shifting cultivation, permanent croplands, and pastures are the main drivers of forest conversion in these continents. The area of tall forests was reduced in all continents, including Europe. The largest reduction of tall forests was in Asia and South America, followed by Africa. The observed reduction of tall forests in the tropics corresponds to the expansion of permanent agriculture (which resulted in deforestation), shifting cultivation (which resulted in conversion to secondary forests), and agroforestry (which resulted in conversion of tall primary forests into shorter tree plantations).
Tall forests store the highest amount of carbon per unit of area (Tyukavina et al., 2015), which suggested that the loss of the tall forest area corresponds to the highest carbon emissions. Using the average AGC per forest stratum defined by forest height and biome, we estimated that the global forest AGC reduced by 3.3% from the year 2000–2020. Net reduction of tall forests area accounted for 83% of the total AGC loss, while net forest change within short and medium-height forests contributed only 9 and 8%, respectively. Of the total AGC reduction in tall forests, 52% occurred in South America, 30% in Asia, and 13% in Africa. At the national scale, Brazil had the highest AGC reduction, contributing 34% to the global total, followed by Indonesia (9%) and the DRC (7%), together contributing 50% of the global AGC reduction due to net forest area change.
Reference sample data are the best tool for attribution of forest change proximity drivers (Tyukavina et al., 2017; Tyukavina et al., 2018). Using our validation sample data, we estimated that 38% (s.e. 4%) of total gross forest loss area was due to land use or land cover conversion (deforestation), and the rest was due to logging, tree plantation management, and shifting cultivation (temporary tree removal). The small sample size did not allow us to quantify the role of different proximate drivers of forest conversion. Visual analysis of sample data suggested that deforestation was primarily driven by pasture and cropland expansion. Other factors such as settlement and infrastructure expansion, mining, and permanent flooding were also detected in the reference sample. Using an overlay of the forest loss 2000–2020 map and the year 2019 cropland map, we found that 9% of the forest loss area was transformed into permanent cropland. In Africa and South America, the proportion of forest loss conversion to cropland was the highest, 18 and 13%, respectively. Our built-up lands map shows that urban expansion and construction within existing urban areas were linked to 4% of gross forest loss globally. Asia had the largest proportion of the forest loss within year 2020 built-up lands (6%), followed by Europe and Australia, while South America had the least (<2%). Using the overlay with the water extent map, we estimated that 1% of forest loss was caused by flooding, either natural or due to reservoir construction. In Asia, nearly 2% of forest loss was due to flooding, mostly for hydropower projects.
Using the reference sample data, we estimated that 39% (s.e. 5%) of gross forest gain was due to man-made restoration or plantation establishment, and the remainder to natural forest restoration. Of the mapped gross forest gain, 5% were located within year 2020 built-up lands. Asia had the largest share of gross forest gain in settlements. Because the thematic land cover maps were derived independently, a small overlap between land cover classes may be due to the inconsistencies in mixed pixel attribution (e.g., a mixed pixel on the border of cropland and forest may be attributed as both these classes). Given this limitation, findings from the land cover map overlays should be confirmed with reference sample data.
Global cropland area increased by 11.5% between the 2000–2003 interval and the 2016–2019 interval (Table 3). The largest net cropland area increase was in Africa (by 0.5 million km2), followed by Asia and South America. South America had the largest relative cropland area increase (45% of the year 2000 cropland area) followed by Africa (33% increase), while other continents increased their cropland area by less than 10%.

TABLE 3. Map-based cropland area and change, 2000–2019.
During the last 20 years, the gross global cropland area expansion (2.3 million km2) was twice higher than the cropland area reduction (1.1 million km2). In Europe and North America, where crop expansion (mostly through pasture or long fallow conversion) and reduction (through abandonment or conversion to other land uses) are balanced, the resulting net cropland area change was small. In Africa and South America, cropland expansion is four times and six times (respectively) higher than reduction, driving net cropland area increase.
In 2019, six countries, the USA, India, China, Russia, Brazil, and Australia, hosted more than half of the global cropland area (Figure 4A). From 2000 to 2019, Russia experienced the largest net cropland area reduction, while Brazil and India had the largest net cropland gain. Spatial distribution of net cropland area change (Figure 4B) highlights agricultural expansion hotspots in South America (Pampas, Chaco, Brazilian Highlands, and southeast part of Amazon rainforests), Africa (the Sahel and the Great Rift Valley), India, Lower Mekong countries, Northern China, and Australia. The largest cropland loss hotspot is in the Russian Nechernozemie region due to the abandonment of unproductive croplands. At the same time, croplands that were abandoned after the breakdown of the Soviet Union in southern European Russia, Ukraine, Belarus, and the Baltic States are being recultivated, creating a cropland gain hotspot in Eastern Europe. Local crop reduction hotspots in China are driven by tree plantation, agroforestry, and urban expansion that replaced traditional annual crops.
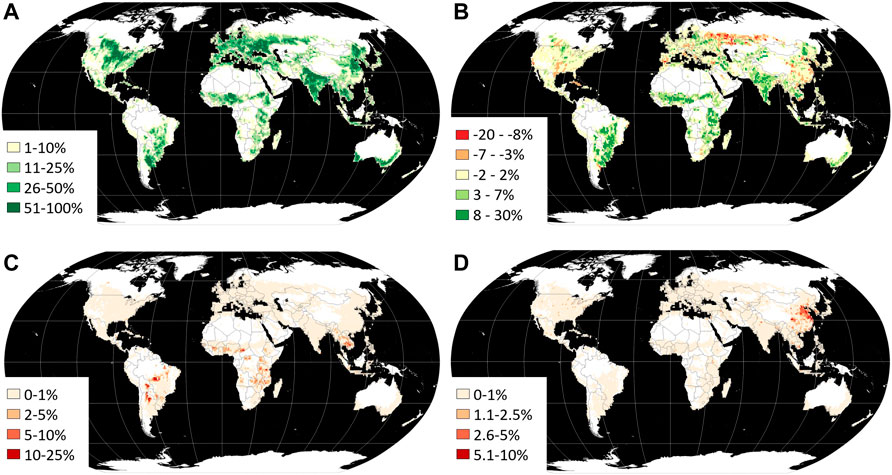
FIGURE 4. Cropland extent and dynamics for each 1 × 1° grid cell. (A) Cropland area 2019, % cell area. (B) Net cropland area change, 2000–2019, % cell area. (C) Cropland gain 2000–2019 within forest loss 2000–2020 area, % cropland gain area within a cell. (D). Cropland loss 2000–2019 within the year 2020 built-up lands, % cropland loss area within a cell.
Our sample reference data (Potapov et al., 2021b) showed that nearly half of the global cropland expansion happened at the expense of natural vegetation. To highlight regions where cropland replaced forests during the last 20 years, we overlaid the cropland gain map with the map of forest loss, disturbance, and degradation (Section 3.1.1). Globally, 8% of the cropland expansion area was co-located with forest loss, with the highest proportion in South America (17%) and Africa (13%). The map (Figure 4C) shows the major hotspots of cropland-driven deforestation in South America (Cerrado and Amazonian moist forests in Brazil, Chaco forests in Argentina, and Chiquitano forests in Bolivia), the Great Rift Valley and West African countries, and in Cambodia.
Global cropland reduction was primarily driven by crop abandonment or conversion into pastures (52% of cropland loss area, Potapov et al., 2021b), while built-up area and infrastructure expansion was the second most important driver. Using the cropland loss and built-up lands map overlay, we showed that 13% of the cropland reduction area is co-located with stable or expanding settlements. In Asia and North America, the proportion of cropland loss area within the year 2020 built-up lands was 21 and 10%, respectively. The spatial distribution of cropland reduction with the year 2020 built-up lands (Figure 4D) highlights intensive cropland conversion due to urban sprawl in Northern China and South Korea.
The map-based year 2020 global built-up lands area was 4.3 million km2, nearly half of which (47%) was in Asia (Figure 5A and Table 4). China alone had 21% of the global settlement and infrastructure area followed by the USA (14%). These two countries, together with India, Brazil, Russia, Indonesia, and Canada, comprise half of the global built-up extent. Using global maps, we found that the built-up area increased by 50% from 2000 to 2020. Of the total built-up area gain, 60% was in Asia, where it increased by 73%. This increase was primarily caused by urban expansion in North and Southeast China and in Northern and Eastern India (Figure 5B). China was responsible for 30% of the global built-up area gain. Africa, while it shared a much smaller portion of the total built-up area gain (12%), had the second-highest rate of built-up increase (by 68%). This gain was mostly driven by urbanization within the East (Ethiopia, Kenia, Rwanda) and West (Nigeria, Ghana) parts of the continent. Europe and North America had the lowest rates of built-up lands increase globally. However, at the national scale, the absolute area of built-up area gain in the USA was the third-largest (after China and India). The urban expansion in the USA mostly happened on the outskirts of the established population centers, thus the relative net gain of the built-up area was moderate (by 20% of the year 2000 area).
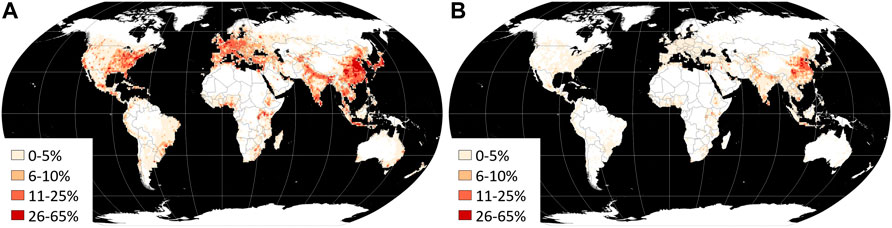
FIGURE 5. Built-up lands and their net change for each 1 × 1° grid cell. (A) Built-up lands 2020, % cell area. (B) Built-up lands increase 2000–2020, % cell area.
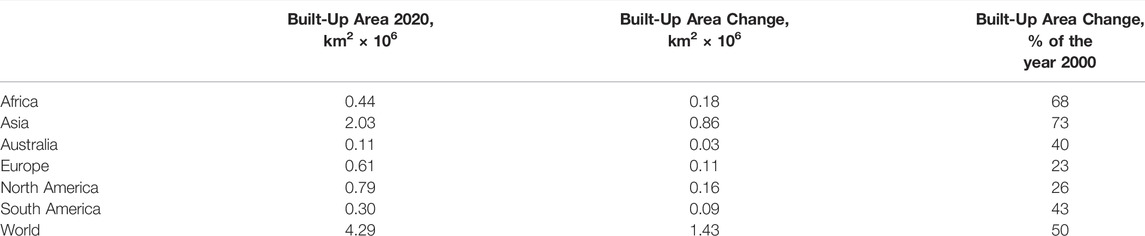
TABLE 4. Map-based built-up lands area and change, 2000–2020.
Globally, 3.5 million km2 were mapped as persistent inland open water in 2020. Persistent water was defined as ≥50% annual water presence, excluding snow and ice cover. North America had the most inland surface water, representing 46% of all persistent water in 2020, followed by Asia with 27%. Africa, South America, and Europe each shared 8–9% of global persistent water area, and Australia had only 0.4%. Canada alone represents 34% of the global surface water, largely due to the water-saturated landscape of the Canadian Shield (Figure 6). The top five countries (Canada, Russia, the USA, China, and Brazil) comprise 71% of the total global 2020 persistent water extent, which reflects their high share of the global freshwater supply.
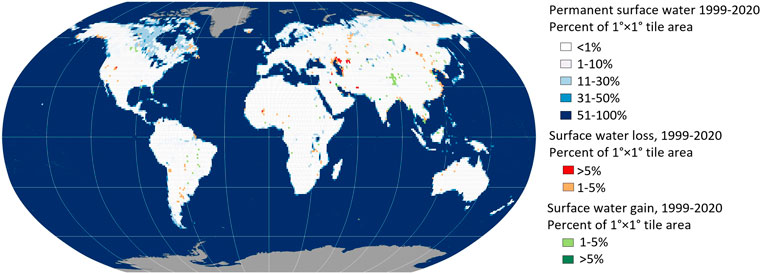
FIGURE 6. Surface water extent and unidirectional dynamics, 1999–2020.
Considering 1999–2020 interannual dynamics, North America had the most surface water, with 39% of the global total for all water dynamic classes and 51% of all permanent water. The surface water extent of North America is the most stable with permanent water composing 63% of its total water extent. Asia had the largest extent of dynamic water presence (44% global total) but only 22% of permanent water. The surface water extent in Australia was the most dynamic with 82% of its total water area being seasonally (44%) or interannually variable (39%) and only 18% permanent.
On the national scale, Kazakhstan had the largest share of global surface water loss (14%) following by Uzbekistan (8%) due to the decline of the Aral and Caspian Seas (Figure 6). China had the largest proportion of surface water gain (19% global total) due to the expansion of lakes on the Tibetan Plateau and creation of reservoirs by construction of dams.
Our global mapping extent excludes the largest Earth’s ice sheets of Greenland and Antarctica. Within the analyzed land area (between 75°N and 56°S), the perennial snow and ice cover is mostly found within mountain regions in the form of mountain and valley glaciers and snowcaps, and as perennial snowfields in the Arctic. For mapping purposes, we define perennial snow and ice by the land cover during the hottest time of the year at the Landsat ARD pixel scale. A pixel was assigned to this thematic class if snow or ice cover was detected for the Landsat observation with the highest annual land surface temperature.
Our bitemporal maps show that the area of perennial snow and ice within the analyzed part of the globe decreased by 11.5%. Such a high area loss, however, was not confirmed by our sample analysis, which quantifies the total loss of snow and ice cover by 6.6% (see section 3.2.5). The overestimation is related to the year 2000 snow and ice commission error. While our maps may not serve for direct estimation of ice and snow cover change, they can be used to indicate change hotspots. The highest rate of snow and ice decline was found in Africa (Table 5), where glaciers on top of Mount Kilimanjaro and Mount Ngaliema are quickly melting (Figure 7B). The largest area of snow and glaciers retreat was in North America, within Western Cordillera and the Canadian Arctic Archipelago (Figure 7A). In Asia, the loss of perennial snow and ice was the highest in the Western part of the Himalayas and in the Hindu Kush mountain range. We found that the perennial snow and ice cover in Europe and in Northern Asia was relatively stable.
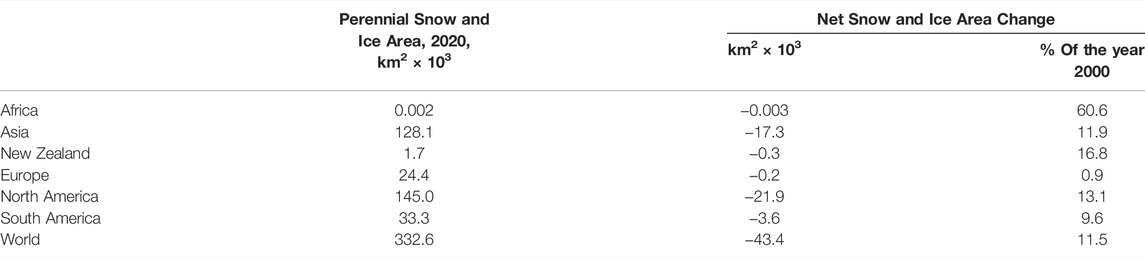
TABLE 5. Map-based perennial snow and ice extent and reduction area, 2000–2020.
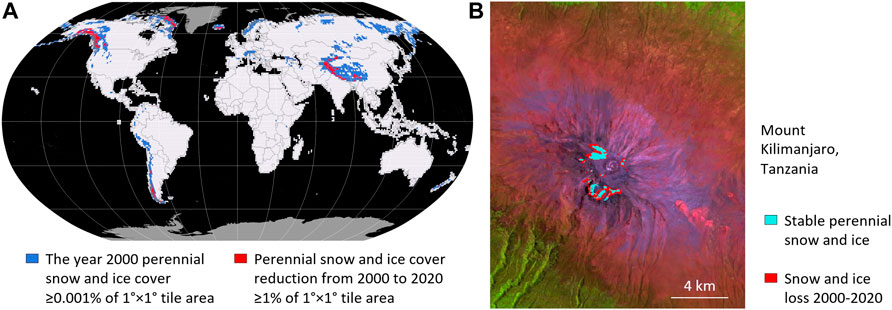
FIGURE 7. (A) The year 2000 perennial snow and ice extent and its 2000–2020 reduction for each 1 × 1° grid cell. (B) Mount Kilimanjaro perennial snow and ice reduction, 2000–2020.
The year 2019 forest height model validation results are provided in Potapov et al. (2021a). The year 2019 forest height map was compared to the GEDI Collection 1 set-aside validation data (RMSE = 6.6 m; MAE = 4.45 m, R2 = 0.62) and available canopy height data derived from airborne lidar (RMSE = 9.07 m; MAE = 6.36 m, R2 = 0.61). Here, we compared the year 2020 forest height map for stable forests with the GEDI Collection 2 RH95 metric value (Figure 8). The comparison showed similar relationship between the map-based and GEDI height values: RMSE = 6.75 m, MAE = 4.76 m, and R2 = 0.53. The Landsat map is limited to the forest height ≥5 m (forest definition), and the GEDI data to the forest height ≥3 m (pixels with RH95 below 3 m were considered non-forest). We expect that the year 2000 product created using the same regression model and similar Landsat metrics have similar model uncertainty.
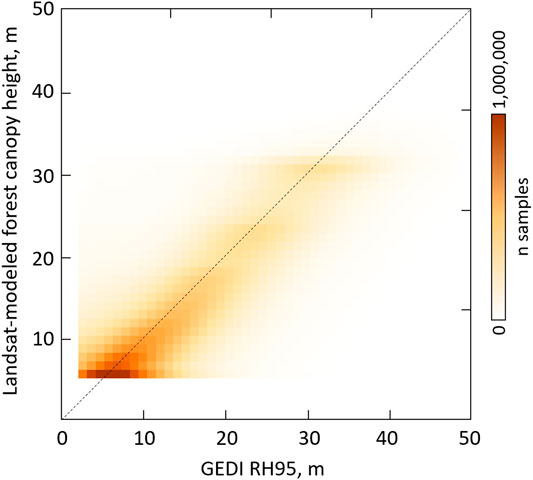
FIGURE 8. Comparison of the Landsat-based year 2020 forest height map values with the GEDI Collection 2 data within stable forests. The analysis is performed within the GEDI data range. N = 104,673,802.
The sample-based validation revealed that the maps of forest extent 2000 and 2020 and the stable forest class extent have high accuracies, with both user’s and producer’s accuracies above 93% (Table 6). The accuracy of the forest gain and loss classes is lower. The user’s accuracy of forest gain (71%) was compromised by the confusion between forest enhancement (existing forest height increase) and forest gain (establishment of forests within the year 2000 non-forest land). This confusion was most prominent in the boreal forests, where forest height in the year 2000 was not always possible to interpret even by reference data. The producer’s accuracies of both forest loss and gain classes were the lowest, indicating that the product provides conservative estimates of forest dynamics.
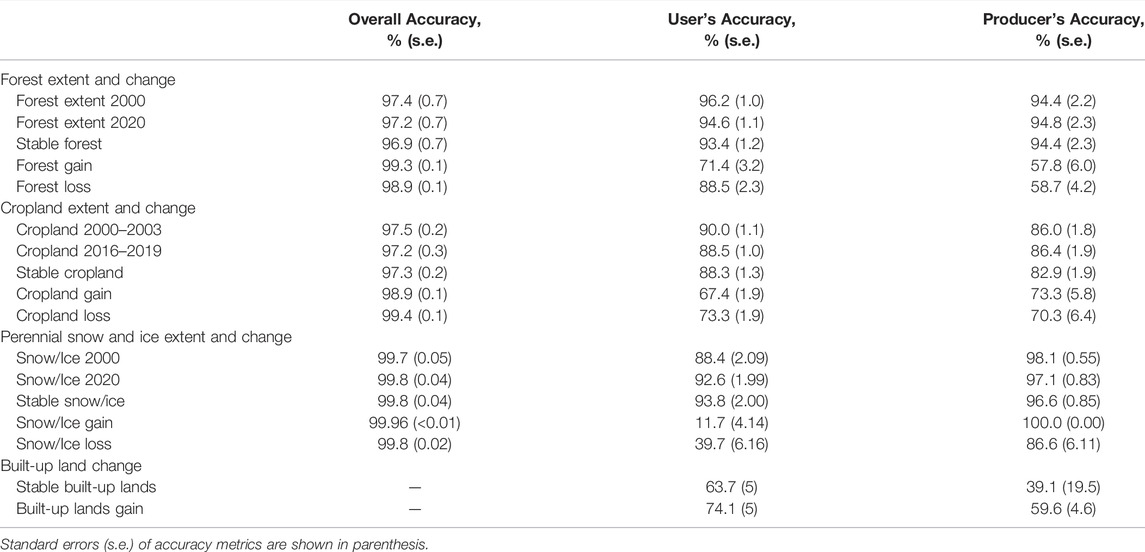
TABLE 6. Global forest, cropland, perennial snow and ice, and built-up land extent and change maps accuracy metrics (expressed as a percentage).
Our global map-based forest area estimates are very similar to the global forest area reported by FAO Forest Resource Assessment 2020 (FAO FRA) (FAO, 2020), with less than 1% difference for both year 2000 and 2020 total forest area (Figure 9A). At the national scale, the forest area from the map and FAO FRA are closely related (Figure 10) with R2 of 0.98 and 0.99 for the year 2000 and 2020 forest area, respectively. However, we observe significant differences between the map and reported forest area in some countries. Our map underestimated the year 2020 forest area in Brazil, Canada, and Australia by nearly 0.5 million km2 each. In Somalia, Botswana, and Namibia, our map shows nearly twice as less forest area as the FAO FRA estimate. The map-based area for Indonesia, the DRC, and the Central African Republic are higher than the FAO estimate. The discrepancies are due to 1) forest definition inconsistency between the countries, and 2) the area of agroforestry and tree crops that are excluded from the FAO FRA forest area estimation.
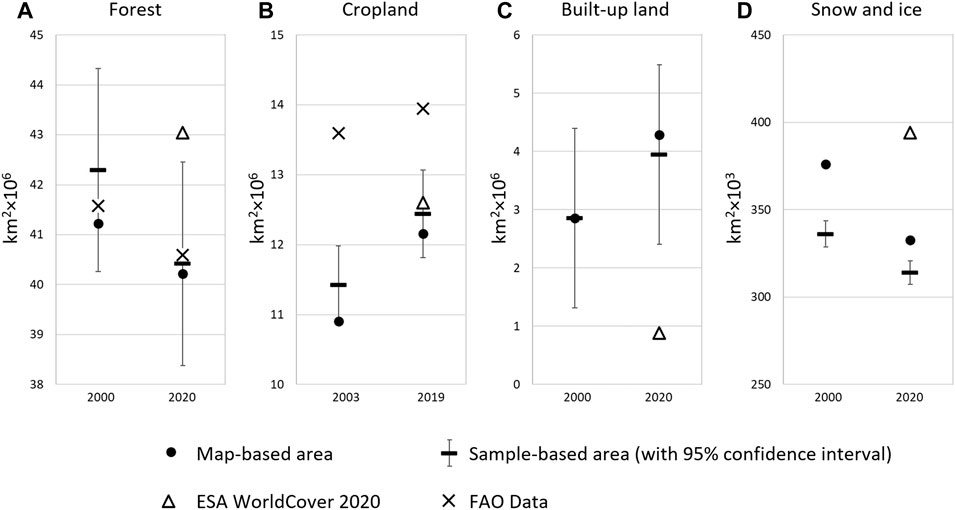
FIGURE 9. Global LCLU class areas from different data sources. (A) forest extent; (B) croplands; (C) built-up lands; (D) perennial snow and ice. Map-based estimates are from the thematic map time series and ESA WorldCover 2000. Sample-based estimates are from the reference data. FAO data represent years 2000 and 2020 forest extent (FAO, 2020) and arable land area for the years 2003 and 2018 (FAO, 2021).
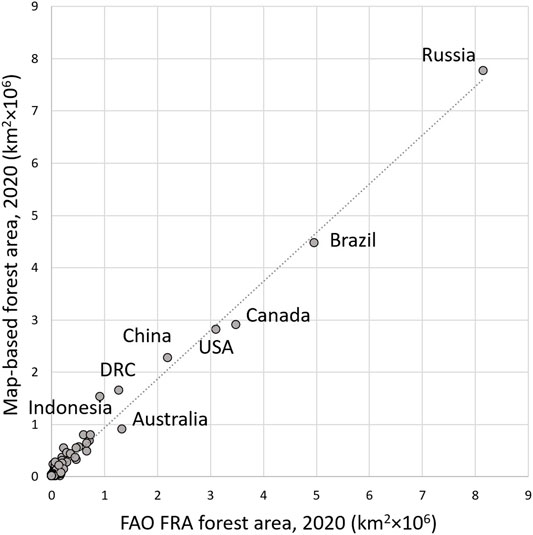
FIGURE 10. Comparison between map-based forest area estimate and FAO FRA forest area for the year 2020, by country.
The ESA WorldCover 2020 overestimates our map-based forest area and FAO FRA forest area by 7 and 6%, respectively (Figure 9A). The overestimation is driven by non-forest tundra regions in North America and East Siberia, which were classified as forests by the WorldCover map (Figure 11A). We also found that our GEDI-calibrated forest height map shows forest height ≥5 m within open canopy forests and savannas in Africa, which are attributed by the WorldCover map as shrubland. These discrepancies illustrate that the continuous forest height data may be better suited for vegetation structure, and, consequently, carbon storage assessment, as compared to discrete land cover classifications.
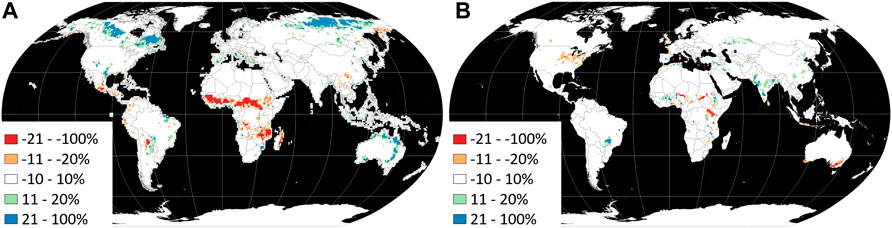
FIGURE 11. LCLU class area difference between ESA WorldCover 2020 and the year 2020 thematic map for each 1 × 1° grid cell. Blue colors represent lower estimates of the class area in our new map relative to WorldCover, and red colors–higher estimates in our map (in percent of the cell area). (A) Forest extent; (B) cropland extent.
We compared our new year 2000 forest extent map (based on the ≥5 m forest height threshold) with the forest extent map that was obtained by applying canopy cover thresholds on the tree canopy cover map for the year 2000 (Hansen et al., 2013). Our new map shows smaller forest extent in the North American forest-tundra and in dry shrubland/savanna in Brazil (where the former map overestimated tree cover), while it better detects open-canopy forests in the Sahel, Australia, and Northern Siberia. Our observations are confirmed by the year 2000 sample-based accuracy analysis (Table 7) performed using the same reference data that were used for the map validation. The user’s and producer’s accuracies for the new product are higher and more balanced compared to the accuracies of the former tree canopy cover map.
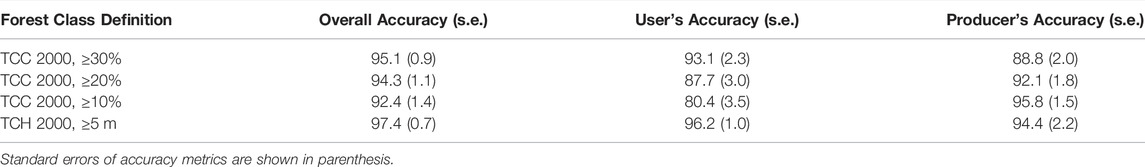
TABLE 7. Forest cover extent accuracy metrics for the forest maps generated using the tree canopy cover 2000 (Hansen et al., 2013) (TCC) and forest height 2000 (TCH) datasets.
The year 2000–2003 and 2016–2019 interval cropland maps have high quality, with both user’s and producer’s accuracies above 86% (Table 6). Our map consistently represents industrial cropland areas in North and South America, Southern Europe, and the main crop production regions of Asia. In a heterogeneous landscape, where small crop fields are intermixed with orchards, villages, and natural vegetation, the map underestimates the cropland area (Potapov et al., 2021b). Croplands were also underestimated in dryland agricultural areas, where the irregular fallow length and short growing cycle hampered crop detection. Crop overestimation was found over intensively managed, planted, and irrigated pastures in Australia, New Zealand, and Western Europe.
The cropland area change map has higher uncertainty compared to the crop extent maps, specifically, for the cropland gain class, which has relatively low user’s accuracy (Table 6). The cropland loss and gain are usually confused with stable cropland areas.
A comparison of the national 2016–2019 cropland area with the year 2018 arable land estimates published by the FAO showed good agreement (R2 of 0.98) (Potapov et al., 2021b). Our total cropland extent is lower than the FAO arable land area by 11% (Figure 9B), which is most probably due to differences in definitions: while our map only reflects the area of actively used croplands, the FAO data may include abandoned lands, meadows, pastures, long fallows, and perennial crops (See et al., 2015).
We compared our global cropland area estimates with the FAO land cover statistics for the year 2019 that is derived from multiple data sources, including MODIS Land Cover product (MCD12Q1), Catholic University of Louvain Geomatics land cover (CCILC), and Copernicus Global Land Service land cover product (CGLS) (Conchedda and Tubiello, 2021; FAO, 2021). We found that the global herbaceous crop area estimates from CCILC and CGLS are significantly higher than our 2019 cropland area, by 57 and 22%, respectively. The MODIS-based herbaceous cropland has a good agreement with our estimate with a 2% difference. The FAO land cover class area calculated as the mean of three products (1.5 ± 0.4 billion ha) is higher than our global cropland area by 27%, although our estimate is within the uncertainty interval. As stated by the authors of the FAO land cover statistics report (Conchedda and Tubiello, 2021), the FAOSTAT data should not be used for land cover change analysis due to the high uncertainty of the herbaceous crops area estimated by the moderate spatial resolution products.
The cropland areas from our map and the ESA WorldCover 2020 product are very similar (Figure 9B), with just a 4% difference in the total area. Some of the differences related to confusion between croplands and pastures (e.g., in South America and Australia) and high uncertainties of cropland mapping in drylands and in fragmented agricultural landscapes (Figure 11B).
The built-up lands class is inherently heterogeneous at the Landsat pixel scale, which impedes the accurate class mapping and reference data collection. We defined built-up lands as Landsat pixels that contains man-made constructions or surfaces, like buildings and roads. This thematic class effectively outlines the extent of human settlements, by it is not sensitive to internal settlement structure when different land covers (impervious surfaces, soil, trees, grass) are intermixed within the Landsat pixel. The reference data for the validation exercise considered the presence of man-made surfaces, even when they did not occupy most of the pixel area. Consequently, the user’s and producer’s accuracies for stable built-up class and built-up expansion are relatively low (Table 6).
Despite the low accuracies of the built-up class, the over- and underestimation rates are balanced, and the total map-based class area is within the 95% confidence interval of the sample-based estimate (Figure 9C). This is because we employed sample data to select the best class probability threshold to create the final map products.
Our year 2020 built-up lands area is nearly five times higher than the ESA WorldCover 2020 built-up class area due to definition differences. (Figure 9C) The WorldCover map considered only Sentinel pixels covered by buildings and roads as a built-up class. Moreover, the WorldCover map frequently assigned built-up lands within cities to “bare ground,” and the land cover within villages to the “grassland” class. Our definition relies on the presence of human-made structures and roads within a Landsat pixel even if they are not dominant land cover class. Therefore, our map includes mosaic land covers associated with settlements and industrial areas. We found that our map is complementary to the WorldCover map, which shows bare ground and impervious surfaces inside the outlines of the populated areas defined by our map.
Annual 2000 water percent has high and balanced user’s and producer’s accuracies of 92.2 and 92.8%, respectively, when thresholded at ≥50% water presence. However, mapping water dynamics is much more difficult as reflected by the accuracies of the dynamic classes (Table 8). The lower accuracies of the dynamic classes illustrate challenges of mapping water presence in landscapes where it changes rapidly and frequently, and where mapping of the proportion of surface water through time is impacted by irregular clear-sky observation frequency.
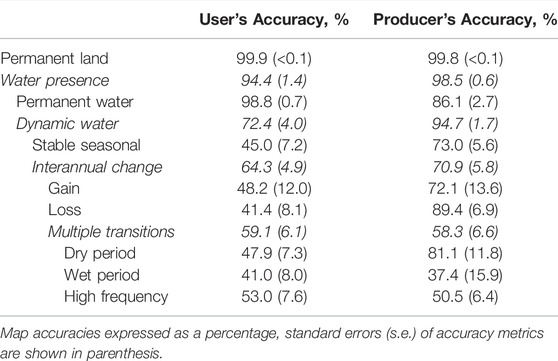
TABLE 8. Accuracies of interannual dynamics of surface water for 1999–2018, where italicized classes represent aggregations of the classes below.
The map-based areas of total area with open surface water within 1999–2018 (4.8 million km2) are within 1% of the sample-based area estimates of Pickens et al. (2020) (4.8 ± 0.8 million km2). However, the maps underestimate the proportion that is permanent water (18% smaller) and overestimate the extent with interannual and seasonal dynamics (25% larger). The largest differences are for seasonal and loss (55 and 145% larger, respectively), whereas the area with multiple interannual transitions between land and water states matched the sample mean estimate. While the map-based areas should not be used for area reporting, they can be used to assess the broad distribution of open surface water dynamics.
The snow and ice extent and dynamic maps have high producer’s accuracies (above 86%), which confirms that these maps correctly delineate the extent of glaciers and perennial snowfields (Table 6). However, the user’s accuracies for the dynamic classes are low, and the user’s accuracies for class extent maps are lower than the producer’s, which indicated the map overestimation of the class area (Figure 9D). The commission error is higher for the year 2000, thus the net snow and ice area reduction is lower based on sample data (6.6%) than using the map (11.5%). We suggest two primary reasons for these discrepancies. Some of the observed errors related to challenges with discrimination of perennial and seasonal snow cover in mountain regions with frequent cloud cover. The absence of cloud-free Landsat data during the warmest time of the year leads to perennial snow and ice class overestimation. Longer time intervals for metric selection (similar to the one used for cropland mapping) may be needed to improve map accuracy. Another reason is the low radiometric resolution of Landsat TM and ETM+ sensors, which saturates over the sunlit slopes and precluded correct snow identification on the shadow slopes.
The ESA WorldCover data shows the much larger area of persistent snow and ice than our map (Figure 9D). We suggest that using Sentinel-2 data, which lacks a thermal band, may be inadequate for detecting snowmelt events and for separation of seasonal and perennial snow cover.
The global hotspots map (Figure 12) highlights regions with the most intensive LCLUC changes over the last two decades. We selected the LCLUC categories that have the highest impact on biodiversity, climate change, food production, and quality of living. The deforestation hotspots map (Figure 12A) unequivocally highlights the Brazilian rainforests and the Chaco in Argentina, Paraguay, and Bolivia as the most threatened forest ecosystems in the world because of recent agricultural expansion. Cambodia, Mozambique, Uganda, and West African countries are also within the agriculture-driven deforestation hotspots. Outside the tropics, we found large hotspots of forest loss in the northern boreal forests in Canada, Alaska (USA), and the Republic of Sakha (Russia) related to the recent increase in fire frequency and severity (Flannigan et al., 2009). The observed decline of forest cover in the regions with cold continental climates is aligned with the predictions of large-scale vegetation change triggered by global warming (Soja et al., 2007). Forest AGC loss was the highest within tall humid tropical forests (Figure 12B), with the largest hotspots in the Amazon Basin and in Sumatra and Borneo Islands. The AGC loss hotspots highlight regions where the effect of the avoided forest conversion will have the highest impact to mitigate climate change (Griscom et al., 2017). Cropland expansion hotspots (Figure 12C) partially overlap with deforestation hotspots in South America, Africa, and Cambodia. However, most of the cropland expansion hotspots are outside forests, within shrublands, grasslands and drylands which are extensively converted into intensively managed agriculture. Most of the built-up expansion area found in South and Southeast Asia, with the largest hotspots in China, India, Turkey, and Indonesia (Figure 12D). The hotspots on other continents highlight the fastest growing urban centers such as Addis Ababa (Ethiopia), Kampala (Uganda), Lagos and Ibadan (Nigeria), Mexico City, Guatemala, Houston and Orlando (USA). In Europe, the largest built-up area hotspot is in Poland, which is related to the recent rapid development of the new logistics hubs serving European Union countries. The hotspots map derived from our global thematic LCLUC products may support prioritization research, policy development, and sustainability investments globally.
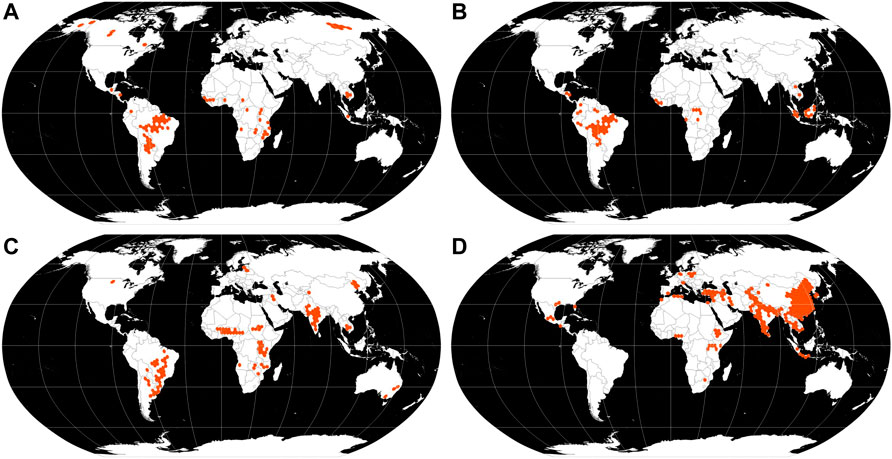
FIGURE 12. Global 2000–2020 LCLUC hotspots defined as the ISEA3H GDGGS hexagon grid cells (70,000 km2 in area) that include 50% of the respective thematic quantity of the global total. (A) Deforestation. (B) Forest AGC reduction. (C) Cropland expansion. (D) Built-up area expansion.
Our novel bitemporal LCLUC maps and sample-based analysis document dramatic changes in global land cover following land use intensification, extensification through the human appropriation of natural ecosystems, and climate change during the last two decades. Our dataset provides global LCLUC information at the locally relevant spatial resolution (30 m) suitable for national and sub-national applications. We separately mapped structure and dynamics of different LCLU classes which allows users to implement custom thematic class definitions and to analyze LCLU trajectories. Statistical sample analysis that is required for national and international LCLUC area and uncertainties reporting is supported by our globally consistent maps that enable efficient stratified sampling design.
Some of the changes that we revealed using the bitemporal maps are well known, such as the reduction of forest cover reported by the FAO FRA (FAO, 2020), while other results are novel. Using spatially explicit maps of forest height, we found disproportionally high forest area reduction in tall, high AGC forests. Consequently, we estimated that most of the net forest AGC loss (84%) is due to tall forest conversion. Our estimate of 2003–2019 cropland area gain, supported by the extensive sample analysis, is four times higher than the gain of arable land reported by the FAO for 2003–2018 (FAO, 2021). In Cambodia, we quantified cropland area increase to be 36%, while FAO reported a gain in arable land of just 5.6%. Such discrepancies should be considered when the consistency of global databases is critical, e.g., for global carbon emission assessment and for monitoring of progress towards sustainable development goals.
The global thematic maps provide insights into LCLU change trajectories. We show that net forest loss was partly driven by cropland and settlement expansion (sections 3.1.1 and 3.1.2). The reduction of perennial snow and ice (section 3.1.5) was likely caused by climate warming, which is in turn linked to carbon emissions from forest AGC reduction (section 3.1.1) and agriculture development (section 3.1.2). The changes in land management priorities resulted in cropland conversion to settlements (section 3.1.2) and flooding forests and croplands by water reservoirs.
Global LCLUC data support the development, implementation, and monitoring of national land management policies and global initiatives towards climate change mitigation and protection of natural ecosystems. Here, we will outline just a few examples of possible applications of our bitemporal maps. Spatially explicit maps highlight regions where investments in sustainable development, nature protection, and mitigation of climate change effects are most needed. Our forest change data shows that 50% of the global forest AGC reduction is due to forest clearing in just three countries, Brazil, Indonesia, and the DRC, highlighting the need for national policies combating deforestation. The overlay of our forest and cropland change data with protected areas and primary forests highlights conservation priority targets (Heino et al., 2015; Turubanova et al., 2018). Sustainable development policies are needed in regions where cropland expansion is the primary cause of natural ecosystem reduction. At the same time, cropland abandonment in Russia’s Nechernozemie region provides extensive land resources for timber plantation and forest ecosystem restoration. Our approach, which is planned to be operationally implemented moving forward, will support forest restoration monitoring. Water dynamic and perennial snow and glaciers reduction maps provide critical information on water supply change that is needed for climate change adaptation in the affected regions. The overlay of forest height and settlement extent data benefits “green” urban development.
It is well known that any thematic LCLU map derived from the satellite images has errors (Olofsson et al., 2014). Limitations of the satellite data resolutions, imperfect calibration data, and empirical model precision are the primary causes of thematic class omission and commission errors.
Landsat clear-sky data availability is the primary limitation for land cover mapping. While some of the land cover themes can be directly mapped using a single-day satellite images (e.g., surface water), others may not be directly retrieved from the optical medium resolution data and instead are predicted using empirical modeling tools that requires information on land surface phenology (such as forest height or cropland extent). The incompleteness of the Landsat observation time series decreases map accuracy in regions with persistent cloud cover. For the perennial snow and ice mapping, the availability of Landsat observations during the warmest time of the year is critical, and the absence of such observations causes class overestimation. Short revisit interval is the key requirement for future satellite missions aimed at global LULC monitoring.
A high proportion of mixed pixels at the Landsat spatial resolution is another important constraint for discrete land cover classes mapping in heterogeneous landscapes. Most LULC classes have higher map accuracy over large homogeneous areas compared to fragmented landscapes and class patch edges. Cropland maps are more accurate over industrial agriculture areas (North and South Americas) compared to fragmented rural landscapes (Europe, Asia, and Africa). Some classes, like settlements and infrastructure, mostly consist of mixed pixels and thus may be hard to map using per-pixel classifications. To overcome some of these issues, we implemented a CNN tool that considers spatial properties and distribution of objects for mapping built-up lands. Small features (fractional water, single trees, isolated houses, and narrow roads) cannot be consistently mapped globally using Landsat data and are usually omitted by global maps.
The spectral similarity between different LCLU classes may preclude class discrimination. Lava fields, dark soils and vegetation, and high turbidity are typical reasons for surface water mapping errors. Croplands may be confused with intensively managed permanent pastures as both classes have similar spectral response and phenology, which caused crop commission in Australia, New Zealand, and parts of Western Europe. Rainfed dryland agriculture is not always spectrally separable from the surrounding natural land cover, which is the reason for crop omission in the Sahel, Central Asia, and the Middle East.
Continuous structure variables, such as forests height, are the most challenging to map using medium resolution optical data. Our forest height product has issues related to GEDI data quality and Landsat data availability (Potapov et al., 2021a). The empirical tree height model saturates above 30 m and may not adequately represent the height of the tallest forest stands. The GEDI data in boreal regions are not available above 52°N, consequently, the global map may incorrectly represent the height of boreal forests, especially in the far North. Small changes in forest height between the years 2000 and 2020 may not indicate actual forest structure change but may instead represent noise in the model outputs. To mitigate this artifact, we used conservative thresholds to define forest height increase and decrease in our products (see Section 2.2.1). A direct comparison of the years 2000 and 2020 forest height products, without the application of such thresholds, will not provide consistent and meaningful results.
Dynamic classes (LCLU class loss and gain) have lower accuracies compared to static maps. The changes in Landsat data frequency and sensor radiometric resolution are primary factors for temporal inconsistencies of the LCLU maps. The change data was filtered to reduce errors, which, in turn, may result in land cover change omission.
Thematic maps provide valuable data for global LCLUC analysis. Direct map-based area estimations may be used to highlight trends and hotspots of land change and to compare areas of thematic classes and their change between regions. However, map-based estimates are not adequate for national and international reporting due to unknown spatial and temporal variability of map errors. A probability-based sample analysis is the recommended good practice approach for LCLU extent and change estimation (Olofsson et al., 2014; Stehman, 2014). The global LCLU map time series enables a higher sampling efficiency through stratification at the sub-national, national, and global scales.
The datasets presented in this study can be found in online repositories. The names of the repository/repositories and accession number(s) can be found below: https://glad.umd.edu/dataset/GLCLUC2020. The global Landsat ARD data, metric generation, image classification, data analysis, and statistical sampling codes are available from https://glad.umd.edu/ard.
PP, MH, AP, AH-S, AT, ST, VZ, X-PS, XL, and AKh developed the global LCLUC products and analyzed the reference sample data. PP, MH, AP, AT, and ST led the project and wrote the paper. FS and NH supported data analysis and presentation. AB performed sample analysis for selected thematic classes. IK and AKo provided technical support. All authors provided substantial edits and comments to the manuscript.
This study was supported by the Bezos Earth Fund, the WRI Global LCLU Monitoring Program (#G2436), the WRI Global Forest Watch (#19113040), the NASA/USGS Landsat Science Team (#140G0118C0013), the National Geographic Society (#1911309501), the Gordon and Betty Moore Foundation (#7864), the NASA SERVIR program (#80NSSC20K0158), and the NASA HARVEST program (#80NSSC18M0039).
The authors declare that the research was conducted in the absence of any commercial or financial relationships that could be construed as a potential conflict of interest.
All claims expressed in this article are solely those of the authors and do not necessarily represent those of their affiliated organizations, or those of the publisher, the editors and the reviewers. Any product that may be evaluated in this article, or claim that may be made by its manufacturer, is not guaranteed or endorsed by the publisher.
The authors would like to thank the World Resources Institute team who helped us throughout the project, including Craig Hanson, Crystal Davis, Mikaela Weisse, Liz Goldman, Elise Mazur, Sarah Carter, Katie Reytar; Quan Shen (UMD) and Jocelyn Cortez (CIIEMAD) for their help collecting cropland calibration data; Hao Tang (NUS) and John Armston (UMD) for supporting GEDI data processing; Qing Ying (TTU) and Bernard Adusei (UMD) for their help with GLAD ARD production; Andre de Lima (UMD) and Jeffrey Pickering (UMD) for providing reference data.
The Supplementary Material for this article can be found online at: https://www.frontiersin.org/articles/10.3389/frsen.2022.856903/full#supplementary-material
Brandt, M., Tucker, C. J., Kariryaa, A., Rasmussen, K., Abel, C., Small, J., et al. (2020). An Unexpectedly Large Count of Trees in the West African Sahara and Sahel. Nature. 587, 78–82. doi:10.1038/s41586-020-2824-5
Conchedda, G., and Tubiello, F. (2021). Land Cover Statistics. Global, Regional and Country Trends 2000–2019. Rome, Italy: FAO.
Curtis, P. G., Slay, C. M., Harris, N. L., Tyukavina, A., and Hansen, M. C. (2018). Classifying Drivers of Global forest Loss. Science. 361, 1108–1111. doi:10.1126/science.aau3445
DeFries, R. S., Field, C. B., Fung, I., Justice, C. O., Los, S., Matson, P. A., et al. (1995). Mapping the Land Surface for Global Atmosphere-Biosphere Models: Toward Continuous Distributions of Vegetation's Functional Properties. J. Geophys. Res. 100, 20867–20882. doi:10.1029/95JD01536
DiMiceli, C., Townshend, J., Carroll, M., and Sohlberg, R. (2021). Evolution of the Representation of Global Vegetation by Vegetation Continuous fields. Remote Sensing Environ. 254, 112271. doi:10.1016/j.rse.2020.112271
Dubayah, R., Blair, J. B., Goetz, S., Fatoyinbo, L., Hansen, M., Healey, S., et al. (2020). The Global Ecosystem Dynamics Investigation: High-Resolution Laser Ranging of the Earth's Forests and Topography. Sci. Remote Sensing 1, 100002. doi:10.1016/j.srs.2020.100002
FAO (2021). FAOSTAT. Available at: https://www.fao.org/faostat/en/#home (Accessed December 17, 2021).
Feng, W., Sui, H., Huang, W., Xu, C., and An, K. (2019). Water Body Extraction from Very High-Resolution Remote Sensing Imagery Using Deep U-Net and a Superpixel-Based Conditional Random Field Model. IEEE Geosci. Remote Sensing Lett. 16, 618–622. doi:10.1109/LGRS.2018.2879492
Flannigan, M., Stocks, B., Turetsky, M., and Wotton, M. (2009). Impacts of Climate Change on Fire Activity and Fire Management in the Circumboreal forest. Glob. Change Biol. 15, 549–560. doi:10.1111/j.1365-2486.2008.01660.x
Fritz, S., and See, L. (2008). Identifying and Quantifying Uncertainty and Spatial Disagreement in the Comparison of Global Land Cover for Different Applications. Glob. Change Biol. 14, 1057–1075. doi:10.1111/j.1365-2486.2007.01519.x
Gao, B.-c. (1996). NDWI-A Normalized Difference Water index for Remote Sensing of Vegetation Liquid Water from Space. Remote Sensing Environ. 58, 257–266. doi:10.1016/S0034-4257(96)00067-3
Griscom, B. W., Adams, J., Ellis, P. W., Houghton, R. A., Lomax, G., Miteva, D. A., et al. (2017). Natural Climate Solutions. Proc. Natl. Acad. Sci. U.S.A. 114, 11645–11650. doi:10.1073/pnas.1710465114
Hansen, M. C., DeFries, R. S., Townshend, J. R. G., Carroll, M., Dimiceli, C., and Sohlberg, R. A. (2003). Global Percent Tree Cover at a Spatial Resolution of 500 Meters: First Results of the MODIS Vegetation Continuous Fields Algorithm. Earth Interact. 7, 1–15. doi:10.1175/1087-3562(2003)007<0001:gptcaa>2.0.co;2
Hansen, M. C., Egorov, A., Roy, D. P., Potapov, P., Ju, J., Turubanova, S., et al. (2011). Continuous fields of Land Cover for the Conterminous United States Using Landsat Data: First Results from the Web-Enabled Landsat Data (WELD) Project. Remote Sensing Lett. 2, 279–288. doi:10.1080/01431161.2010.519002
Hansen, M. C., Potapov, P. V., Moore, R., Hancher, M., Turubanova, S. A., Tyukavina, A., et al. (2013). High-resolution Global Maps of 21st-century forest Cover Change. Science 342, 850–853. doi:10.1126/science.1244693
Hansen, M. C., Potapov, P. V., Pickens, A. H., Tyukavina, A., Hernandez-Serna, A., Zalles, V., et al. (2022). Global Land Use Extent and Dispersion within Natural Land Cover Using Landsat Data. Environ. Res. Lett. 17, 034050. doi:10.1088/1748-9326/ac46ec
Hartley, H. O., and Rao, J. N. K. (1962). Sampling with Unequal Probabilities and without Replacement. Ann. Math. Statist. 33, 350–374. doi:10.1214/aoms/1177704564
Heino, M., Kummu, M., Makkonen, M., Mulligan, M., Verburg, P. H., Jalava, M., et al. (2015). Forest Loss in Protected Areas and Intact forest Landscapes: a Global Analysis. Plos One 10, e0138918. doi:10.1371/journal.pone.0138918
Karra, K., Kontgis, C., Statman-Weil, Z., Mazzariello, J. C., Mathis, M., and Brumby, S. P. (2021). “Global Land Use/Land Cover with Sentinel 2 and Deep Learning,” in 2021 IEEE International Geoscience and Remote Sensing Symposium IGARSS, 4704–4707. doi:10.1109/IGARSS47720.2021.9553499
Khan, A., Hansen, M. C., Potapov, P., Adusei, B., Stehman, S. V., and Steininger, M. K. (2021). An Operational Automated Mapping Algorithm for In-Season Estimation of Wheat Area for Punjab, Pakistan. Int. J. Remote Sensing 42, 3833–3849. doi:10.1080/01431161.2021.1883200
Olofsson, P., Arévalo, P., Espejo, A. B., Green, C., Lindquist, E., McRoberts, R. E., et al. (2020). Mitigating the Effects of Omission Errors on Area and Area Change Estimates. Remote Sensing Environ. 236, 111492. doi:10.1016/j.rse.2019.111492
Olofsson, P., Foody, G. M., Herold, M., Stehman, S. V., Woodcock, C. E., and Wulder, M. A. (2014). Good Practices for Estimating Area and Assessing Accuracy of Land Change. Remote Sensing Environ. 148, 42–57. doi:10.1016/j.rse.2014.02.015
OpenStreetMap contributors (2021). Open Street Map Data. Available at: https://planet.osm.org. Available at: https://www.openstreetmap.org (Accessed December 1, 2020).
Palahí, M., Valbuena, R., Senf, C., Acil, N., Pugh, T. A. M., Sadler, J., et al. (2021). Concerns about Reported Harvests in European Forests. Nature 592, E15–E17. doi:10.1038/s41586-021-03292-x
Pickens, A. H., Hansen, M. C., Hancher, M., Stehman, S. V., Tyukavina, A., Potapov, P., et al. (2020). Mapping and Sampling to Characterize Global Inland Water Dynamics from 1999 to 2018 with Full Landsat Time-Series. Remote Sensing Environ. 243, 111792. doi:10.1016/j.rse.2020.111792
Potapov, P., Hansen, M. C., Kommareddy, I., Kommareddy, A., Turubanova, S., Pickens, A., et al. (2020). Landsat Analysis Ready Data for Global Land Cover and Land Cover Change Mapping. Remote Sensing 12, 426. doi:10.3390/rs12030426
Potapov, P., Li, X., Hernandez-Serna, A., Tyukavina, A., Hansen, M. C., Kommareddy, A., et al. (2021a). Mapping Global forest Canopy Height through Integration of GEDI and Landsat Data. Remote Sensing Environ. 253, 112165. doi:10.1016/j.rse.2020.112165
Potapov, P., Turubanova, S., Hansen, M. C., Tyukavina, A., Zalles, V., Khan, A., et al. (2021b). Global Maps of Cropland Extent and Change Show Accelerated Cropland Expansion in the Twenty-First century. Nat. Food 3, 19–28. doi:10.1038/s43016-021-00429-z
Potapov, P., Tyukavina, A., Turubanova, S., Talero, Y., Hernandez-Serna, A., Hansen, M. C., et al. (2019). Annual Continuous fields of Woody Vegetation Structure in the Lower Mekong Region from 2000‐2017 Landsat Time-Series. Remote Sensing Environ. 232, 111278. doi:10.1016/j.rse.2019.111278
Ronneberger, O., Fischer, P., and Brox, T. (2015). “U-net: Convolutional Networks for Biomedical Image Segmentation,” in Medical Image Computing and Computer-Assisted Intervention – MICCAI 2015. Editors N. Navab, J. Hornegger, W. M. Wells, and A. F. Frangi (Cham: Springer International Publishing), 234–241. doi:10.1007/978-3-319-24574-4_28
Saah, D., Tenneson, K., Poortinga, A., Nguyen, Q., Chishtie, F., Aung, K. S., et al. (2020). Primitives as Building Blocks for Constructing Land Cover Maps. Int. J. Appl. Earth Observation Geoinformation 85, 101979. doi:10.1016/j.jag.2019.101979
Sahr, K., White, D., and Kimerling, A. J. (2003). Geodesic Discrete Global Grid Systems. Cartography Geogr. Inf. Sci. 30, 121–134. doi:10.1559/152304003100011090
See, L., Fritz, S., You, L., Ramankutty, N., Herrero, M., Justice, C., et al. (2015). Improved Global Cropland Data as an Essential Ingredient for Food Security. Glob. Food Secur. 4, 37–45. doi:10.1016/j.gfs.2014.10.004
Soja, A. J., Tchebakova, N. M., French, N. H. F., Flannigan, M. D., Shugart, H. H., Stocks, B. J., et al. (2007). Climate-induced Boreal forest Change: Predictions versus Current Observations. Glob. Planet. Change 56, 274–296. doi:10.1016/j.gloplacha.2006.07.028
Song, X.-P., Hansen, M. C., Potapov, P., Adusei, B., Pickering, J., Adami, M., et al. (2021). Massive Soybean Expansion in South America since 2000 and Implications for Conservation. Nat. Sustain. 4, 784–792. doi:10.1038/s41893-021-00729-z
Spawn, S. A., Sullivan, C. C., Lark, T. J., and Gibbs, H. K. (2020). Harmonized Global Maps of above and Belowground Biomass Carbon Density in the Year 2010. Sci. Data 7, 112. doi:10.1038/s41597-020-0444-4
Stehman, S. V. (2014). Estimating Area and Map Accuracy for Stratified Random Sampling when the Strata Are Different from the Map Classes. Int. J. Remote Sensing 35, 4923–4939. doi:10.1080/01431161.2014.930207
Townshend, J. R. (1992). “Improved Global Data for Land Applications: a Proposal for a New High Resolution Data Set,” in Report of the land cover working group of IGBP-DIS. IGBP Secretariat, the Royal Swedish Academy of Science. Editor J. R. G. Townshend. Available at: https://books.google.com/books?id=L2xNAQAAIAAJ.
Tucker, C. J. (1979). Red and Photographic Infrared Linear Combinations for Monitoring Vegetation. Remote Sensing Environ. 8, 127–150. doi:10.1016/0034-4257(79)90013-0
Turubanova, S., Potapov, P. V., Tyukavina, A., and Hansen, M. C. (2018). Ongoing Primary forest Loss in Brazil, Democratic Republic of the Congo, and Indonesia. Environ. Res. Lett. 13, 074028. doi:10.1088/1748-9326/aacd1c
Tyukavina, A., Baccini, A., Hansen, M. C., Potapov, P. V., Stehman, S. V., Houghton, R. A., et al. (2015). Aboveground Carbon Loss in Natural and Managed Tropical Forests from 2000 to 2012. Environ. Res. Lett. 10, 074002. doi:10.1088/1748-9326/10/7/074002
Tyukavina, A., Hansen, M. C., Potapov, P., Parker, D., Okpa, C., Stehman, S. V., et al. (2018). Congo Basin forest Loss Dominated by Increasing Smallholder Clearing. Sci. Adv. 4, eaat2993. doi:10.1126/sciadv.aat2993
Tyukavina, A., Hansen, M. C., Potapov, P. V., Stehman, S. V., Smith-Rodriguez, K., Okpa, C., et al. (2017). Types and Rates of forest Disturbance in Brazilian Legal Amazon, 2000-2013. Sci. Adv. 3, e1601047. doi:10.1126/sciadv.1601047
Wulder, M. A., Masek, J. G., Cohen, W. B., Loveland, T. R., and Woodcock, C. E. (2012). Opening the Archive: How Free Data Has Enabled the Science and Monitoring Promise of Landsat. Remote Sensing Environ. 122, 2–10. doi:10.1016/j.rse.2012.01.010
Ying, Q., Hansen, M. C., Potapov, P. V., Tyukavina, A., Wang, L., Stehman, S. V., et al. (2017). Global Bare Ground Gain from 2000 to 2012 Using Landsat Imagery. Remote Sensing Environ. 194, 161–176. doi:10.1016/j.rse.2017.03.022
Zalles, V., Hansen, M. C., Potapov, P. V., Parker, D., Stehman, S. V., Pickens, A. H., et al. (2021). Rapid Expansion of Human Impact on Natural Land in South America since 1985. Sci. Adv. 7, eabg1620. doi:10.1126/sciadv.abg1620
Keywords: land cover, land use, Landsat, forest, cropland, urbanization, snow cover, surface water
Citation: Potapov P, Hansen MC, Pickens A, Hernandez-Serna A, Tyukavina A, Turubanova S, Zalles V, Li X, Khan A, Stolle F, Harris N, Song X-, Baggett A, Kommareddy I and Kommareddy A (2022) The Global 2000-2020 Land Cover and Land Use Change Dataset Derived From the Landsat Archive: First Results. Front. Remote Sens. 3:856903. doi: 10.3389/frsen.2022.856903
Received: 17 January 2022; Accepted: 01 March 2022;
Published: 13 April 2022.
Edited by:
Eric Vermote, National Aeronautics and Space Administration (NASA), United StatesReviewed by:
Tom Loveland, United States Geological Survey (USGS), United StatesCopyright © 2022 Potapov, Hansen, Pickens, Hernandez-Serna, Tyukavina, Turubanova, Zalles, Li, Khan, Stolle, Harris, Song, Baggett, Kommareddy and Kommareddy. This is an open-access article distributed under the terms of the Creative Commons Attribution License (CC BY). The use, distribution or reproduction in other forums is permitted, provided the original author(s) and the copyright owner(s) are credited and that the original publication in this journal is cited, in accordance with accepted academic practice. No use, distribution or reproduction is permitted which does not comply with these terms.
*Correspondence: Peter Potapov, cG90YXBvdkB1bWQuZWR1
Disclaimer: All claims expressed in this article are solely those of the authors and do not necessarily represent those of their affiliated organizations, or those of the publisher, the editors and the reviewers. Any product that may be evaluated in this article or claim that may be made by its manufacturer is not guaranteed or endorsed by the publisher.
Research integrity at Frontiers
Learn more about the work of our research integrity team to safeguard the quality of each article we publish.