 Franck Auguste
 Jean-Pierre Chaboureau
- Laboratoire d’Aérologie (LAERO), Université de Toulouse, CNRS, UPS, Toulouse, France
Probing the atmosphere from space using radiometers is a challenging way to improve our knowledge of deep convection. Exploration of water absorption bands in the 183, 325, and 448 GHz range is promising because of the radiation scattered by icy hydrometeors produced by deep convection. We investigate what properties of deep convection could be inferred from the Convective Core Observations through MicrOwave Derivatives in the trOpics (C2OMODO) concept of a tandem of microwave radiometers separated by several tens of seconds. Two tropical deep convective events (Hector the Convector and a radiative-convective equilibrium case) are simulated with the Meso-NH non-hydrostatic numerical model, the outputs of which are used to compute brightness temperatures (Tbs) using the Radiative Transfer for the Television and Infrared Observation Satellite (TIROS) Operational Vertical Sounder (RTTOV) code. We find different relationships between the ice water path, vertical ice momentum, vertical ice velocity, and the time derivative dTb/dt. They depend on where they are probed after separating the growing convective cores from their surrounding environment with a radiometric point of view. Tb and dTb/dt are highly dependent on the ice water path that depends on horizontal and vertical ice advection and microphysical processes. Looking at deep convection in general, we find that the ice water path increases linearly with decreasing dTb/dt. In the specific case of the core of growing convective cells, the vertical ice momentum and the vertical ice velocity are related to dTb/dt. However, such a relationship breaks down in the anvil because horizontal ice advection can dominate microphysical processes. These results are robust to horizontal resolution and time delay.
1 Introduction
Deep convection is a key driver of weather and climate. In particular, deep convective updrafts transport momentum, mass, water, and other gases from the surface to the upper troposphere and stratosphere and downdrafts from the upper to the lower atmosphere. Our knowledge of vertical convective motions remains partial in part because of the lack of frequent observations at the global scale. Among the wide range of space-based instruments, passive microwave radiometers operating at high microwave (MW) frequencies are particularly interesting for the observation of deep convection because of the high sensitivity of the measured signal due to the scattering by icy hydrometeors (while the absorption by ice is very low). Another advantage is their large swath allowing polar orbiting radiometers to scan almost the whole planet in 12 h. For example, the microwave signal at 183 GHz is used to retrieve the ice water path (IWP) (Gong and Wu, 2014; Rysman et al., 2021) and to assess deep convection predicted by models (Rysman et al., 2016). Measuring a microwave signal above deep convective systems at an interval of several tens of seconds would therefore allow us to retrieve not only IWP but also its time derivative dIWP/dt. It might be also possible to deduce information about the vertical velocity inside deep convective systems.
The Convective Core Observations through MicrOwave Derivatives in the trOpics (C2OMODO) concept (Brogniez et al., 2022) aims at measuring microwave signal at short time intervals (less than 3 min) using a train of passive microwave radiometers aboard low-orbit satellites. Its main objective is to infer the vertical air motion in deep convection. Inferring this information would be very valuable as it would provide an observational constraint that is currently lacking. As shown in an intercomparison study of an intense mesoscale convective system (Varble et al., 2014), vertical velocity is one of the meteorological variables from which cloud-resolving models can strongly diverge. At the time of writing this article, neither radiometers of the C2OMODO concept nor their swathes have yet been designed. However, it is expected that these radiometers will measure several strong water vapor absorbing lines in the MW. The most likely option is to have two bands at 183 and 325 GHz with a pixel resolution of 5 and 3 km at nadir, respectively, while another option would be to add the 448 GHz band to the other two bands.
The objective of this study is to explore the content of information of the C2OMODO concept in order to characterize tropical deep convective cells. The approach consists in using an explicit model of high-resolution atmospheric convection combined with a radiative transfer code in order to simulate, on the one hand, a multispectral high-frequency imaging in the microwaves and, on the other hand, the imaging difference at different time intervals to explore the contribution of the flight in close formation of two radiometers. In the first step, the microwave brightness temperature (Tb) response to deep convection is examined at the simulation scale to describe the relationships of the Tb response with the dynamic and microphysical fields of the model that may exist. In the second step, the sensitivity of the results to temporal and spatial resolutions is examined.
Section 2 describes the model and the data set of two simulations and defines the geophysical and satellite variables. Section 3 presents the relationships between the ice water path and Tbs for specific frequencies. Section 4 analyzes the relationships between geophysical and satellite variables for 10 convective cells in the growth phase in an environment free of icy hydrometeors. Section 5 explores the robustness of these relationships over the full data set. Section 6 presents the conclusions and gives some perspectives.
2 Model and Method
2.1 Meso-NH and Variable Definitions
The simulations are run with the anelastic non-hydrostatic mesoscale model Meso-NH (Lac et al., 2018) developed by Meteo-France and Laboratoire d’Aerologie for research purposes (see http://mesonh.aero.obs-mip.fr/). The model has been widely used to investigate cloud and precipitation properties using satellite observations (e.g., Chaboureau et al., 2000; Wiedner et al., 2004; Meirold-Mautner et al., 2007; Chaboureau et al., 2008; Rysman et al., 2016). Momentum variables are advected with a centered fourth-order scheme, while scalar variables are advected with the piecewise parabolic method advection scheme (Colella and Woodward, 1984). Meso-NH includes the Surface Externalisée (SURFEX) scheme for surface fluxes (Masson et al., 2013), 1.5-order closure scheme for turbulence (Cuxart et al., 2000), parameterization of dry thermals and shallow cumuli (Pergaud et al., 2009), two-stream scheme of Fouquart and Bonnel (1986) for shortwave radiation, and rapid radiative transfer model (Mlawer et al., 1997) for longwave radiation.
Mixed-phase clouds are parameterized using the bulk microphysics scheme of Pinty and Jabouille (1998). It follows the evolution of six water species including vapor, liquid cloud, and rain and three icy species which are cloud ice, snow, and graupel defined by increasing degree of riming. If we consider the total ice content, that is, the sum of cloud ice, snow, and graupel, the local conservation of the ice mixing ratio rice can be written as follows:
where ρ is the air density,
The vertical integration of Eq. 1 allows us to define several column-average variables. The ice water path (IWP) is the vertical integral of ρrice, the surface horizontal ice momentum (HIM) is that of the horizontal component of ρriceu, and the surface vertical ice momentum (VIM) is that of its vertical component. Since the vertical integration of the vertical flux divergence is zero, it reads as follows:
where the subscript μ refers to the microphysical changes (phase transformation and sedimentation) of IWP. The time tendency of IWP due to the microphysical changes is diagnosed as the residual after subtracting the ice advection terms from the time tendency of IWP. Note that, the contribution of ice sedimentation to Eq. 2 is small in the core of growing convective cells. The anelastic framework operating in Meso-NH states is ∇.(ρ u) = 0. Consequently, the divergence of the ice flux is approximated as the sum of the horizontal IADVh and vertical IADVv ice advections, which are defined as the horizontal and vertical components of the vertical integration of u∇(ρrI). In addition, we define wice, the vertical ice velocity, as VIM divided by IWP.
2.2 Simulations
Two simulations were carried out at the convective scale using Meso-NH. One simulation considers Hector the Convector (HEC) over the Tiwi Islands, while the other is a radiative-convective equilibrium (RCE) ocean case. HEC was run for 6 h over a domain of 256 × 200 km2 with 1-km horizontal grid spacing. The model top is at 30 km with 146 vertical levels spaced between 60 and 200 m below 22 km. The initial conditions are the same as those defined by Dauhut et al. (2015), which are based on the radiosonde launched from Darwin, Australia, at 0000 UTC 30 November 2005. Because of the relatively high horizontal resolution of 1 km, the parameterization of dry thermals and shallow cumuli was not used. RCE corresponds to four periods of 15 min taken from the configuration with a large domain (RCE_large) of the Radiative-Convective Equilibrium Model Intercomparison Project (RCEMIP) (Wing et al., 2020) using a sea surface temperature of 300 K. The domain is a grid of 384 × 6000 km2 with a horizontal resolution of 3 km. The model top is at 31 km with 76 vertical levels spaced 500 m apart above 3 km.
Brightness temperatures (Tbs) were computed in-line every 30 s using the Radiative Transfer for the Television and Infrared Observation Satellite (TIROS) Operational Vertical Sounder (RTTOV) code, version 12.3 (Saunders et al., 2018). The interface with RTTOV has been written and included in the Meso-NH code itself (Chaboureau et al., 2008). This allows the creation of satellite images during the simulation, at each time step of the model if needed. For microwave instruments at all frequencies below 1000 GHz, the atmospheric gas absorption model of RTTOV derives its spectroscopic parameters from the millimeter wave propagation model of Liebe et al. (1989) updated for the oxygen, ozone, and water vapor lines (see Saunders et al., 2018 for more details). Under clear skies, the accuracy of RTTOV is much better than the noise of current MW radiometer instruments (e.g., the error with a line-by-line reference is 0.04 K at 183 GHz). The Mie tables were created with rttov-scatt from the RTTOV package. Scattering properties are described for rain, cloudy liquid water, and ice using the Mie theory. The permittivity formulation of Rosenkranz (2015) is used for spheres composed of liquid water and that of Matzler and Wegmuller (1987) for cloud ice. The latter is assumed to be composed of a mixture of air and ice making its density equal to 900 kg m−3. Their particle size distribution follows a Marshall–Palmer shape for rain and a modified gamma shape for cloud liquid water and ice. Snow and graupel are represented as snowflake sector [with crystal type 9 in the database of Liu (2008) in which the ice portion of the particle is made of pure ice with a density of 916 kg m−3] using the discrete dipole approximation and the tropical version of size distribution of Field et al. (2007). This led to generate a Tb at nadir sight for three sets of 50 channels of bandwidth b = 200 MHz. From the three frequencies of rotational water vapor lines at f0 = 183.3, 325.1, and 448.0 GHz, each channel n covers 10 GHz with a flat spectral response between the frequencies f0 + (n − 1) × b and f0 + n × b.
3 Relationship Between IWP and Tb
A first overview of the database is shown with the temperature and water content profiles (Figure 1). The temperature decay in the upper troposphere is similar in the two cases with little variation around the median profile. Up to 14-km altitude, the air is a few Kelvin warmer in HEC than in RCE. Thus, the freezing level is 4.5 km for HEC and 4 km for RCE. In the lower and middle troposphere, the water vapor content is higher in HEC than in RCE up to a difference of 5 g kg−1 at the surface. The variability around the median profile is lower in HEC than in RCE. This is explained by the configuration of the simulations. HEC simulates a convective system initiated from a single atmospheric profile, while RCE simulates organized thunderstorm systems surrounded by large-scale subsidence zones. Due to more vigorous convection, the hydrometeor profiles have larger median and 90 percentile values for HEC than for RCE, while the icy hydrometeors are at a higher altitude. The lower freezing level elevation in RCE shifts the minimum icy hydrometeor altitude and the maximum rain altitude downward by 0.5 km.
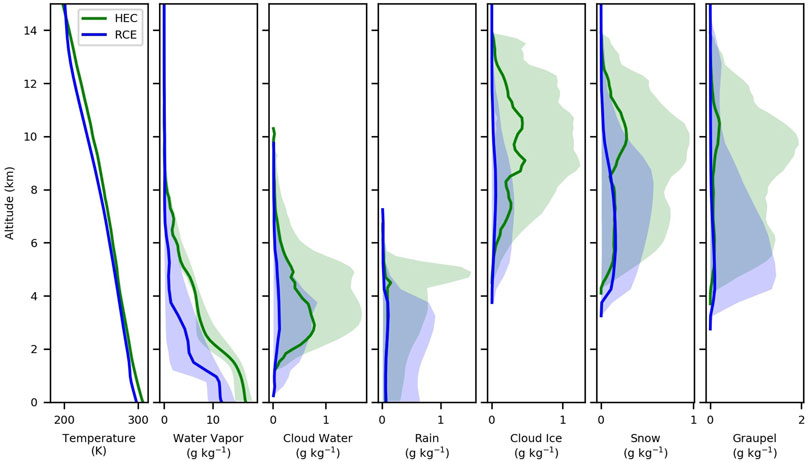
FIGURE 1. Profiles of (from left to right) temperature, water vapor, cloud water, rain, cloud ice, snow, and graupel mixing ratios. The median (bold lines) and the 10–90 percentile ranges (shadings) are shown for HEC (green) and RCE (blue).
An example of the relationship that can be obtained between IWP and Tbs is shown for the Tb depression due to ice (Figure 2). The Tb depression is usually obtained by subtracting the calculated Tb omitting the ice contribution from the full Tb. This would require calculating Tb twice and would generate a very large data set. Instead, we take advantage of the Tbs calculated every 30 s and search for the closest Tb in time and space for which IWP is near zero (less than 10–6 kg m−2). More precisely, smoothing is applied on three points in time (1 min 30 s) and space (3 km for HEC and 9 km for RCE) to limit the small-size variations of the atmosphere variability.
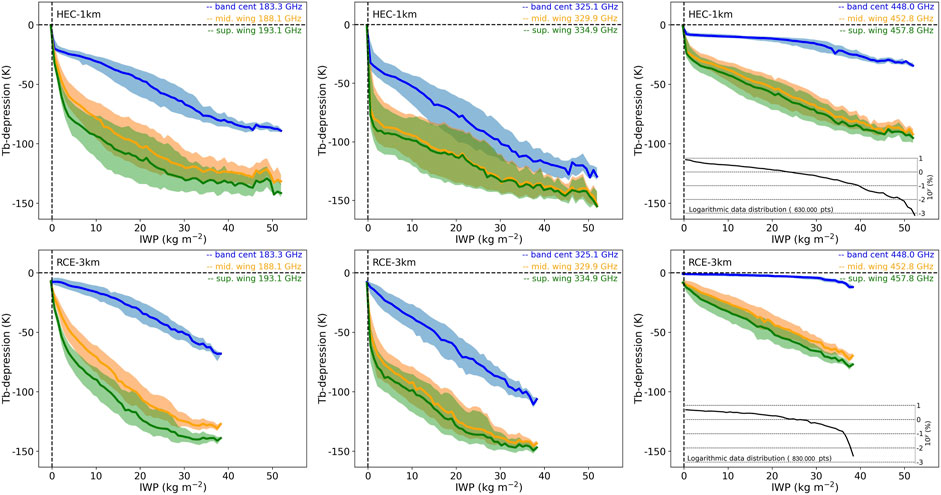
FIGURE 2. Tb depression as a function of IWP for (top) HEC and (bottom) RCE and for (from left to right) 183.3, 325.1, and 448.0 GHz bands. The median (bold lines) and the interquartile ranges (shadings) are shown for the band center (blue), the mid-wing (+5 GHz, orange), and the wing (+10 GHz, green) of the upper band. In the right column, the insert shows the data distribution in logarithmic scale.
As expected for ice scattering, the Tb depression decreases with increasing IWP regardless of frequency and case. The farther the frequency is from the center of the band, the larger the Tb depression. This is due to the low water vapor opacity of the mid-wing and wing channels making them more sensitive to ice content. This results in the Tb-depression minimum to be around −150 K or less. For the channels at band center, the Tb-depression minimum is much smaller, around −80 K for 183.3 GHz, −120 K for 325.1 GHz, and −30 K for 448.0 GHz.
About one per thousand columns has IWP larger than 30 kg m−2 in both simulations. The maximum IWP is greater than 50 kg m−2 in HEC, while it does not exceed 40 kg m−2 in RCE. This is due to more intense deep convection in HEC due to strong forcing by the surface fluxes over land. For IWPs larger than 40 kg m−2, the slope of the Tb depression with increasing IWP is close to zero for the 183 and 325 GHz bands but remains constant for the 448 GHz band. This suggests that only the 448 GHz band could be used to infer the largest IWP values because its greater water vapor opacity reduces the impact of scattering at the lowest altitudes. Between 5 and 40 kg m−2, the slope is steeper for RCE than for HEC. Since the freezing level located at about 4 km for RCE and around 4.5 km for HEC, the ice content is more likely distributed over a wide range of altitudes for RCE than for HEC. This results in a greater sensitivity of the Tb depression to IWP.
Another way to provide a general view of the relation between IWP and Tbs is shown for the Tb difference between the band center and the wing of the upper band and the mid-wing and the wing (Figure 3). Such Tb differences at 183 GHz have been widely used to detect deep convection (Funatsu et al., 2007; Rysman et al., 2016).
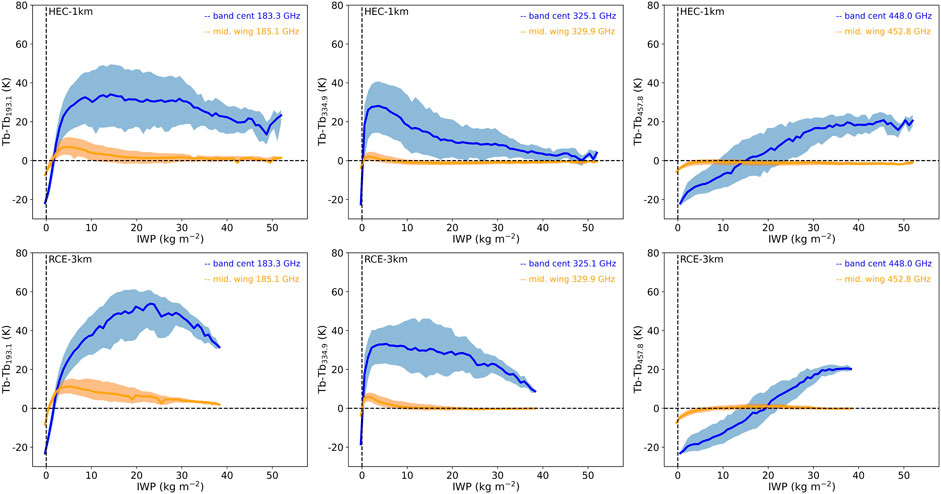
FIGURE 3. Same as Figure 2 but for the Tb difference between the band center and the wing (Tbcenter − Tb+10GHz, blue), the mid-wing and the wing (Tb+5GHz − Tb+10GHz, orange).
Regardless of the band, the Tb difference between the band center and the wing is the largest (except for the 448 GHz band when IWP is less than 15–20 kg m−2). It increases with IWP, at least for small IWP values. For larger IWP values, this increase is no longer valid. The threshold at which the increase stops differs from the band. It varies between 5 and 20 kg m−2 at 183 GHz, around 1–2 kg m−2 at 325 GHz, and 30 kg m−2 at 448 GHz. While the Tb difference decreases even at 183 and 325 GHz, a monotonic function between IWP and the Tb difference is found at 448 GHz. This again suggests the usefulness of this band for inferring IWP over a wide range.
For the 325 and 448 GHz bands, the Tb difference between the mid-wing and the wing show too little sensitivity to the change in IWP. This makes this Tb difference irrelevant for detecting deep convection. For the 183 GHz band, it varies from 5 to 10 K as the IWP increases from 0 to about 5 kg m−2. However, it is much smaller than the 40 K increase for the Tb difference between the band center and the wing. As a result, the condition of an IWP larger than 1 kg m−2 is satisfied when the Tb difference between the band center and the wing of the upper band is larger than −5 K at 183 GHz, + 5 K at 325 GHz, and −25 K at 448 GHz. In the following, we used these thresholds to detect deep convection for each band (it is expected that each band will have a different pixel size).
4 Tb and Delta-Tb Evolution due to the Growth of Single Cells
The relationship between geophysical and satellite variables is studied in the simple framework of convective cells in the growing phase. The selection of these cells is first presented, followed by the Tb response to convective growth for a single cell, and finally the Tb response for all selected cells.
4.1 Selection of Convective Cells in the Growing Phase
Selection of convective cells in the growing phase is made based on three criteria. First, the cell must be single in order to distinguish its core from its anvil environment. Second, the cell must be isolated to avoid any IWP change due to another cell in its vicinity. Third, the cell must be characterized by a monotonic increase of IWP and its cloud top during the selected window time to facilitate the interpretation of the change in Tb with time. In this study, an icy cloud is defined at a rice threshold value of 10−4 kg kg−1. This results in a selection of 10 convective cells (CCs). They are classified and named according to their simulation origin and their increase in cloud tops, that is, from CC-A to CC-D for RCE and from CC-E to CC-J for HEC (Table 1). Their duration varies from 7 to 14 min during which their cloud top increases from 6 to 9 km to reach an altitude between 9 and 15 km. Their increase in IWP varies greatly with the convective cell, from 10 kg m−2 for CC-E to 30 kg m−2 for CC-J. The decrease in Tb is also highly variable with the convective cell and the band center frequency. It presents a maximum of −1 K at 448.0 GHz for CC-A and CC-E and a minimum of −80 K at 325.1 GHz for CC-J.
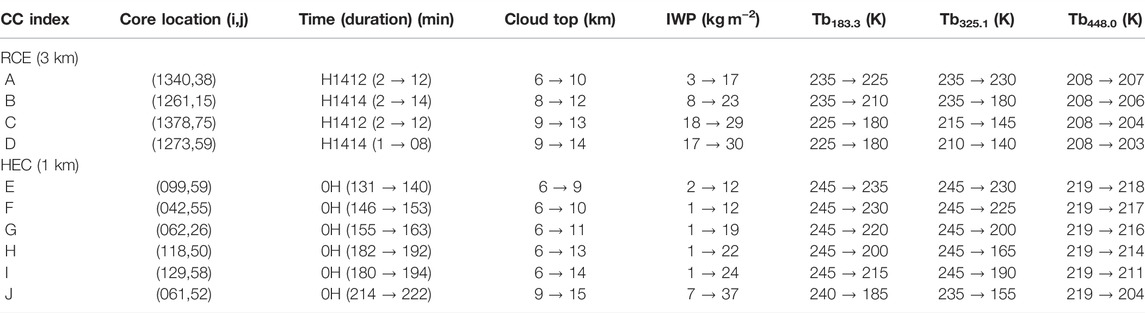
TABLE 1. Overview of the convective cells in the growing phase selected in RCE and HEC.
4.2 Icy Cloud Dynamic and Radiometric Response for a Growing Convective Cell
An example of the growth of a convective cell is analyzed for CC-H. CC-H grows for 10 min to reach an IWP of 22 kg m−2 and a cloud top of 13 km (Table 1). The cell is shown at four time steps spaced 2 min apart on a horizontal cross section of 6 × 6 km2 (Figure 4). This is a single, isolated cell consisting of a core where the IWP is maximum and an anvil with non-zero IWP values in the dozen, or so, grid points around it.
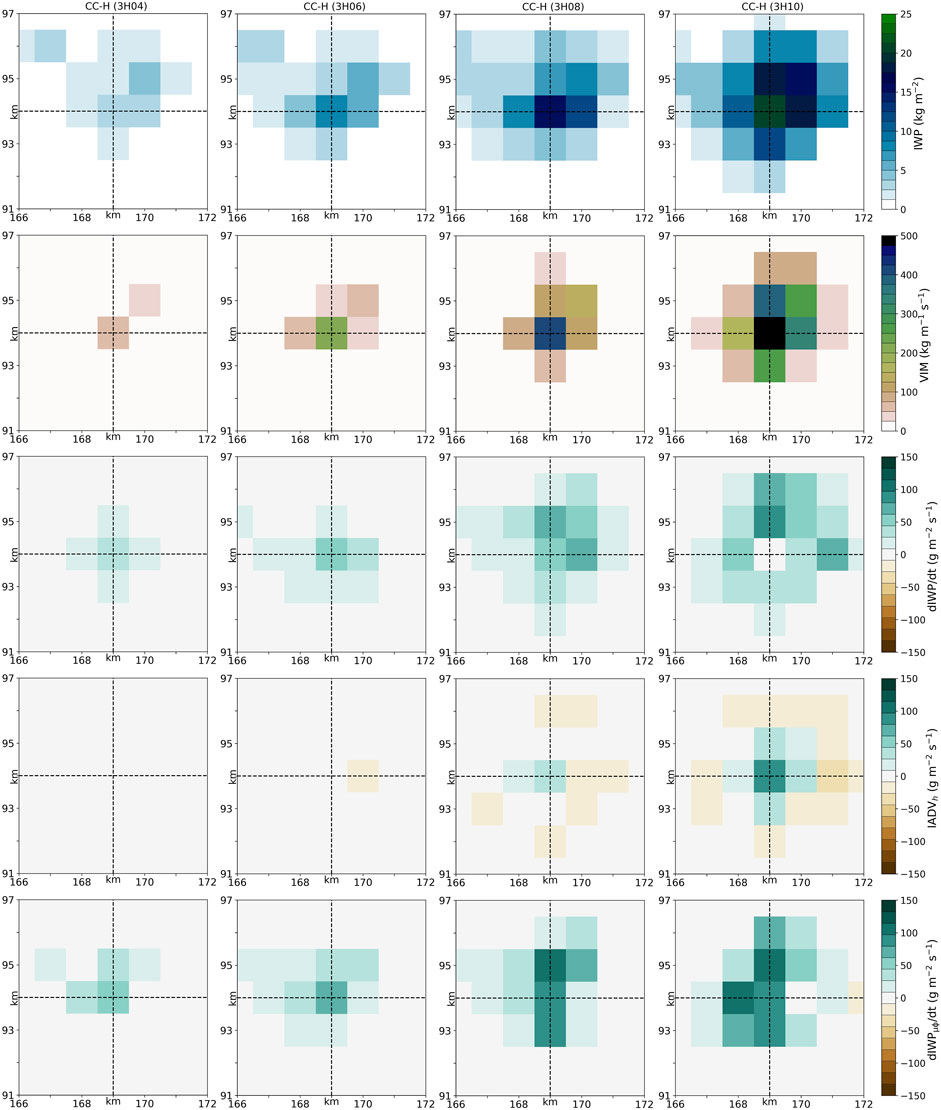
FIGURE 4. Horizontal cross section of IWP, VIM, dIWP/dt, IADVh, and dIWPμϕ/dt (from top to bottom) at four times spaced 2-min apart (from left to right) during the growth of CC-H (HEC simulation). The crossing of the dashed lines locates the core of CC-H.
During this 8-min interval, the convective core is characterized by an increase in IWP from 1 to 22 kg m−2 and VIM from 100 to 500 kg m−1 s−1. Around the core, IWP also increases with time as the convective core supplies ice to its surrounding environment by advection (top detrainment) and, to a lesser extent, by mixing (turbulent processes). When the increase in IWP is combined with positive values of vertical velocity in the surrounding environment of the core, the result is an increase in VIM but with lower values than in the core.
The evolution in IWP is further examined by showing dIWP/dt and the two dominant terms governing its change in Eq. 2 using a 1-min interval. The growing cell is characterized by a positive dIWP/dt. This is mainly due to the ice production during the first two time steps, as shown in the microphysical term. This corresponds approximately to the location where VIM is positive. At the two last time steps, IADVh shows positive values at the core and negative around it. In other words, part of IWP is detrained from the core to the anvil. So the surrounding environment of the core is mainly controlled by horizontal advection of ice. As a consequence, inferring VIM or any other variable related to the vertical air velocity from observations sensitive to IWP variation would be very challenging in the surrounding environment of a convective core. It is therefore necessary to distinguish the core from its surroundings.
In the core, IADVh remains small at 3h08 compared to the microphysical term. The change in dIWP/dt is still controlled by this term, in agreement with the large value of VIM. At 3h10, the detrainment of ice is so strong that it is counterbalanced by the microphysical production of ice, while dIWP/dt takes a smaller value. This suggests that it is possible to infer VIM from measurements sensitive to dIWP/dt in the convective core when it produces more ice than it detrains. This requires characterizing the development of the core.
The radiometric response during the convective growth is shown with the time evolution of Tb183.3, Tb325.1, and Tb457.8 (Figure 5). The channels shown here are have the largest sensitivity to IWP, as discussed in Section 3. They are in the band center for the 183 and 325 GHz bands and in the wing for the 448 GHz band. In addition, the green solid line shows the area where deep convection is detected using the band-depending criterion defined in Section 3, while the green dashed line shows the convective core area detected using another band-depending criterion. The radiometric response during the convective growth is shown at the simulation scale (here, 1 km) to study the Tb response to the change in IWP and dIWP/dt.
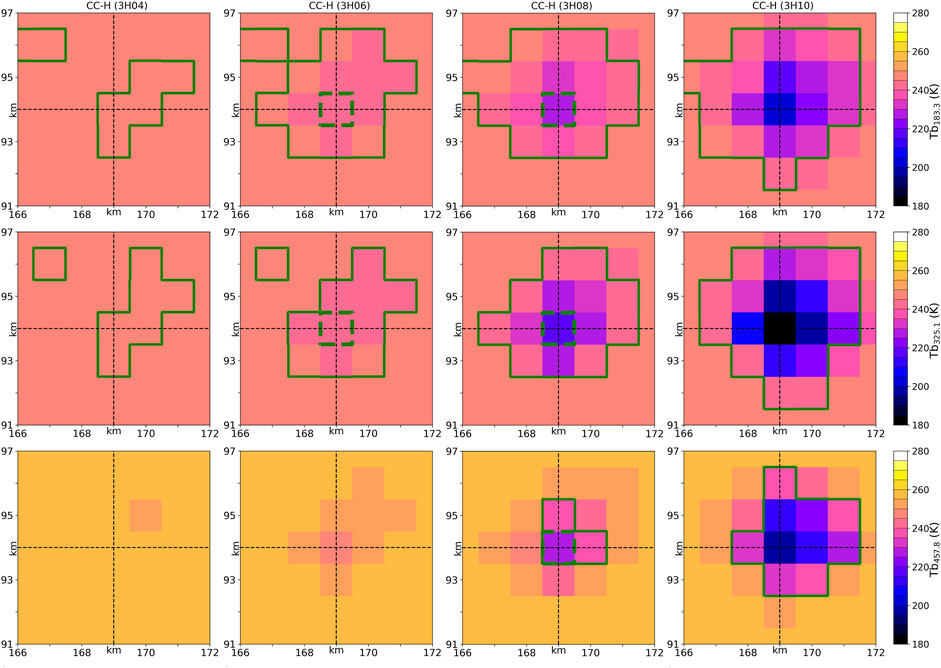
FIGURE 5. same as in Figure 4 but for Tb at 183.3, 325.1, and 457.8 GHz. The green solid line shows the boundary where the deep convection criterion is satisfied and the dashed line where the growing convective core criterion is satisfied.
Regardless of the band and the time, each Tb image is characterized by minimum and larger values around. As expected from the effect of microwave scattering by ice, the Tb minimum is found at the location of the IWP maximum. Except at 3h04, it is located at the core center. The decrease of Tb with respect to the highest value outside the core is between −50 K and −90 K depending on the band, with the lowest value for the 325.1 GHz channel. Since this decrease is due to the ice scattering effect, the size of the area where Tb changes is similar to that encompassed by the IWP (Figure 4).
The area size where Tb changes is larger for the 325.1 GHz channel than for the 183.3 GHz channel. This can be explained by a combination of two effects. First, the scattering of Tb by the small ice is stronger at higher frequencies. Second, the dominant process in horizontal ice advection is detrainment at the top of the cloud where the small ice portion is important in the solid–water composition (anvil formation). This explanation does not apply to the 457.8 GHz channel. Indeed, a wing channel, here for the 448 GHz band, has a low sensitivity for Tb to the change of water vapor, thus ice.
A requirement for inferring VIM from satellite observations is to locate the growing convective core using Tbs. In the geophysical space, the criterion for a growing convective core is the co-location of the largest IWP and the largest dIWP/dt. In the radiometric space, it results in the co-location of the lowest Tb and the lowest dTb/dt (green dashed line in Figure 5). The combination of these two conditions leads to a growing convective core correctly found at 3h06 and 3h08 for CC-H in the center of the image. At 3h10, the convective core is no longer growing. Therefore, the location of the lowest Tb differs from the location of the lowest dTb/dt.
The relationship between geophysical and radiometric variables is examined for CC-H during its entire growth from 3h02 to 3h12 using scatter plots for the three selected channels (Figure 6). The color code shows the horizontal distance to the core.
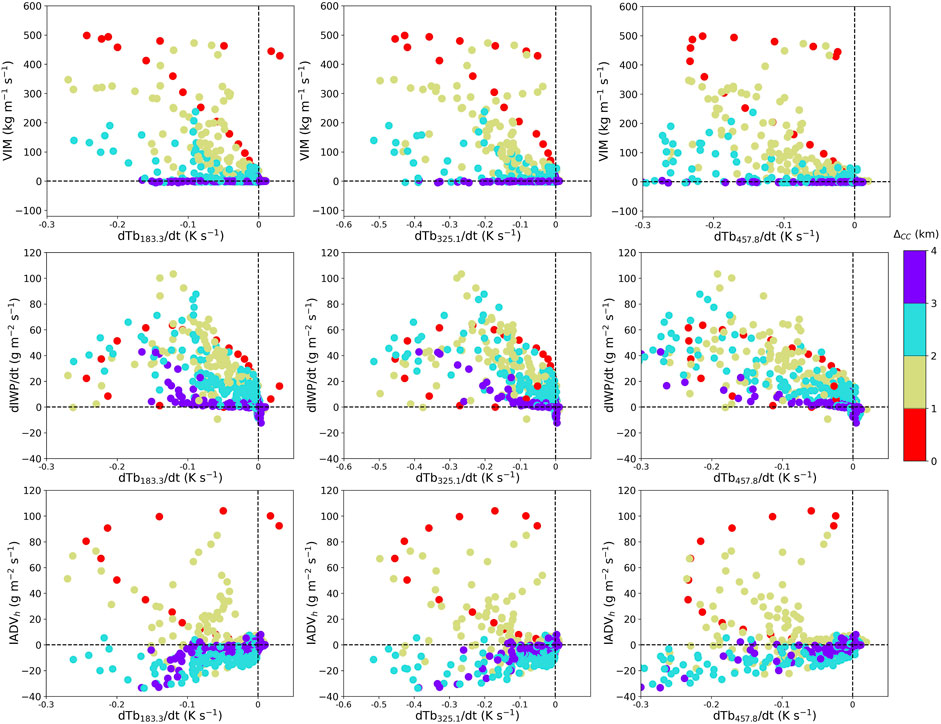
FIGURE 6. Scatter plot of VIM, dIWP/dt, and IADVh(from top to bottom) vs. dTb/dt using a 1-min interval for the 183.3, 325.1, and 457.8 GHz channels (from left to right) for CC-H (3h02 to 3h12). The color code indicates the horizontal distance to the convective core.
In the core, VIM increases with decreasing dTb/dt up to a value close to 500 kg m−1 s−1 whatever the channel. The same is true for dIWP/dt up to 60 g m−2 s−1. This growth phase is characterized by dIWP/dt values higher than that of IADVh. Once VIM reaches 500 kg m−1 s−1 (at 3h10 as shown in Figure 5), the growth rate of IWP is reduced to values well below IADVh. The relationship between VIM and dTb/dt breaks down: VIM no longer varies with dTb/dt.
In the anvil, the relation between dTb/dt and the geophysical variables depends on the distance to the core. Many grid points closest to the core (in the greenish color) show values of VIM and dIWP/dt as large as in the core. This suggests that the core could be defined in more than one grid point. Further away from the core, VIM remains below 200 kg m−1 s−1 at two grid points and even close to zero at three grid points. In other words, negative values of dTb/dt can correspond to zero VIM. If dIWP/dt can have high values as in the core, it is partly due to ice advection as shown by the negative values of IADVh. Note that, regardless of the process affecting IWP, the scatter plots show an increase in dIWP/dt with decreasing dTb/dt.
4.3 Tb Response to Ice Change for Convective Cells in the Growing Phase
The Tb response to ice change for the three selected channels is shown for all selected convective cells in HEC and RCE (Figure 7). The core and surrounding grid points are examined, that is, a total of 5 × 5 grid points. Because of different grid spacing, the area covers 25 km2 for HEC and 225 km2 for RCE. This makes the implicit assumption that the response of Tb to ice change varies independently of resolution. The points are shaded according to their distance to the core, with color when the growing convective core criterion is satisfied, with grey otherwise.
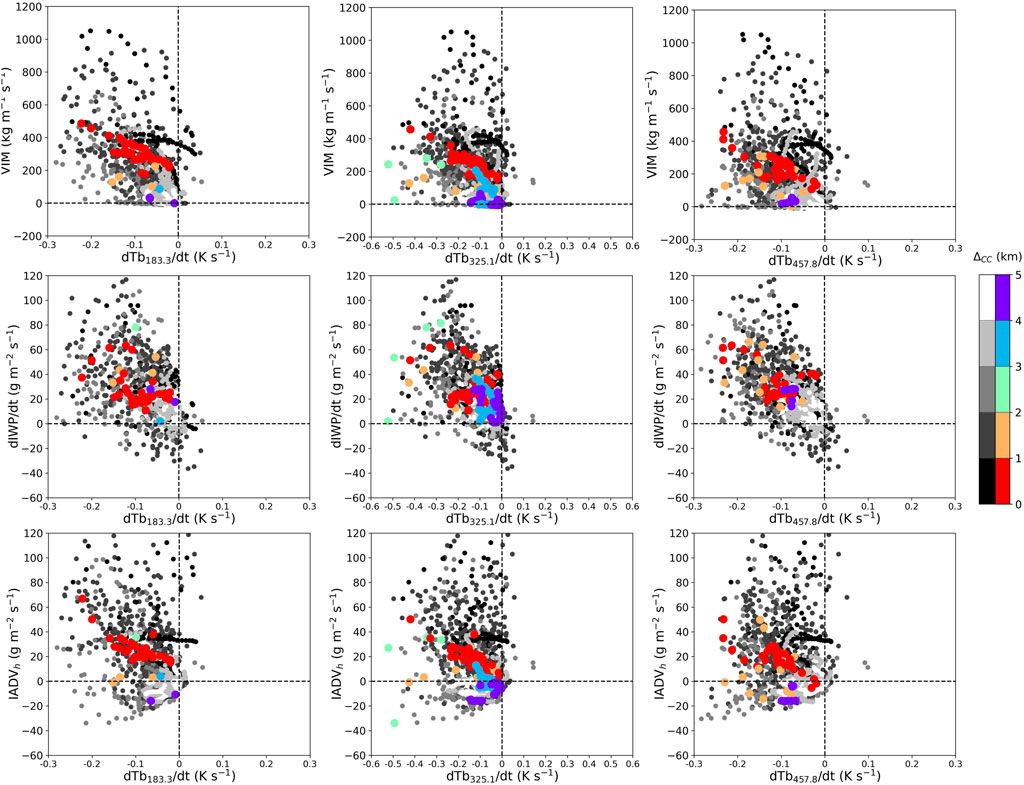
FIGURE 7. Same as Figure 6 for the selected convective cells in HEC and RCE.
VIM shows a large dispersion of positive values, up to more than 1000 kg m−1 s−1. It is always positive because the convective cells are in their growth phase. No apparent dependence of VIM on dTb/dt can be found, except for growing convective cores. In the latter case, VIM increases quite linearly with decreasing dTb/dt regardless of the channel. As with VIM, dIWP/dt shows a near-linear dependence on dTb/dt for convective cores. But unlike VIM, the smaller dispersion of dIWP/dt with dTb/dt suggests that their relationship may also be valid outside of convective cores.
It is interesting to note that the range of values of IADVh is similar to that of dIWP/dt. This confirms that the change in IWP can be explained by ice detrainment (or entrainment) alone and not necessarily by ice production in an updraft (or ice loss in a downdraft). The large scatter of the points suggests the difficulty of inferring such quantity using dTb/dt information. However, a near-linear relationship between IADVh and dTb/dt exists for convective cores. This suggests that inferring IADVh might be possible for convective cores, as it might be for VIM.
5 Study of the full Data set
The relationships between geophysical and satellite variables are now explored over the full data set. The objective is to examine whether these relationships previously found for 10 convective cells in the growth phase in a surrounding environment free of icy hydrometeors are robust regardless of the time in the deep convection life cycle, for the two tropical cases examined here. In order to provide guidance for the design of the satellite tandem, these relationships are examined for time delays ranging from 30 s to 3 min and for two horizontal resolutions, the one of the simulations and the pixel resolution of 6 km. The delay range is in the order of magnitude of what can be expected. The 6-km resolution corresponds to the largest pixel size expected for C2OMODO, that is, the 183 GHz band, while finer resolution is expected for the higher MW frequency bands. Outputs at 6-km resolution are obtained after linear interpolation of the simulation outputs.
The data set is about 10 million columns for HEC and 30 millions for RCE at the resolution of the simulations. The icy situations defined by IWP
5.1 Relationship Between the Time Derivatives of IWP and Tb
The relationship between the time derivatives of IWP and Tb is examined for all the grid points satisfying the deep convection criterion. The goal is to determine whether the quasi-linear relationship between the time derivatives of IWP and Tb found for convective cells in the growing phase is valid for all these grid points. As defined in Section 3, the deep convection criterion is designed for detecting icy situations. It changes with MW frequency, that is, Tb183.3-Tb193.1 > − 5 K, Tb325.1-Tb334.9 > 5 K, and Tb448.0-Tb457.8 > − 25 K. After filtering out the icy situations with ∣ dTb/dt ∣ ≤ 0.017 K s−1, the grid points satisfying the deep convection criterion account for 84 ± 4% and 86 ± 9% (as a function of the MW frequency) of the icy situations of the HEC and RCE simulations, respectively. There are between 4 × 10⁴ and 5 × 10⁵ grid points depending on the frequency and case and show a quasi-Gaussian distribution of dIWP/dt as a function of change in Tb.
The distribution of dIWP/dt vs. dTb/dt is examined with a delay time of 1 min for the selected channels (Figure 8). For each 0.02 K s−1 bin of dTb/dt, the median, the interquartile values of dIWP/dt and the least squares regression (for negative values of dTb/dt) are calculated and shown at both the horizontal resolution of the simulations and at a linearly interpolated 6-km pixel resolution. Overall, dIWP/dt is a monotonically decreasing function of dTb/dt whatever the resolution and the MW frequency. The absolute value of the slope of the regression line is about 100 g m−2 K−1 for the 325.1 GHz channel and 150–200 g m−2 K−1 for the 183.3 and 457.8 GHz channels. These differences in slope between the frequencies are mainly explained by differences in atmospheric opacity due to water vapor. At the horizontal resolution of the simulations, the slope differs between the two tropical cases. The agreement in the slope between the cases is better at the 6-km resolution, and the interquartile range is reduced. Note that, regardless of channel and resolution, the range of dTb/dt is much wider than that of the radiometric uncertainty of 0.017 K s−1 considered here. These results suggest that dIWP/dt, at least its largest values, can be estimated such as a linear function of dTb/dt using a delay time of 1 min.
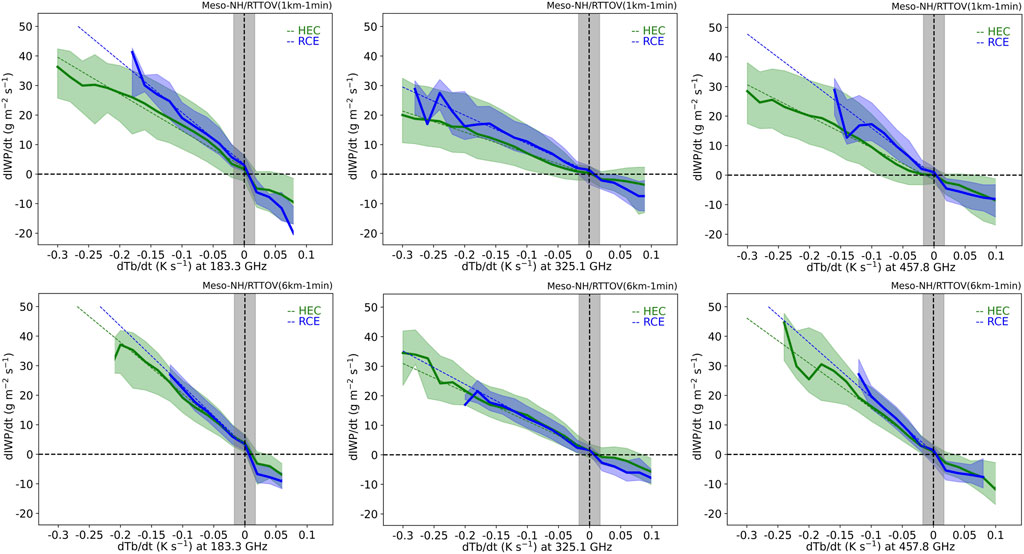
FIGURE 8. dIWP/dt as a function of dTb/dt for the 183.3, 325.1, and 457.8 GHz channels (from left to right) at the horizontal resolution of the simulations (top) and at a linearly interpolated 6-km pixel resolution (bottom). The time delay of the satellite tandem is 1 min. The bin interval is 0.02 K s−1. The median (bold lines), the interquartile range (shadings), and the least squares regression (dashed lines) are shown for HEC (green) and RCE (blue). The grey band delimits a dTb/dt uncertainty of 0.017 K s−1, corresponding to a 1 K uncertainty in the Tb measurement for a 1-min delay in the satellite tandem. Results are shown for grid points verifying the deep convection criterion.
The sensitivity of the relationship of dIWP/dt with dTb/dt to delay time is examined at both resolutions. The results are summarized by showing the absolute value of the slope dIWP/dt as a function of dTb/dt for the 183.3, 325.1, and 457.8 GHz channels, at both resolutions (Figure 9). At the horizontal resolution of the simulations, the absolute value of the slope is higher for RCE than for HEC regardless of frequency and time delay. It increases with time delay. At the 6-km resolution, except for the 3-min delay, these differences disappear. For each frequency, the absolute value of the slope is similar between the tropical case and the time delay. In other words, these results suggest that the change in IWP can be inferred for tropical conditions at 6-km resolution using the C2OMODO concept.
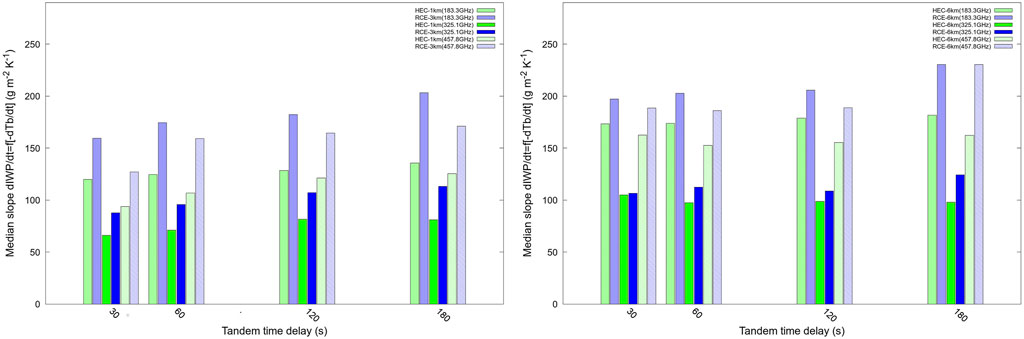
FIGURE 9. Slope of dIWP/dt as a function of dTb/dt for the 183.3, 325.1, and 457.8 GHz channels at the horizontal resolution of the simulations (left) and at a linearly interpolated 6-km pixel resolution (right). The time delay of the satellite tandem ranges from 30 s to 3 min. Results are shown for grid points verifying the deep convection criterion.
5.2 Relationship Between the Vertical Ice Velocity and the Time Derivative of Tb
The relationship between wice and the time derivative of Tb is examined. The dynamical variable wice defined as VIM divided by IWP is preferred to VIM as its unit in m s−1 is the most familiar. Note that, the results shown below for wice are similar to those obtained for VIM. As with the growing cells in Section 4.3, the results are examined for grid points verifying the growing convective core criterion. The latter is defined as the co-location of the lowest Tb and the lowest dTb/dt. Since the convective core produces most of the ice, the IWP and its variation within a convective core are statically larger than those in its surroundings. The lowest Tb condition looks for convective cores and the lowest dTb/dt condition for the most intense activity of the growing convective cores. The grid points satisfying the growing core criterion represent 1.6 ± 1.0% and 2.1 ± 1.4% (depending on the MW frequency) of the HEC and RCE icy situations with ∣ dTb/dt ∣ > 0.017 K s−1. They are between 103 and 104 points depending on the frequency and case and show a quasi-Gaussian distribution of wice as a function of change in Tb.
Figure 10 shows the distribution of wice versus dTb/dt with a delay time of 1 min for the two resolutions and the three selected channels. The larger and more active the convective core, the more ice it is able to produce and transport vertically. The lowest dTb/dt values between −0.2 and −0.1 K s−1 correspond to the highest convective velocity (∼10 m s−1). For the 183.3 and 457.8 GHz channels, this minimum value is equal to −0.1 K s−1, which is only about five times larger than the radiometric uncertainty of 0.017 K s−1. This highlights the need for a small noise level if one wants to infer wice with the C2OMODO concept. A weak dependence on the tropical case is found. Only the 6-km resolution suggests a near-linear relation between wice and dTb/dt.
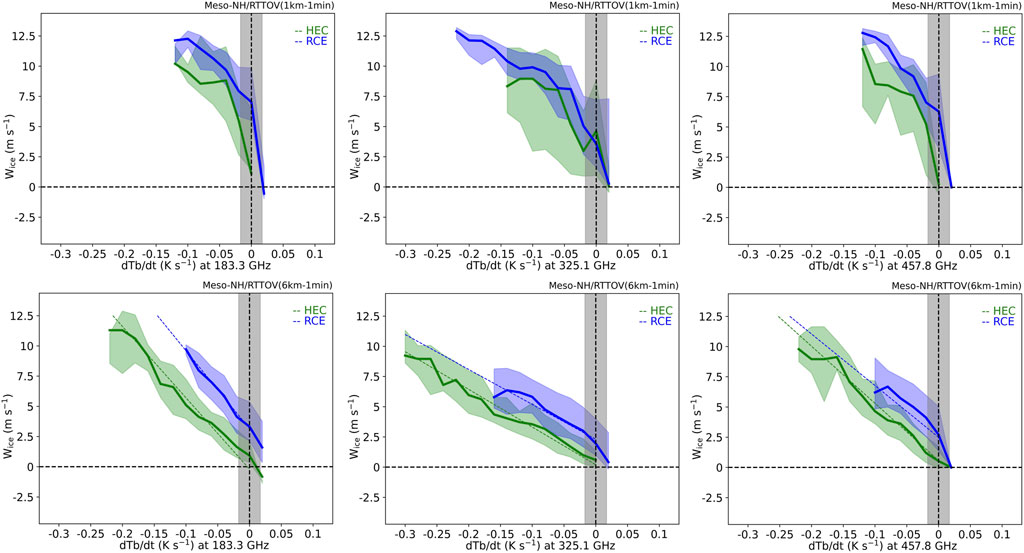
FIGURE 10. Same as Figure 8 but for wice. Results are shown for grid points verifying the growing core criterion. The least squares regressions (dashed lines) are shown for the 6-km resolution only.
The sensitivity of the slope to time delay is studied for the range between 30 s and 3 min at the 6-km resolution. Figure 11 shows the absolute value of the slope as a function of the MW frequency and the tropical case. Its value depends weakly on the delay time but varies a lot with the MW frequency. It is equal to about 30 m K−1 for the 325.1 GHz channel and 50–60 m K−1 for the 183.3 and 457.8 GHz channels. The variation of the slope with MW frequency is similar to that found for dIWP/dt, suggesting a link between the changes in IWP and wice. Overall, these results suggest that wice could be inferred in the growing convective cores from the C2OMODO concept.
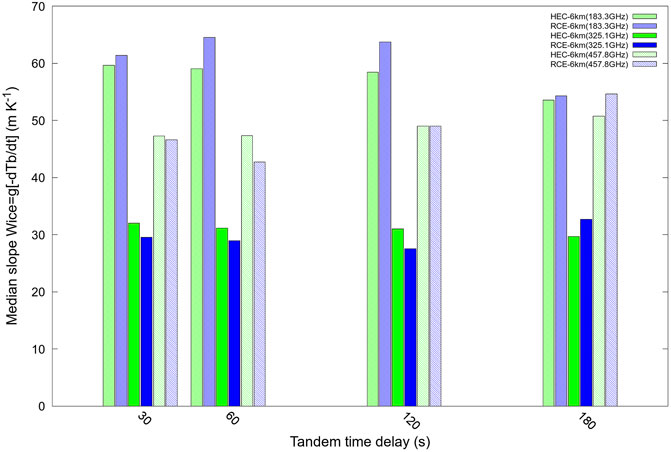
FIGURE 11. Same as Figure 9 but for wice at the 6-km resolution. Results are shown for grid points verifying the growing convective core criterion.
6 Conclusion
A data set is built to study the feasibility of the C2OMODO concept. This concept relies on the dependence of some microwave observations of the ice content and on the assumption that a short time delay in the microwave observation of deep convective systems would inform the time derivative of ice content, hence the vertical velocity in the updrafts. The data set is based on the two kilometer-scale simulations of tropical cases, one over land and the other over ocean. The relationship between Tbs at the wing and center of the 183, 325, and 448 GHz bands and some 2D variables characterizing ice content and convective updrafts has been examined as well as their dependence on horizontal resolution and delay. It is shown that IWP and dIWP/dt can be inferred in all deep convective scenes while wice and VIM in growing convective cores only. It is explained that the relationship wice and VIM breaks down in the anvil due to the dominance of horizontal ice advection over microphysical processes.
The relationship between geophysical and satellite variables is first studied for deep convective condition. The latter is defined as an atmospheric column in which the IWP exceeds a threshold of 1 kg m−2. In the radiometric space, this criterion translates into the difference in Tb between the wing and the center of the band above a threshold that differs between the three bands considered here. This highlights the difference in sensitivity of the bands to ice change. It can be seen that the 183 and 325 GHz bands are sensitive to IWP up to 40 kg m−2, while the 448 GHz band is sensitive to larger IWP values. Because the time change in IWP may depend more on horizontal advection of ice than on ice production in the updraft, the relationship is then studied for the growing convective cores. The latter is defined as the co-location of the local minimum in Tb and the local minimum in dTb/dt.
The time variation of IWP shows a near-linear relationship with dTb/dt for the center band channels at the 183 and 325 GHz bands and the wing channel of the 448 GHz band. This relationship is valid for both deep convection and growing convective core conditions. It is also robust to grid spacing and time delay, at least those studied here, that is, from 1 to 6 km and from 30 s to 3 min. These results suggest that the time variation of IWP could be easily inferred using the C2OMODO concept.
Two variables related to vertical velocity are examined: the vertical ice momentum VIM and the vertical ice velocity wice, defined as VIM divided by IWP. Both are found to increase with decreasing dTb/dt. This relationship is obtained for convective growing core condition only. Another limitation is that the relationship is not linear, with a slope that differs between the oceanic and continental cases. This disagreement in slope may be due to the difference in grid resolution between the two simulations. This aspect deserves further investigation.
We conclude that a stand-alone use of microwave observations using the C2OMODO concept to retrieve dIWP/dt, wice and VIM would be possible. First, we used only pseudo-observations to state the convective development: 1) deep convection scenes detected by the difference in Tb between the wing and the center of the band above a fixed threshold and 2) growing convective cores defined as the co-localization of the local minimum of Tb and the local minimum of dTb/dt. Second, we showed the existence of the relationships between dIWP/dt, wice, VIM, and dTb/dt.
The conclusions drawn here are based on two tropical cases only. Other cases should be investigated in addition to these two. At the time of writing, the C2OMODO radiometers would also cover mid-latitude areas. Future study will address a larger data set. Also note that the simulations are performed with a particular microphysics scheme of a convection-permitting model combined with a radiative transfer model, here Meso-NH combined with RTTOV. It is of interest to investigate the robustness of the relationships found here, at least for mid-latitude conditions, a different microphysics scheme, and a different radiative transfer model. Future study will be conducted to test the sensitivity of these relationships to the optical properties of frozen hydrometeors using the new capabilities offered by RTTOV (Geer et al., 2021).
Another aspect worth studying is the use of hyper-spectral information. Depending on their sensitivity to water absorption, the 50 channels in a band probe the atmosphere at different altitudes. This information should make it possible to deduce the vertical structure of IWP and, hence, of dIWP/dt. This would be also useful for retrieving VIM or wice in part of the atmospheric column. As a pure demonstration, Brogniez et al. (2022) showed that the VIM can be retrieved from Tbs. They found that the maximum vertical velocity within a convective column can be estimated with low error, especially for high velocities. More information on the C2OMODO concept and its possibilities, including promising synergies if a Doppler radar is aligned with the microwave radiometer tandem, is given by Brogniez et al. (2022).
Data Availability Statement
The raw data supporting the conclusions of this article will be made available by the authors, without undue reservation.
Author Contributions
J-PC conceptualized the study and designed the computational framework. FA analyzed the numerical data. All authors discussed the results and contributed to the final manuscript.
Funding
This work was supported under the AOS (Atmosphere Observing System) program and funded by the CNES (Centre National d’Etudes Spatiales, Toulouse, France).
Conflict of Interest
The authors declare that the research was conducted in the absence of any commercial or financial relationships that could be construed as a potential conflict of interest.
Publisher’s Note
All claims expressed in this article are solely those of the authors and do not necessarily represent those of their affiliated organizations, or those of the publisher, the editors, and the reviewers. Any product that may be evaluated in this article, or claim that may be made by its manufacturer, is not guaranteed or endorsed by the publisher.
Acknowledgments
Computer resources were allocated by GENCI through Project 90569. The authors thank the CNES and the C2OMODO working group: H. Brogniez and A. Dépée (LATMOS, Paris, France), R. Roca and T. Fiolleau (LEGOS, Toulouse, France), and D. Bouniol (CNRM, Toulouse, France). We thank the reviewers for their comments, which helped to improve the overall quality of the study.
References
Brogniez, H., Roca, R., Auguste, F., Chaboureau, J.-P., Haddad, Z., Munchak, S. J., et al. (2022). Time-delayed Tandem Microwave Observations of Tropical Deep Convection: Overview of the C2OMODO mission. Front. Remote Sens. n/a, accepted. doi:10.3389/frsen.2022.854735
Chaboureau, J.-P., Cammas, J.-P., Mascart, P., Pinty, J.-P., Claud, C., Roca, R., et al. (2000). Evaluation of a Cloud System Life-Cycle Simulated by the Meso-NH Model during FASTEX Using METEOSAT Radiances and TOVS-3I Cloud Retrievals. Q.J.R. Meteorol. Soc. 126, 1735–1750. doi:10.1002/qj.49712656609
Chaboureau, J.-P., Söhne, N., Pinty, J.-P., Meirold-Mautner, I., Defer, E., Prigent, C., et al. (2008). A Midlatitude Precipitating Cloud Database Validated with Satellite Observations. J. Appl. Meteorol. Climatol. 47, 1337–1353. doi:10.1175/2007JAMC1731.1
Colella, P., and Woodward, P. R. (1984). The Piecewise Parabolic Method (PPM) for Gas-Dynamical Simulations. J. Comput. Phys. 54, 174–201. doi:10.1016/0021-9991(84)90143-8
Cuxart, J., Bougeault, P., and Redelsperger, J.-L. (2000). A Turbulence Scheme Allowing for Mesoscale and Large-Eddy Simulations. Q.J R. Met. Soc. 126, 1–30. doi:10.1002/qj.49712656202
Dauhut, T., Chaboureau, J. P., Escobar, J., and Mascart, P. (2015). Large‐eddy Simulations of Hector the Convector Making the Stratosphere Wetter. Atmos. Sci. Lett. 16, 135–140. doi:10.1002/asl2.534
Field, P. R., Heymsfield, A. J., and Bansemer, A. (2007). Snow Size Distribution Parameterization for Midlatitude and Tropical Ice Clouds. J. Atmos. Sci. 64, 4346–4365. doi:10.1175/2007JAS2344.1
Fouquart, Y., and Bonnel, B. (1986). Computations of Solar Heating of the Earth’s Atmosphere: A New Parametrization. Beitr. Phys. Atmos. 53, 35–62.
Funatsu, B. M., Claud, C., and Chaboureau, J.-P. (2007). Potential of Advanced Microwave Sounding Unit to Identify Precipitating Systems and Associated Upper-Level Features in the Mediterranean Region: Case Studies. J. Geophys. Res. 112, D17113. doi:10.1029/2006JD008297
Geer, A. J., Bauer, P., Lonitz, K., Barlakas, V., Eriksson, P., Mendrok, J., et al. (2021). Bulk Hydrometeor Optical Properties for Microwave and Sub-millimetre Radiative Transfer in RTTOV-SCATT v13.0. Geosci. Model. Dev. 14, 7497–7526. doi:10.5194/gmd-14-7497-2021
Gong, J., and Wu, D. L. (2014). CloudSat-constrained Cloud Ice Water Path and Cloud Top Height Retrievals from MHS 157 and 183.3 GHz Radiances. Atmos. Meas. Tech. 7, 1873–1890. doi:10.5194/amt-7-1873-2014
Lac, C., Chaboureau, J.-P., Masson, V., Pinty, J.-P., Tulet, P., Escobar, J., et al. (2018). Overview of the Meso-NH Model Version 5.4 and its Applications. Geosci. Model. Dev.Model Dev. 11, 1929–1969. doi:10.5194/gmd-11-1929-2018
Liebe, H. J., Manabe, T., and Hufford, G. A. (1989). Millimeter-wave Attenuation and Delay Rates Due to Fog/cloud Conditions. IEEE Trans. Antennas Propagat. 37, 1617–1612. doi:10.1109/8.45106
Liu, G. (2008). A Database of Microwave Single-Scattering Properties for Nonspherical Ice Particles. Bull. Amer. Meteorol. Soc. 89, 1563–1570. doi:10.1175/2008BAMS2486.1
Masson, V., Le Moigne, P., Martin, E., Faroux, S., Alias, A., Alkama, R., et al. (2013). The surfexv7.2 Land and Ocean Surface Platform for Coupled or Offline Simulation of Earth Surface Variables and Fluxes. Geosci. Model. Dev. 6, 929–960. doi:10.5194/gmd-6-929-2013
Matzler, C., and Wegmuller, U. (1987). Dielectric Properties of Freshwater Ice at Microwave Frequencies. J. Phys. D: Appl. Phys. 20, 1623–1630. doi:10.1088/0022-3727/20/12/013
Meirold-Mautner, I., Prigent, C., Defer, E., Pardo, J. R., Chaboureau, J.-P., Pinty, J.-P., et al. (2007). Radiative Transfer Simulations Using Mesoscale Cloud Model Outputs: Comparisons with Passive Microwave and Infrared Satellite Observations for Midlatitudes. J. Atmos. Sci. 64, 1550–1568. doi:10.1175/jas3896.1
Mlawer, E. J., Taubman, S. J., Brown, P. D., Iacono, M. J., and Clough, S. A. (1997). Radiative Transfer for Inhomogeneous Atmospheres: RRTM, a Validated Correlated-K Model for the Longwave. J. Geophys. Res. 102, 16663–16682. doi:10.1029/97JD00237
Pergaud, J., Masson, V., Malardel, S., and Couvreux, F. (2009). A Parameterization of Dry Thermals and Shallow Cumuli for Mesoscale Numerical Weather Prediction. Boundary-layer Meteorol. 132, 83–106. doi:10.1007/s10546-009-9388-0
Pinty, J.-P., and Jabouille, P. (1998). “A Mixed-phase Cloud Parameterization for Use in a Mesoscale Non-hydrostatic Model: Simulations of a Squall Line and of Orographic Precipitations,” in Conference on Cloud Physics (Everett, WA: American Meteorological Society), 217–220.
Rosenkranz, P. W. (2015). A Model for the Complex Dielectric Constant of Supercooled Liquid Water at Microwave Frequencies. IEEE Trans. Geosci. Remote Sensing 53, 1387–1393. doi:10.1109/TGRS.2014.2339015
Rysman, J.-F., Claud, C., Chaboureau, J.-P., Delanoë, J., and Funatsu, B. M. (2016). Severe Convection in the Mediterranean from Microwave Observations and a Convection-Permitting Model. Q.J.R. Meteorol. Soc. 142, 43–55. doi:10.1002/qj.2611
Rysman, J.-F., Claud, C., and Dafis, S. (2021). Global Monitoring of Deep Convection Using Passive Microwave Observations. Atmos. Res. 247, 105244. doi:10.1016/j.atmosres.2020.105244
Saunders, R., Hocking, J., Turner, E., Rayer, P., Rundle, D., Brunel, P., et al. (2018). An Update on the RTTOV Fast Radiative Transfer Model (Currently at Version 12). Geosci. Model. Dev. 11, 2717–2737. doi:10.5194/gmd-11-2717-2018
Varble, A., Zipser, E. J., Fridlind, A. M., Zhu, P., Ackerman, A. S., Chaboureau, J.-P., et al. (2014). Evaluation of Cloud-Resolving and Limited Area Model Intercomparison Simulations Using TWP-ICE Observations: 1. Deep Convective Updraft Properties. J. Geophys. Res. Atmos. 119, 13,891–13,918. doi:10.1002/2013JD021371
Wiedner, M., Prigent, C., Pardo, J. R., Nuissier, O., Chaboureau, J.-P., Pinty, J.-P., et al. (2004). Modeling of Passive Microwave Responses in Convective Situations Using Output from Mesoscale Models: Comparison with TRMM/TMI Satellite Observations. J. Geophys. Res. 109, n/a. doi:10.1029/2003JD004280
Keywords: microwave radiometer, satellite observation, deep convection, icy cloud dynamics, Meso-NH numerical model, RTTOV
Citation: Auguste F and Chaboureau J-F (2022) Deep Convection as Inferred From the C2OMODO Concept of a Tandem of Microwave Radiometers. Front. Remote Sens. 3:852610. doi: 10.3389/frsen.2022.852610
Received: 11 January 2022; Accepted: 07 March 2022;
Published: 06 April 2022.
Edited by:
Matthew Lebsock, NASA Jet Propulsion Laboratory (JPL), United StatesReviewed by:
Bing Lin, National Aeronautics and Space Administration (NASA), United StatesDavid Painemal, Science Systems and Applications, Inc., United States
Copyright © 2022 Auguste and Chaboureau. This is an open-access article distributed under the terms of the Creative Commons Attribution License (CC BY). The use, distribution or reproduction in other forums is permitted, provided the original author(s) and the copyright owner(s) are credited and that the original publication in this journal is cited, in accordance with accepted academic practice. No use, distribution or reproduction is permitted which does not comply with these terms.
*Correspondence: Jean-Pierre Chaboureau, amVhbi1waWVycmUuY2hhYm91cmVhdUBhZXJvLm9icy1taXAuZnI=