- 1Department of Earth and Planetary Science, University of California, Berkeley, Berkeley, CA, United States
- 2Earth and Environmental Sciences Area, Lawrence Berkeley National Laboratory, Berkeley, CA, United States
- 3Department of Ocean Sciences, University of California, Santa Cruz, Santa Cruz, CA, United States
- 4Seabird Scientific, Philomath, OR, United States
Particulate inorganic carbon (PIC) plays a major role in the ocean carbon cycle impacting pH, dissolved inorganic carbon, and alkalinity, as well as particulate organic carbon (POC) export and transfer efficiency to the deep sea. Remote sensing retrievals of PIC in surface waters span two decades, yet knowledge of PIC concentration variability in the water column is temporally and spatially limited due to a reliance on ship sampling. To overcome the space–time gap in observations, we have developed optical sensors for PIC concentration and flux that exploit the high mineral birefringence of CaCO3 minerals, and thus enable real-time data when deployed operationally from ship CTDs and ARGO-style Carbon Flux Explorer floats. For PIC concentrations, we describe a fast (10 Hz) digital low-power (∼0.5 W) sensor that utilizes cross-polarized transmitted light to detect the photon yield from suspended birefringent particles in the water column. This sensor has been CTD-deployed to depths as great as 6,000 m and cross-calibrated against particulates sampled by large volume in situ filtration and CTD/rosettes. We report data from the September–November 2018 GEOTRACES GP15 meridional transect from the Aleutian Islands to Tahiti along 152°W where we validated two prototype sensors deployed on separate CTD systems surface to bottom at 39 stations, many of which were taken in nearly particle-free waters. We compare sensor results with major particle phase composition (particularly PIC and particulate aluminum) from simultaneously collected size-fractionated particulate samples collected by large volume in situ filtration. We also report results from the June 2017 California Current Ecosystem-Long Term Ecological Research (CCE-LTER) process study in California coastal waters where high PIC levels were found. We demonstrate that the PIC concentration sensor can detect PIC concentration variability from 0.01 to >1 μM in the water column (except in nepheloid layers) and outline engineering needs and progress on its integration with the Carbon Flux Explorer, an autonomous float.
Introduction
Phytoplankton account for half of global net photosynthesis (Field et al., 1998; Falkowski et al., 1988; Antoine et al., 1996), or about 50 Pg C y−1, yet they live for a week before being removed from the euphotic zone. Losses of particulate organic carbon (POC) from the euphotic zone to deeper waters sum to an uncertain 5–12 Pg C yr−1 (Boyd and Trull, 2007; Henson et al., 2011; Li and Cassar, 2016; Dunne et al., 2005; Siegel et al., 2014, 2016; Yao and Schlitzer, 2013) and constitute the ocean biological carbon pump (OBCP, Volk and Hoffert, 1985). This process of photosynthetic transformation of dissolved inorganic carbon to organic matter, and its export, leads to an increase of pH and a decrease of the CO2 concentration in surface waters, enhancing the transfer of CO2 from the atmosphere to the ocean. Biologically mediated calcification in surface waters forms particulate inorganic carbon (PIC) at equally uncertain rates of ∼0.4–1.8 Pg C yr−1 (Berelson et al., 2007; Balch et al., 2011a,b; Balch et al., 2016). Since the production of CaCO3 is a source of CO2 and decreased pH, it has an opposing effect to photosynthesis in CO2 uptake from the atmosphere.
As the OBCP is important to the long-term regulation of atmospheric CO2 (Siegenthaler and Sarmiento, 1993) and is the principal determinant of the vertical distribution of carbon and pH in the ocean, and hence of the surface partial pressure of CO2 governing air–sea CO2 exchange, it is critical to understand the competing processes that govern POC and PIC concentrations and fluxes in the water column. The various mechanisms of the OBCP have been extensively described (e.g., Bishop, 2009; Buesseler and Boyd, 2009; Burd et al., 2010; Turner 2015; Boyd et al., 2019), but the rules for their operation are poorly constrained by a lack of observations due to both the weather constraints and the cost of ship operations. It is not presently possible to determine from ship observations if and how the biological carbon pump may be changing in response to anthropogenic ocean acidification (Feely et al., 2004; Sabine et al., 2004; Orr et al., 2005), nor is it possible to gauge the effects of warming-induced changes in stratification and circulation without higher frequency observations.
There is a second role for particulate inorganic carbon in the OBCP. Calcium carbonate shells/fragments are ubiquitously found (along with fragments of biogenic silica and sometimes terrigenous material) in large aggregates (Honjo, 1976; Bishop et al., 1978; Bishop et al., 2016). Giving these particles excess density or “ballasting” (Armstrong et al., 2002) allows them to sink more rapidly and thereby increase particle transfer efficiency through the mesopelagic zone (Balch et al., 2016). A decrease in the supply of the carbonate ballast to aggregates could present an unexpected and amplifying feedback as the remineralization of more slowly sinking aggregates would occur shallower in the water column, thus increasing near-surface CO2 concentrations and reducing the rate of carbon uptake from the atmosphere. If the supply of the ballast increases, the resultant faster particle sinking rates would lead to an enhanced biological carbon pump and increased CO2 uptake. In summary, we do not know if the OBCP will be short-circuited or not. In situ knowledge of calcium carbonate dynamics would resolve these issues.
The only way to predict future trajectories of the global carbon cycle is through computer model simulations that accurately represent the substantial biotic carbon flows in the ocean. The parameterizations embedded within models for biotic carbon cycle processes are necessarily crude as they represent the sum of knowledge derived from observations that are sparse in time and space (Dickey et al., 2006; Buesseler et al., 2007; Bianchi et al., 2013). This applies to both POC and PIC carbon pools, and their vertical fluxes.
Over the past 40 years, ocean color satellite remote sensing has revolutionized the understanding of the biological and physical dynamics of the ocean, with widely accepted radiance-based proxies for chlorophyll-a (Hu, et al., 2012), POC (Stramski et al., 2008), and PIC (Balch et al., 2005; Mitchell et al., 2017); ship-based efforts to validate these proxies have largely utilized continuous underway sampling of surface waters with less frequent Conductivity Temperature Depth (CTD)/rosette sampling of the upper 100–200 m. In the case of PIC, there are fewer than 150 profiles extending from surface waters through the mesopelagic (Lam et al., 2011, 2018) due to the longer ship time required for large volume in situ filtration sampling of low concentration deeper waters plus the requirement to process ship-collected samples in the laboratory.
The variability of the vertical distributions of PIC is illustrated by three case studies drawn from seasonal and process study deployments of the multiple unit large volume in situ filtration system (MULVFS; Bishop et al., 2012), which yield PIC concentration profiles that are accurate and precise to 1–2% independent of depth. Case 1 is from seasonal ship occupations of ocean station PAPA (50°N, 145°W) in the subarctic north Pacific, where we observed changes of PIC concentrations to kilometer depths (Figure 1A; Guay and Bishop, 2002). Euphotic zone concentrations of PIC varied by a factor of 20 from February to May 1996 and by a factor of two or more to 1,000 m. We found similar changes in PIC along the entire 1,600 km long “Line P” transect from PAPA to the coast of Vancouver Island. Cases 2 and 3 from the VERTIGO program (Buesseler et al., 2007) are results from intensive 3-week particle sampling campaigns in productive waters of the Oyashio current at station K2 (47°N, 161°E) and in oligotrophic waters at station ALOHA (22.75°N, 158°W) near Hawaii. At K2, PIC concentrations varied strongly over 10 days (Figure 1B, Bishop and Wood, 2008), and over 92% percent of calcium carbonate particles (PIC) produced and present in the upper 500 m during the first week of sampling were lost due to dissolution 10 days later. Much of this dissolution loss involved changes of the suspended PIC pool (dominated by coccoliths and coccolith-rich aggregate particles); furthermore, much of the dissolution occurred above the calcite saturation horizon. In Case 3, in oligotrophic waters at station ALOHA (Bishop and Wood, 2008, Figure 1C), we observed a shallow—hard to sample—maximum in PIC; during four casts, our sampling at 50 m resolution missed a peak near 125 m, which was sampled during a fifth cast. The three cases demonstrate that PIC concentrations are highly dynamic in time, in the vertical, and in space. These experiences have motivated our development of a fast optical sensor for PIC to extend observations in the vertical and to enable measurements of PIC on autonomous platforms (IOCCG, 2011), and thus bridge the space–time gap in observations.
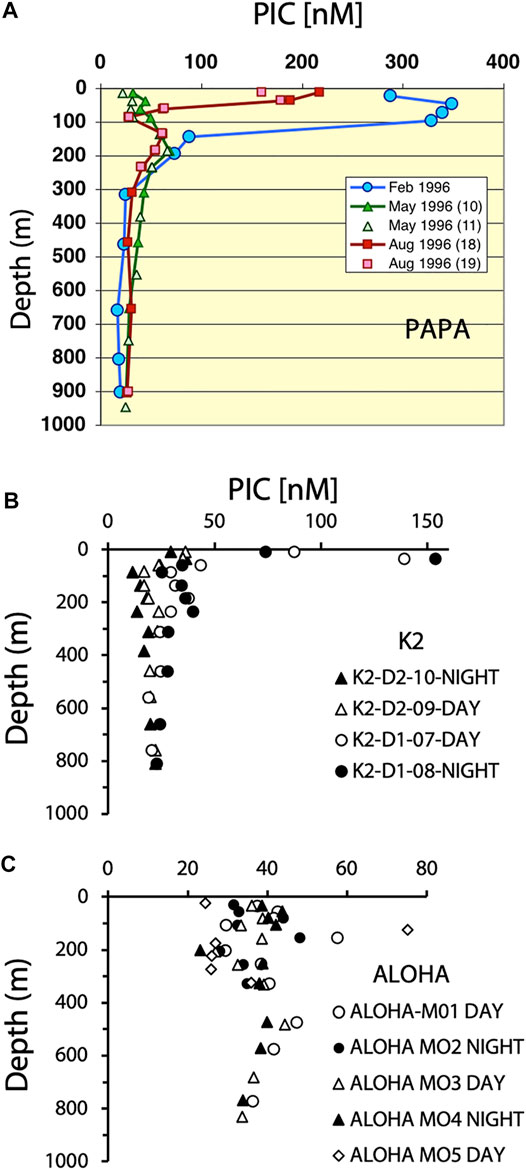
FIGURE 1. Profiles of particulate inorganic carbon (PIC) at locations in the subarctic North Pacific, Oyashio current near Japan, and from station ALOHA. Data are the sum of PIC determined in 1–51 and >51 µm particle size fractions collected during casts of the multiple unit large volume in situ filtration system. (A) Seasonal data from ocean station PAPA (50°N 145°W) during February, May, and August, 1996. (B,C) Data from the VERTIGO project during 21-day occupations of station K2 (47°N, 161°E) and station ALOHA (22.75°N, 158°W).
Guay and Bishop (2002) laid the basis for an optical sensor which detects birefringent PIC minerals in water. Birefringence occurs when a beam of plane polarized light is split into two beams, an ordinary ray and an extraordinary ray, of unequal velocities (corresponding to two different refractive indices of the crystal), which when recombined on exiting the crystal form a beam of light that is no longer linearly polarized. Birefringence is the difference between the two refractive indexes.
In the following text, we describe our sensor as a “PIC sensor” because the birefringence of both calcite and aragonite polymorphs of CaCO3 (0.172 and 0.155) far exceeds that of other biogenic minerals (celestite 0.009 and barite 0.012) and minerals of terrigenous origin (e.g., quartz, 0.009; kaolinite, ∼0.004; chlorite, ∼0.008; and illite, 0.03; Guay and Bishop, 2002); furthermore, CaCO3 particles are far more abundant in the ocean than other mineral phases, especially in the upper kilometer. Weakly birefringent Ceratium dinoflagellates (Balch and Fabry, 2008) and other zooplankton with non-carbonate birefringence can be present, but the majority of particles are not birefringent. Cachon et al. (1989) also note weak birefringence of dinoflagellate chromosome structures. The following discussion will investigate the fidelity of sensor and measured PIC.
This study describes results from extensive water column CTD deployments of the latest two sensors (PIC010 and PIC011) during two recent expeditions: the first is the GEOTRACES GP15 transect aboard R/V Revelle that occupied 39 stations from Adak, Alaska to Tahiti along 152°W from Sept to Nov 2018 (Figure 2A). The second is the June 2017 California Current Ecosystem–Long-Term Ecological Research (CCE-LTER) project process study, P1706 (Bourne et al., 2021, Figure 3). The PIC sensor profiles from GP15 were compared with profiles that measured PIC determined in samples collected simultaneously using a large volume in-situ filtration system, as well as with satellite observations of surface PIC. The CCE-LTER intercompared particle concentration optical proxies of birefringence, beam attenuation coefficient, scattering, and chlorophyll fluorescence, as well as satellite retrieved PIC concentrations.
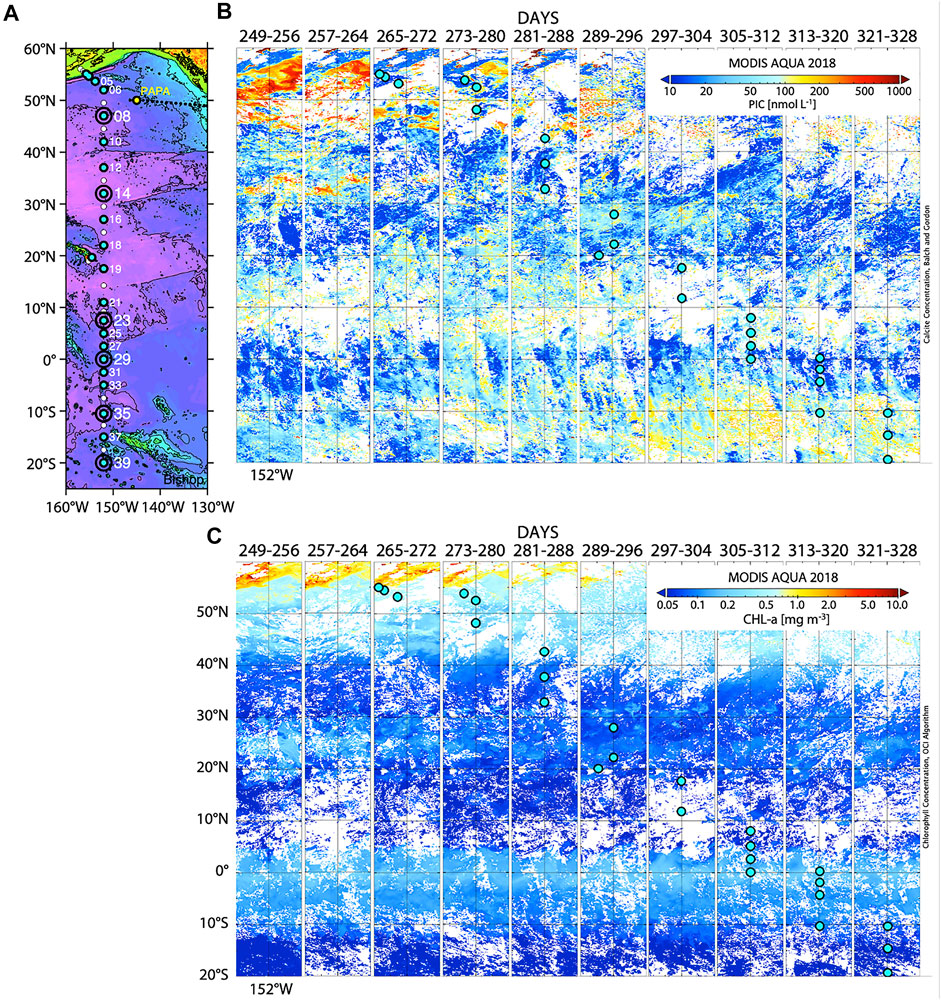
FIGURE 2. Spatial and remote sensing context for the September to November 2018 GEOTRACES GP15 transect from Adak Alaska to Tahiti. Stations where the McLane large volume in situ filtration system was deployed are denoted by cyan-filled symbols. Stations ringed with a large circle denote locations with three casts (A). The GEOTRACES Trace Element Carousel (GTC CTD) was deployed at all stations. (B) shows MODIS AQUA satellite retrievals of PIC averaged over 8 days from 60°N to 20°S and from 147°W to 157°W at 4 km resolution over the time of the transect. The UTC day range for each swath is shown at the top of each swath. Station locations are mapped onto the contemporaneous swath. (C) shows similar swaths for MODIS AQUA chlorophyll. Plots were made using Panoply, an application of the NASA Goddard Institute for Space Studies.
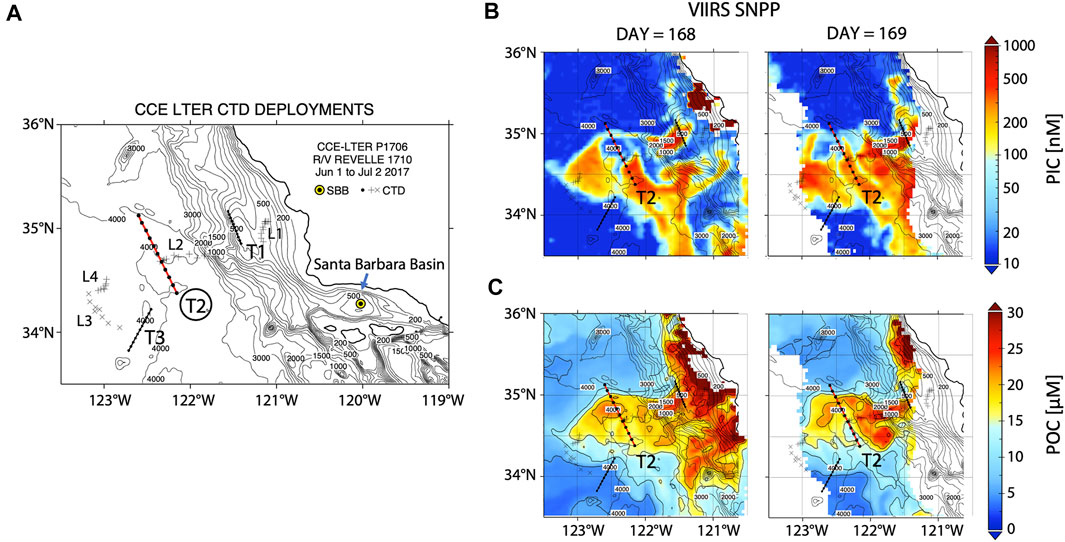
FIGURE 3. Spatial context and satellite data for the June 1–July 2, 2017 CCE-LTER process study of a biologically productive filament of offshore flowing upwelled water. (A) Map showing locations of CTD casts made during 5-day temporal sampling at locations L1, L3, and L4 (+) in the evolving filament and locations of cross-filament Transects T1, T2, and T3 (Bourne et al., 2021). Here, our focus is focuses on data from a PIC sensor deployed during 1 day CTD transects of the filament. Transect T2 was occupied during day 169. (B) VIIRS SNPP satellite retrieved PIC for days 168 and 169. (C) VIIRS NSPP satellite retrieved POC for days 168 and 169.
Materials and Methods
Spatiotemporal Context GP15 and CCE-LTER
Figure 2B shows 8-day 4-km composite swaths from 60°N to 20°S and 157°W to 147°W of PIC retrieved from the MODIS AQUA satellite with GP15 stations placed on the corresponding image based on the time of sampling. Figure 2C shows chlorophyll-a swaths with similar station placement. Both views provide spatiotemporal context for the GP15 transect. PIC sensor PIC011 was deployed surface to bottom during large volume in situ pump casts at 21 of 39 stations during GP15. PIC010 was CTD deployed at all stations beginning at station 6 using the GTC CTD/water sampling system.
PIC011 was CTD deployed ∼90 times during the June 2017 California Current ecosystem–Long-Term Ecological Research (CCE-LTER) project process study, aboard R/V Revelle. The study followed the biological evolutions of a biologically productive filament of upwelled cold, high-salinity westward-flowing water off the coast of California (Bourne et al., 2021; Figure 3). Figure 3 provides a spatial context for the study with satellite retrievals of PIC and POC corresponding to days 168 and 169 which bracket the timing of the 100-km-long CTD/optics Transect T2 across the filament.
PIC Sensor Concept
The sensor concept has been described by Guay and Bishop (2002) and Bishop (2009). The first profiling sensor was a modified version of an analog WETLabs C-Star 25 cm pathlength transmissometer. A 660-nm laser replaced the LED source, and a cell with high crossing efficiency polarizers (630–700 nm, Polarcor, Corning) was inserted into the water path length of the instrument. At the source end, the polarizer is aligned with the plane of polarization of the laser; on the receiver end, the polarizer is crossed, thus minimizing the detection of the primary beam. The sensor thus detects the photon yield resulting from the interaction of polarized laser light with birefringent particles in the beam. The first full water column profiles of the first sensor (PIC001) took place in 2003 in the North Atlantic (Bishop, 2009). This sensor was stabilized in 2006 by replacing the cell with body-mounted polarizers.
The primary challenge during the development was to maintain the optical fidelity and electronic stability of the instrument as it is being buffeted by turbulence at profiling speeds of 1 m s−1, with pressures ranging from 100 to 60,000 kPa (1–600 atm), temperatures ranging from −1 to 35 C, and thermal shocks as large as 1°C s−1. The polarizing elements of the sensor must be perfectly pressure-compensated yet mounted robustly in a way to minimize stress-induced polarization effects. The latter was a major problem. Over many iterations of the basic design and multiple sea trials, we demonstrated in 2013 that multiple PIC sensors yielded identical results and exceeded the performance of PIC001 (Supplementary Figure S1).
GEOTRACES GP-15 Large Volume In Situ Filtration Profiling
Protocols for pump deployments, sample collection, and analysis are described by Xiang and Lam (2020). Briefly, size-fractionated particles were collected using McLane Research in situ pumps (WTS-LV) that had been modified to accommodate two flow paths. At most GP15 stations, two casts of eight pumps (a shallow cast to 1,000 m and a deep cast from 1,000 m to near bottom) enabled sampling at 16 depths; at super stations (Figure 2A), three casts [shallow (s), midwater (m), and deep (d)] were achieved. Wire-out was used to target nominal depths during deployment. Typically, shallow, midwater, and deep casts lasted 5–7, 6–8 h, and 8–10 h, respectively. The duration of pump sampling was typically 3–5 h during these casts. An internally logging Seabird 19-plus CTD was deployed at the end of the line and used to verify target depths; true sampling depth was determined by linear scaling from measured end-of-wire depth.
Each pump carried two 142-mm diameter filter holders with two separate filter stages, and multiple baffles upstream of the filter stage were designed to ensure even particle distribution and prevent particle loss (Bishop et al., 2012). One filter holder was loaded with a 51-μm Sefar polyester mesh prefilter followed by paired Whatman QMA quartz fiber filters (identical to the scheme of Bishop and Wood (2008)). The other filter holder was also loaded with a 51-μm prefilter but followed by paired 0.8 μm Pall Supor polyethersulfone filters. The 51 μm prefilters and QMA filter pairs were underlain by a 150-μm Sefar polyester mesh support filter (not analyzed) to facilitate filter handling. Suction from the pump during operation causes water to flow through each filter holder and the dedicated flowmeter. The two metered flows were then metered by a third flowmeter as a crosscheck. Parameters reported in this study were from filter subsamples from both flow paths. The volume of water filtered through each sample ranged from several hundred liters in surface waters to 1,000 L in deep waters. All filters and filter holders were acid-leached prior to being used according to methods recommended in the GEOTRACES sampling protocols (GEOTRACES, 2017). QMA filters were pre-combusted at 450°C for 4 h following acid leaching. Each cast also had a full set of “dipped blank” filters deployed. A 0.2-μm Supor prefilter above the filter set excluded any particles that may have been present in seawater in the filter holder headspace.
Pump Sample Analysis
Particulate inorganic carbon (PIC) was measured by coulometry (Honjo et al., 1995) as described in the study by Lam et al. (2015) and Lam et al. (2018). For the small size fraction, a 25-mm punch from the top filter of paired QMAs was acidified with 2N sulfuric acid, and the mass of the inorganic carbon dissolved was recorded. For the large size fraction, a 1/16 slice of a 51-µm polyester prefilter was used instead. From the total PIC on each sample filter, the median PIC from dipped blank filters of the corresponding type (i.e., QMA or prefilter) was subtracted as a blank correction. These blank-corrected values were converted to mols (using 12.011 g C/mol) and divided by liters pumped to obtain concentrations.
Methods for particulate trace metal (pTM) digestion and analysis followed are described in the study by Xiang and Lam (2020). Briefly, particles on the Supor filter matrix were digested in a hot refluxing solution of 10% ultrapure hydrofluoric and 50% nitric acids at 110°C for 4 h, heated to dryness, and redissolved in 5% ultrapure nitric acid. Two certified reference materials (BCR-414 and PACS-2) were routinely digested and analyzed alongside the samples. Digest solutions were analyzed by high-resolution inductively coupled mass spectrometry (HR-ICP-MS) using an Element-XR ICP-MS (Thermo Scientific) in the UCSC Plasma Analytical Facility. Particles collected on 1/8th of a >51 µm prefilter were rinsed with TM-clean filtered seawater onto a 25-mm diameter 0.8 µm Supor filter; the sample was digested and analyzed following identical procedures as used for the small particle size fraction.
Pump Cast Optical Sensors
The CTD deployed during pump casts carried a WETLabs fluorometer, a C-Star transmissometer (CST1450DR), a Seapoint Sensors, Inc. (Exeter, NH, United States) turbidity sensor (880 nm, scattering angle range 45–135°, gain 100×), and particle birefringence sensor (PIC011). The Seapoint turbidity sensor failed during the deep cast at station 4 and was not replaced until station 18. Analog voltages from all sensors were logged at 4 Hz at 14 bits resolution (0.3 mV). Bench tests with PIC011 read by the CTD have shown that voltages are stable to ± 0.3 mV (SD). PIC010 was similarly stable. During the occupation of the first station on the transect (station 5), the CTD was dragged on the bottom (for minutes to hours) during pumping and was recovered coated with sediment. All sensors were disassembled and cleaned, and PIC011 was realigned. The C-Star and PIC011 were not impacted by this event and operated well at all subsequent stations.
Battery limitation during the cruise meant that up and downcast CTD profiles were limited mostly to shallow casts. During most midwater and deep deployments, the CTD stopped logging, and no upcast data were collected.
PIC011 was oriented vertically to fit within the CTD cage. The polarizing assemblies on PIC011 had cup-shaped housings protecting the polarizer, and consequently, the downward facing assembly trapped bubbles during deployment, leading to anomalously low readings until bubble effects were cleared. For this reason, downcast data from shallow (s) casts at stations 4, 8, 12, 23, 25, 27, and 29 were only valid deeper than 73, 20, 55, 80, 250, 221, and 140 m, respectively. Good upcast profiles were available at all stations except at 4 and 8 (s casts). This problem was solved starting at station 14 by orienting the CTD horizontally just below the surface for 30 s at the beginning of each cast. A lapse in the procedure occurred at stations 23, 25, 27, and 29.
Data from the transmissometer (CST1450) and valid Seapoint turbidity sensor profiles were processed according to the protocols of Bishop and Wood (2008). Since the logging CTD was kept clean in the main laboratory of the ship, it was possible to periodically measure air calibrations for CST1450 and determine corresponding clear water values over the duration of the cruise. CST1450 was exceptionally stable, drifting linearly downward by 0.011 V relative to 4.693 V reference over 280 h of operation. Turbidity units (in mFTU) were calculated by multiplying the Seapoint turbidity sensor voltage by 5,000.
GTC CTD Optical Sensor Data
PIC010 was mounted horizontally on the GEOTRACES Trace Element Sampling Carousel (GTC) and interfaced to its Seabird 911 CTD. Data from this sensor were acquired at 24 Hz and 12 bit precision (1.25 mV resolution). The C-Star transmissometer (CST1035DR) was also interfaced with the CTD. Data from this instrument were corrected for hysteresis and cross-referenced to data from the pump-deployed transmissometer, CST1450DR. From this comparison, clear water reference values were estimated for CST1035, and beam transmission and beam attenuation coefficients were calculated. The GTC CTD system was deployed 66 times with the PIC sensor. Because the sensor was mounted horizontally, data from both down and upcasts were not influenced by trapped bubbles.
PIC Sensor Data Reduction
Spike Filtering
The transit of larger organisms/aggregates through a transmissometer beam results in negative spikes in transmission lasting less than 0.2 s (Bishop and Wood, 2008), while positive spikes are seen in data from scattering and PIC sensors. We developed a “3 sigma” filtering algorithm that is used for all particle sensors. Briefly, we compute the mean and standard deviation (SD) of all data collected over 10 s (40 readings for the pump CTD and 240 readings for the TM Rosette CTD). The scheme excludes data falling outside of ± 3 SD of the mean. A new mean and SD are computed, and the process repeats until no more points are excluded (or 10 iterations maximum). We then save the mean, SD, and number of points for the filtered result, and further save the mean, SD, and number of points excluded by the filter. This allows the unfiltered mean to be reconstructed.
Signal Correction
The PIC sensor generates analog voltages or digital counts that are linearly correlated with the photon yield of birefringent particles in the water path; however, the signal includes contributions from four sources (Eq. 1): 1) dark current, 2) polarizer crossing blank, 3) stray light, and 4) birefringence (β). Sensor design must achieve a stable dark current, minimize and maintain a constant polarizer crossing blank during profiling, and minimize stray light in order to resolve the birefringence signal. In terms of voltage signals recorded by a CTD, the birefringence signal from particulate calcium carbonate particles is as follows:
where Vmeas is the raw signal from the CTD, Vdark is the reading with the beam blocked, Vcross is the reading with polarizers crossed, and Vstray is light added to the beam by reflections. The sensor electronics read zero digital counts with the beam blocked but generate a constant small positive analog voltage (0.007 V for both PIC010 and PIC011) as Seabird CTDs do not detect negative voltages. Vdark is measured with the sensor interfaced to the CTD with beam blocked. Vcross is the primary beam signal that is detected with no particles in the beam. Vstray is negligible as the primary beam is columnated and the detector receiver angle is small.
We calculate photon yield of the sensor as follows: 1) Vdark is read with the beam blocked; 2) signal is read with polarizers removed but with a high extinction neutral density (OD 4.3) filter placed in the beam, which reduces the beam energy by a factor of 20,000. Net readings were 0.8421 V for PIC010 meaning that the primary beam would generate a signal equivalent to 16,800 V; 3) with the source polarizer reinstalled and aligned with the source, the net signal was 0.6136 V; thus, the polarizer transmission efficiency is 72.9%. Installation of the detector polarizer if aligned with the beam would further attenuate the signal by another 72.9%, implying that 0.4471 V would be measured at the detector. This means that the maximum beam energy that could pass to the detector would be equivalent to an 8921 V signal. 4) The detector polarizer is installed and the crossing blank measured. For PIC010, we measured Vcross = 0.0476 V. Thus, the crossing blank expressed in terms of beam energy is the ratio 0.0476 V: 8,921 V or 5.34 × 10⁻⁶. The sensitivity of the instrument is calculated to be 112.1 × 10⁻⁶ V−1. As the instrument pathlength is 0.25 m, we calculate a scaling factor (SF) of 448.4 ppm V−1 m−1. Similar measurements with PIC011 yielded similar factors; however, a defect in the orientation of the detector polarizer meant that the source polarizer had to be rotated away from optimum alignment to achieve crossing. This reduced the primary beam by 30% on this instrument. The derived scaling factor (SF) for PIC011 was calculated to be 644.7 ppm V−1 m−1.
In our present instrument prototype, there is no compensation for thermal variations in beam intensity. We used a thermal cycling chamber (Tenney Environmental, Columbia, PA, United States) at Lawrence Berkeley National Laboratory to investigate both static and transient thermal responses of both PIC010 and PIC011, respectively (Figures 4, 5), with polarizers installed. The chamber was purged with dry air, and the chamber temperature and instrument data (signal counts and internal instrument temperature near the laser source) were acquired (Figures 4A,5A). The data were segregated into periods of warming, cooling, and zero change and normalized to readings at 20°C. In the case of PIC010, beam energy normalized at 20°C ranged as a function of instrument temperature from ∼0.90 near 0°C to 1.02 at 30°C (Figure 4B); similarly, data from PIC011 ranged from 0.84 to 1.03. The static trend was removed from the data, and the residual response of the two sensors was calculated (Figures 4C, 5C). The transient response of the instrument for warming and cooling was plotted as a function of the rate of instrument temperature change. The transient response of PIC010 showed a negative trend on warming, while that for PIC011 showed a positive trend. Both sensors demonstrated a temperature-dependent transient response on cooling. The magnitude of the transient response for PIC010 decreased in magnitude with temperature (Figure 4E), while PIC011 exhibited an increased response with decreasing temperature (Figure 5E).
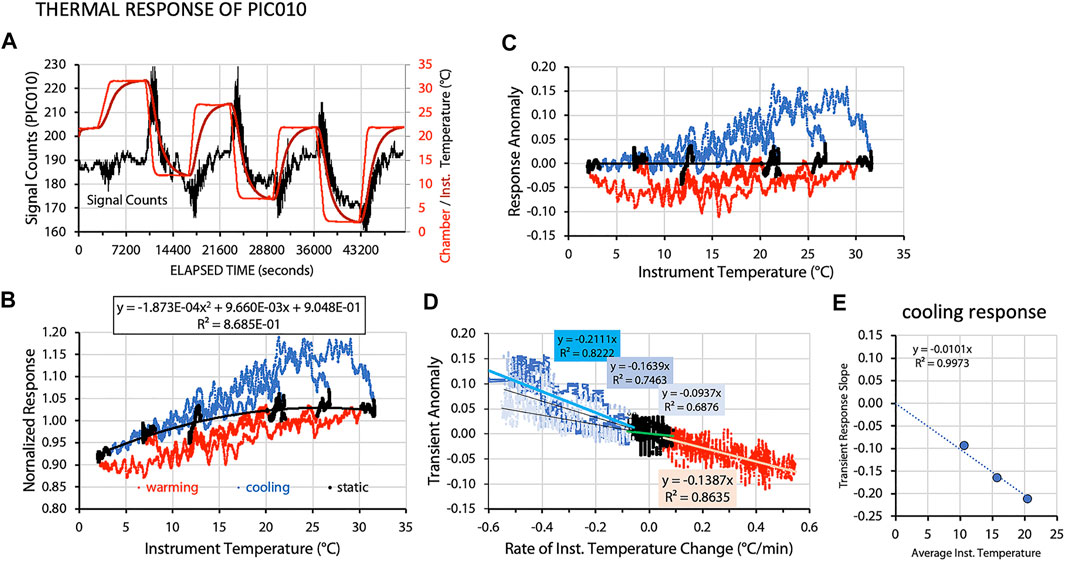
FIGURE 4. (A) Time series of the digital output from PIC010 during a thermal cycling experiment over 14 h. During the experiment, chamber temperature was cycled over a temperature range from 32 to 2°C. Instrument temperature lagged chamber temperature. During periods of strong cooling, the sensor displays a positive transient; similarly, during periods of warming, there is a negative transient. (B) The normalized signal counts for periods of warming, cooling, and during periods of static temperature. The regression data are fit to the data during thermal equilibrium of chamber and instrument. (C) Data from (B) after removal of the static thermal trend. (D) Plots of residual anomaly vs rate of instrument temperature change. In (B–D), red and blue colors denote data during instrument warming and cooling. Data during thermal equilibrium are shown in black. (E) Temperature dependence of transient response.
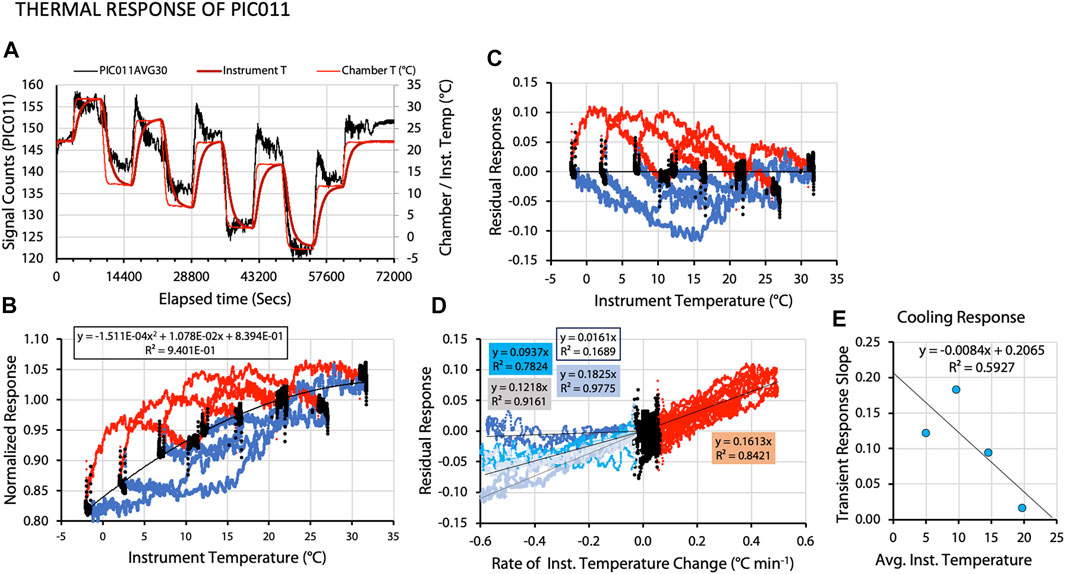
FIGURE 5. Thermal cycling response of sensor PIC011. Figure elements (A–E) are the same as described in Figure 4.
In our data reduction scheme for both sensors, we calculate instrument temperature and the rate of change of instrument temperature per minute. The full expression for the calculation of birefringent photon yield is given by a complete formulation of Eq. 1:
Tr is the transmission measured by C-Star transmissometer 650 nm over its 25 cm path length; and Vcross × Tr compensates for attenuation of the crossing blank due to particles. R is the static thermal response correction calculated using instrument temperature. Vdrift is a small compensation for sensor drift during pumping between the time of down and upcasts (often <1 mV), and Vtransient is derived from thermal cycling experiment data.
Tr0.5 is from the study by Guay and Bishop (2002) and compensates for attenuation of the birefringent photon signal resulting from scattering and absorption effects of other particles in the beam.
We empirically found pressure coefficients that allowed the best fit of Vβcorrfinal and measured PIC in the midwater column (2,000–4,000 m) according to Eq. 4. These adjustments had minimal effects in the upper 500 m. Vcross for PIC011 during shallow and midwater casts at station 39 was anomalously high, indicating that the polarizers had been disturbed prior to the shallow cast; data from these casts were not used. The deep cast at station 39 was normal. Apart from this anomaly, the two parameters varied consistently over time.
Figure 6 shows Vcross, and coefftpress over time for PIC011 and PIC010. The Vcross value for PIC011 drifted from 0.04 to 0.10 V over the 280 h of sensor use (0.14 for casts 39 s and 39 m). As sensor Vcross increased, its pressure coefficient also increased. In contrast, the Vcross value for PIC010 drifted from 0.035 to 0.055 V, but its pressure coefficient was negative but not regularly behaved. We do not currently understand the reason for the upward trend in crossing blank.
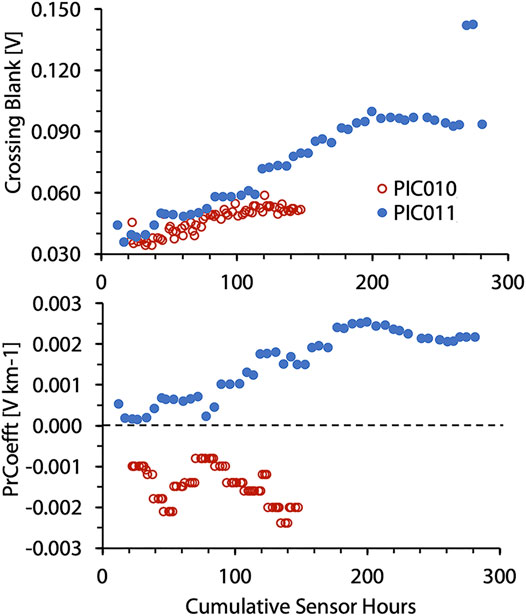
FIGURE 6. Variation of crossing blank (Vcross) and profile pressure coefficient (coefftpress) as a function of cumulative sensor hours over the GP15 transect. PIC010 and PIC011 showed different pressure coefficient behavior over time.
Finally, scaling for birefringent photon yield is computed using the scaling factor, SF, derived earlier:
We provide this insight into sensor behavior as this is the first detailed description of long-term sensor performance in an operational context. Many details of the calibration, drift behavior, and transient response to thermal shock are different for the two sensors. We examine below the consistency of the corrected data.
Satellite Data
The GP15 transect spanned September 24, 2018 through November 22, 2018 (year days 267–326) from 55°N to 20°S, centered on 152°W. Satellite retrievals of sea surface chlorophyll (Hu et al., 2012), PIC (Balch et al., 2005), and POC (Stramski et al., 2007) at 4-km 8-day temporal resolution from MODIS Aqua and Terra and SNPP VIIRS (Visible Infrared Imaging Radiometer Suite) were downloaded in July 2019 and December 2021 from the NASA ocean color archive for latitudes 60°N to 25°S, and for longitudes from 147°W to 157°W (https://oceancolor.gsfc.nasa.gov/l3/); no differences in property retrievals for MODIS Aqua data from the two time periods were detected. No data are available from the improved (Mitchell et al. (2017)) algorithm for the periods of this investigation.
Zonal transect mean and standard deviation were computed for each of the ten 8-day composites. Data were excluded from the zonal trend when the ratio of standard deviation to mean exceeded 2.0. Transect segments corresponding to the time and location of GP15 stations (Figure 2A) were combined to complete a synthetic transect of retrieved properties from 60°N to 20°S.
The June 1 to July 2 2017 CCE-LTER expedition studied a filament of biologically productive upwelled water that was moving offshore in the vicinity of Morro Bay, CA. Our use of daily resolved 4-km satellite data was described by Bourne et al. (2021). In this study, we used Ocean Data View (Schlitzer, 2021) to extract data within 5 km of the transect from SNPP VIIRS, and MODIS Aqua imagery on ordinal days 168 and 169 which bracketed the times of CTD Transect 2 stations 37 (day 169.118) through 47 (day 169.803). The times of satellite over passes were at 21:40 UTC; thus, images corresponded to ordinal days 168.9 and 169.9. As features in the vicinity of Transect 2 stations were moving at a rate of 5–15 km d−1, a synthetic retrieval of properties was achieved using a time-weighted sum of retrieved properties from the two images (Figure 3).
Results
Hydrographic Context for GP15
The GEOTRACES GP15 section is notable as it transited waters of the Aleutian shelf, Alaska gyre, subarctic front, north Pacific gyre, the complex current regime of the equatorial Pacific, and into the south Pacific Gyre. It is further notable by the fact that particle concentrations were very low. The hydrographic context for the GP15 meridional section in the upper 500 m is provided by distributions of temperature, salinity, and oxygen (Figure 7). Cool low-salinity waters present in the upper 50–100 m north of 42°N are characteristic of the subarctic north Pacific. The subarctic front is present from 40°N to 32°N. North Pacific gyre influence is seen from 30°N to approximately 17°N. The properties in the equatorial zone from 17°N through 20°S closely follow the descriptions of Wyrtki and Kilonsky (1984). The core of the westward flowing North Equatorial Current (NEC) which completes the circulation of the north Pacific gyre is found at ∼14°N; the front demarking the North Equatorial Counter Current (NECC) is denoted by strong upward displacement of isotherms and oxygen-depleted waters extending from 100 to 350 m at 11°N. This feature was strongly oxygen deficient with concentrations below 5 µM compared to 20 µM concentrations reported by Wyrtki and Kilonsky (1984). The zone from 4°N to the equator is the northern branch of the westward flowing South Equatorial Current (SEC). Centered at the equator and 150 m depth is the easterly flowing Equatorial under current. The strongest flows of the southern branch of the SEC extend to approximately 8°S, and its influence trails off further south. The signature of the south Pacific Gyre is established at 20°S. There is a second lobe of low oxygen water from 200 to 400 m at approximately 2°S where O2 values are below 20 µM.
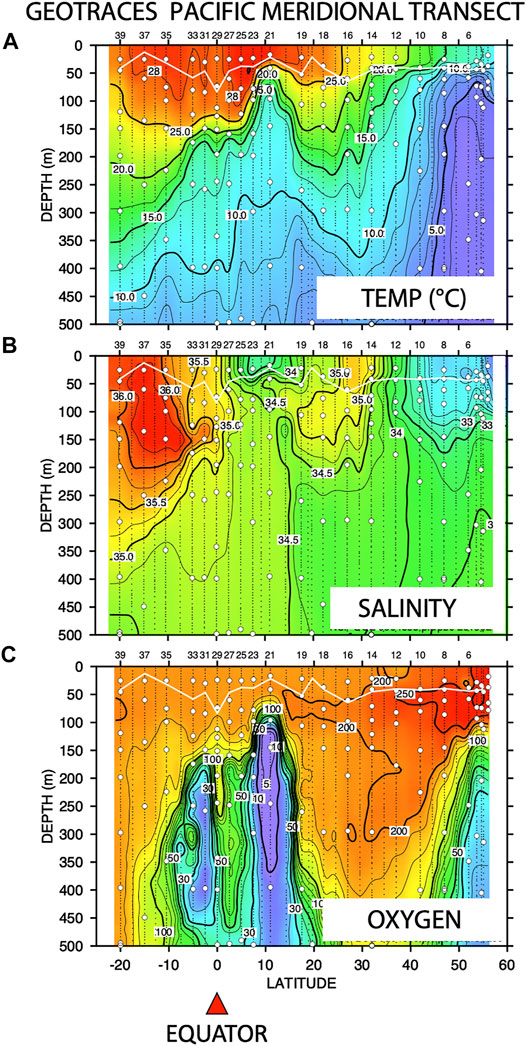
FIGURE 7. GEOTRACES GP15 Meridional Transect distributions of (A) temperature, (B) salinity, and (C) oxygen from surface to 500 m from the GTC CTD.
GEOTRACES stations 3 through 10 are in subarctic waters; station 12 is in the subarctic front; stations 14, 16, and 18 are in the oligotrophic north Pacific gyre; station 19 is situated in the NEC; and station 21 is at the NEC/NECC front and underlain by strongly oxygen-deficient waters. Station 23 is in the NECC; stations 25 and 27 lie in the SEC; station 29 sampled the equatorial under current; stations 31 and 33 were in the southern branch of the SEC and underlain by low oxygen waters; stations 35 and 37 were in the frontal waters of the south Pacific gyre; and station 39 is in the south Pacific gyre. The low oxygen waters at stations 21 and 31/33 will be relevant to the interpretation of PIC sensor datasets.
GP15 McLane Pump Profiles of Birefringence-Derived and Sampled PIC
Figures 8A,B compare PIC concentrations derived from birefringent photon yield (PIC011) and analytical values determined in McLane pump samples during the same casts, respectively. We note that sensor data are the results of down and upcast profiles each representing a 10–20 min snapshot of the upper 500 m of the water column, while the pump samples represent averages over the 3–5 h of sample filtration at depth. We also note that sensor data are adjusted for crossing blank drift and using empirically determined pressure coefficients derived from empirical fits of sensor data to measure PIC in waters from 2,000 to 4,000 m with the further constraint that the samples must be shallower than 1,000 m above bottom (mab). The features seen in the upper 2,000 m should be a valid reflection of the performance of the sensors. These results are the first comprehensive ocean-scale validation of the birefringence-derived optical proxy.
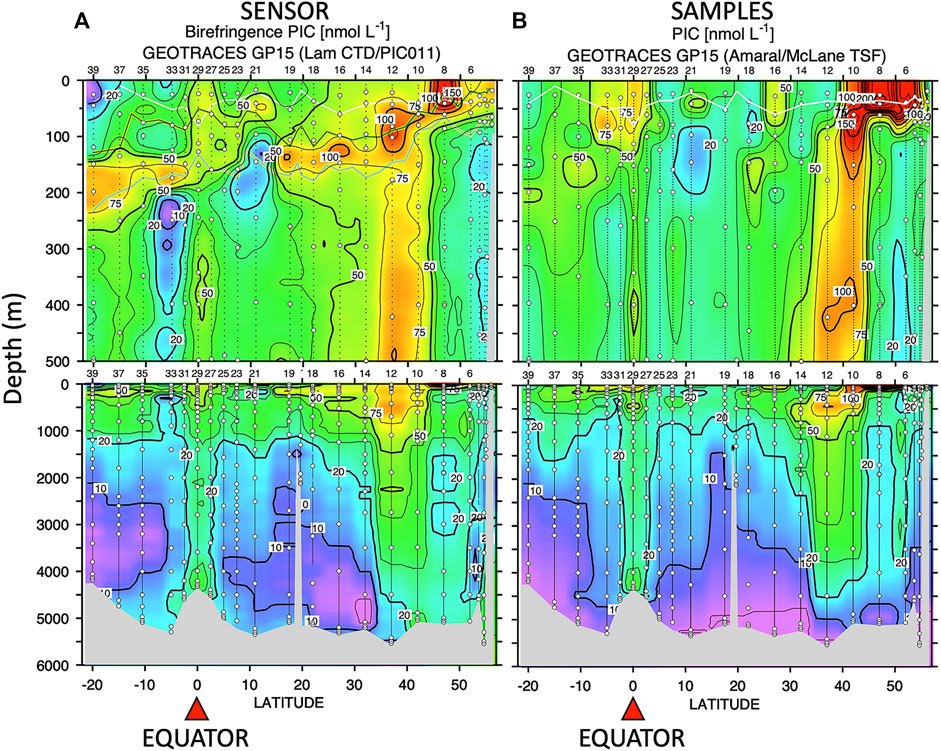
FIGURE 8. (A) GP15 transect section of calculated PIC concentration [nM] from birefringent photon yield measured by PIC011. In panel (A) the white line denotes mixed layer depth. The broad yellow/green curve denote the depth of maximum chlorophyll fluorescence. The lower broad curve denotes the base of the euphotic zone (defined by fluorescence readings <10% of maximum values, from Kenyon, pers. communication). The upper panels show an expanded 0–500 m depth range; lower panel shows the complete water column. White circles denote McLane pump sampling depths where measurements of PIC have been performed. (B) Transect sections for pump PIC [nM]. Color scales and contouring settings for all panels are identical.
The sensor data contoured in Figure 8A are averages over 10 m intervals of all profiles at the same station. Figure 8B shows contours of pump data that have been linearly interpolated at 10 m depth intervals between sample depths; concentrations in the surface layer were assumed constant to the surface. In the subarctic north Pacific, near-surface concentrations for sample PIC peaked at 500 nM at station 8; there was a general factor of two to three underestimation of near-surface PIC derived from PIC011. South of the subarctic front, sensor PIC concentrations in surface waters covary well with measured PIC. Relative minima for PIC from both sensor and samples were found at stations 21 and 33 in the low oxygen zones. A subsurface maximum feature near 120 m is present in sensor data at stations 16 through 19 and is not sampled by the pumps due to sample spacing. The profile shape is very similar to observations made at station ALOHA during the VERTIGO program (Figure 1C). A similar subsurface maximum was seen in sensor data between 150 and 225 m at stations 33 to 39. The relative highs in PIC concentration at depths below 200 m at stations 10 and 12 near the subarctic front and at equatorial station 29 were well reproduced by both sensor and samples.
In deeper waters from 500 m to depths of 1,000 m above bottom (mab), the trends of the data were similar in the sensor and pump data. Relatively high PIC values extended to depth at station 12 near the subarctic front and at equatorial station 29. In the depth interval between the bottom and 1,000 mab, there were cases where sensor and sampled PIC diverged, with sensor data increasing to the seafloor, while measured PIC decreased.
We used 10-m averaged CTD datasets to interpolate sensor data to depths sampled during pumping. Figure 9 shows the relationship between sample PIC and birefringent photon yield from the sensor. The data from the surface to the base of the euphotic layer (PPZ depth, 10% of fluorescence maximum, Buesseler et al., 2020) span a range of slopes from 1:50 to ∼1:7. In the subarctic north Pacific, the near-surface sample PIC values are closer to the 1:50 trend. The data from PPZ depth to 2,000 m are consistently correlated, with fitted trend line of 1:15.4 (R2 = 0.677, n = 130); data from PPZ depth to 1,000 mab yield a trendline of 1:14.5 (R2 = 0.774, n = 190). Data from within 1,000 m of the seafloor follow the midwater trend or trend anomalously to high birefringence. These anomalous results are likely due to the effects of resuspended clays.
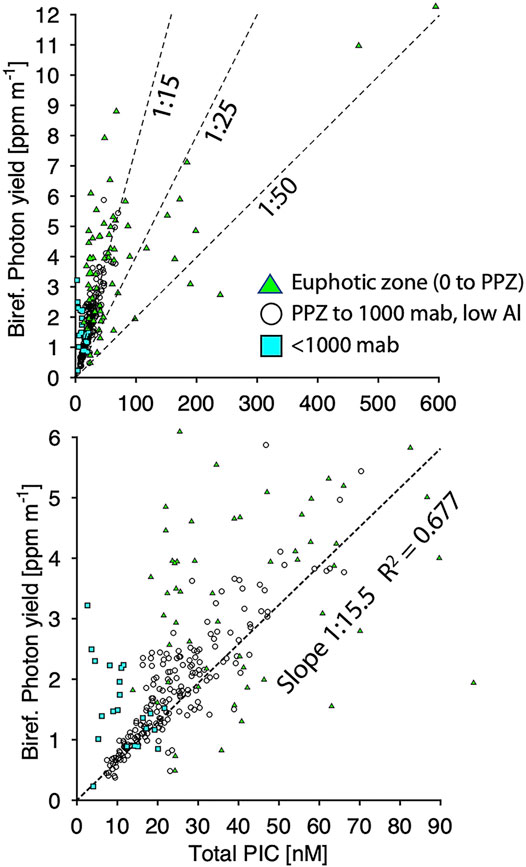
FIGURE 9. Plots of birefringent photon yield [ppm m-1] from PIC011 vs. PIC measured in pump samples from the same depth. Upper plot denotes the full range of data; the lower plot is magnified. Data from the surface to the depth of the euphotic zone (PPZ – defined as depth where fluorescence is 10% of maximum value) show a scatter in birefringence and PIC data with trends bracketed by slopes ranging from 1:7 to 1:50. Data for the water column below the PPZ depth extending to 2000 m are correlated with a slope of 1:15.4 and R2 = 0.677. The regression excluded the region from 2000 m to 1000 m above seafloor as these data were used to set the pressure coefficient of the sensor. Data within 1000 m of the seafloor both follow the midwater trend but also diverge to high positive birefringence values. Cases of individual profiles are shown in Figure 10.
Detailed Profile Comparisons From GP15
Figure 10A contrasts sensor and pump PIC profiles and other particle data at stations 19 and 21. Station 19 showed a birefringence maximum near 125 m for both McLane CTD (PIC011) and GTC CTD (PIC010). Sample spacing missed the maximum. Both beam attenuation coefficient and scattering registered a small secondary maximum at the depth of the fluorescence maximum at ∼110 m but were distinctly different from that of PIC birefringence. At both stations 19 and 21, PIC from samples and sensors agreed within 10–30 nM in shallow waters. Trends in the strongly oxygen-deficient waters below 100 m for both samples and sensors reproduced well.
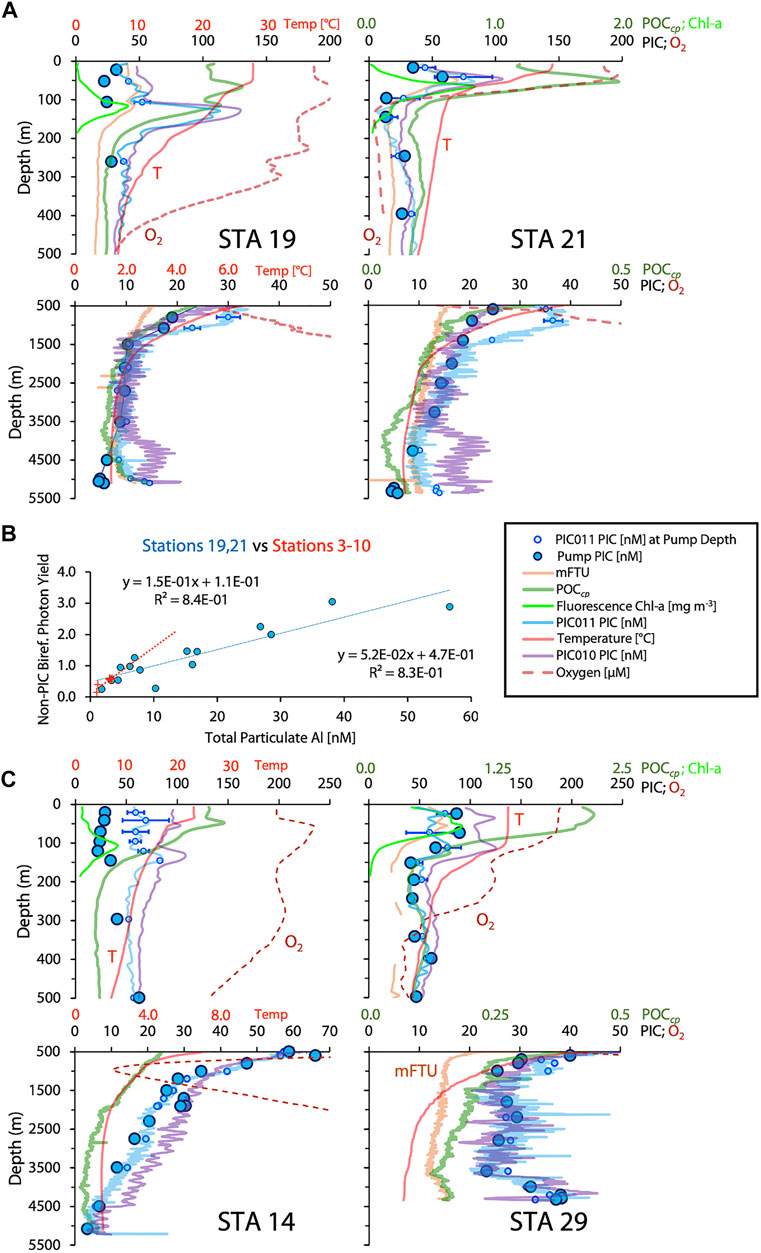
FIGURE 10. (A) Stations 19 and 21 profile data for birefringent photon yield converted to PIC from sensors PIC010 and PIC011 are shown with measured PIC values. Also shown are chlorophyll fluorescence, turbidity, POC calculated from beam attenuation coefficient, oxygen, and temperature. Upper panel is an expanded 0–500 m interval; the lower panel shows 500 m to the seafloor. Lowest PIC concentrations were found in strongly oxygen deficient waters the upper water column at station 21. The sharp peak near 120 m at station 19 is reproduced by both sensors and was not sampled by the pumps. The sensor PIC diverges from pump PIC within 1000 m of the seafloor which we infer is due to resuspended clay particles. (B) Regression of non-PIC birefringent photon yield versus particulate aluminum contrasts stations 19 and 21 with Stations 3 to 10. The latter stations are found in a sedimentary regime dominated by chlorite clays. Stations 19 and 21 are in a regime dominated by illite clays (Griffin, Windom, and Goldberg; 1968). (C) Data from stations 14 and 29, where sensors and measured PIC covary strongly from 500 m to the seafloor. In the upper 150m of the water column at station 14, both sensors indicate higher PIC levels than measured. At station 29, both sensors agree with measured PIC throughout the entire water column.
In waters deeper than 500 m, data from PIC011 were often high by ∼10 nM relative to PIC010 near 1,000 m. As mentioned above, sensor and samples diverged in the zone within 1,000 m of the seafloor. The small +5 nM excursion of data from PIC010 in the deepest waters is likely an artifact of single bit shifts of the 12 bit analog to digital conversion of the sensor data (1.25 mV is equivalent to a PIC value of ∼8 nM; the 0.3 mV analog resolution of PIC011 is equivalent to a PIC value of ∼3 nM).
We noted earlier that PIC estimated from sensor birefringent photon yield and measured PIC can diverge in waters within 1,000 m of the seafloor. The anomaly, or “non-PIC birefringence,” is calculated by subtracting sample PIC divided by 15.4 (nM ppm−1 m−1) from the birefringence measured by PIC011. We performed these calculations at stations 19 and 21 and also at stations 3–10 in the subarctic north Pacific, and plotted the results against particulate Al. Different but highly correlated trends were found for the two station groups (Figure 10B). This is consistent with Griffin, Windom, and Goldberg (1984) who showed that chlorite clays, with birefringence of 0.009, dominate marine sediments in the subarctic regime, while illite clays, with birefringence of 0.03, dominate sediments in the tropics. The two regression slopes 0.15 vs 0.052 (ppm m−1 nMAl−1) in Figure 10B are close to this ratio.
Figure 10C shows detailed profile data at super stations 14 and 29. In the upper 150 m at station 14, there was a tendency for the sensor PIC to exceed sample PIC by approximately 30 nM (PIC011) to 60 nM (PIC010). At station 29 at the equator, there was a near-perfect matchup of sensor and sample results. In waters from 500 m to the seafloor, the sensor and sample data were almost perfectly correlated.
Comparison of Satellite PIC, Pump PIC, and Sensor Birefringent Photon Yield for GP15
Figure 11A compares PIC retrieved from MODIS AQUA, MODIS TERRA, and VIIRS SNPP satellites—time interpolated to the GP15 transect (Satellite Data), near-surface McLane pump sample values, and birefringent photon yield from sensors PIC011 and PIC010. The left and right axis scales are in the ratio of ∼15:1 PIC:photon yield. In the subarctic north Pacific, measured PIC exceeds both sensor and satellite PIC by factors of 2–3. From the 37°N subarctic front (station 12) to 11°N (station 21), measured PIC and the lowest values of satellite-retrieved PIC follow each other well (VIIRS SNPP data seem high). South of 10°N satellite and sensor trends diverge in trend with satellite PIC consistently low at the equator, while sample PIC registers a high. South of 10°S, satellite retrievals exceed sample PIC by a factor of 2–3.
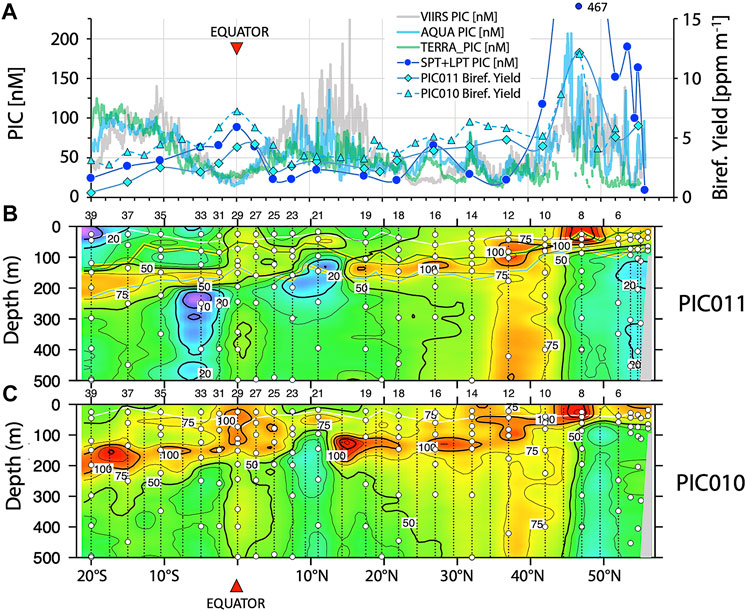
FIGURE 11. (A) Comparison of MODIS AQUA, TERRA, and VIRRS SNPP satellite retrievals of surface layer PIC concentrations, PIC from shallow McLane samples, and birefringent photon yield from sensors PIC010 and PIC011. (B) Transect section to 500 m of PIC calculated from PIC011 at McLane pump stations. The white line denotes mixed layer depth, the broad yellow/green curve denote the depth of maximum chlorophyll fluorescence. The lower broad curve denotes the base of the euphotic zone. Stations numbers are at the top axis of the section. (C) Transect section to 500 m from PIC010 deployed during GTC CTD casts. GTC casts were done at almost all of the 39 stations along the transect and thus the section has finer spatial resolution than (B). Both PIC010 and PIC011 display PIC minimum values in the low O2 zone at station 21.
Birefringent photon yield from both PIC011 and PIC010 matched satellite trends in the subarctic north Pacific (stations 3–10) but underestimated measured PIC. From the subarctic front into the north Pacific gyre (stations 12 and 14), sensor values exceeded sampled PIC by factors of 2–3. There was an excellent matchup at station 16 of all properties. From station 19 near 17°N to station 39 at 20°S, the sensors followed a trend of sampled PIC. PIC010 results generally are higher than those from PIC011.
Figure 11B shows the upper 500 m transect from PIC011 with additional detail of mixed layer depth, chlorophyll maximum depth, and estimated base of the euphotic zone. The subsurface birefringence maximum lies just above euphotic zone depths. Figure 11C shows 0–500 m transect data for PIC010 deployed during the GTC CTD profiling. The systematics of the section repeats Figure 11B but adds spatial resolution due to the more frequent sampling along the transect; PIC concentrations derived from PIC010 are generally 10–20 nM higher than values shown in Figure 11C. The minimum at station 21 is reproduced as is the relative minimum in the low oxygen waters at station 33.
CCE-LTER Process Study Transects of an Upwelled Filament
We deployed PIC011, transmissometer CST1450, and Seapoint turbidity sensors during 90 CTD casts during the June 2017, California Current Ecosystem Long-Term Ecological Research (CCE-LTER) process study of an offshore-flowing biologically productive filament of recently upwelled water. Here, we focus on data from three spatial transects across the filament during different stages of its evolution (Figure 3). Transects T1, T2, and T3 were occupied on year days (January 1 = 1) 159, 169, and 174, respectively, and thus represent early to late views of the filament during its evolution. Figure 12A shows sections of PIC derived by multiplying birefringent photon yield by the 15.4 multiplier from the GEOTRACES midwater calibration relationship; Figure 12B shows POC derived from transmissometer beam attenuation coefficient—scaled by 27. Figure 12C demonstrates that birefringent photon yield is largely independent of the beam attenuation coefficient (and turbidity, data not shown).
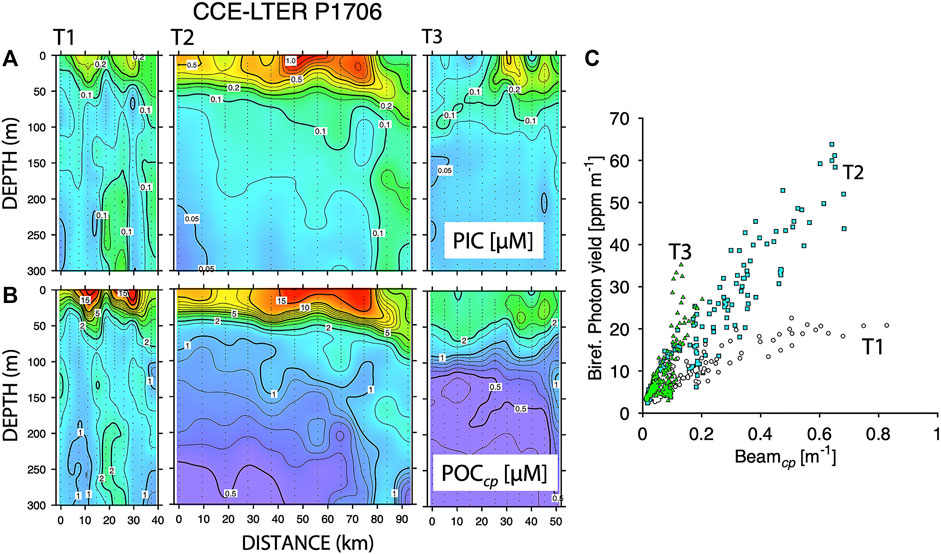
FIGURE 12. (A) PIC sections for the upper 300 m during transects T1, T2, and T3 across the biologically productive filament sampled during the June 1 to July 2 2017 CCE-LTER process study, P1706. (B) POC section calculated from transmissometer beam attenuation coefficient data for the same transects. (C) Plot of birefringent photon yield against beam attenuation coefficient for transects T1 (circles), T2 (cyan squares), and T3 (green triangles). Results indicate that particle birefringence is independent from beam attenuation coefficient.
The California Current regime is frequently cloud-covered. Temporal alignment of Transect T2 and satellites was excellent (Figure 3). Figure 13A shows PIC from VIIRS SNPP vs PIC estimated using surface layer values from PIC011. The agreement for satellite and PIC data is excellent over the first 30 km of the transect. Beyond this point, the sensor and retrieved data strongly diverge with satellite PIC dropping to less than 5% of the sensor estimate. The retrievals along the transect for days 168 and 169 (Figure 13B) and images in Figure 3 confirm the strong dropout of satellite-retrieved values. For comparison, Figures 13C,D show reasonable agreement between satellite POC and beam attenuation coefficient-derived POC estimates.
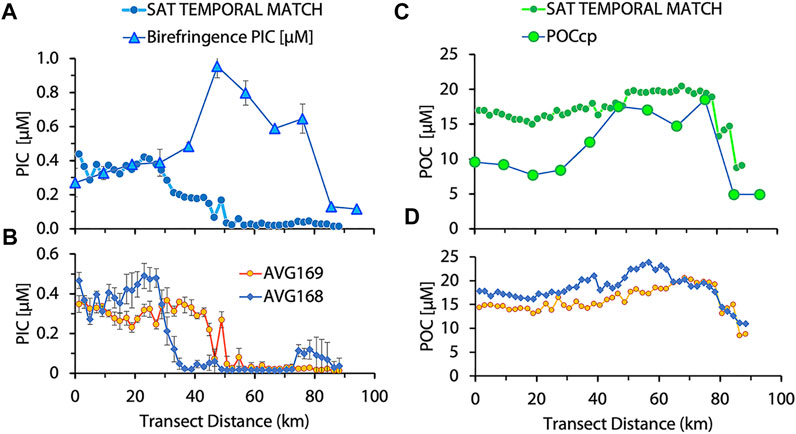
FIGURE 13. (A) Comparison of surface layer PIC concentrations derived from PIC011 along Transect T2 with time interpolation of PIC retrieved from VIIRS SNPP satellite data from days 168 and 169. (B) PIC retrieved from VIIRS SNPP satellite data from days 168 and 169. (C,D) similar comparisons for POC derived from transmissometer beam attenuation coefficient and satellite retrievals. In the case of PIC, the satellite retrieval of PIC agreed well along the first 30 km of the transect and then strongly diverged to near zero values while sensor PIC reached concentrations of ∼1 µM. Retrievals of POC from CTD casts and satellite data were far more in agreement.
Figure 14 shows that the relationship between PIC measured in bottle samples collected from the upper 110 m during Transect T1 and birefringent photon yield at the same depth follows a 15:1 relationship suggesting that application of the GEOTRACES 15.4 factor is a reasonable approximation and, furthermore, that the dropouts of retrieved satellite data seen at transect T2 are real.
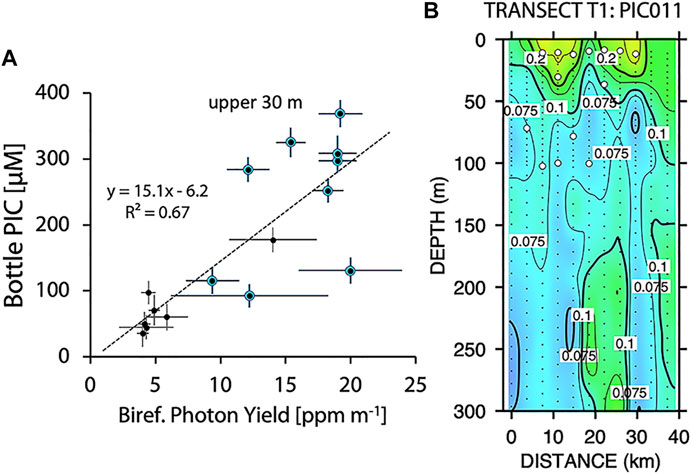
FIGURE 14. (A) Regression of PIC measured in 1 L bottle samples versus birefringent photon yield for samples from Transect T1. Data from the upper 30 m are highlighted in the plot. The regression slope is 15.1. (B) Transect T1 sections for PIC and POC. Sample depths are shown as white circles on the PIC transect.
Figure 15 contrasts optical profile results from the Santa Barbara Basin during the CCE-LTER process study. CTD cast 2 was made into strongly oxygen-deficient waters where O2 was less than 2 µM deeper than 500 m. Nitrate reduction was seen in waters deeper than 450 m. It is in this zone that the PIC optical proxy decreases with depth diverging from both beam attenuation coefficient and scattering which indicate increased particle concentrations in the water column. In contrast, the systematics of birefringent photon yield, beam attenuation coefficient, and scattering were in lockstep from 50 to 450 m. In shallow waters, the three sensors all showed increases into the euphotic zone but with different magnitudes.
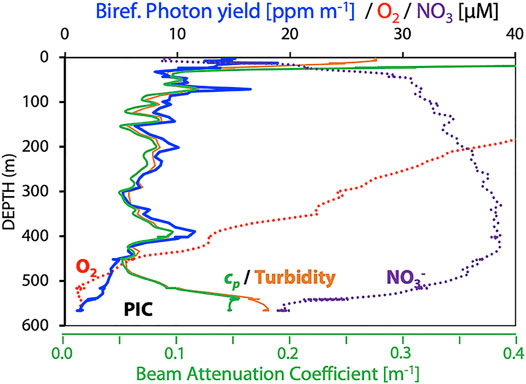
FIGURE 15. Comparisons of profiles of birefringent photon yield, turbidity, beam attenuation coefficient, oxygen, and nitrate at cast 2 in the Santa Barbara Basin. The data from the PIC sensor decreased strongly in the suboxic and nitrate-deficient layer below 500 m in contrast with both beam attenuation coefficient and turbidity which indicated higher particle concentrations in the nepheloid layer as the bottom was approached. The loss of PIC in strongly oxygen-deficient near bottom waters is consistent with behavior observed at 11°N during the GEOTRACES expedition.
Discussion
Particulate inorganic carbon (PIC) synthesis, export, and transport efficiency through the mesopelagic remain a critical but poorly observed component in the ocean carbon cycle, and there are multiple poorly understood feedbacks of PIC biological dynamics on the efficiency of export and transport of photosynthetically fixed organic carbon into the deep sea. In this study, we have presented an integrated assessment (in situ pump sampling to satellite observations) of twin near commercial CTD-deployed sensors that detect birefringent particles in the water column. The results show that the sensors can detect at parts per million resolution the photon yield from birefringent particles in the water column, and their concurrent deployment with in situ filtration sampling shows that the sensors capture PIC systematics over most of the water column during operational science programs on a global scale (the 2-month long GEOTRACES GP15 meridional transect that spanned 85° of latitude) to Lagrangian studies of a newly upwelled biologically productive filament spawned in California coastal waters as it advected offshore and aged over 30 days (CCE-LTER process study P1706).
Science Results
The birefringence sensors show that PIC profiles vary spatially in the ocean far below the euphotic zone. We have documented the systematics of PIC distributions along the GP15 transect. The sensors resolved deep euphotic zone maxima of particle birefringence that almost always were missed by filtration-based sampling. We confirmed that elevated PIC concentrations penetrate to depths of thousands of meters, both near the equator and near the subarctic front in the north Pacific. These features arise from the fragmentation of sinking particles and thus are an indicator of export. We have seen clear indications of dissolution loss of PIC in strongly oxygen-deficient waters near 11°N and in similar conditions in the near-bottom waters of the Santa Barbara Basin. A detailed scientific synthesis will be reported separately.
The new sensors were tested in some of the most particle-free waters in the world’s ocean and are able to detect concentration changes to better than 10 nM. The profiles from the two sensors closely reproduced each other and were distinctly different from beam attenuation coefficient and scattering optical proxies for particle concentration. Below the surface layer and to within 1,000 m of the seafloor birefringent photon yield, PIC concentrations were highly correlated.
In the subarctic north Pacific, near-surface concentrations from the sensor underestimated measured PIC concentrations by factors of 2–3. This underestimation may be due to packaging effects of living coccolithophores. Typically, a coccolithophore has 20 coccoliths arranged in a spherical pattern around the cell. If the cell is living, then cellular contents block transmitted light from interacting with over half of the attached coccoliths. This may explain the underestimation of PIC from sensor data. This does not explain overestimation of PIC concentrations in transitional surface waters.
Alternatively, there are a multitude of coccolithophore species found along the transect (Okada and Honjo, 1973; Honjo and Okada, 1974). They were observed during the August 23 to October 8, 1969 R/V Hakuho Maru transect where 19 stations were occupied from 50°N to 15°S along 155°W. Honjo and Okada found that the coccolithophorid Emiliania huxleyi completely dominated the surface 100 m of the subarctic north Pacific; south of 40°N, the species assemblage became increasingly diverse reaching a peak in the north Pacific Gyre where E. huxleyi became a minor component of the assemblage. In the equatorial zone, E. huxleyi accounted for ∼30% of the population. In the deepest euphotic zone waters below 150 m, the species assemblage was dominated by Florisphaera profunda and Thorosphaera flabellata, and it is likely that these species may dominate the PIC maximum seen in deep euphotic zone waters in our section. For these reasons, there is also likely to be a factor of two species-dependent effects on the sensor response. There is justification for co-deployment of sensors in programs such as those described by Balch et al. (2016) where careful attention to counts of living coccolithophores vs detached coccoliths and routine measurements of the acid-labile scattering proxy for PIC are made. Alternatively, laboratory-based studies of sensor response to growing cultures of different coccolithophore species are possible.
Clay minerals are never abundant in the surface layer, except in waters recently impacted by dust. Particulate aluminum data from GP15 show little evidence of terrigenous material except near the seafloor or near continental margin sources. Other weakly birefringent particles if numerous enough may explain cases where sensors overestimate PIC compared to sample PIC in the euphotic zone. Acantharia (celestite) are rarely present in concentrations matching PIC; for example, Sr concentrations in surface waters of the Cape Basin were lower than 20 nM, compared with PIC levels exceeding 100 nM (Bishop et al., 1978). Scaled by the respective ratio of birefringence (0.009–0.172), celestite particles would contribute less than 1% to the photon yield signal. Similarly, barites with birefringence of 0.012 rarely exceed concentrations of 1 nM and contribute less than one part per thousand to the signal. This leaves some species of large dinoflagellates (e.g., Ceratium; Balch et al., 2007) to explain the observed differences. Our spike filtering of the data would remove the contributions of large organisms from the profile.
In the deep water column, we have detected birefringent clay minerals. Our aluminum data revealed that the sensor response is strongly dependent on the specific clay minerals in suspension. Illite clays which dominate in tropical waters have much higher birefringence than chlorite clays which dominate in the sediments of the subarctic north Pacific. The sensor reproduced these differences. Sutton et al. (2014) showed aluminum influence on the birefringent photon yield of our first-generation sensor (PIC001) deployed in 2012 and 2013 at Line P stations in close proximity to the continental shelf of Vancouver Island. Our results confirm these findings.
Sensor Validation of Remote Sensing Retrievals of PIC
We have cross-compared satellite retrievals of PIC along the GP15 transect with near-surface sensor data. We found systematic agreement at stations from 55 to 11°N. At latitudes south of 11°N, the sensor PIC and sampled PIC covaried consistently, but the satellite retrievals became anticorrelated. In California coastal waters, we have shown that the satellite PIC retrieval scheme can strongly underestimate PIC by more than an order of magnitude compared with PIC measured in samples or estimated from sensor results.
During review, we were asked to comment on the new methodology described by Mitchell et al. (2017) who have updated the Balch et al. (2005) algorithm and also a new analysis of Terrats et al. (2020) who described a scheme to detect coccolithophore blooms using data from Bio-ARGO floats.
The Mitchell et al. (2017) scheme is in testing rather than production mode at NASA, and data are presently unavailable for our 2018 and 2017 study periods. We will compare the datasets when they become available.
Terrats et al. (2020) described a methodology that utilizes the ratio of scattering to beam attenuation coefficient, and alternatively, the ratio of scattering to chlorophyll fluorescence to detect coccolithophore blooms (PIC levels exceeding 1 µM) in surface waters using data from Bio Argo floats. The method capitalizes on the 15% higher refractive index (and scattering efficiency) of carbonate particles compared with phytoplankton. We have explored interrelationships among birefringence, scattering and beam attenuation coefficient, and chlorophyll fluorescence in euphotic zone waters sampled during CCE-LTER and found little sensitivity of the Terrats et al. (2020) proxies to PIC. Most likely, this is because surface waters were dominated by living phytoplankton and not detached coccoliths.
An advantage of our PIC sensor is that it discriminates against all non-birefringent particles and capitalizes on the fact that calcium carbonate birefringence exceeds other common biogenic minerals (SrSO4 and barite) by more than an order of magnitude and the fact that carbonates are far more abundant than these other phases. We have further demonstrated that the sensor does detect birefringent clay minerals in the nepheloid layer. In other words, the sensor only responds to the birefringent components of the total material in suspension. We feel that there is strong justification for its further development and have demonstrated its value in the validation of remote sensing proxies for PIC and in extending knowledge of PIC in the vertical to full ocean depths. Further deployments during GEOTRACES expeditions are justified.
Sensor Implementation on Autonomous Floats
Two versions of our birefringence sensors have already been deployed on Carbon Explorer (Bishop et al., 2002) floats in 2003 and again in 2013. In the former case, the polarizing cell was lost from the float’s PIC sensor within days of deployment. The float and sensor electronics functioned for their complete lifetime. In 2013, two Carbon Explorer floats were deployed at station P16 along Line P with sensors very similar to PIC010 and PIC011 but fitted with fluid-filled pressure-compensated polarizing cells (Supplementary Figure S2). They had been successfully CTD profiled a month prior to deployment (Supplementary Figure S1), but as the ship transited to the deployment location, one of the cells leaked fluid due to ship motion, and attempts by personnel at sea to rectify the problem failed. One Carbon Explorer successfully collected 100 profiles, but fouling of protruding fixtures from the sensor led to bad data after 40 days. It was this difficulty that led to the current design of the sensors.
Our ongoing work will interface the current class of sensors to the Carbon Flux Explorer (Bishop et al., 2016; Bourne et al., 2021). This float already determines the birefringent photon yield of sinking particles as they accumulate on an imaging stage. Implementation of the PIC sensor will enable simultaneous measurement of birefringent particles present in the water column and the sinking flux of birefringent material. Further analysis of “spikes” in concentration profiles may provide insight into the occurrence of foraminifera, pteropods, and other birefringent organisms.
Sensor Status and Needs
The birefringence-based optical proxy for PIC is new. We are still learning about it and working on how to improve its fidelity. Laboratory thermal cycling experiments demonstrate that the current generation of prototype sensors requires complex treatment of profile data. In our experiments, we were able to induce instrument temperature changes at rates from −0.6 to +0.6°C per minute. During water column profiling in the tropics, the sensors can experience rates of cooling or heating up to an order of magnitude greater than that achieved in the laboratory. Our first priority is to engineer the sensor to eliminate the hysteresis that can now be readily detected. The behavior of two co-manufactured sensors shows that thermal transients can generate leads and lags in the source and detector electronics. Our second priority is to compensate for variation of beam strength with temperature. We made a deliberate choice not to adopt the beam source monitoring approach used in commercial transmissometers until the sensor behavior at its basic level was understood. A third priority is to address sensor drift during operational deployments. During the GP15 transect, both sensors showed upward drift of their crossing blank. Furthermore, as they drifted, a pressure-dependent correction had to be applied to the profile data. It is not known whether the polarizers degraded or reacted with seawater over time, and this issue is under investigation. These three steps will transition the sensor from “specialist” to “routinely” deployable.
To conclude, this study demonstrates the potential value of a fast, readily deployable polarizing sensor that is capable of deployment from ship launched CTDs and autonomous floats. Expansion and enhancement of such autonomous observations of PIC profiles below the surface are critical for understanding and projecting the role of the biological carbon pump in the global carbon cycle.
Data Availability Statement
Data sets will be submitted to the Woods Hole Oceanographic Institution Biological and Chemical Oceanography Data Management Office (BCO-DMO) and in the interim will be made available by the authours, without undue reservation.
Author Contributions
JB was a lead investigator on all projects to develop the PIC sensor and is a senior author of this article. He led all aspects of data reduction from both GP15 and CCE-LTER expeditions, data synthesis, and interpretation; he oversaw at sea deployment of the sensors during the CCE-LTER expedition and provided shore to ship support during GP15. VA served as a primary contributor to the development of this manuscript, and analyzed GP15 pump samples for PIC. PL (co-chief scientist of the GP15 expedition) was a primary contributor to the paper, both maintaining and facilitating deployments of optical particle sensors at sea, led pump deployments, and shipboard sample processing and data synthesis. AB (project lead), AD (engineer), and CO (coordinator) did the difficult work of translating a sensor concept into a profiling sensor. TW (engineer) worked with JB throughout the development and deployments of the PIC sensor. Particulate aluminum data used in this article were measured by J-ML and AL.
Funding
The development of the PIC sensor has spanned two decades and was supported by the National Oceanographic Partnership Program (ONR N00014-99-F450), the United States Department of Energy Office of Science (Grant KP120203), NOAA (Office of Global Programs, 2000–2007), and NSF-OCE 0964888. NSF grant OCE 1538696 supported JB’s participation in the CEE-LTER process study and OCE 1637632 supported CCE-LTER ship time and science. JB’s synthesis, analysis, and workup of CCE-LTER and GP15 results were enabled by sabbatical leave in 2020. Currently, JB is supported by OCE 2123942. OCE 1736601 supported PL at sea as part of the United States GEOTRACES project; OCE 1657781 funded R/V Revelle ship time and core GEOTRACES activities. VA was supported by the NSF Graduate Research Fellowship Program and the UC Eugene Cota-Robles Fellowship.
Conflict of Interest
The authors declare that the research was conducted in the absence of any commercial or financial relationships that could be construed as a potential conflict of interest.
Publisher’s Note
All claims expressed in this article are solely those of the authors and do not necessarily represent those of their affiliated organizations, or those of the publisher, the editors, and the reviewers. Any product that may be evaluated in this article, or claim that may be made by its manufacturer, is not guaranteed or endorsed by the publisher.
Acknowledgments
We thank the captain, crew members, and scientific parties aboard R/V Revelle cruises 1710, 1814, and 1815. We thank Mark Ohman (Scripps) for enabling our participation in CCE-LTER studies. We thank Jill Sutton (University of Brest) who pointed out early on the role of resuspended terrigenous particles in influencing birefringence signals in the coastal regime along Line P; Hannah Bourne provided the PIC analyses from CCE-LTER transect 1. Thorsten Stezelberger (LBNL) facilitated access and use of the thermal cycling test facility. Our seagoing work was aided by the personnel and resources of LBNL’s Geosciences Measurement Facility. Estimates of euphotic zone depth for GP15 were provided by Jennifer Kenyon (MIT/WHOI Joint Program in Oceanography). We acknowledge the contributions of Seabird engineers, Wes Strubhar, Dan Whiteman, and Tracy Hahn. A multitude of UC Berkeley undergraduates have aided this project both in the laboratory and at sea.
Supplementary Material
The Supplementary Material for this article can be found online at: https://www.frontiersin.org/articles/10.3389/frsen.2022.837938/full#supplementary-material
References
Antoine, D., Andre, J.-M., and Morel, A. (1996). Oceanic Primary Production, 2. Estimation at Global Scale from Satellite (Coastal Zone Color Scanner) Chlorophyll, Global Biogeochem. Cycles 10, 57–69. doi:10.1029/95gb02832
Armstrong, R. A., Lee, C., Hedges, J. I., Honjo, S., and Wakeham, S. G. (2002). A New Mechanistic Model for Organic Carbon Fluxes in the Ocean Based on Quantitative Association of POC with Ballast Minerals. Deep-Sea Res. 49, 219–236. doi:10.1016/s0967-0645(01)00101-1
Balch, W., and Fabry, V. (2008). Ocean Acidification: Documenting its Impact on Calcifying Phytoplankton at Basin Scales. Mar. Ecol. Prog. Ser. 373, 239–247. doi:10.3354/meps07801
Balch, W. M., Bates, N. R., Lam, P. J., Twining, B. S., Rosengard, S. Z., Bowler, B. C., et al. (2016). Factors Regulating the Great Calcite Belt in the Southern Ocean and its Biogeochemical Significance. Glob. Biogeochem. Cycles 30, 1124–1144. doi:10.1002/2016GB005414
Balch, W. M., Drapeau, D. T., Bowler, B. C., Lyczskowski, E., Booth, E. S., and Alley, D. (2011b). The Contribution of Coccolithophores to the Optical and Inorganic Carbon Budgets during the Southern Ocean Gas Exchange Experiment: New Evidence in Support of the “Great Calcite Belt” Hypothesis. J. Geophys. Res. 116, C00F06. doi:10.1029/2011JC006941
Balch, W. M., Gordon, H. R., and Bowler, B. C. (2005). Calcium Carbonate Measurements in the Surface Global Ocean Based on Moderate-Resolution Imaging Spectroradiometer Data. J. Geophys. Res. 110 (C7), C07001. doi:10.1029/2004JC002560
Balch, W. M., Poulton, A. J., Drapeau, D. T., Bowler, B. C., Windecker, L. A., and Booth, E. S. (2011a). Zonal and Meridional Patterns of Phytoplankton Biomass and Carbon Fixation in the Equatorial Pacific Ocean, between 110°W and 140°W. Deep Sea Res. Part Topical Stud. Oceanography 58, 400–416. doi:10.1016/j.dsr2.2010.08.004
Berelson, W. M., Balch, W. M., Najjar, R., Feely, R. A., Sabine, C., and Lee, K. (2007). Relating Estimates of CaCO3 Production, Export, and Dissolution in the Water Column to Measurements of CaCO3 Rain into Sediment Traps and Dissolution on the Sea Floor: A Revised Global Carbonate Budget. Glob. Biogeochem. Cycles 21, GB1024. doi:10.1029/2006GB002803
Bianchi, D., Stock, C., Galbraith, E. D., and Sarmiento, J. L. (2013). Diel Vertical Migration: Ecological Controls and Impacts on the Biological Pump in a One-Dimensional Ocean Model. Glob. Biogeochem. Cycles 27, 478–491. doi:10.1002/gbc.20031
Bishop, J. (2009). Autonomous Observations of the Ocean Biological Carbon Pump. Oceanog. 22 (2), 182–193. doi:10.5670/oceanog.2009.48
Bishop, J. K. B., Davis, R. E., and Sherman, J. T. (2002). Robotic Observations of Dust Storm Enhancement of Carbon Biomass in the North Pacific. Science 298, 817–821. doi:10.1126/science.1074961
Bishop, J. K. B., Fong, M. B., and Wood, T. J. (2016). Robotic Observations of High Wintertime Carbon Export in California Coastal Waters. Biogeosciences 13 (10), 3109–3129. doi:10.5194/bg-13-3109-2016
Bishop, J. K. B., Ketten, D. R., and Edmond, J. M. (1978). The Chemistry, Biology and Vertical Flux of Particulate Matter from the Upper 400 M of the Cape Basin in the Southeast Atlantic Ocean. Deep Sea Res. 25, 1121–1161. doi:10.1016/0146-6291(78)90010-3
Bishop, J. K. B., Lam, P. J., and Wood, T. J. (2012). Getting Good Particles: Accurate Sampling of Particles by Large Volume In-Situ Filtration. Limnol. Oceanogr. Methods 10, 681–710. doi:10.4319/lom.2012.10.681
Bishop, J. K. B., and Wood, T. J. (2008). Particulate Matter Chemistry and Dynamics in the Twilight Zone at VERTIGO ALOHA and K2 Sites. Deep Sea Res. Oceanographic Res. Pap. 55, 1684–1706. doi:10.1016/j.dsr.2008.07.012
Bourne, H. L., Bishop, J. K. B., Connors, E. J., and Wood, T. J. (2021). Carbon Export and Fate Beneath a Dynamic Upwelled Filament off the California Coast. Biogeosciences 18, 3053–3086. doi:10.5194/bg-18-3053-202172
Boyd, P. W., Claustre, H., Levy, M., Siegel, D. A., and Weber, T. (2019). Multi-faceted Particle Pumps Drive Carbon Sequestration in the Ocean. Nature 568, 327–335. doi:10.1038/s41586-019-1098-2
Boyd, P. W., and Trull, T. W. (2007). Understanding the Export of Biogenic Particles in Oceanic Waters: Is There Consensus. Prog. Oceanography 72 (4), 276–312. doi:10.1016/j.pocean.2006.10.007
Buesseler, K. O., Boyd, P. W., Black, E. E., and Siegel, D. A. (2020). Metrics that Matter for Assessing the Ocean Biological Carbon Pump. Proc. Natl. Acad. Sci. USA 117 (18), 9679–9687. doi:10.1073/pnas.1918114117
Buesseler, K. O., and Boyd, P. W. (20092009). Shedding Light on Processes that Control Particle Export and Flux Attenuation in the Twilight Zone of the Open Ocean. Limnol. Oceanogr. 54 (4), 1210–1232. doi:10.4319/lo.2009.54.4.1210
Buesseler, K. O., Lamborg, C. H., Boyd, P. W., Lam, P. J., Trull, T. W., Bidigare, R. R., et al. (2007). Revisiting Carbon Flux Through the Ocean's Twilight Zone. Science 316, 567–570. doi:10.1126/science.1137959
Burd, A. B., Hansell, D. A., Steinberg, D. K., Anderson, T. R., Arístegui, J., Baltar, F., et al. (2010). Assessing the Apparent Imbalance Between Geochemical and Biochemical Indicators of Meso- and Bathypelagic Biological Activity: What the @$♯! Is Wrong with Present Calculations of Carbon Budgets. Deep Sea Res. Part Topical Stud. Oceanography 57 (16), 1557–1571. doi:10.1016/j.dsr2.2010.02.022
Cachon, J., Sato, H., Cachon, M., and Sato, Y. (1989). Analysis by Polarizing Microscopy of Chromosomal Structure Among Dinoflagellates and its Phylogenetic Involvement. Biol. Cel. 65, 51–60. doi:10.1111/j.1768-322x.1989.tb00770.x
Dickey, T., Lewis, M., and Chang, G. (2006). Optical Oceanography: Recent Advances and Future Directions Using Global Remote Sensing and In Situ Observations. Rev. Geophys. 44, RG1001. doi:10.1029/2003RG000148
Dunne, J. P., Armstrong, R. A., Gnanadesikan, A., and Sarmiento, J. L. (2005). Empirical and Mechanistic Models for the Particle Export Ratio. Glob. Biogeochem. Cycles 19 (4), na. doi:10.1029/2004GB002390
Falkowski, P. G., Barber, R. T., and Smetacek, V. (1998). Biogeochemical Controls and Feedbacks on Ocean Primary Production. Science 281, 200–206. doi:10.1126/science.281.5374.200
Feely, R. A., Sabine, C. L., Lee, K., Berelson, W., Kleypas, J., Fabry, V. J., et al. (2004). Impact of Anthropogenic CO 2 on the CaCO 3 System in the Oceans. Science 305, 362–366. doi:10.1126/science.1097329
Field, C. B., BehrenfeldRanderson, M. J. J. T., Randerson, J. T., and Falkowski, P. (1998). Primary Production of the Biosphere: Integrating Terrestrial and Oceanic Components. Science 281, 237–240. doi:10.1126/science.281.5374.237
GEOTRACES (2017). in Sampling and Sample-Handling Protocols for GEOTRACES Cruises. Editors G. Cutter, K. Casiotti, P. Croot, W. Geibert, L.-E. Heimberger, M. Lohanet al. 178. Available at: https://www.geotraces.org/methods-cookbook/.
Griffin, J. J., Windom, H., and Goldberg, E. D. (1968). The Distribution of clay Minerals in the World Ocean. Deep Sea Res. Oceanographic Abstr. 15, 433–459. doi:10.1016/0011-7471(68)90051-x
Guay, C. K. H., and Bishop, J. K. B. (2002). A Rapid Birefringence Method for Measuring Suspended CaCO3 Concentrations in Seawater. Deep Sea Res. Part Oceanographic Res. Pap. 49, 197–210. doi:10.1016/s0967-0637(01)00049-8
Henson, S. A., Sanders, R., Madsen, E., Morris, P. J., Le Moigne, F., and Quartly, G. D. (2011). A Reduced Estimate of the Strength of the Ocean's Biological Carbon Pump. Geophys. Res. Lett. 38, a–n. doi:10.1029/2011GL046735
Honjo, S. (1976). Coccoliths: Production, Transportation and Sedimentation. Mar. Micropaleontology 1, 65–79. doi:10.1016/0377-8398(76)90005-0
Honjo, S., Dymond, J., Collier, R., and Manganini, S. J. (1995). Export Production of Particles to the Interior of the Equatorial Pacific-Ocean during the 1992 Eqpac experiment. Deep- Sea Res. Part. 42 (2–3), 831–870. doi:10.1016/0967-0645(95)00034-n
Honjo, S., and Okada, H. (1974). Community Structure of Coccolithophores in the Photic Layer of the Mid-Pacific. Micropaleontology 20 (2), 209–230. doi:10.2307/1485061
Hu, C., Lee, Z., and Franz, B. (2012). Chlorophyll a Algorithms for Oligotrophic Oceans: A Novel Approach Based on Three-Band Reflectance Difference. J. Geophys. Res. 117, C01011. doi:10.1029/2011JC007395
IOCCG (2011). in Bio-Optical Sensors on Argo Floats. Reports of the International Ocean-Colour Coordinating Group, No. 11. Editor H. Claustre (Dartmouth, Canada: IOCCG).
Lam, P. J., Doney, S. C., and Bishop, J. K. B. (2011). The Dynamic Ocean Biological Pump: Insights from a Global Compilation of Particulate Organic Carbon, CaCO3, and Opal Concentration Profiles from the Mesopelagic. Glob. Biogeochem. Cycles 25, a–n. doi:10.1029/2010GB003868
Lam, P. J., Lee, J.-M., Heller, M. I., Mehic, S., Xiang, Y., and Bates, N. R. (2018). Size-fractionated Distributions of Suspended Particle Concentration and Major Phase Composition from the U.S. GEOTRACES Eastern Pacific Zonal Transect (GP16). Mar. Chem. 201, 90–107. doi:10.1016/j.marchem.2017.08.013
Lam, P. J., Ohnemus, D. C., and Auro, M. E. (2015). Size-fractionated Major Particle Composition and Concentrations from the US GEOTRACES North Atlantic Zonal Transect. Deep Sea Res. Part Topical Stud. Oceanography 116 (0), 303–320. doi:10.1016/j.dsr2.2014.11.02010.1016/j.dsr2.2014.11.020
Li, Z., and Cassar, N. (2016). Satellite Estimates of Net Community Production Based on O2/Ar Observations and Comparison to Other Estimates. Glob. Biogeochem. Cycles 30, 735–752. doi:10.1002/2015GB005314
Mitchell, C., Hu, C., Bowler, B., Drapeau, D., and Balch, W. M. (2017). Estimating Particulate Inorganic Carbon Concentrations of the Global Ocean from Ocean Color Measurements Using a Reflectance Difference Approach. J. Geophys. Res. Oceans 122, 8707–8720. doi:10.1002/2017JC013146
Okada, H., and Honjo, S. (1973). The Distribution of Oceanic Coccolithophorids in the Pacific. Deep Sea Res. Oceanographic Abstr. 20, 355–374. doi:10.1016/0011-7471(73)90059-4
Orr, J. C., Fabry, V. J., Aumont, O., Bopp, L., Doney, S. C., Feely, R. A., et al. (2005). Anthropogenic Ocean Acidification Over the Twenty-First Century and its Impact on Calcifying Organisms. Nature 437, 681–686. doi:10.103810.1038/nature04095
Sabine, C. L., Feely, R. A., Gruber, N., Key, R. M., Lee, K., Bullister, J. L., et al. (2004). The Oceanic Sink for Anthropogenic CO 2. Science 305, 367–371. doi:10.1126/science.1097403
Schlitzer, R. (2021). Ocean Data View. Avilable at: https://odv.awi.de.
Siegel, D. A., Buesseler, K. O., Behrenfeld, M. J., Benitez-nelson, C. R., Boss, E., Brzezinski, M. A., et al. (2016). Prediction of the Export and Fate of Global Ocean Net Primary Production: The EXPORTS Science Plan. Front. Mar. Sci. 3 (March), 1–10. doi:10.3389/fmars.2016.00022
Siegel, D. A., Buesseler, K. O., Doney, S. C., Sailley, S. F., Behrenfeld, M. J., and Boyd, P. W. (2014). Global Assessment of Ocean Carbon export by Combining Satellite Observations and Food-Web Models. Glob. Biogeochem. Cycles 28, 181–196. doi:10.1002/2013GB004743
Stramski, D., Reynolds, R. A., Babin, M., Kaczmarek, S., Lewis, M. R., Röttgers, R., et al. (2008). Relationships Between the Surface Concentration of Particulate Organic Carbon and Optical Properties in the Eastern South Pacific and Eastern Atlantic Oceans. Biogeosciences 5, 171–201. doi:10.5194/bg-5-171-2008
Sutton, J. N., Bishop, J. K., Martinez, E. J., Derr, A., and Wood, T. (2014). Real-Time and High Resolution Measurement of Particulate Inorganic Carbon Content in the Northeast Subarctic Pacific Ocean. AGU/ALSO Ocean Sci. Meet. Session S139, 2.
Terrats, L., Claustre, H., Cornec, M., Mangin, A., and Neukermans, G. (2020). Detection of Coccolithophore Blooms with BioGeoChemical‐Argo Floats. Geophys. Res. Lett. 47, e2020GL090559. doi:10.1029/2020GL090559
Turner, J. T. (2015). Zooplankton Fecal Pellets, marine Snow, Phytodetritus and the Ocean's Biological Pump. Prog. Oceanography 130, 205–248. doi:10.1016/j.pocean.2014.08.005
Wyrtki, K., and Kilonsky, B. (1984). Mean Water and Current Structure During the Hawaii-to-Tahiti Shuttle Experiment. J. Phys. Oceanogr. 14, 242–254. doi:10.1175/1520-0485(1984)014<0242:mwacsd>2.0.co;2
Xiang, Y., and Lam, P. J. (2020). Size-Fractionated Compositions of Marine Suspended Particles in the Western Arctic Ocean: Lateral and Vertical Sources. J. Geophys. Res. Oceans 125, e2020JC016144. doi:10.1029/2020jc016144
Keywords: birefringence sensor, particulate inorganic carbon, satellite remote sensing, ocean watercolumn, GEOTRACES
Citation: Bishop JKB, Amaral VJ, Lam PJ, Wood TJ, Lee J-M, Laubach A, Barnard A, Derr A and Orrico C (2022) Transmitted Cross-Polarized Light Detection of Particulate Inorganic Carbon Concentrations and Fluxes in the Ocean Water Column: Ships to ARGO Floats. Front. Remote Sens. 3:837938. doi: 10.3389/frsen.2022.837938
Received: 17 December 2021; Accepted: 19 January 2022;
Published: 08 March 2022.
Edited by:
Kirk D Knobelspiesse, National Aeronautics and Space Administration, United StatesReviewed by:
Bob Brewin, University of Exeter, United KingdomShuguo Chen, Ocean University of China, China
Copyright © 2022 Bishop, Amaral, Lam, Wood, Lee, Laubach, Barnard, Derr and Orrico. This is an open-access article distributed under the terms of the Creative Commons Attribution License (CC BY). The use, distribution or reproduction in other forums is permitted, provided the original author(s) and the copyright owner(s) are credited and that the original publication in this journal is cited, in accordance with accepted academic practice. No use, distribution or reproduction is permitted which does not comply with these terms.
*Correspondence: James K. B. Bishop, amtiaXNob3BAYmVya2VsZXkuZWR1
 James K. B. Bishop
 Vinicius J. Amaral
 Phoebe J. Lam
 Todd J. Wood2
 Allison Laubach
 Andrew Barnard