 Shannon M. Healy
 Alia L. Khan
- Department of Environmental Science, College of the Environment, Western Washington University, Bellingham, WA, United States
The glaciers of the North Cascades have experienced mass loss and terminus retreat due to climate change. The meltwater from these glaciers provides a flux of cold glacier meltwater into the river systems, which supports salmon spawning during the late summer dry season. The Nooksack Indian Tribe monitors the outlet flow of the Sholes Glacier within the North Cascades range with the goal of understanding the health of the glacier and the ability of the Tribe to continue to harvest sustainable populations of salmon. This study compares the UAV derived glacier ablation with the discharge data collected by the Tribe. We surveyed the Sholes Glacier twice throughout the 2020 melt season and, using Structure-from-Motion technology, generated high resolution multispectral orthomosaics and Digital Elevation Models (DEMs) of the glacier on each of the survey dates. The DEMs were differenced to reveal the surface height change of the glacier. The spectral data of the orthomosaics were used to conduct IsoData unsupervised classification. This process divided the survey area into Snow, Ice, and Rock classes that were then used to attribute the surface height changes of the DEMs to either snow or ice melt. The analysis revealed the glacier lost an average thickness of −0.132 m per day (m d−1) with snow and ice losing thickness at similar rates, −0.130 m d−1 and −0.132 m d−1 respectively. DEM differencing reveals that a total of −550,161 ± 45,206 m3 water equivalent (w.e.) was discharged into Wells Creek between the survey dates whereas the stream gauge station measured a total discharge of 350,023 m3. This study demonstrates the ability to spectrally classify the UAV data and derive discharge measurements while evaluating the small-scale spatial variability of glacier melt. Assessing ablation in small alpine glaciers is of great importance to downstream communities, like the Nooksack Indian Tribe who seek to understand the magnitude and timing of glacier melt in order to better protect their salmon populations. With this paper, we provide a baseline for future glacier monitoring and the potential to connect the snow surface properties with the rate of snow melt into a warming future.
Introduction
The North Cascades is the most heavily glaciated region in the contiguous United States, providing water to support the regional agricultural and hydroelectric industries. The meltwater from the glaciers in this area create the cold-water ecological habitat that fish and other riparian species depend upon. Increasing air temperatures have had great effects on glaciers across the cryosphere, including in the North Cascades where all 47 of the monitored glaciers have experienced terminus retreat as of 1991 (Pelto and Riedel, 2001). This decrease in size is associated with a 25% reduction in the late summer streamflow that salmon depend on for prosperous spawning (Riedel and Larrabee, 2016).
Mount Baker, a heavily glaciated stratovolcano within the North Cascades range, is of particular importance to both human and salmon populations downstream. The Sholes Glacier is located on the northeast flank of Mount Baker within the Indigenous territory of the Nooksack Indian Tribe. The meltwater from this glacier feeds into the North Fork Nooksack River where glacier runoff typically contributes over 25% of summer discharge (Bach, 2002) and as much as 60–90% during especially hot and dry summers, such as in 2015 (Pelto, 2016; Grah, 2019). The addition of glacier melt into the watershed supports the rich agricultural land downstream in Whatcom County and provides an influx of cold glacier melt water in the late summer dry season that sustains salmon habitat, which are of particular importance to the Nooksack and Lummi Tribes. The Sholes Glacier has experienced terminus recession of approximately 1,400 m since the end of the Little Ice Age in the late 1890’s (Grah, 2019).
Many glaciers are physically inaccessible for mass balance field studies and if accessible, require considerable time and specialized glacier travel skills. Satellite remote sensing of glacier mass balance and surface properties can ease the logistical challenge of glacier travel, and if publicly available, lessen the cost to researchers. However, satellite images are often thwarted by sensor spatial and temporal resolution, as well as shadows of steep surrounding mountains causing satellite imagery to be an inadequate tool in examining small, high alpine glaciers (Gaffey and Bhardwaj, 2020). Satellite coverage in many areas of the cryosphere is limited in repeat pass over rates and when the satellite does pass over the region, there is high likelihood of clouds, reducing the number of usable satellite images (Wigmore and Mark, 2017). Additionally, the few satellites that offer stereo images can be difficult to acquire (Bhattacharya et al., 2021) and do not offer sufficient temporal resolution to assess the rapid elevation changes caused by climate change.
With the recent advances in Uncrewed Aerial Vehicle (UAV) technology and the reduction in the price of this technology, there is huge potential for improving the spatial and temporal resolution of ablation data with limited field effort or cost. The availability and affordability of UAV technology has spurred interest in the field of glacier dynamics, with numerous studies applying UAV derived data to assess glacier dynamics at high spatial resolutions. Researchers have employed UAVs as tools to assess glacier calving (Ryan et al., 2015; van Dongen et al., 2021), track glacier motion (Immerzeel et al., 2014; Che et al., 2020), and measure mass loss (Bash et al., 2018; Fugazza et al., 2018; Bash and Moorman, 2020) in remote regions. The majority of UAV-based cryosphere studies have been focused in Antarctica (Westoby et al., 2015; Westoby et al., 2016; Florinsky and Bliakharskii, 2019), the polar regions (Ewertowski et al., 2016; Tonkin et al., 2016; Bernard et al., 2017a; Bernard et al., 2017b; Cimoli et al., 2017), the European Alps (Mauro et al., 2015; Boesch et al., 2016; De Michele et al., 2016; Fugazza et al., 2018; Rossini et al., 2018; Vivero and Lambiel, 2019), and High Mountain Asia (Immerzeel et al., 2014; Brun et al., 2016; Kraaijenbrink et al., 2016; Vincent et al., 2016; Brun et al., 2018). However, to the authors knowledge, no previous peer reviewed studies have utilized the UAV to assess glacier dynamics in the Pacific Northwest.
The use of Structure-from-Motion (SfM) technology in reconstructing glacier surfaces has been extensively validated (e.g., Bash et al., 2020). UAV-based measurements of snow depth change have even been shown to exceed the accuracy of traditional in situ methods (Fernandes et al., 2018). Additionally, photogrammetric approaches have outperformed systematic in situ methods of measuring snow depth when assessing small scale spatial variability (Redpath et al., 2018). Monitoring the rapid retreat of small mountain glaciers has been greatly enhanced by the use of UAVs, allowing researchers to capture the heterogeneity of glacier change that would not be possible through the analysis of satellite imagery (Wigmore and Mark, 2017). While the abilities of SfM have been tested thoroughly elsewhere in the world, they have never been tested in the Mount Baker region where there is an associated long-term glacier discharge dataset to draw comparisons. The Sholes Glacier is unique in that it is the only glacier in the North Fork Nooksack River watershed that has been studied in detail over a relatively long period of time using both glaciological and hydrological methods, allowing for validation and comparison of methodologies.
The Nooksack Indian Tribe, located in Deming, WA within the Nooksack River watershed, has been monitoring the mass balance and outlet flow of the Sholes Glacier weekly during the late summer snow and ice melt season since 2012. The Tribe is interested in understanding the glacier’s health and behavior to assess the Tribe’s ability to continue to harvest sustainable populations of salmon. The Tribe measures the glacier discharge as well as snow and ice depth changes throughout the melt season. The natural weir at the toe of the glacier makes this specific glacier an ideal study site for mass balance work and glacier runoff observations (Supplementary Image S1).
There is movement in the scientific community towards developing more co-produced science that incorporates local communities and Tribal Nations who have a vested interest in understanding the vulnerability of their ecosystems to climate change (e.g., Lemos et al., 2012; Wynecoop et al., 2019; Turnhout et al., 2020; Oshun et al., 2021). The Nooksack Indian Tribe has generously shared their 2020 season data for this study in the interest of scientific collaboration.
Here we compare the glacier mass balance assessment of the Nooksack Indian Tribe with a SfM UAV-based approach. This study shows that the UAV can be used to derive glacier ablation and estimate the volume of water moving from the glacier into the Nooksack River. Additionally, we present the use of multispectral imagery collected from a UAV to differentiate snow and ice area of the glacier surface.
Materials and Methods
Study Area
The Sholes Glacier is located on the northeast flank of Mount Baker in the Mount Baker Wilderness area of the Mount Baker-Snoqualmie National Forest, Washington, United States (-121.7700032°W, 48.8141614°N). The glacier resides in a temperate maritime climate associated with mild year-round temperatures, high winter precipitation, and low summer precipitation. The glacier is predominantly fed by direct accumulation and wind drifting with minimal loss due to calving or avalanching events (Pelto, 2018). The glacier has a northern aspect and spans 0.56 km2, descending from an elevation of 1,900 to 1,600 m above sea level. The glacier melt drains out of two streams at the toe of the glacier, Wells Creek and Sholes Creek, both of which feed into the North Fork Nooksack River.
The Nooksack River watershed is primarily rainwater and snowmelt dominated for the majority of the year. During the mid to late summer months, the area is quite dry, and the river system is supplemented by the flow of cold snow and glacier meltwater from May through September, which contributes over 25% of daily discharge to the watershed (Bach, 2002) and as high as 60–90% during particularly hot dry periods in the summer, such as in 2015 (Grah, 2019; Pelto, 2016).
UAV Surveys
The Sholes Glacier was surveyed twice throughout the melt season with permission from the U.S. Forest Service, once on August 17, 2020 and again on September 5, 2020. The surveys were conducted using a DJI Phantom 3 Standard quadcopter equipped with the inherent, off-the-shelf DJI camera, as well as an additional MAPIR Survey3 three-band multispectral camera. The DJI camera was set to capture images every 2 s with ISO set at 100 and shutter speed set at 1/8,000 s. The MAPIR camera captures imagery in the red (660 nm), green (550 nm), and near-infrared (850 nm) wavelengths (www.mapir.camera). This camera captured RAW (12 bit) and JPG (24 bit) images every 2 s with an ISO set at 100 and a 1/2000 shutter speed. Prior to take off for each survey flight, an image of the MAPIR camera calibration panel was taken to later convert the MAPIR imagery to reflectance values.
The UAV was powered with DJI LiPo 4S 15.2 V batteries. Only 4 batteries were available on the August 17 flight, while 6 batteries were available on the September 5 flight. Each battery provided approximately 20 min of flight time. Therefore, there is slightly more coverage on the September 5 flight compared to the August 17 flight.
Prior to each flight, 13 ground control points (GCPs) were laid out over the glacier. The GCP coordinates were acquired with an EMLID Reach RS2 RTK GNSS receiver, or rover, and corrected with another stationary receiver, or base, both of which logged continuously throughout the survey. The base receiver was stationed adjacent to the glacier, within 1 km of the rover, where it could have a clear view of the sky. Data logs of the base station were post-processed against the rover in the open-source RTKLIB software in kinematic mode (Takasu and Yasuda, 2009).
The UAV flight plan was created and executed in DroneDeploy. The glacier was flown in six flight segments with 75% sidelap and 75% frontlap at an above ground altitude of 73 m. The flights were completed between 12:00 and 16:00 Pacific Time. Both surveys were conducted following the same flight line angle to minimize shadow differences between the flights (Fernandes et al., 2018). Due to the large survey area and the constraint of flight time per battery, the six flight segments were conducted from three different launch locations located progressively towards the glacier terminus.
Image Processing
The DJI and MAPIR images were refined to only include in-survey images. Images acquired during take-off, landing, and transit were removed from the analysis. The raw MAPIR survey images were processed and calibrated to reflectance using the MAPIR Camera Control software and the calibration target images that were captured pre-flight. The resulting MAPIR images represent the calibrated surface reflectance values and were used in the rest of the imagery processing steps.
The DJI and MAPIR images were processed separately. The images for each camera were grouped by their take-off location and the altitudes were adjusted with an open-source Python script to represent meters above sea level based on the launch elevation and the flight altitude (Agisoft, 2017). The flights were then loaded into Agisoft Metashape software where the Image Quality, or sharpness, was estimated and blurry images, defined as those with a quality below 0.5, were removed from the rest of the analysis to improve photogrammetric processing following the guidelines in the Agisoft Metashape Professional Edition User Manual (Agisoft, 2021). Each flight subsection was aligned separately with high accuracy, 500,000 key point limit, and 0 tie point limit. All points with a reprojection error greater than 0.5 pixels and any obvious outlier points were removed from the sparse point cloud.
The GCPs and ground validation points (GVPs) were manually marked in at least 6 images where the target was most visible. The target coordinates were loaded, and the sparse point cloud was updated. The camera positions were optimized before constructing the dense point cloud with high quality and aggressive depth filtering. The DEM was constructed based on the dense point cloud and the orthomosaic was constructed based on the DEM.
Through the process described above, an orthomosaic and a DEM for both the DJI and the MAPIR camera were produced for each survey date. The MAPIR orthomosaic was used for conducting snow and ice classification and the DJI DEM was used to calculate the surface height change between survey dates. The DJI images had a higher spatial resolution than the MAPIR images and therefore produced a smoother and more accurate elevation model.
MAPIR Image Classification
The MAPIR orthomosaics, composed of red (660 nm), green (550 nm), and near-infrared (850 nm) bands, were used to conduct IsoData unsupervised classification of the glacier surface spectral properties on both August 17, 2020 and September 5, 2020 in ENVI version 5.6 (Exelis Visual Information Solutions, Boulder, Colorado). The default ENVI parameters were used except for the number of classes, which was changed to a maximum of 50 classes, and the maximum iterations, which was increased to 10. The resulting spectral classes were then refined to represent the following three information classes: Snow, Ice, and Rock.
The accuracy of the classified images was assessed by assigning a minimum of 100 check points randomly stratified across the three information classes. These ground truth check points were then manually classified into Rock, Ice, and Snow using the MAPIR and DJI orthomosaics as references. The resulting ground truth points were compared to the IsoData classification to generate a confusion matrix. The confusion matrix demonstrates the accuracy of the classification with respect to user and producer accuracy. Here, user accuracy refers to how reliable the classification map is, for example, how often a check point location classified as Ice on the map is actually ice. Producer accuracy here, tells us how accurate our classification is, for example, how often ice will be classified as Ice in the map.
The classified images from each survey date were then clipped into image sections that were ice for both survey dates (Ice-to-Ice), snow for both survey dates (Snow-to-Snow), and sections that transitioned from snow to ice between the survey dates (Snow-to-Ice). These classifications were used to differentiate the DEM surface height changes that should be attributed to Snow-to-Snow melt, Ice-to-Ice melt, or a transition from Snow-to-Ice.
Ablation Assessment
The late summer snowpack in the North Cascades region is highly homogenous and isothermal over the large scale. This allows us to calculate the water equivalent of snow and ice volume loss using constant density measurements. The snow density value used for our calculation of Snow-to-Snow areas was 600 kg m−3 (Pelto and Riedel, 2001) and the ice density value used for our calculation of Ice-to-Ice areas was 850 kg m−3 (Huss, 2013). The water equivalent of the Snow-to-Ice classified areas that transitioned from snow to ice between the survey dates were calculated using a density of 725 kg m−3, the average of the snow and ice densities.
The difference between the DEMs was clipped to only include areas of negative height change. The areas that resulted in a positive height change were examined separately and proved to be a result of shadow, cliff, and edge effects (Supplementary Figure S1). These areas were removed from the analysis. To mitigate any other possible edge effects that could create errors in the surface height changes, all survey edges were clipped out of the analysis.
Ablation measurements were calculated for the entire surveyed glacier area and also for a subsection of the glacier, the Wells Creek drainage area. Since only one of the two outlet creeks from the glacier is gauged, to compare the UAV derived discharge to the measured stream discharge we must separate the glacier area that drains into the gauged Wells Creek from the glacier area that drains into the ungauged Sholes Creek. This delineation was conducted based on the glacier surface topography that is observed in the UAV imagery and in the field. The medial moraine of the glacier divides the two drainage areas and can be followed from the terminus of the glacier to the ablation area using the stratigraphy of the glacier as a guide (Supplementary Figure S2).
Discharge Measurements
The Nooksack Indian Tribe has an established monitoring system for measuring the discharge of the Sholes Glacier. At the beginning of the melt season, they install a Solonist Levelogger 5 accompanied with a Solonist Barologger 5 to record water level, water temperature, air temperature, and barometric pressure at 30-min intervals. Additionally, the Tribe visits the monitoring site weekly to measure stream velocity with a Xylem Flowprobe which was integrated over the cross-sectional area to determine discharge. A discharge rating curve was then developed for each creek in order to model continuous discharge over the field season from late July through mid-September (Grah and Beaulieu, 2013).
These data were compiled and trimmed to include only the measurements acquired between the two UAV surveys. This dataset was then integrated to calculate the total discharge in cubic kilometers that the glacier released over the course of the survey period.
Results
Positional Accuracy
The accuracy of the SfM image processing was assessed based on 8 GCPs and 4 ground validation points (GVPs) for the August 17, 2020 flight and 9 GCPs and 4 GVPs for the September 5, 2020 flight. The August 17, 2020 flight covered a smaller area, 0.8 km2, than the September 5, 2020 flight, 1.0 km2, and had a higher positional accuracy based on the GCPs and GVPs. The GVPs used during the September 5, 2020 flight had a total positional error more than 3 times greater than that of the August 17, 2020 flight, 60.5 and 16.1 cm respectively (Table 1). Based on these accuracy assessments, the DEMs used for the rest of this study were resampled using the nearest neighbor method to 1 m pixels to compensate for any lateral positional error. The vertical error for the August 17, 2020 flight was 9.15 cm and the vertical error for the September 5, 2020 flight was 10.20 cm. Propagating the vertical errors through to the differenced DEM results in an error of 0.19 m, which was used through the rest of the calculations.
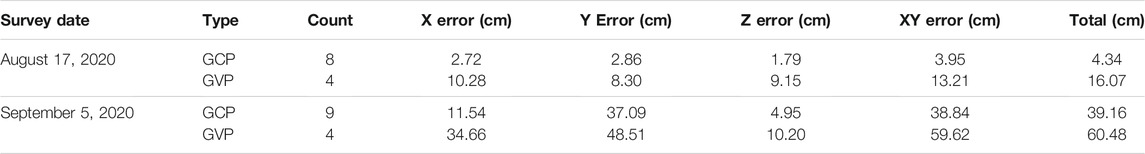
TABLE 1. Control point errors where X represents Longitude, Y represents Latitude, and Z represents Altitude. Ground control points (GCPs) were used in the aligning of the orthomosaic while the ground validation points (GVPs) were omitted and used to assess the reconstruction accuracy.
Glacier Surface Changes
From August 17, 2020 to September 5, 2020, DEM differencing revealed that the Sholes Glacier lost an average thickness of 2.5 ± 0.19 m (Table 2). The majority of the pixels resided within the 0 to -5 m range, with only crevasse openings and edge effects extending beyond -5 m. Since these pixels do not represent mass loss, they were removed from the analysis to more accurately capture the ablation. The Snow-to-Snow class covered the largest area (0.193 km2) and had the greatest total volume lost (−477,226 ± 37,054 m3) when compared to Snow-to-Ice (−362,263 ± 27,601 m3) and Ice-to-Ice (−217,359 ± 16,612 m3) (Table 2).
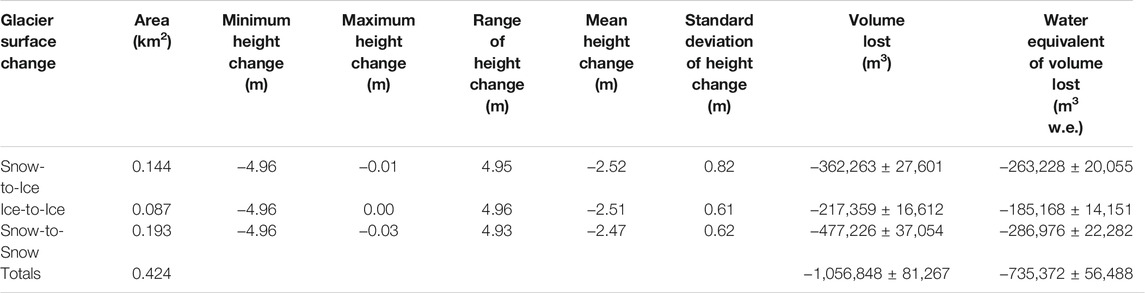
TABLE 2. Surface height differences between the DEMs of the Sholes Glacier on August 17, 2020 and September 5, 2020. The surface height changes are separated into three surface type classes based on the IsoData unsupervised classification. Statistics were calculated based on each surface type class.
Snow-covered area declined from 75.5 to 43% with ice-covered area increasing by 0.16 km2 over the 19 days between survey flights (Figure 1). Snow-covered areas and ice-covered areas lost surface thickness at similar rates, −0.130 m d−1 and −0.132 m d−1, respectively.
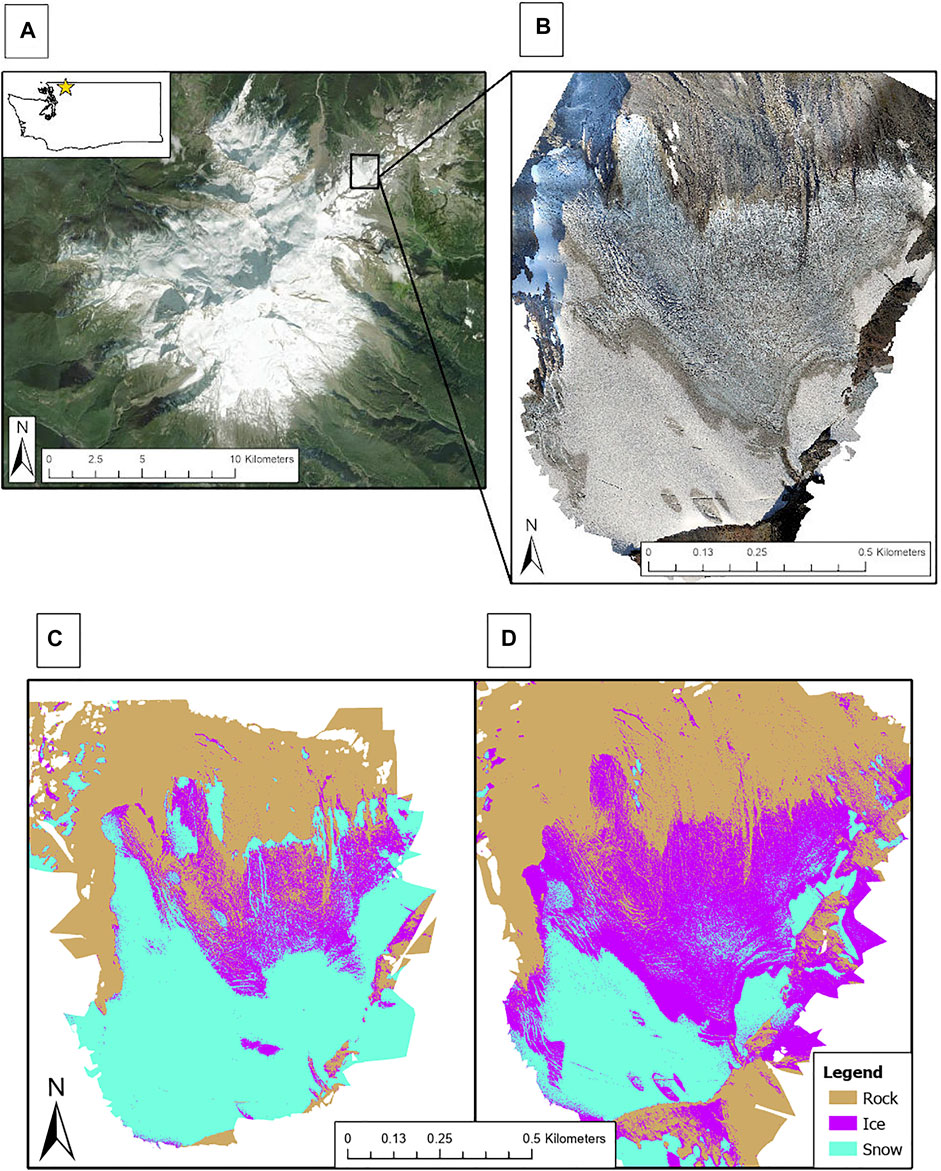
FIGURE 1. (A) Displays Mount Baker with an inset showing the location of the mountain within Washington state in the contiguous United States and a callout box highlighting the Sholes Glacier. (B) The Sholes Glacier (-121.7700032°W, 48.8141614°N) as seen in the true color DJI orthomosaic from the September 5, 2020 UAV survey. IsoData classification of the Sholes Glacier on (C) August 17, 2020 where the total glacier extent is 0.484 km2 with 75.5% of the glacier snow-covered and 24.5% of the glacier ice-covered. (D) Shows the IsoData classification of the Sholes Glacier on September 5, 2020 where the total glacier extent is 0.471 km2 with 43.0% of the glacier snow-covered and 57.1% of the glacier ice-covered.
For areas that remained snow covered between the two survey dates (Snow-to-Snow), the surface height loss of 2.47 ± 0.19 m is equal to 1.48 ± 0.11 m water equivalent (m w.e.) whereas for areas that remained ice covered between the two survey dates (Ice-to-Ice), the surface height loss of 2.51 ± 0.19 m is equal to 2.14 ± 0.16 m w. e.
Glacier surface height change appeared relatively uniform across the extent of the glacier with the most extreme height changes occurring in the lower section of the glacier near the terminus (Figure 2). This section of the glacier is associated with a much steeper slope, faster moving ice, and more crevassing. The opening of crevasses and the collapsing of a snow or ice cave in this lower section resulted in DEM surface height differences greater than 14 m.
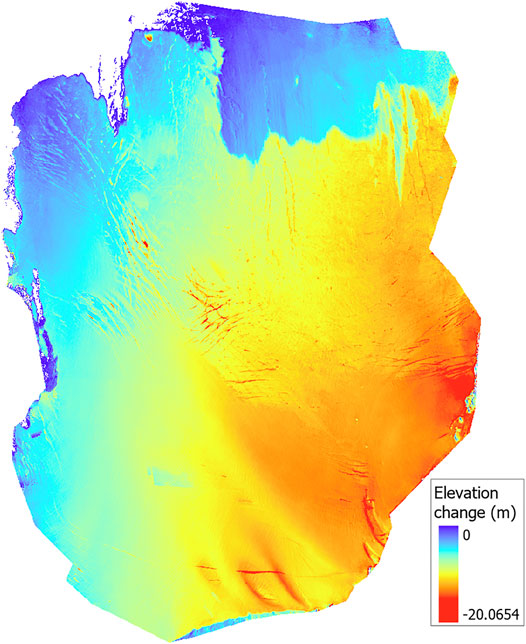
FIGURE 2. Surface elevation change of the Sholes Glacier between August 17, 2020 and September 5, 2020. The DEMs for each survey date were differenced to reveal the surface elevation change.
IsoData Classification
The IsoData classification generated 9 unique spectral classes that were combined into the 3 information classes: Rock, Ice, and Snow. Accuracy assessment performed on each survey revealed that the spectral classification of the August 17, 2020 and the September 5, 2020 imagery had overall accuracies of 79.7 and 78.1% respectively (Table 3). The Rock class had the worst user accuracy (51.5% on August 17 and 58.5% on September 5) yet the highest producer accuracy (96% on August 17 and 100% on September 5) for both survey dates, meaning that the classification overpredicted rock and only 51.5 or 58.5% of the places classified as Rock were really rock (Table 3). The Snow class had the best user accuracy for both survey dates (90.6% on August 17 and 87.8% on September 5) (Table 3). Kappa values for the August 17, 2020 and the September 5, 2020 surveys were 0.665 and 0.664 respectively (Table 3).
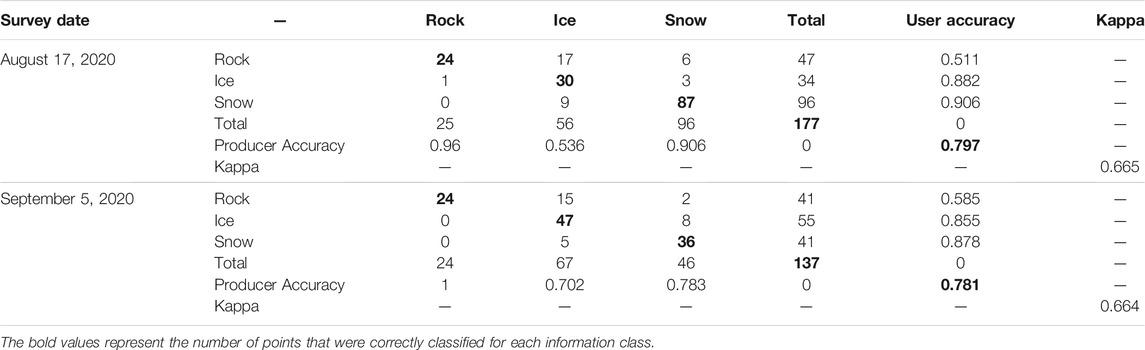
TABLE 3. Confusion matrix for the MAPIR IsoData classification of the Sholes Glacier on August 17, 2020. User data for the 177 and 137 stratified random ground truth points were manually classified using the DJI and MAPIR orthomosaics as references.
Glacier Discharge
Wells Creek discharge data collected by the Nooksack Indian Tribe revealed an average discharge rate of 0.203 m3 s−1 between August 17, 2020 and September 5, 2020 (Table 4). The discharge remained within the 0.05–0.45 m3 s−1 for all days in this time period except on August 21, 2020 when there was a spike in discharge up to 0.7 m3 s−1, which could be due to a regional surface temperature increase observed on August 16, 2020, according to the Global Historical Climatology Network-Daily database (Menne et al., 2012; version 3). The hydrology of the lower Sholes glacier includes small moulins and englacial conduits, which may serve as reservoirs for meltwater leading to the discharge spike observed 4 days later. The residence time of supraglacial and englacial meltwater on the Sholes has not yet been exhaustively studied.
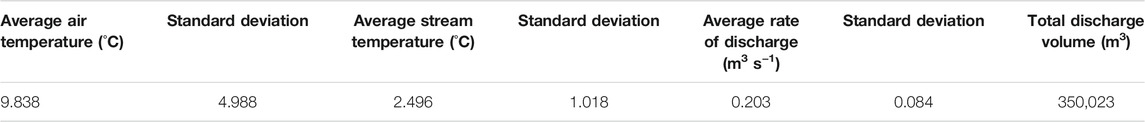
TABLE 4. Wells Creek discharge data from August 17, 2020 through September 5, 2020, shared by the Nooksack Indian Tribe in the interest of scientific collaboration.
Based on the UAV results, the majority, 0.342 km2, of the 0.424 km2 glacier drains into Wells Creek. DEM differencing reveals that this drainage basin area lost an average surface height of −2.33 ± 0.19 m for a total of −550,161 ± 45,206 m3 w.e. discharged into Wells Creek between the survey dates (Table 5). In comparison, the Wells Creek stream gauge station measured a total discharge of 350,023 m3 between the survey dates (Table 4). The two measurements differ by 200,138 m3.
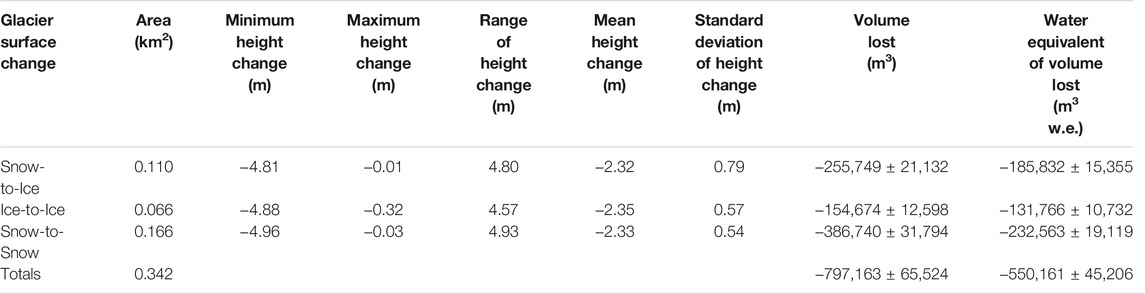
TABLE 5. Surface height differences between the DEMs of the Wells Creek drainage basin portion of the Sholes Glacier on August 17, 2020 and September 5, 2020. The surface height changes are separated into three surface type classes based on the IsoData unsupervised classification. Statistics were calculated based on each surface type class.
Discussion
This paper demonstrates the application of low-cost UAV survey equipment to resolutely map short time scale glacier dynamics. The total cost of the UAV set up was less than $2,000 USD and did not require complicated rigging or modification. While the MAPIR camera is not designed for calculating research level spectral indices, the spectral capabilities are more than sufficient to conduct spectral classification. The ability to divide the survey area into Snow, Rock, and Ice using IsoData unsupervised classification greatly aided in our ability to analyze the glacier ablation based on surface type. This classification approach could be useful in a variety of UAV applications, including in the classification of supraglacial lakes or sea ice melt ponds (Tschudi et al., 2008).
The summer snow melt of a glacier is a dynamic process where the snowline does not necessarily move linearly up the glacier in elevation. On the Sholes Glacier in particular, there are patches above the snowline that reveal ice much earlier in the season and patches below the snowline that remain snow covered until much later in the season. Therefore, manually digitizing the snow- and ice-covered extent would likely misrepresent the contributions of snow and ice melt to the total discharge. In this way, the IsoData unsupervised classification enabled us to parse out snow versus ice more accurately and interpret their respective surface height changes.
Though the IsoData unsupervised classification performed effectively when classifying spectrally distinct features, such as snow and rock, the performance decreased when classifying more spectrally similar surfaces like ice and rock. This causes issues in sections of the Sholes Glacier where the ice is covered by debris and gets classified as Rock in the process. Since the areas classified as Rock were not included in the analysis, the contribution of ice melt was likely underestimated. Previous studies have also encountered this issue when attempting to spectrally distinguish between debris covered glacier features and the surrounding rock faces (Kraaijenbrink et al., 2016). This misclassification could potentially be reduced in future studies by the addition of a thermal sensor on the UAV that could distinguish debris on top of ice from the surrounding rock, allowing the approach to be applied to studying rock glaciers or debris covered glaciers more effectively (Brun et al., 2016; Vincent et al., 2016; Wigmore and Mark, 2017; Vivero and Lambiel, 2019; Che et al., 2020).
This study did not venture to conduct ground validation across the entire glacier extent and instead sought to assess the glacier as a whole. In this regard, we were able to compare the total surface height changes measured with the UAV to the total glacier discharge measured by one of the glacier outlet creeks. The UAV derived discharge overestimated the measured stream discharge by 200,138 m3. This discrepancy is likely due to the manual digitization of the Wells Creek drainage basin, as described in the methods. Processes like sublimation, snow compaction, and meltwater drainage to groundwater should also be considered as potential sources of error. Additionally, the Snow-to-Ice class assumes that only the wet, intermediary snow melted and that after it melted away, no underlying ice melted. While we attempted to compensate for this by using a density halfway in between that of snow and ice, there could have been a larger portion of snow rather than ice that melted away and contributed to our overestimation of water equivalent. Future studies should gauge the secondary outlet stream, Sholes Creek, in addition to the Wells Creek, to capture all of the glacier discharge.
Due to the remote and rigorous terrain of the field site, we were only able to set up 13 ground control targets over the glacier, all of which had to be restricted to low angle, snow-covered regions of the glacier for the targets to be placed safely and effectively. Placing GCPs evenly across the snow-covered and snow-free areas of the glacier would have improved lateral and vertical accuracy of the data (Gindraux et al., 2017), however there was no way to safely place GCPs in the heavily crevassed areas of the glacier. The approach still produced a sufficiently low RMSE in the orthomosaics and DEMs (Table 1) to be able to compare between the two survey dates. Additionally, the lateral error in the orthomosaics and DEMs was accounted for by resampling the products to a pixel size that exceeds the positional error in the imagery. In the future, the surveys could be set up to correspond with more traditional times of data collection at the snow maximum and minimum. However, our goal was to test the methodology in reference to the Nooksack Tribe’s discharge data, which is collected through the late summer season.
Conclusion
The development and application of UAV research to cryosphere science is creating new opportunities for increased spatial and temporal monitoring of glacier mass balance and surface properties. Many areas of the cryosphere are changing so rapidly that frequent temporal revisit is necessary to document and understand them (Rossini et al., 2018). The increasing affordability of UAVs provides a distinct advantage over satellite remote sensing and traditional field surveys by allowing researchers to exert greater control over the collected data without being limited by the availability and affordability of satellite data or the manual labor required for field campaigns.
With the addition of a multispectral camera mounted on the UAV there is great potential to connect the observed rates of snowmelt to the influence of light absorbing impurities. In particular, there is great interest to connect the spectral properties of snow algae to the measured snow melt in sensitive ecosystems (Khan et al., 2021). Additionally, there is potential to collect albedo measurements of glacier surfaces at unprecedented spatial resolution and over previously inaccessible glacier areas by mounting upwelling and downwelling solar radiation sensors on the UAV (Ryan et al., 2017).
The approach presented in this study could also be used to assess the impacts of short but intense warming events on snow and ice melt, such as the 2021 Pacific Northwest heatwaves. The ability to assess snow and ice ablation in small alpine glaciers is of great importance to downstream communities, such as the Nooksack Indian Tribe. The Tribe seeks to understand the magnitude and timing of the influx of glacier melt into the Nooksack River so that they can better protect their essential salmon populations. With this study we have demonstrated the feasibility of using the UAV in the North Cascades region to assess glacier ablation and the addition of UAV data to the Tribe’s established dataset could substantially enhance the overall understanding of the glacier’s health. By surveying with the UAV at the snow maximum and minimum we can obtain robust mass balance measurements while also capturing any influence of light absorbing impurities that will influence the glacier’s long-term stability and, therefore, the Tribe’s ability to harvest salmon. With this paper, we provide a baseline for future glacier monitoring and the potential to connect the snow surface properties with the rate of snow melt into a warming future.
Data Availability Statement
The raw data supporting the conclusion of this article will be made available by the authors, without undue reservation.
Author Contributions
AK and SH contributed to conception and design of the study. AK and SH collected the data for this study. SH analyzed the data and wrote the manuscript. AK thoroughly revised, edited, and reviewed this manuscript.
Funding
This research was funded by the U.S. Geological Survey (USGS) Northwest Climate Adaptation Science Center award G17AC000218 and a WWU Research and Sponsored Programs Student Grant to SH, as well as a Washington Water Research Center USGS Grant: G16AP00090 Mod 0006; Sub award: 105860 G004150 to AK.
Conflict of Interest
The authors declare that the research was conducted in the absence of any commercial or financial relationships that could be construed as a potential conflict of interest.
Publisher’s Note
All claims expressed in this article are solely those of the authors and do not necessarily represent those of their affiliated organizations, or those of the publisher, the editors and the reviewers. Any product that may be evaluated in this article, or claim that may be made by its manufacturer, is not guaranteed or endorsed by the publisher.
Acknowledgments
The authors wish to thank the Nooksack Indian Tribe who volunteered to share their 2020 season discharge data in the interest of scientific collaboration. The authors would like to specifically thank Oliver Grah and Jezra Beaulieu of the Nooksack Indian Tribe for their continued partnership. The authors are grateful to David Chapman and Jacob Dana for their support in the field, and to Mauri Pelto (North Cascades Glacier Climate Project) for his knowledge of the Mt. Baker glaciers.
Supplementary Material
The Supplementary Material for this article can be found online at: https://www.frontiersin.org/articles/10.3389/frsen.2021.764765/full#supplementary-material
References
Agisoft, L. L. C. (2021). Agisoft Metashape User Manual Professional Edition. Version 1.7. St. Petersburg, Russia: Available at: https://www.agisoft.com/pdf/metashape-pro_1_7_en.pdf.
Agisoft, L. L. C. (2017). Python Scripts for Metashape Pro. Available at: github.com/agisoft-llc/metashape-scripts (Accessed April, 2021).
Bach, A. (2002). Snowshed Contributions to the Nooksack River Watershed, North Cascades Range, Washington. Geographical Rev. 92, 192–212. doi:10.2307/4140970
Bash, E. A., Moorman, B. J., Menounos, B., and Gunther, A. (2020). Evaluation of SfM for Surface Characterization of a Snow-Covered Glacier through Comparison with Aerial Lidar. J. Unmanned Veh. Sys. 8, 119–139. doi:10.1139/juvs-2019-0006
Bash, E. A., and Moorman, B. J. (2020). Surface Melt and the Importance of Water Flow - an Analysis Based on High-Resolution Unmanned Aerial Vehicle (UAV) Data for an Arctic Glacier. The Cryosphere 14, 549–563. doi:10.5194/tc-14-549-2020
Bash, E., Moorman, B., and Gunther, A. (2018). Detecting Short-Term Surface Melt on an Arctic Glacier Using UAV Surveys. Remote Sensing 10, 1547. doi:10.3390/rs10101547
Bernard, É., Friedt, J. M., Tolle, F., Griselin, M., Marlin, C., and Prokop, A. (2017a). Investigating Snowpack Volumes and Icing Dynamics in the Moraine of an Arctic Catchment Using UAV Photogrammetry. Photogram Rec. 32, 497–512. doi:10.1111/phor.12217
Bernard, É., Friedt, J. M., Tolle, F., Marlin, C., and Griselin, M. (2017b). Using a Small COTS UAV to Quantify Moraine Dynamics Induced by Climate Shift in Arctic Environments. Int. J. Remote Sensing 38, 2480–2494. doi:10.1080/01431161.2016.1249310
Bhattacharya, A., Bolch, T., Mukherjee, K., King, O., Menounos, B., Kapitsa, V., et al. (2021). High Mountain Asian Glacier Response to Climate Revealed by Multi-Temporal Satellite Observations since the 1960s. Nat. Commun. 12, 4133. doi:10.1038/s41467-021-24180-y
Boesch, R., Bühler, Y., Marty, M., and Ginzler, C. (2016). Comparison of Digital Surface Models for Snow Depth Mapping with Uav and Aerial Cameras. Int. Arch. Photogramm. Remote Sens. Spat. Inf. Sci. XLI-B8, 453–458. doi:10.5194/isprs-archives-XLI-B8-453-2016
Brun, F., Buri, P., Miles, E. S., Wagnon, P., Steiner, J., Berthier, E., et al. (2016). Quantifying Volume Loss from Ice Cliffs on Debris-Covered Glaciers Using High-Resolution Terrestrial and Aerial Photogrammetry. J. Glaciol. 62, 684–695. doi:10.1017/jog.2016.54
Brun, F., Wagnon, P., Berthier, E., Shea, J. M., Immerzeel, W. W., Kraaijenbrink, P. D. A., et al. (2018). Ice Cliff Contribution to the Tongue-wide Ablation of Changri Nup Glacier, Nepal, central Himalaya. The Cryosphere 12, 3439–3457. doi:10.5194/tc-12-3439-2018
Che, Y., Wang, S., Yi, S., Wei, Y., and Cai, Y. (2020). Summer Mass Balance and Surface Velocity Derived by Unmanned Aerial Vehicle on Debris-Covered Region of Baishui River Glacier No. 1, Yulong Snow Mountain. Remote Sensing 12, 3280. doi:10.3390/rs12203280
Cimoli, E., Marcer, M., Vandecrux, B., Bøggild, C. E., Williams, G., and Simonsen, S. B. (2017). Application of Low-Cost UASs and Digital Photogrammetry for High-Resolution Snow Depth Mapping in the Arctic. Remote Sensing 9, 1144. doi:10.3390/rs9111144
De Michele, C., Avanzi, F., Passoni, D., Barzaghi, R., Pinto, L., Dosso, P., et al. (2016). Using a Fixed-wing UAS to Map Snow Depth Distribution: an Evaluation at Peak Accumulation. The Cryosphere 10, 511–522. doi:10.5194/tc-10-511-2016
Di Mauro, B., Fava, F., Ferrero, L., Garzonio, R., Baccolo, G., Delmonte, B., et al. (2015). Mineral Dust Impact on Snow Radiative Properties in the European Alps Combining Ground, UAV, and Satellite Observations. J. Geophys. Res. Atmos. 120, 6080–6097. doi:10.1002/2015JD023287
Ewertowski, M. W., Evans, D. J. A., Roberts, D. H., and Tomczyk, A. M. (2016). Glacial Geomorphology of the Terrestrial Margins of the Tidewater Glacier, Nordenskiöldbreen, Svalbard. J. Maps 12, 476–487. doi:10.1080/17445647.2016.1192329
Fernandes, R., Prevost, C., Canisius, F., Leblanc, S. G., Maloley, M., Oakes, S., et al. (2018). Monitoring Snow Depth Change across a Range of Landscapes with Ephemeral Snowpacks Using Structure from Motion Applied to Lightweight Unmanned Aerial Vehicle Videos. The Cryosphere 12, 3535–3550. doi:10.5194/tc-12-3535-2018
Florinsky, I. V., and Bliakharskii, D. P. (2019). Detection of Crevasses by Geomorphometric Treatment of Data from Unmanned Aerial Surveys. Remote Sensing Lett. 10, 323–332. doi:10.1080/2150704X.2018.1552809
Fugazza, D., Scaioni, M., Corti, M., D'Agata, C., Azzoni, R. S., Cernuschi, M., et al. (2018). Combination of UAV and Terrestrial Photogrammetry to Assess Rapid Glacier Evolution and Map Glacier Hazards. Nat. Hazards Earth Syst. Sci. 18, 1055–1071. doi:10.5194/nhess-18-1055-2018
Gaffey, C., and Bhardwaj, A. (2020). Applications of Unmanned Aerial Vehicles in Cryosphere: Latest Advances and Prospects. Remote Sensing 12, 948. doi:10.3390/rs12060948
Gindraux, S., Boesch, R., and Farinotti, D. (2017). Accuracy Assessment of Digital Surface Models from Unmanned Aerial Vehicles' Imagery on Glaciers. Remote Sensing 9, 186. doi:10.3390/rs9020186
Grah, O., and Beaulieu, J. (2013). The Effect of Climate Change on Glacier Ablation and Baseflow Support in the Nooksack River basin and Implications on Pacific Salmonid Species protection and Recovery. Climatic Change 120, 657–670. doi:10.1007/s10584-013-0747-y
Grah, O. (2019). Nooksack Indian Tribe Climate Change Project - Glaciers and Planning for Climate Change. [Conference presentation] Seattle, WA: Law Seminars International: Tribal Water in the Pacific Northwest.
Huss, M. (2013). Density Assumptions for Converting Geodetic Glacier Volume Change to Mass Change. The Cryosphere 7, 877–887. doi:10.5194/tc-7-877-2013
Immerzeel, W. W., Kraaijenbrink, P. D. A., Shea, J. M., Shrestha, A. B., Pellicciotti, F., Bierkens, M. F. P., et al. (2014). High-resolution Monitoring of Himalayan Glacier Dynamics Using Unmanned Aerial Vehicles. Remote Sensing Environ. 150, 93–103. doi:10.1016/j.rse.2014.04.025
Khan, A. L., Dierssen, H. M., Scambos, T. A., Höfer, J., and Cordero, R. R. (2021). Spectral Characterization, Radiative Forcing and Pigment Content of Coastal Antarctic Snow Algae: Approaches to Spectrally Discriminate Red and green Communities and Their Impact on Snowmelt. The Cryosphere 15, 133–148. doi:10.5194/tc-15-133-2021
Kraaijenbrink, P. D. A., Shea, J. M., Pellicciotti, F., Jong, S. M. d., and Immerzeel, W. W. (2016). Object-based Analysis of Unmanned Aerial Vehicle Imagery to Map and Characterise Surface Features on a Debris-Covered Glacier. Remote Sensing Environ. 186, 581–595. doi:10.1016/j.rse.2016.09.013
Lemos, M. C., Kirchhoff, C. J., and Ramprasad, V. (2012). Narrowing the Climate Information Usability gap. Nat. Clim Change 2, 789–794. doi:10.1038/nclimate1614
Menne, M. J., Durre, I., Korzeniewski, B., McNeal, S., Thomas, K., Yin, X., et al. (2012). Data from: Global Historical Climatology Network - Daily (GHCN-Daily), Version 3. Wells Creek, WA US (GHCND:USS0021A31S). NOAA National Climatic Data Center. [accessed 2021]. doi:10.7289/V5D21VHZ
Oshun, J., Keating, K., Lang, M., and Miraya Oscco, Y. (2021). Interdisciplinary Water Development in the Peruvian Highlands: The Case for Including the Coproduction of Knowledge in Socio-Hydrology. Hydrology 8, 112. doi:10.3390/hydrology8030112
Pelto, M. (2018). How Unusual Was 2015 in the 1984-2015 Period of the North Cascade Glacier Annual Mass Balance? Water 10, 543. doi:10.3390/w10050543
Pelto, M. (2016). 2016 Research in the North Fork Nooksack Basin. Dudley, MA: North Cascade Glacier Climate Project.
Pelto, M. S., and Riedel, J. (2001). Spatial and Temporal Variations in Annual Balance of North Cascade Glaciers, Washington 1984-2000. Hydrol. Process. 15, 3461–3472. doi:10.1002/hyp.1042
Redpath, T. A. N., Sirguey, P., and Cullen, N. J. (2018). Repeat Mapping of Snow Depth across an alpine Catchment with RPAS Photogrammetry. The Cryosphere 12, 3477–3497. doi:10.5194/tc-12-3477-2018
Riedel, J. L., and Larrabee, M. A. (2016). Impact of Recent Glacial Recession on Summer Streamflow in the Skagit River. Northwest Sci. 90, 5–22. doi:10.3955/046.090.0103
Rossini, M., Di Mauro, B., Garzonio, R., Baccolo, G., Cavallini, G., Mattavelli, M., et al. (2018). Rapid Melting Dynamics of an alpine Glacier with Repeated UAV Photogrammetry. Geomorphology 304, 159–172. doi:10.1016/j.geomorph.2017.12.039
Ryan, J. C., Hubbard, A., Box, J. E., Brough, S., Cameron, K., Cook, J. M., et al. (2017). Derivation of High Spatial Resolution Albedo from UAV Digital Imagery: Application over the Greenland Ice Sheet. Front. Earth Sci. 5, 7–11. doi:10.3389/feart.2017.00040
Ryan, J. C., Hubbard, A. L., Box, J. E., Todd, J., Christoffersen, P., Carr, J. R., et al. (2015). UAV Photogrammetry and Structure from Motion to Assess Calving Dynamics at Store Glacier, a Large Outlet Draining the Greenland Ice Sheet. The Cryosphere 9, 1–11. doi:10.5194/tc-9-1-2015
Takasu, T., and Yasuda, A. (2009). “Development of the Low-Cost RTK-GPS Receiver with an Open Source Program Package RTKLIB,” in International. Symposium on GPSGNSS, Jeju, Korea, November 4–6, 2009.
Tonkin, T. N., Midgley, N. G., Cook, S. J., and Graham, D. J. (2016). Ice-cored Moraine Degradation Mapped and Quantified Using an Unmanned Aerial Vehicle: A Case Study from a Polythermal Glacier in Svalbard. Geomorphology 258, 1–10. doi:10.1016/j.geomorph.2015.12.019
Tschudi, M. A., Maslanik, J. A., and Perovich, D. K. (2008). Derivation of Melt Pond Coverage on Arctic Sea Ice Using MODIS Observations. Remote Sensing Environ. 112, 2605–2614. doi:10.1016/j.rse.2007.12.009
Turnhout, E., Metze, T., Wyborn, C., Klenk, N., and Louder, E. (2020). The Politics of Co-production: Participation, Power, and Transformation. Curr. Opin. Environ. Sustainability 42, 15–21. doi:10.1016/j.cosust.2019.11.009
van Dongen, E. C. H., Jouvet, G., Sugiyama, S., Podolskiy, E. A., Funk, M., Benn, D. I., et al. (2021). Thinning Leads to Calving-Style Changes at Bowdoin Glacier, Greenland. The Cryosphere 15, 485–500. doi:10.5194/tc-15-485-2021
Vincent, C., Wagnon, P., Shea, J. M., Immerzeel, W. W., Kraaijenbrink, P., Shrestha, D., et al. (2016). Reduced Melt on Debris-Covered Glaciers: Investigations from Changri Nup Glacier, Nepal. The Cryosphere 10, 1845–1858. doi:10.5194/tc-10-1845-2016
Vivero, S., and Lambiel, C. (2019). Monitoring the Crisis of a Rock Glacier with Repeated UAV Surveys. Geogr. Helv. 74, 59–69. doi:10.5194/gh-74-59-2019
Westoby, M. J., Dunning, S. A., Woodward, J., Hein, A. S., Marrero, S. M., Winter, K., et al. (2016). Interannual Surface Evolution of an Antarctic Blue-Ice Moraine Using Multi-Temporal DEMs. Earth Surf. Dynam. 4, 515–529. doi:10.5194/esurf-4-515-2016
Westoby, M. J., Dunning, S. A., Woodward, J., Hein, A. S., Marrero, S. M., Winter, K., et al. (2015). Sedimentological Characterization of Antarctic Moraines Using UAVs and Structure-From-Motion Photogrammetry. J. Glaciol. 61, 1088–1102. doi:10.3189/2015JoG15J086
Wigmore, O., and Mark, B. (2017). Monitoring Tropical Debris-Covered Glacier Dynamics from High-Resolution Unmanned Aerial Vehicle Photogrammetry, Cordillera Blanca, Peru. The Cryosphere 11, 2463–2480. doi:10.5194/tc-11-2463-2017
Keywords: UAV, structure from motion (SFM), glacier ablation, unsupervised classification, north cascades
Citation: Healy SM and Khan AL (2022) Mapping Glacier Ablation With a UAV in the North Cascades: A Structure-from-Motion Approach. Front. Remote Sens. 2:764765. doi: 10.3389/frsen.2021.764765
Received: 25 August 2021; Accepted: 10 December 2021;
Published: 07 January 2022.
Edited by:
Clare Webster, WSL Institute for Snow and Avalanche Research SLF, SwitzerlandReviewed by:
Alexander Tscharf, University of Leoben, AustriaJakob Steiner, International Centre for Integrated Mountain Development, Nepal
Copyright © 2022 Healy and Khan. This is an open-access article distributed under the terms of the Creative Commons Attribution License (CC BY). The use, distribution or reproduction in other forums is permitted, provided the original author(s) and the copyright owner(s) are credited and that the original publication in this journal is cited, in accordance with accepted academic practice. No use, distribution or reproduction is permitted which does not comply with these terms.
*Correspondence: Shannon M. Healy, aGVhbHlzMkB3d3UuZWR1