 Alvin B. Baloloy
 Ariel C. Blanco
 Sahadev Sharma
 Kazuo Nadaoka
- 1Training Center for Applied Geodesy and Photogrammetry, University of the Philippines Diliman, Quezon City, Philippines
- 2Department of Geodetic Engineering, University of the Philippines Diliman, Quezon City, Philippines
- 3Institute of Ocean and Earth Sciences, Universiti Malaya, Kuala Lumpur, Malaysia
- 4School of Environment and Society, Tokyo Institute of Technology, Meguro-ku, Tokyo, Japan
Moderate to high resolution satellite imageries are commonly used in mapping mangrove cover from local to global scales. In addition to extent information, studies such as mangrove composition, ecology, and distribution analysis require further information on mangrove zonation. Mangrove zonation refers to unique sections within a mangrove forest being dominated by a similar family, genus, or species. This can be observed both in natural and planted mangrove forests. In this study, a mapping workflow was developed to detect zonation in test mangrove forest sites in Katunggan-It Ibajay (KII) Ecopark (Aklan), Bintuan (Coron), Bogtong, and Sagrada (Busuanga) in the Philippines and Fukido Mangrove Park (Ishigaki, Japan) using Sentinel-2 imagery. The methodology was then applied to generate a nationwide mangrove zonation map of the Philippines for year 2020. Combination of biophysical products, water, and vegetation indices were used as classification inputs including leaf area index (LAI), fractional vegetation cover (FVC), fraction of photosynthetically-active radiation (FAPAR), Canopy chlorophyll content (Cab), canopy water content (Cw), Normalized Difference Vegetation Index (NDVI), modified normalized difference water index (MNDWI), modified chlorophyll absorption in reflectance index (MCARI), and red-edge inflection point (REIP). Mangrove extents were first mapped using either the Maximum Likelihood Classification (MLC) algorithm or the Mangrove Vegetation Index (MVI)-based methodology. The biophysical and vegetation indices within these areas were stacked and transformed through Principal Component Analysis (PCA). Regions of Interest (ROIs) were selected on the PCA bands as training input to the MLC. Results show that mangrove zonation maps can highlight the major mangrove zones in the study sites, commonly limited up to genera level only except for genera with only one known species thriving in the area. Four zones were detected in KII Ecopark: Avicennia zone, Nypa zone, Avicennia mixed with Nypa zone, and mixed mangroves zones. For Coron and Busuanga, the mapped mangrove zones are mixed mangroves, Rhizophora zone and sparse/damaged zones. Three zones were detected in Fukido site: Rhizophora stylosa-dominant zone, Bruguiera gymnorrhiza-dominant zone, and mixed mangrove zones. The zonation maps were validated using field plot data and orthophotos generated from Unmanned Aerial System (UAS) surveys, with accuracies ranging from 75 to 100%.
Introduction
Different methodologies are being tested using Sentinel-2 data for applications such as land cover mapping and monitoring (Addabbo et al., 2016; Topaloğlua et al., 2017), vegetation dynamics detection (Eklundh et al., 2012), vegetation stress mapping (Rao et al., 2017), and species identification (Immitzer et al., 2016). One significant application of Sentinel-2 is mangrove extent mapping either through supervised, unsupervised, object-based, or index-based classification techniques. Mangrove extent refers to the spatial boundary of a mangrove forest, classified up to the smallest pixel of the satellite images used. Mangrove extent maps are significant to detect the historical and current distribution of these forests, and to identify priority areas for protection and conservation. Accurate spatial information of mangrove extent is essential for both land-use planning and natural resources management. Published studies using Sentinel-2 images utilized different classification algorithms with varying reported accuracy levels. Supervised classification techniques such as Maximum likelihood classification (MLC), Support Vector Machine (SVM), Artificial Neural Network (ANN), and Random Forest (RF) were found to be efficient in classifying mangrove classes (Roslani et al., 2003; Giri and Muhlhausen, 2008; Deilmai et al., 2014; Kanniah et al., 2015; Ma et al., 2017; Liu et al., 2021). There are studies which did focus on index-based mapping where mangrove-specific indices were applied to different inputs bands and satellite data. (Zhang and Tian, 2013; Winarso et al., 2014; Gupta et al., 2018; Jia et al., 2019; Kumar et al., 2019; Baloloy et al., 2020). The latest mangrove extent estimate in the Philippines were generated using Sentinel-2 images and the derived Mangrove Vegetation Index developed by Baloloy et al. (2020). Prior to this, older nationwide mangrove maps were mainly derived from Landsat images with some reported misclassifications such as mangrove pixels being classified as water if located within small mangroves stands (Long and Giri, 2011; Ghandi and Jones, 2019). Sentinel-2 based maps provide better delineation of both large mangrove forests and small mangrove patches due to better spatial resolution than Landsat.
Mangrove zonation refers to unique ecological clusters within a mangrove forest being dominated by a similar family, genus, or species. Zonation can be found both in natural and planted mangrove forest. Mapping zonation is significant as it is a factor in determining biomass and mangrove forest productivity (Bunt, 1996; Naskar, 2004; Hogart, 2010). There are several characteristics of mangroves that could have potential to be used as interpretation keys to identify mangrove forest from other features or discriminate features within mangroves. These include mangrove location, zonation patterns, and properties of the canopy. Mangrove vegetation typically displays band-like zonation patterns that have been linked to various conditions such as soil type, exposure to wave action, salinity, freshwater inflow, and tidal influence (Aragones et al., 1998; Yuvaraj, et al., 2017). Textural and spectral characteristics of the canopy and leaves are the main features used to distinguish among mangrove communities (Ramsey and Jensen, 1996). Textural appearance depends on several factors, such as species composition, distribution pattern, growth form, density growth, and stand height (Diaz and Blackburn, 2003). Spectral variation of the canopy reflectance was described as a function of several optical properties, such as leaf area index (LAI), background reflectance, and leaf inclination (Diaz and Blackburn, 2003; Kuenzer et al., 2011). Therefore, mapping mangrove zonation will require a set of input data that can provide information on these spectral properties which will differ among the different zones. Sentinel-2 has enough spectral bands for derivation of products such as vegetation and biophysical indices, which can be automatically calculated in the Sentinel Application Platform (SNAP) tool developed by the European Space Agency, (2021) (ESA) for processing Sentinel data. It has four red edge bands known to be sensitive to biophysical features such as canopy water and chlorophyll content. Among the Sentinel satellite systems, Sentinel-2 was found to be superior to Sentinel-1 in mapping mangroves (Hu et al., 2020; Xiao et al., 2021).
Previous studies have utilized vegetation indices for mapping mangrove zonation. The study of Valderrama-Landeros et al. (2018) mapped mangrove areas using NDVI generated from Landsat-8, SPOT-5, Sentinel-2 and WorldView-2 data. Three mangrove zones were classified: Laguncularia racemose, Rhizophora mangle, and dead mangroves. NDVI value was calculated from each station designated based on field data. The results indicated that Landsat-8 had low overall accuracy at 64%, Sentinel-2 provided better results (78%), while WorldView-2, which has the highest spatial resolution, gave the highest accuracy value at 93%. In addition to NDVI, other vegetation indices and mangrove-specific indices can also isolate degraded from non-degraded mangroves zones (Winarso et al., 2014; Manna and Raychaudhuri, 2019). Meanwhile, biophysical products were rarely used as input to mangrove extent and zonation mapping methodologies. They are rather used as separate data to highlight specific functional traits within the mangrove forests such as leaf biochemical parameters (Wang et al., 2020), leaf area index (Tian et al., 2017), water content, and leaf chlorophyll content (Heenkenda et al., 2015; Pastor-Guzman et al., 2015; Zhao et al., 2019). There are recent mangrove studies that derived these biophysical products from Sentinel-2 data (Baloloy et al., 2018; Juniansah et al., 2018; Sun et al., 2018; Zhen et al., 2021).
In this study, mangrove zonation were delineated using Sentinel-2 derived biophysical products and vegetation indices. Mangrove extent was generated first to clip the areas where the zonation method was applied. Two mangrove extent mapping methodologies were utilized: (1) a supervised classification technique for the initial study sites and (2) an MVI-based mapping algorithm for the nationwide application. The Sentinel-2 based zonation workflow was developed and applied to the study sites in the Philippines and Japan. The identified zones were validated in the field to determine which zones corresponded to a species or genus-dominant zone, i.e., Rhizophora zone, Sonneratia zone, and Avicennia zone; and zones corresponding to general visible clusters such as mixed mangroves zone, damaged mangrove zones, and sparse mangrove zones.
Materials and Methods
Study Sites
Four mangrove sites were selected: Katunggan-It Ibajay Ecopark in Aklan, Coron (Village or “Barangay” Bintuan), Busuanga (Barangays Bogtong and Sagrada), and Fukido Mangrove Park (Ishigaki, Japan) (Figure 1). Katunggan-It Ibajay (KII) is a 44.22 ha park located in Barangays Naisud and Bugtongbato, Ibajay, Aklan in northern Panay Island. KII houses a total of twenty-eight species, some of which are already century-old stands. Coron and Busuanga are municipalities in the province of Palawan. Coron comprises the eastern half of Busuanga Island, all of Coron Island, and about 50 other minor islets. Meanwhile, Busuanga covers the western one-third of Busuanga Island, as well as Calauit Island, which both are part of the Calamian Islands. Both sites have rich mangrove forests where two Marine Protected Areas (MPA) were declared: the Sagrada-Bogtong Marine Reserve in Busuanga and the Decalve Strict Protection Zone (Bintuan-Sangat Marine Park) in Coron (Garces et al., 2013). The last study site, Fukido Mangrove Park, is located in the northeastern part of Ishigaki Island, southwest of Ryukyu Islands, Japan. This estuary mangrove forest was designated as a national sanctuary by the Ministry of the Environment of Japan (Sharma et al., 2014). Rhizophora stylosa and Bruguiera gymnorrhiza are the only dominant species in the mangrove park (see Table 1). There are no reported areal estimates of the said park, while the estimated mangrove extent of the whole Ishigaki Island ranges from 80 to 87 ha (Alsaaideh et al., 2013; Baloloy et al., 2020). The zonation mapping workflow was applied to the whole Philippines using the 2019 MVI mangrove extent as the boundary.
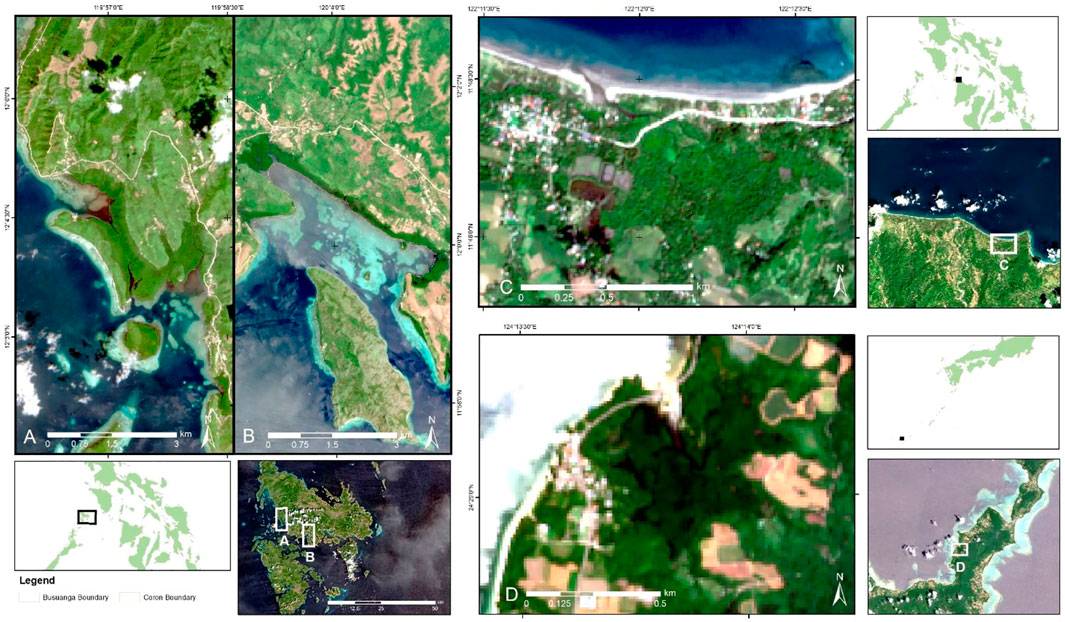
FIGURE 1. Location of the study sites used in testing the workflow for mapping mangrove zonation: (A) Busuanga, (B) Coron and (C) Katunggan-It Ibajay Ecopark, Aklan in the Philippines and (D) Fukido Mangrove Park in Ishigaki, Japan. Sentinel-2 RGB image per site is shown in the map.
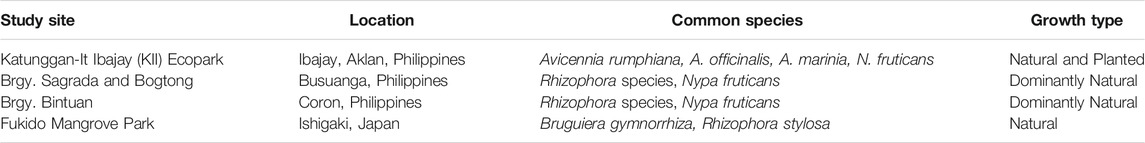
TABLE 1. Common species and growth type of mangrove forests in the study sites.
Satellite Data Collection and Processing.
The acquisition dates of the Sentinel-2 satellite images are shown in Table 2. The Sentinel-2 Multispectral Imager Instrument (MSI) Level 1-C images covering KII Ecopark, Coron, Busuanga and Fukido Mangrove Park were downloaded from Sentinel Scientific Data Hub (ESA). The product is already orthorectified, georeferenced, and radiometrically calibrated into top-of-atmosphere (ToA) reflectance data. Atmospheric correction was carried using Sen2Cor standalone tool, but can be processed alternatively in the S2A Toolbox of the Sentinel Application Platform (SNAP). This processor uses image-based retrievals with Look-Up tables (LUTs) pre-calculated from the libRadtran model to minimize or remove atmospheric effects from level 1-C images (Main-Knorn et al., 2015). Sentinel-2 images with the least cloud cover and at least close to the drone survey date were selected. In the nationwide zonation mapping application, level-2A images within the 80 Sentinel-2 tiles covering the Philippines were downloaded. All level-2A bands were stacked and resampled to 10 m pixel size using SNAP (ver. 5.0) geometric operation tool.
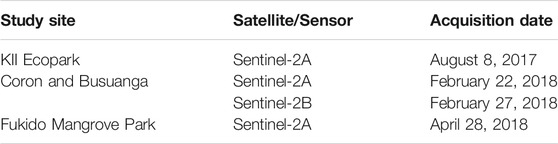
TABLE 2. Downloaded Sentinel-2 images used for the initial extent and zonation mapping of mangroves.
Vegetation and Water Indices
Normalized Difference Vegetation Index (NDVI), Modified Chlorophyll Absorption in Reflectance Index (MCARI) and Red-edge Inflection Point (REIP) are the vegetation indices selected as inputs for zonation mapping. NDVI is a common vegetation index that quantifies vegetation by measuring the difference between near-infrared, which vegetation strongly reflects, and the red light which vegetation absorbs. MCARI is an index that can measure the depth of chlorophyll absorption, and is sensitive to variations in chlorophyll concentrations and variations in LAI. MCARI values are not affected by illumination conditions, background soil reflectance, and reflectance from other non-photosynthetic materials. The REIP formula is based on linear four-point interpolation technique and it uses four wavebands (670, 700, 740, and 780 nm). This algorithm was developed for applications in biomass and nitrogen uptake measurement. Modified Normalized Difference Water Index (MNDWI), a water index sensitive to changes in the water content of vegetation canopies, was also generated to help map the mangrove zones. References and calculations applied to generate these products are shown in Table 3. All water and vegetation indices mentioned above were automatically generated for each Sentinel-2 input image using the SNAP vegetation and water radiometric tools, through the respective NDVI, REIP, MCARI, and MNDWI thematic processors.
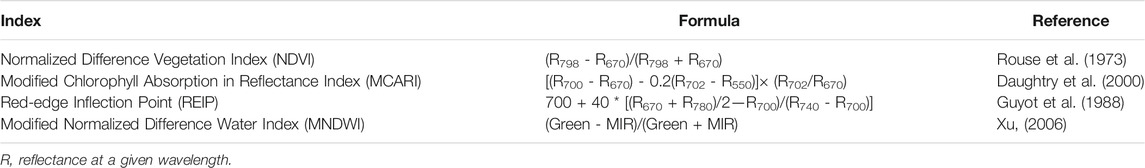
TABLE 3. Vegetation and water indices used in mapping the mangrove zonation using Sentinel-2.
Biophysical Products
Five biophysical variables were generated from the atmospherically corrected and resampled (10 m) Sentinel-2 data using SNAP tool: leaf area index (LAI), fractional vegetation cover (FVC), fraction of photosynthetically-active radiation (FPAR), leaf chlorophyll content (Cab) and canopy water content (Cw). These are outputs from the SNAP toolbox using tested, generic algorithms based on specific radiative transfer models. The generation of the variables were composed of three main steps: (1) normalization of the inputs, (2) implementation of the artificial neural network (ANN) algorithm and (3) denormalization of the output and (4) generation of quality indicator (Weiss and Baret, 2016).
LAI is half the developed area of photosynthetically active elements of the vegetation per unit horizontal ground area. It determines the size of the interface for exchange of energy and mass between the canopy and the atmosphere. FVC is the projected percentage of the total study area that is vegetated. It is one of the basic ecological characteristics which can provide quantitative information of the vegetation coverage status on the ground (Li et al., 2015). FAPAR corresponds to the fraction of photosynthetically active radiation absorbed by the canopy. This value depends on canopy structure, vegetation element optical properties and illumination conditions. Cab corresponds to the content of chlorophyll-a, and sometimes may include chlorophyll-b and carotenoids. Meanwhile, Cw corresponds to the moisture content of leaf or canopy.
Mangrove Zonation Mapping Workflow
Extent mapping must be done prior to zonation mapping to minimize the working area or study boundary (Figure 2). There are two mangrove mapping workflows utilized in this study. The first one is through a supervised classification algorithm, the MLC; and the second one is through an index-based algorithm with the use of MVI. The later method was applied to the nationwide zonation mapping to facilitate faster output map generation, while the MLC was applied to the four test sites for a more detailed mangrove delineation using local training data samples.
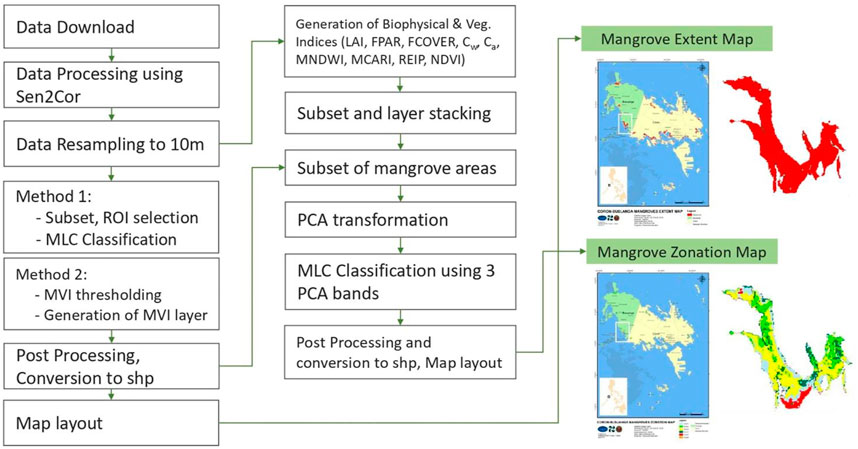
FIGURE 2. Overview of the methodology used in generating mangrove extent and zonation maps. There are two methods for generation the extent map, one is by MLC and another by the use of MVI. The products of extent mapping will be used as boundary to the zonation mapping, wherein vegetation, water, and biophysical products will be inputted as source products.
In the MLC method, the stacked atmospherically-corrected bottom-of-atmosphere (BoA) Sentinel-2 bands were used as input data to the supervised classification method. Region-of interests (ROIs) were selected for each land cover and land use classes such as mangroves, aquaculture, bare soil, built-up and other terrestrial vegetation. In setting these ROIs, optimized visualization of the Sentinel-2 data was done by displaying different sets of RGB and false color composites. With Sentinel-2, using a combination of 8–11–4 (NIR–SWIR–red) bands highlighted the mangroves as bright orange and red pixels, with corresponding NDVI that is higher than 0.8. To highlight aquaculture features in Sentinel-2, the 5-3–2 (vegetation red-edge 1–green–blue) band combination were displayed. Representative training samples were selected for the following specific classes: mangroves, dense vegetation, sparse vegetation, bare soil, built-up, reef, clouds, shadows, and water. The MLC algorithm in ENVI software was applied using the default parameter setting: single value probability threshold and data scale factor of 1. The output mangrove classes were then exported as shapefile. In the MVI workflow, mangrove areas were mapped by applying the MVI formula to the level-2 Sentinel-2 images. MVI measures the probability of a pixel to be a ‘mangrove’ by extracting the greenness and moisture information from the Sentinel-2 green, NIR, and SWIR-1 bands (Baloloy et al., 2020). The automated Google Earth Engine-based MVI Mapper was utilized in generating the updated mangrove map of the country for year 2019. The boundary shapefile for each Military Grid Reference System (MGRS) code for each Sentinel tile was uploaded for faster selection of area. The output MVI layers were cleaned from noise pixels in ArcGIS and ENVI, and was merged into a final shapefile showing the updated mangrove extent of the Philippines.
Mangrove zonation will be mapped after mangrove extent delineation (Figure 2). Compared to extent maps derived from the multispectral bands alone, additional inputs will be added to help detect mangrove zonation and communities. These inputs include the Sentinel-2 biophysical products and the selected vegetation and water indices in Table 3. After stacking the set of biophysical, water, and vegetation indices layers, subset images were generated by clipping it with the mangrove extent shapefiles generated through MLC. This will minimize both the processing area and the output file size. The subset images were then PCA-transformed into three bands where a new set of regions of interest (ROIs) were selected. PCA is a transformation technique that can reduce the dimensionality of large datasets and increase data interpretability while minimizing information loss (Jolliffe and Cadima, 2016). The PCA-transformed bands were subjected to an MLC classification in ENVI software using the default parameters. The first three PCA bands can already highlight the different zonation, and the function of the MLC is to export these visible zones into separate classes identical to the visualized PCA layer. Post processing steps involves sieving classes, conversion of the classes into shapefiles, and layout of the mangrove zonation maps.
Class Labeling and Accuracy Assessment
The developed zonation mapping methodology can map different zonation using Sentinel-2 data, but the equivalent class label or information for each zone must be identified using actual field data. The zonation maps were labeled and validated using field GPS points and orthophotos generated from Unmanned Aerial System (UAS). The handheld GPS used during field data collection has horizontal accuracy of approximately 3 m. Two types of UAS were used: one fixed wing (Sensefly eBee drone) and one copter-type (DJI Phantom 4 Pro drone). eBee was used more frequently due to its wider flight coverage while DJI Phantom Pro was used in the absence of strategic/safe take-off and landing sites. Flight plans were created in eMotion while orthophotos were generated using Pix4D software. Aside from the Philippine site validation, a field visit was also conducted in Fukido Mangrove Park to acquire drone images in addition to the baseline species density and distribution data acquired earlier by the authors. Onsite identification of mangroves was done following the nomenclature of Primavera and Sadaba (2012) and (Primavera et al., 2004). Guide to mangrove identification books were brought onsite. Accuracy of the maps were calculated by random point selection for the UAS validation, and by satellite pixel-field data agreement for the GPS validation.
Results
Mangrove Extent Maps
MLC was the chosen supervised classification technique since it was reported to provide the most statistically robust results and is widely used in land cover mapping with high classification accuracy (Bolstad and Lillesand, 1991; Huang et al., 2007; Shalaby and Tateishi, 2007). Individual mangrove extent maps of KII Ecopark, Coron, Busuanga, and Fukido Mangrove Park were generated (Figure 3) using the designed mangrove MLC-based mapping workflow (Figure 2). The method was applied to the whole Coron and Busuanga Islands, while only parts covering the KII Ecopark and Fukido Mangrove Park were processed. The output extent shapefile successfully delineated the mangrove forest boundaries when checked with the false color composite visualization of Sentinel-2 bands. Very few noise pixels were generated in the non-mangrove areas, and these were cleaned during the post-processing phase in ArcGIS. The total mangrove area for each site was then computed.
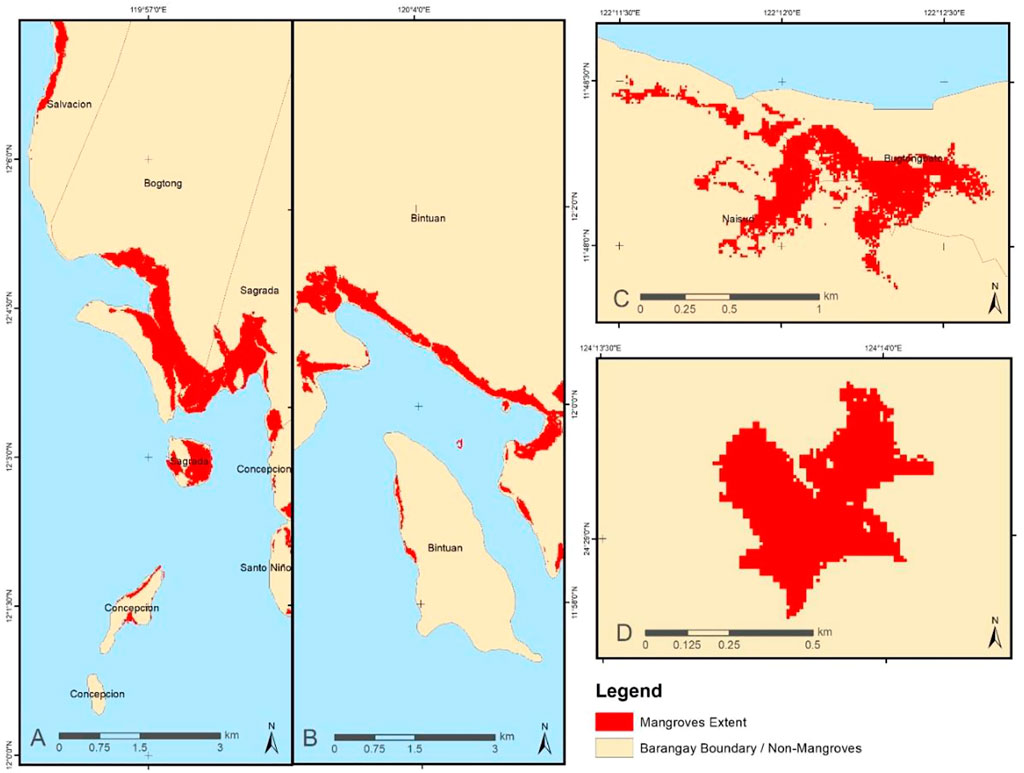
FIGURE 3. Mangrove extent maps for (A) Busuanga, (B) Coron, (C) KII Ecopark and (D) Fukido Park generated using the MLC supervised classification technique implemented in ENVI software.
Mangrove Zonation Maps
Zonation refers to the occurrence of usually monospecific zones of mangroves parallel to shorelines. This horizontal distribution of mangrove is formed as affected by environment gradients such as salinity, elevation, geomorphology, nutrient availability, soil properties, and light availability (Friess and Watson, 2016). In this study, vegetation, water, and biophysical indices within the mangrove extent boundaries were utilized in distinguishing different zonation. Each class generated by the proposed workflow was treated as a unique zonation which must be labeled as to what zone they correspond to using available field data. These zones may represent areas with distinct species/genus assemblages, mangrove density or health, and even damaged spaces. This was made possible through spectral differentiation using information derived from the input Sentinel-2 indices.
In Bintuan, Coron and Bogtong-Sagrada, Busuanga subsites, the mapped mangrove zones are mixed mangroves (87 ha), Rhizophora zone (264 ha), sparse/damaged zones (127 ha), and two smaller unclassified zones (Figure 4). Both sites were dominated by the Rhizophora zone. As reported by Buitre et al. (2019), Coron and Busuanga have rich naturally growing Rhizophora species, including Rhizophora apiculata and Rhizophora mucronata. The selected Busuanga site is a riverine mangrove forest wherein the Rhizophora zone was detected closest to the river while the mixed mangrove zone was detected closer to the land, just behind the Rhizophora zone. Rhizophora species such as Rhizophora apiculata and Rhizophora mucronata were known to be “front mangroves” or those mangrove in the proximal zone. They are commonly found along rivers, stream banks, and creeks (Göltenboth et al., 2006). Because of their location towards the water front, they are exposed to regular tidal effect, soil accumulation, and continuous inundation. Meanwhile, mixed mangrove zone houses species behind the Rhizophora zones, including field-recorded stands of Nypa fruticans, Xylocarpus granatum, Bruguiera cylindrica, Lumnitzera littorea, and Soneratia alba. The common occurrence of mixed mangrove zones behind a Rhizophora-dominant zone were also reported by previous studies (Ruwa, 1993; Dulyapurk et al., 2007; The Fish Site, 2009; Yuvaraj, et al., 2017). The common species found in this zone include Bruguiera spp., Ceriops tagal, Excoecaria agallocha, Ficus sp., Heritiera littoralis, Hibiscus tiliaceus, Acrostichum aureum, Caesalpinia crista, Intsia bijuga, Xylocarpus granatum, and X. moluccensis (Dulyapurk et al., 2007; Yuvaraj, et al., 2017). In Coron, a large portion was dominated by sparse/damaged zone. These zones are areas with relatively thin mangrove cover and with the presence of disturbed mangrove trees (i.e., fallen trunks or branches) as seen in the UAS-generated orthophotos. This is mainly located within the front zone of the Coron site, directly exposed to the waves and wind. Very few Rhizophora trees were found near the damaged zone, except for those trees located in the less exposed, riverine sites. Two unclassified zones were found outside the validated area.
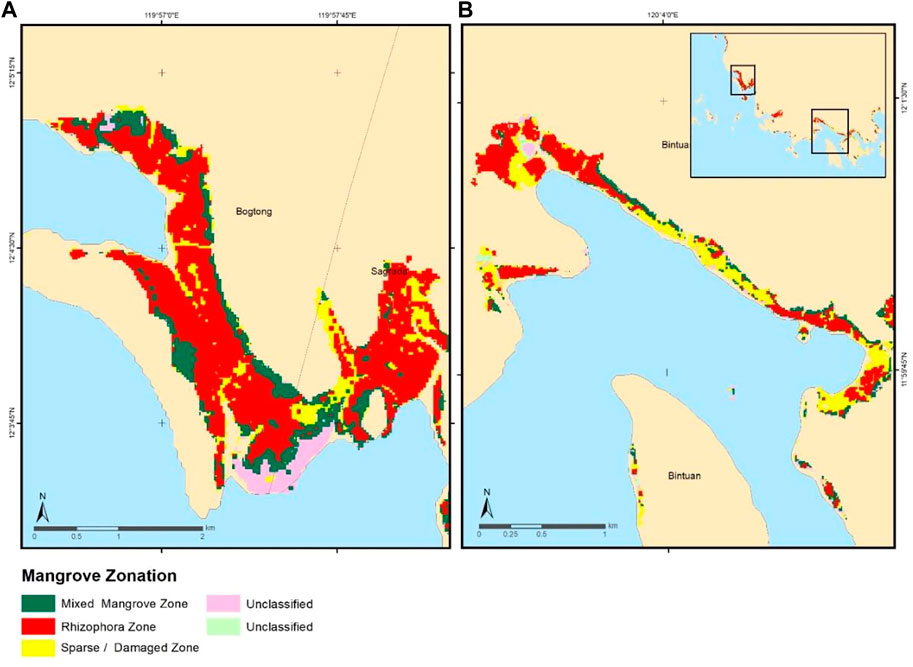
FIGURE 4. Generated mangrove zonation in Coron (A) and Busuanga (B) with the corresponding classes identified. Both sites were dominated by the Rhizophora zone, consist of Rhizophora species.
In KII Ecopark, four zones were mapped and these corresponded to the Avicennia zone (14 ha), Nypa zone (10.5 ha), Avicennia mixed with Nypa zone (9 ha), and mixed mangroves zones (11 ha) (Figure 5). Avicennia zone is the largest zonation, followed by the mixed mangrove zone. In KII, there are four species of Avicennia namely Avicennia alba, A. marina, A. officinalis, and A. rumphiana. The Avicennia zone located at the right middle portion of the site is dominated by the Avicennia rumphiana, while A. marina and A. alba are naturally more abundant on areas closer to the sea. Meanwhile, the Nypa fruticans zone were mapped near the river while the mixed mangrove zone was located in higher elevation areas, nearest to the non-mangrove vegetation in the upland. Compared to Coron and Busuanga, the zonation patterns in KII is more complex due to mixture of naturally growing and planted mangrove species. In Fukido Mangrove Park, three zones were mapped: Rhizophora stylosa-dominant zone (4.6 ha), Bruguiera gymnorrhiza-dominant zone (11.5 ha), and mixed mangrove zones (Rhizophora stylosa + Bruguiera gymnorrhiza) (Figure 5). Only these two species are found abundant on the said ecopark. The zonation map showed the common distribution of the said species, with Rhizophora trees occurring closer to the sea and the Bruguiera stands within the middle and landward zones.
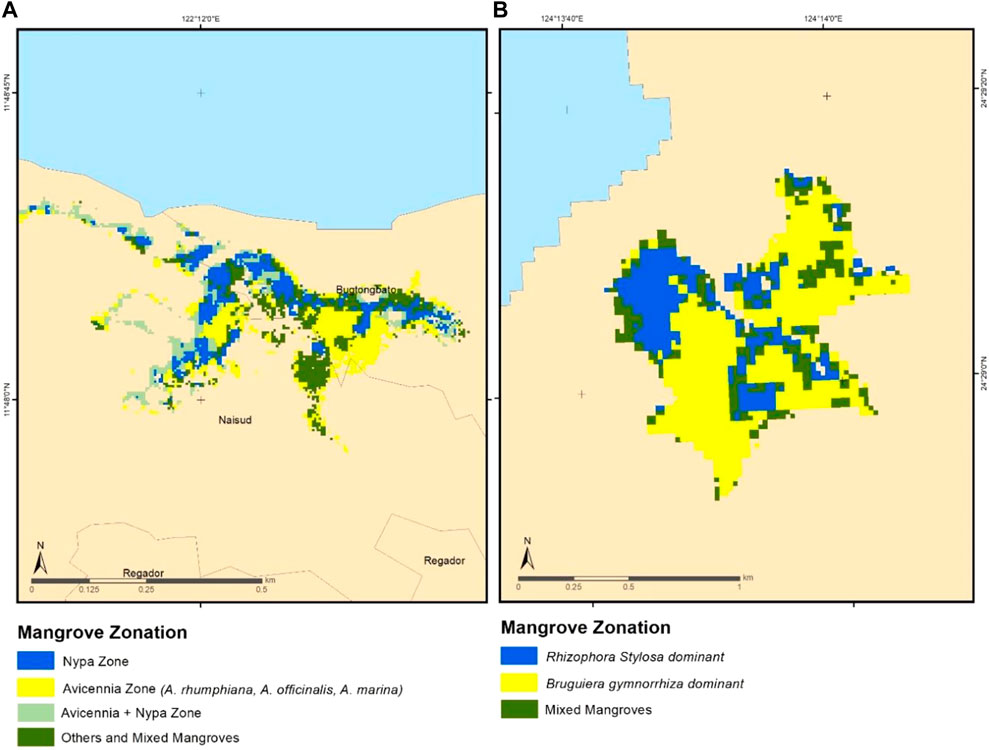
FIGURE 5. Generated mangrove zonation in Katunggan-It Ibajay (KII, (A) and Fukido Mangrove Park (B) with the corresponding classes identified. KII was dominated by Nypa and Avicennia zones while the Fukido site was dominated by two specific species of the Rhizophora and Bruguiera genera.
During the class identification step, some output classes have corresponded to the same zonation, as observed in the case of Coron and Busuanga. Here, two output classes both corresponded to the areas dominated by Rhizophora. These classes were then merged into single class. In KII, two classes corresponded to the Avicennia zone, wherein one of these classes may have separated one specific Avicennia species. However, this can be hardly confirmed due to the limitation in spatial resolution and the natural mixing of the four Avicennia species found in KII.
Map Accuracy
The zonation maps were validated using field plot data using GPS-tagging and orthophotos generated from Unmanned Aerial System (UAS). Species density data of mangrove species was the main validation data used for Fukido Mangrove Park. For KII, a total of 87 GPS points were used to determine the accuracy of the four mangrove zones. The highest accuracy percentage was generated in the mixed mangroves zone (100%) while lowest in the Nypa zones (75%) due to the background effects of soil and water (Table 4). In Fukido Mangrove Ecopark, good results were obtained for the mangroves species, especially in mapping the Rhizophora stylosa dominant -dominant zone (Table 4). The location of the mangroves zones was comparable to the mangrove density data acquired in the field, as shown in Figure 6. The northwest region is dominated by Rhizophora stylosa while the western, southern and northeastern portion are dominated by Bruguiera gymnorrhiza. In filtering the field density data as validation points, the 7 m radius plot is considered ‘species x-dominated’ if the density of that species is at least 10% more than half of the total species population. Mixing of the two species were mostly observed in the central region of the Fukido mangrove forest, especially in areas where the two mangrove species coincide.
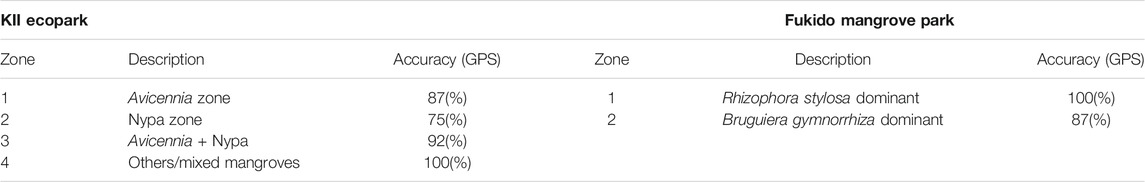
TABLE 4. Map accuracy per mangrove zones in KII and Fukido Park using the zonation mapping workflow with input Sentinel-2 derived water, vegetation, and biophysical dataset.
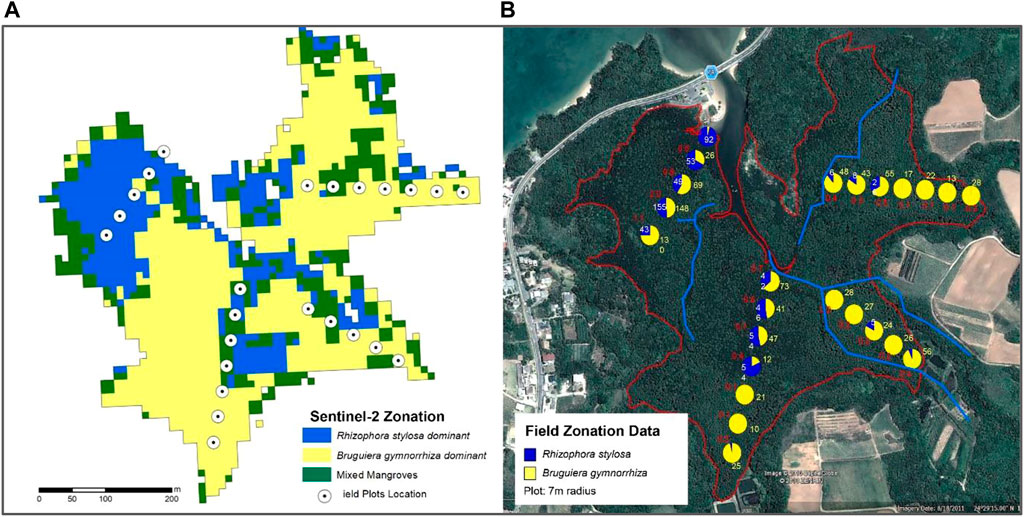
FIGURE 6. Side to side comparison between the field-acquired mangrove species-zonation data (B) and Sentinel-2 based zonation map (A) generated for Fukido Mangrove Park. Similar colors were assigned to each mangrove species for both data. There are two dominant species and a mixed zone.
In Coron and Busuanga, sets of validation data were derived from orthophotos generated from UAS (Table 5). From the orthophoto, random validation points were selected for the three classes: mixed mangroves, Rhizophora, and sparse/damaged zone. The output classes were overlaid in the UAS orthophotos in Figure 7 where visually distinct zonation were identified. The overall accuracy for both sites were considered high, with 94.4% accuracy in Busuanga and 95.6% in Coron. The highest user’s accuracy was computed for the sparse and damaged mangrove zone. Detection of mixed mangrove stands is also highly accurate, with values ranging from 94 to 97.5%.
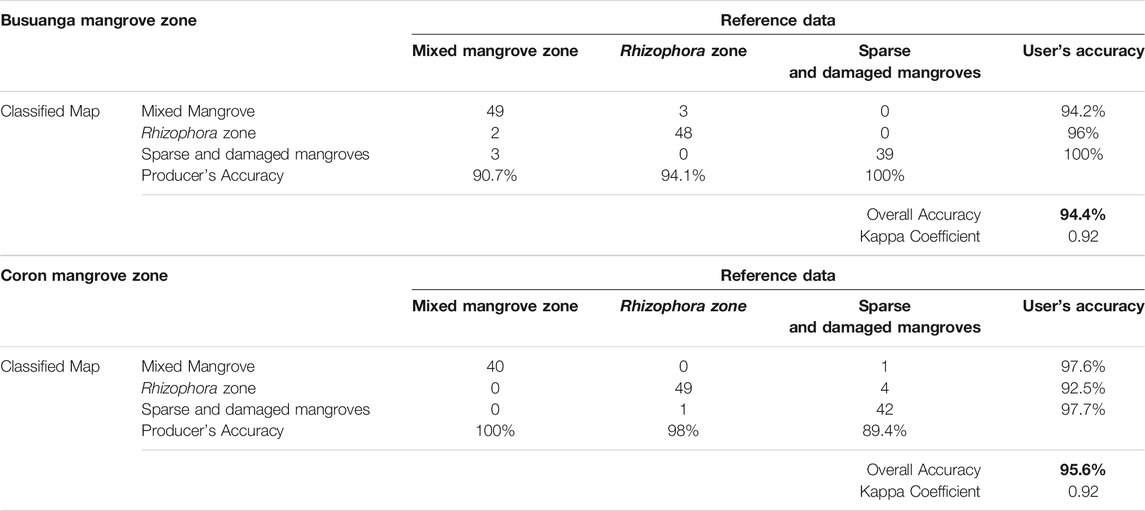
TABLE 5. Classification confusion matrix of mangrove zonation outputs in Coron and Busuanga, Palawan using the zonation mapping workflow with input Sentinel-2 derived water, vegetation, and biophysical dataset.
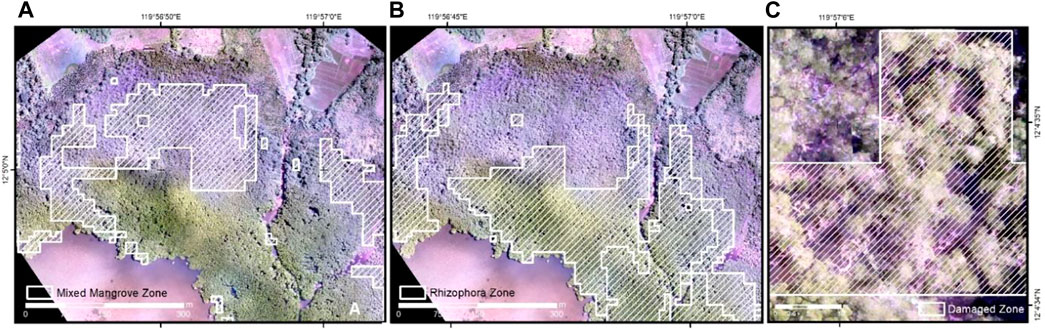
FIGURE 7. Output mangrove zonation classes in Coron overlaid to the generated UAS orthophotos: mixed mangrove zone (A), Rhizophora zone (B) and damaged/sparse zone (C).
Discussion
Mangrove Extent
The developed workflow on mangrove extent mapping can provide both the boundary shapefile for zone classification and the information on the total mangrove forest area. A total of 44.97 ha of mangroves was computed in KII Ecopark, close to the estimated 44.22 ha by SEAFDEC (2010). The two barangays (villages) where KII is located, Barangays Naisud and Bugtongbato, almost cover equal extent of mangroves with 22.43 and 22.54 ha, respectively. In Barangay Bintuan, Coron, there is 593 ha of mangroves while a combined area of 302.1 ha was computed in Barangays Bogtong and Sagrada, Busuanga. These huge mangrove forests are located within the Sagrada, Bogtong and Bintuan Marine Protected Area where patches of coral reefs and seagrass beds are also being protected. Similar to KII, the Fukido Mangrove Park has a relatively smaller area compared to Coron and Busuanga. Based on the MLC-based extent map, it currently supports a total of 20.04 ha of mangroves, around 25% of the total mangrove area in Ishigaki Island. Meanwhile, the nationwide MVI-based mangrove extent map of the Philippines generated an areal estimate of 227,808 ha of mangrove forests. Both the MLC and MVI-derived extent maps can be used to limit boundary for zonation workflow application and to facilitate optimal PCA transformation, which is dependent on local statistics. Despite the differences in the methodology, the MLC-derived mangrove extent is comparable to the MVI-derived data for KII, Coron-Busuanga, and Fukido ecopark.
Application of Sentinel-2 Dataset for Mangrove Zonation Mapping.
The utilization of Sentinel-2 derived biophysical products, water, and vegetation indices as classification inputs to the supervised classification were found to be useful in detecting different mangrove zones. These indices can reflect unique vegetation physiological key processes and characteristics which is significant in distinguishing between mangrove types. These indices were all derived from the SNAP software, facilitating rapid and automatic calculation from the input bands.
Five biophysical products were considered: LAI, FPAR, FVC, Cw, and Cab. LAI is one of the most important variables governing the canopy processes and is related to leaf and canopy chlorophyll contents, photosynthesis rate, carbon and nutrient cycles, dry and fresh biomass, and growing stages (Herrmann et al., 2011). The variation of LAI in mangrove ecosystems reflects the different environmental forces acting upon each location (Arafijo et al., 1997). FVC is one of the basic ecological characteristics reflecting many plant functions and attributes, including plant photosynthetic area and growth trend of vegetation (Wen et al., 2013; Gao et al., 2017; Zhang et al., 2019). Meanwhile, the FPAR is a key parameter in studying the exchange of fluxes of energy, mass, and momentum between the surface and atmosphere (Liu et al., 2013). In Coron and Busuanga, the highest value of LAI, FPAR, and FVC were generated within the Rhizophora zone, followed by the mixed mangrove zone (Table 6). The maximum average LAI, FPAR, and FVC of Rhizophora is 4.11, 0.86, and 0.82, respectively, higher compared to the equivalent statistics for mixed mangroves: 3.27, 0.79, and 0.74. Canopy chlorophyll content (Cab) can also aid in detecting zones since chlorophyll concentrations differs between mangrove species due to varying response to factors such as seasonal change. Similarly, the Rhizophora zone recorded the highest Ca value, while the sparse/damaged zone gave the least. These statistics clearly implies that the Rhizophora zone was mapped separately due to its high area of photosynthetically active elements of the vegetation as measured through LAI, high fraction of photosynthetically active radiation indicated by FAPAR, and high chlorophyll content as derived from LAI and Cab. The dense and homogenous patches of the Rhizophora proved its ability for efficient vegetative growth despite exposure to saltwater and frequent inundation in the proximal zone. The high Cab and LAI values of Rhizophora were seen to be affected by its green leaves, with high reflective upper leaf portion that is smooth, shiny, and with large dimension, usually within 3–10 cm leaf width (Duke, 2006). In comparison, other species in the middle zone such as Xylocarpus granatum has thick and leathery leaf surface, with less width size of 2–6 cm (Baba et al., 2016). The Rhizophora zone also showed the least minimal gap between vegetated pixel, measured by the FVC, as compared to the mixed mangroves and sparse/damaged zones. Rhizophora was described to grow closely and impenetrable compared to other species, creating dense uniform foliage in the upper part of the trees (Yuvaraj et al., 2017). High FVC values can also increase the total Cab and the plant photosynthetic area. This observation may differ between mangrove species stands, i.e. the Rhizophora trees found in the Philippine sites are more dense and have minimal canopy gaps than those Rhizophora stands (R. stylosa) in the Japan site. This observation will change the values of the FVC and other biophysical variable measured, although the separability between other classes may not be affected. The distribution of leaves in a mangrove stand may also affect the resulting FVC. In example, Ceriops tagal, usually in the middle and landward mangrove zone, has majority of its leaves clumped at the end of the twigs (Primavera, 1998; Costa et al., 2019), resulting to less vegetation canopy density when seen from above. The sparse/damaged zone recorded the least values for the biophysical and vegetation indices. This is expected as canopy density greatly influences the resulting vegetation greenness, vegetated area, chlorophyll concentration, canopy moisture, and rate of photosynthesis. The workflow can then separate damaged and sparse mangroves into a separate class. Aside from canopy, sparse mangrove zone may also include areas with reduced stem density, and combination of these factors will lead to reduction in the overall basal area.
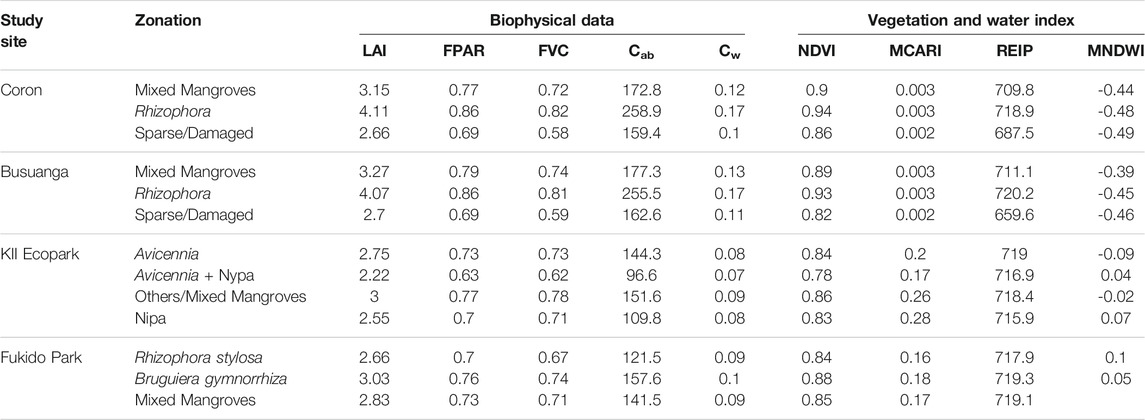
TABLE 6. Mean values of the input Sentinel-2 derived water, vegetation, and biophysical dataset per mangrove zonation identified in the four study sites: Coron, Busuanga, KII Ecopark and Fukido Park.
Canopy water content (Cw) can partly determine the photosynthetic efficiency which differs among plants and is dependent both to structural and biochemical changes. In Coron and Busuanga, more canopy water was found in the zone with more LAI, FVC, and other vegetation-related biophysical variables, and less in the sparse/damaged zone which recorded the least vegetated area. This observation confirmed that Cw only corresponds to the moisture content of leaf or canopy, and is less affected by background soil moisture. This is opposite to the observed values of MNDWI, which is more applicable in identifying surface water than canopy water (Guo et al., 2020). It actually helps in further differentiating zone by detecting areas with more background moisture, as a function of differences in elevation, distance from shore, and substrate type. The background moisture can also indicate the physicochemical properties of water and the changes in mineralogical composition within the substrate (Ajithkumar et al., 2008). In this study, higher MNDWI values were measured in zones with exposed substrate (i.e., sparse/damaged zone) than those with less gaps or with higher FVC (i.e. Rhizophora zone) (Table 6).
Only three vegetation indices were selected as input parameters in this study: NDVI, Modified Chlorophyll Absorption in Reflectance Index (MCARI), Red-edge Inflection Point (REIP) and Modified Normalized Difference Water Index (MNDWI). NDVI can be used to detect differences between vegetation types and was found to be an effective index for mangrove species discrimination analysis (Kovacs et al., 2004; Valderrama-Landeros et al., 2018). Meanwhile, MCARI gives a measure of the depth of chlorophyll absorption and is very sensitive to variations in chlorophyll concentrations. Taking in consideration the similar information that can be derived from their algorithms, MCARI can aid Cab in extracting chlorophyll information. Lastly, REIP was also included as an effective indicator of plant condition that might be related to a variety of factors such as LAI, nutrients, water content, seasonal patterns, and canopy biomass (Clevers et al., 2001; Pu et al., 2003; Delegido et al., 2008). The results for these vegetation indices are similar with that of the biophysical variables, wherein the Rhizophora zone has the greatest index values, while the sparse/damaged zone has the least. However, the vegetation indices provide additional observation in supplement to the biophysical products. In example, the mean NDVI values in the sparse/damaged zone is still between 0.82 and 0.86, indicating that the 50% canopy cover calculated with FVC is potentially measured from the reflectance of live mangrove stands. Addition of these data as input to the zonation workflow ensures better mapping between dense and sparse mangrove zones.
In KII Ecopark, the highest values of vegetation and biophysical variables were recorded in the mixed mangrove zone, followed by the Avicennia and the Nipa zones (Table 6). The mixed mangrove zone includes some trees of A. rumphiana, Sonneratia alba, Camptostemon philippinensis, Aegiceras corniculatum, Ceriops decandra, and Scyphiphora hydrophyllacea. These mangroves are located in areas with less exposure to flooding and wind, and is seen behind the taller trees in the Avicennia zone. This zone is also distinct in terms of background moisture, being located in higher elevation areas and having less exposed substrate (higher FVC). It has the least MNDWI value (−0.02), while the Nypa zones (least FVC) has the highest value of 0.07. The Avicennia zone provided the second highest values in the vegetation and biophysical indices. Compared to the Nypa zone, the Avicennia trees have greater canopy cover, ‘greener’ leaves, and wider leaf dimension. The vegetation greenness of Avicennia trees were reported to be significantly affected by salinity, with lower recorded pigments in areas with lower salinity (Abou Seedo et al., 2018). This was observed in KII where two initial output zonation classes were generated for Avicennia. Zonal statistics analysis has shown that the first larger class, located in the middle zone and closer to the river, has higher chlorophyll content (148 μg/ cm2) compared to the second class (126 μg/ cm2) located in the upper, less saline region. Very few pixels were included in the second class and thus was combined to the first Avicennia class. The Nypa zone naturally grows along the river margins which induced higher MNDWI values. Wetter substrate or open water associated with cycles of tidal inundation and/or periodic rainfall causes increase in MNDWI but causes reduction in the reflectance of the multispectral bands (Proisy et al., 2002). These bands are inputs to the vegetation index calculation, thus affecting the output index values. Compared to the Coron-Busuanga site, very few Rhizophora trees were seen in KII, and they were mapped under the mixed mangrove zone.
In Fukido Mangrove Park, the Bruguiera gymnorrhiza-dominant zone recorded the highest values of vegetation and biophysical variables, followed by the mixed Bruguiera and Rhizophora zone, and then the Rhizophora stylosa-dominant zone. Through field observation, the first zone looks healthier and denser than the later. More inundated areas were observed within the Rhizophora zone, thus with greater MNDWI than the Bruguiera zone. The trees within the Bruguiera zone has higher canopy water, chlorophyll content, LAI, and fractional vegetation cover. Bruguiera gymnorrhiza is commonly described as “large-leafed mangrove” due to its leaf dimension: 8–22 cm long and 5–8 cm wide (Allen and Duke, 2006). Comparing the abundance of species between the study sites, R. Stylosa is the sole Rhizophora species in Fukido Park while the Coron-Busuanga sites are dominated mainly by R. apiculata and R. mucronata. These two species have denser canopy and larger leaf dimension than R. Stylosa (Ragavan et al., 2015).
Mangrove Zone Accuracy and Limitation
Based on the map results, the zonation workflow successfully isolated the major mangrove zones as different classes. These mangrove genera were also the dominant mangroves seen during field visits. Among the sites, mapping mangrove zonation in KII is the hardest due to the complexity of species composition and the presence of both natural and planted areas. As observed in Figure 4, the locations of the zones in Coron and Busuanga were seen to be influenced by the distance from the river and coast while its delineation is solid and homogenous. The output zones show specific affinity and spatial preferences of species assemblages from the perspective of distance from water and elevation from mean sea level (Manna and Raychaudhuri, 2019). The scenario is different in KII (Figure 5) where zones were seen as patches distributed in different regions throughout the forest, including the detected Nypa and Avicennia zones. This observation suggests that the zonation workflow can also aid in determining if a certain mangrove forest is either planted or have grown naturally. Human-assisted mangrove growth may induce uneven growth among same species located in varying zones.
In KII, the highest accuracy result was generated in the ‘other and mixed mangroves zones’. This zone refers to areas that are not dominated by either Nypa fruticans or Avicennia species, but with very few other mangrove species individuals to be separated as another zone. Included in this zone are the Avicennia species, Xylocarpus granatum, Terminalia catappa, Camptostemon philippinensis, Sonneratia alba, Aegiceras corniculatum, Ceriops decandra, Scyphiphora hydrophyllacea, and Excocaria agallocha. Nypa fruticans trees are mostly mixed and surrounded by other mangroves which might contributed to a low accuracy of 75%. Canopy spacing of the Nypa fruticans are mostly large and random (low FVC), thus the presence of background water and soil reflectance between these trees might have affected the results. All mangrove zones generated high classification accuracies in Coron and Busuanga, including the sparse and damaged zone and the Rhizophora zone. Aside from being the most dominant genus in these sites, Rhizophora species have distinct reflectance properties as influenced by its leaf color (Setyawan and Ulumuddin, 2012), salt secreting-glands Samadder and Jayakumar (2015) and its wider and longer leaf spongy layer (Surya and Hari, 2018), in addition to the properties discussed earlier. The zonation workflow was also successful and differentiating between the Rhizophora Stylosa and Bruguiera gymnorrhiza species in Fukido Mangrove Park, with relatively high accuracy results. Previous studies have documented the spectral signature variation between the Rhizophora and Bruguiera species, significantly within the near infrared (Kamaruzaman and Kasawani, 2007; Hauser et al., 2015), red-edge, and water vapor absorption regions (Hauser et al., 2015; Prasad and Gnanappazham, 2016).
The utilization of derived vegetation and biophysical indices was previously reported to be more effective for mangrove characterization and biomass estimation than using directly the multispectral bands of Sentinel-2 (Baloloy et al., 2018). The Sentinel-2 derived products have highlighted specific mangrove features, which facilitated the creation of mangrove zonation. The PCA-transformation step further allowed accentuation of the object-intrinsic information, separating noise from useful information. When applied to the mangrove pixels, the resulting PC bands provided the most significant spectral variations within the mangroves, and combination of these PCA bands reflected species composition and biochemical/biophysical properties that are unique for each zone.
The proposed mangrove zonation workflow can map major zones of mangroves, but is usually limited up to genera level only due to the spatial limitation of the satellite data (10 m). The Avicennia zone in KII is composed of four species that cannot be further separated into smaller species-specific zones. The zonation map can also highlight and separate distinct canopy conditions such as damaged mangroves and sparse mangrove cover which will be helpful in identifying priority sites for reforestation and other mitigation measures.
This zonation workflow has utilized a total of nine vegetation, water, and biophysical inputs. To determine if the resulting classification accuracies will be further improved by adding more vegetation indices, a post-mapping analysis was conducted wherein additional inputs was included before PCA transformation. The selected indices, all within the SNAP Radiometric Indices Operator, are the Soil Adjusted Vegetation Index (SAVI), Transformed Soil Adjusted Vegetation Index, Modified Soil Adjusted Vegetation Index (MSAVI), Ratio Vegetation Index (RVI), Green Normalized Difference Vegetation Index (GNDVI), Weighted Difference Vegetation Index (WDVI), and Atmospherically Resistant Vegetation Index (ARVI). It was tested for the Busuanga site and the accuracy and kappa coefficients of the new output maps were compared with the original output. Results show that the additional vegetation indices did not improve the accuracy of the original input (94.4%), with values ranging only from 66 to 93%. The kappa coefficients is also higher with the original input (0.92) as compared with the application of additional indices (0.52–0.89). The results indicated that the original input can already highlight major mangrove zonation, with NDVI, REIP, MNDWI, MCARI, and the five biophysical products that are all associated with vegetation properties and functions. Some indices have enhanced while some have lessen the accuracy for one or more target classes: mixed mangrove zone, Rhizophora zone, and damaged and sparse zone. Addition of SAVI, for example, generated higher accuracy in mapping mixed mangroves (98%) than the original 9-band input, but it gave lower accuracy in mapping the sparse and damaged zone (90.7%). Low accuracy in this zone was also observed with the modified SAVI indices–the MSAVI and TSAVI. Since SAVI uses a soil-brightness correction factor, it is not well suited in isolating areas with sparse canopy cover as it is less sensitive to changes in vegetation density and greenness as compared to NDVI and MCARI. Meanwhile, the use of RVI and ARVI has increased the accuracy in mapping the Rhizophora zone but reduced the accuracy in mapping the mixed mangrove zones. The Rhizophora zone is usually denser than the other zones, and indices such as RVI are known to be efficient in mapping those vegetation with high density coverage, but is sensitive to atmospheric effects in sparse or mixed covers (Xue and Su, 2017). Further, the set of inputs consists of two or more additional vegetation indices has mostly resulted to lower overall accuracies, such as the use of RVI + GNVI (84%), GNVI + WDVI (88.7%), and SAVI + RVI + GNVI + WDVI + ARVI (69.4%). Multiple vegetation indices have reduced the accuracies due to redundant features extracted from the input data. Although PCA can trim down the significantly correlated variables, it will still create a new set of features that is a linear combination of these input features. Even a small increase in data multicollinearity will negatively affect the MLC results. The relationships between the predictors and the highly correlated variables can influence the resulting variance-covariance matrix. It is therefore important to check for data dimensionality and orthogonality of the additional vegetation indices prior to PCA and MLC. The original input dataset utilized in this study was found to be the optimal input for the zonation methodology with relatively high accuracies for all detected zones.
Nationwide Zonation Map
The proposed workflow was applied to a nationwide-scale mangrove zonation mapping in the Philippines. Level 2 Sentinel-2 products acquired in year 2020 were used as the satellite input, generating a large dataset of vegetation, water, and biophysical products. A range of three to seven zones were detected for each Sentinel-2 tile. The output nationwide mangrove zonation map (Figure 8) will be validated through ground GPS sampling and UAS in the upcoming mangrove field surveys.
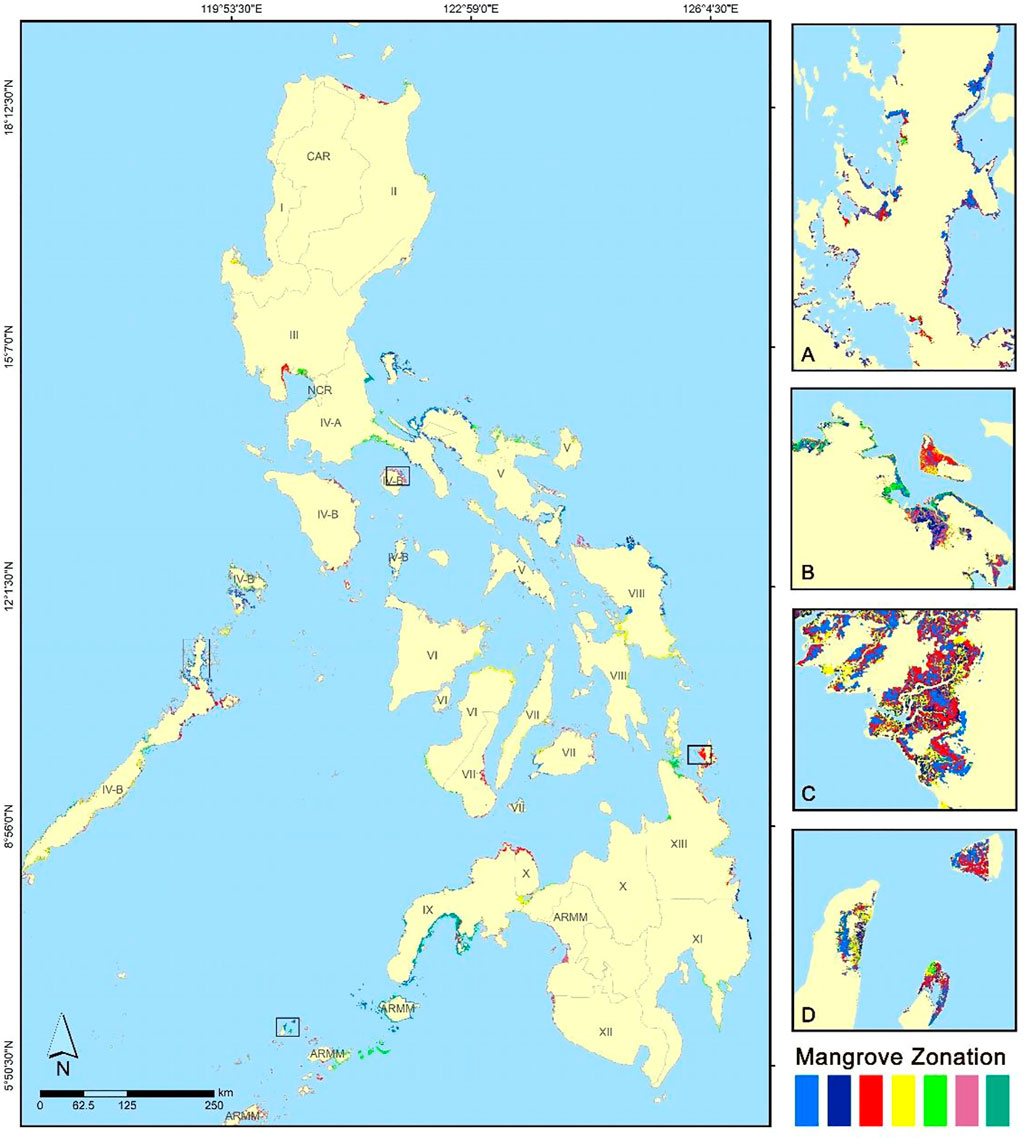
FIGURE 8. Mangrove zonation map of the Philippines for year 2020 generated using Sentinel 2-derived indices and biophysical dataset. Zoomed-in mangroves zonation are shown for sample areas outside the initial study sites: (A) El Nido, Palawan, (B) Santa Cruz, Marinduque, (C) Del Carmen, Surigao de Norte, and (D) Pandukan and Kulassian islands, Sulu. The colors represent the different zonation per Sentinel-2 tile, but the corresponding actual mangrove zone for each color may differ between tiles. The generated zonation per satellite image ranges from three to seven zones, with varying clusters observed in different distances from the coast and rivers.
Conclusion
The developed methodology for mangrove zonation mapping can provide rapid delineation of mangrove extent and mangrove zonation by extracting information from Sentinel2-based biophysical, water, and vegetation products. In this study, we first utilized Sentinel-2 multispectral bands to extract the mangrove extent within four selected sites: KII Ecopark in Aklan, Coron and Busuanga in the Philippines, and Fukido Mangrove Park in Japan. The method was applied across the sites and the resulting extent was comparable to available secondary data on mangrove areas. The extent map was used as a boundary to limit the working area for the mangrove zonation steps. Three to five zones were identified in the output zonation products within the study sites. The observed zonation was found to be affected by environment gradients such as salinity, elevation, geomorphology, nutrient availability, soil properties, and light availability; and these information were indirectly captured through Sentinel-2 products such as LAI, NDVI, MCARI, REIP, FPAR, fractional vegetation cover, background moisture, chlorophyll-a concentration, and canopy moisture layers. The capabilities of these derived variables to highlight canopy variation and mangrove zonation were discussed. The zonation workflow can detect major mangrove zones including single genus-dominant clusters, damaged areas, and sparse mangrove stands. The results of this study showed the potential of Sentinel-2 system for rapid mangrove zonation mapping especially when its vegetation, water, and biophysical products were utilized. The findings of this paper provide information on the current extent, zonation, distribution, and health status of the mangrove forests in the study sites as influenced by the prevailing biophysical and ecological conditions.
Data Availability Statement
The original contributions presented in the study are included in the article/supplementary material, further inquiries can be directed to the corresponding author.
Author Contributions
A.B.B and A.C.B developed and applied the extent and zonation workflows; while SS and KN provided data and assistance during the field data validation in Fukido mangrove site, including preliminary review of this paper.
Funding
This research is funded by the The Project for Comprehensive Assessment and Conservation of Blue Carbon Ecosystems and their Services in the Coral Triangle (BlueCARES) funded by Japan International Cooperation Agency (JICA) and Japan Science and Technology Agency (JST) under the SATREPS Program. Collection of field validation data was conducted by the Integrated Assessment and Modelling of Blue Carbon Ecosystems for Conservation and Adaptive Management (IAMBlueCECAM) Project 1: Mangrove Remote Sensing using LiDAR, RADAR, Multispectral and Hyperspectral Data (MaRS), which was funded by the DOST Philippine Council for Industry, Energy and Emerging Technology Research and Development (PCIEERD). Fukido mangrove site field data collection was supported by Grant-in-Aid for JSPS Fellows (No. 24002371) of the Japan Society of the Promotion of Science (JSPS).
Conflict of Interest
The authors declare that the research was conducted in the absence of any commercial or financial relationships that could be construed as a potential conflict of interest.
Publisher’s Note
All claims expressed in this article are solely those of the authors and do not necessarily represent those of their affiliated organizations, or those of the publisher, the editors and the reviewers. Any product that may be evaluated in this article, or claim that may be made by its manufacturer, is not guaranteed or endorsed by the publisher.
Acknowledgments
Utmost gratitude is given to all co-researchers, collaborators, project leaders, and experts under the BlueCARES and the IAMBlueCECAM projects for providing the technical expertise and field assistance needed in completing this research. Field data collection was done with the assistance of R.J. Argamosa, J.B.L Dumalag, C. Candido, L.L. Dimapilis, and J. Alcantara. The nationwide zonation mapping was carried with the help of BlueCARES interns: P.H. Camacho, C. Coleta, D.M. Daguman, K.M.K. Daray, A. de Luna, Y.Y. Mallari, and G.J. Viray. Further, the researchers would like to thank the Environmental Systems Applications of Geomatics Engineering (EnviSAGE) laboratory for the equipment and assistance given in conducting the study.
References
Abou Seedo, K., Abido, M. S., Salih, A., and Abahussain, A. (2018). Morphophysiological Traits of Gray Mangrove (Avicennia marina (Forsk.) Vierh.) at Different Levels of Soil Salinity. Int. J. For. Res. 2018, 1–9. doi:10.1155/2018/7404907
Addabbo, P., Focareta, M., Marcuccio, S., Votto, C., and Ullo, S. L. (2016). Contribution of Sentinel-2 Data for Applications in Vegetation Monitoring. Acta IMEKO. 5, 44–52. doi:10.21014/acta_imeko.v5i2.352
Ajithkumar, T. T., Thangaradjou, T., and Kannan, L. (2008). Spectral Reflectance Properties of Mangrove Species of the Muthupettai Mangrove Environment, Tamil Nadu. J. Environ. Biol. 29, 785–788.
Allen, J. A., and Duke, N. C. J. E. (2006). Bruguiera Gymnorrhiza (Large-Leafed Mangrove). Permanent Agric. Resour.
Alsaaideh, B., Al-Hanbali, A., Tateishi, R., Kobayashi, T., and Hoan, N. T. (2013). Mangrove Forests Mapping in the Southern Part of Japan Using Landsat ETM+ With DEM. Jgis. 05, 369–377. doi:10.4236/jgis.2013.54035
Arafijo, R. J., Jaramillo, J. C., and Snedaker, S. C. (1997). Leaf Area Index and Leaf Size Differences in Two Red Mangrove forest Types in South Florida. Bull. Mar. Sci. 60, 643–647.
Aragones, E. G., Rojo, J. P., and Pitargue, F. C. (1998). Botanical Identification Handbook on Philippine Mangrove Trees. DOST, Philippines: Forest Products Research and Development Institute, 125. ISBN 9789716260038.
Baba, S., Chan, H. T., Kainuma, M., Kezuka, M., Chan, E. W. C., and Tangah, J. (2016). Botany, Uses, Chemistry and Bioactivities of Mangrove Plants III: Xylocarpus Granatum. Isme/glomis Elect. J. 14, 1–4. ISSN 1880-7682.
Baloloy, A. B., Blanco, A. C., Candido, C. G., Argamosa, R. J. L., Dumalag, J. B. L. C., Dimapilis, L. L. C., et al. (2018). Estimation of Mangrove Forest Aboveground Biomass Using Multispectral Bands, Vegetation Indices and Biophysical Variables Derived From Optical Satellite Imageries: Rapideye, Planetscope and Sentinel-2. ISPRS Ann. Photogramm. Remote Sens. Spat. Inf. Sci. IV-3, 29–36. doi:10.5194/isprs-annals-IV-3-29-2018
Baloloy, A. B., Blanco, A. C., Sta. Ana, R. R. C., Ana, K., and Nadaoka, K. (2020). Development and Application of a New Mangrove Vegetation Index (MVI) for Rapid and Accurate Mangrove Mapping. ISPRS J. Photogrammetry Remote Sensing. 166, 95–117. doi:10.1016/j.isprsjprs.2020.06.001
Bolstad, P. V., and Lillesand, T. M. (1991). Rapid Maximum Likelihood Classification. Photogramm. Eng. Rem. Sens. 57, 67–74.
Buitre, M., Zhang, H., and Lin, H. (2019). The Mangrove Forests Change and Impacts From Tropical Cyclones in the Philippines Using Time Series Satellite Imagery. Remote Sensing. 11, 688. doi:10.3390/rs11060688
Bunt, J. (1996). Mangrove Zonation: An Examination of Data From Seventeen Riverine Estuaries in Tropical Australia. Ann. Bot. 78, 333–341. doi:10.1006/anbo.1996.0128
Clevers, J. G. P. W., de Jong, S. M., Epema, G. F., Van der Meer, F., Bakker, W. H., Skidmore, A. K., et al. (2001). MERIS and the Red-Edge Position. Int. J. Appl. Earth Observation Geoinformation. 3, 313–320. doi:10.1016/S0303-2434(01)85038-8
Costa, L. D., Budiastuti, M. T. H. S., Sutrisno, J., and Sunarto, (2019). The Diversity of Plant Species in a Mangrove forest in the Coast of Metinaro, Timor-Leste. IOP Conf. Ser. Earth Environ. Sci. 256, 012026. doi:10.1088/1755-1315/256/1/012026
Daughtry, C., Walthall, C. L., Kim, M. S., Colstoun, E. B. D., and McMurtrey, J. E. I. (2000). Estimating Corn Leaf Chlorophyll Concentration From Leaf and Canopy Reflectanceflectance. Remote Sens. Environ. 74, 229–239. doi:10.1016/S0034-4257(00)00113-9
Deilmai, B. R., Ahmad, B. B., and Zabihi, H. (2014). Comparison of Two Classification Methods (MLC and SVM) to Extract Land Use and Land Cover in Johor Malaysia. IOP Conf. Ser. Earth Environ. Sci. 20, 012052–012056. doi:10.1088/1755-1315/20/1/012052
Delegido, J., Fernández, G., Gandía, S., and Moreno, J. (2008). Retrieval of Chlorophyll Content and LAI of Crops Using Hyperspectral Techniques: Application to PROBA/CHRIS Data. Int. J. Remote Sensing. 29, 7107–7127. doi:10.1080/01431160802238401
Díaz, B. M., and Blackburn, G. A. (2003). Remote Sensing of Mangrove Biophysical Properties: Evidence From a Laboratory Simulation of the Possible Effects of Background Variation on Spectral Vegetation Indices. Int. J. Remote Sensing. 24 (1), 53–73. doi:10.1080/01431160305012
Duke, N. C. (2006). “Indo-West Pacific Stilt Mangroves: Rhizophora Apiculata, R. mucronata, R. Stylosa, R. X Annamalai, R. X Lamarckii,” in Traditional Trees of Pacific Islands: Their Culture, Environment, and Use. Permanent Agriculture Resources (PAR). Editor C. R. Elevitch Holualoa, Hawaii, 641–660.
Dulyapurk, V., Taparhudee, W., Yoonpundh, R., and Jumnongsong, S. (2007). Multidisciplinary Situation Appraisal of Mangrove Ecosystems in ThailandMangrove Ecosystem and Community Livelihoods in Nakhon Si Thammarat, Thailand. Available at: https://enaca.org/?id=596.
Eklundh, L., Sjöström, M., Lars, Ardö, J., and Jönsson, P. (2012). “High Resolution Mapping of Vegetation Dynamics from Sentinel-2,” in Proceedings of the first Sentinel-2 preparatory symposium (Italy: Frascati).
European Space Agency (2021). The Copernicus Open Access Hub. Available at: https://scihub.copernicus.eu (Accessed, 2018-2020).
Friess, D. A., and Watson, J. G. (2016). Inundation Classes, and Their Influence on Paradigms in Mangrove Forest Ecology. Wetlands. 37 (4), 603–613. doi:10.1007/s13157-016-0747-6
Gao, Y., Gao, J., Wang, J., Wang, S., Li, Q., Zhai, S., et al. (2017). Estimating the Biomass of Unevenly Distributed Aquatic Vegetation in a Lake Using the Normalized Water-Adjusted Vegetation Index and Scale Transformation Method. Sci. Total Environ. 601-602, 998–1007. doi:10.1016/j.scitotenv.2017.05.163
Garces, L. R., Pido, M. D., Tupper, M. H., and Silvestre, G. T. (2013). Evaluating the Management Effectiveness of Three Marine Protected Areas in the Calamianes Islands, Palawan Province, Philippines: Process, Selected Results and Their Implications for Planning and Management. Ocean Coastal Management. 81, 49–57. doi:10.1016/j.ocecoaman.2012.07.014
Ghandi, S., and Jones, T. G. (2019). Identifying Mangrove Deforestation Hotspots in South Asia Southeast Asia and Asia-Pacific. Remote Sens. 11, 728. doi:10.3390/rs11060728
Giri, C., and Muhlhausen, J. (2008). Mangrove Forest Distributions and Dynamics in Madagascar (1975-2005). Sensors. 8, 2104–2117. doi:10.3390/s8042104
Göltenboth, F., Timotius, K. H., Milan, P. P., and Margraf, J. (2006). Ecology of Insular Southeast Asia: The Indonesian Archipelago. Elsevier. doi:10.1016/B978-0-444-52739-4.X5000-1
Gupta, K., Mukhopadhyay, A., Giri, S., Chanda, A., Datta Majumdar, S., Samanta, S., et al. (2018). An index for Discrimination of Mangroves From Non-Mangroves Using Landsat 8 OLI Imagery. MethodsX. 5, 1129–1139. doi:10.1016/j.mex.2018.09.011
Guo, Q., Wu, X., Sang, X., Fu, Y., Zang, Y., and Gong, X. (2020). An Integrated Study on Change Detection and Environment Evaluation of Surface Water. Appl. Water Sci. 10, 28. doi:10.1007/s13201-019-1109-3
Guyot, G., Baret, F., and Major, D. J. (1988). High Spectral Resolution: Determination of Spectral Shifts Between the Red and Infrared. Int. Arch. Photogramm. Remote Sens. 11, 750–760.
Hauser, L. T., Vũ Giang, N., An Bình, N., Trang, N. T. Q., Hiéu, N. M., Toan, L. Q., and Hòa, P. V. (2015). “Spectral Discrimination of Common Mangrove Species in Ca Mau peninsula, Vietnam: Using a Large Sample Set of Hyperspectral In-Situ Canopy Data,” in GIS 2015 Conference. doi:10.13140/RG.2.1.4535.3683
Heenkenda, M. K., Joyce, K. E., Maier, S. W., and de Bruin, S. (2015). Quantifying Mangrove Chlorophyll From High Spatial Resolution Imagery. ISPRS J. Photogrammetry Remote Sensing. 108, 234–244. doi:10.1016/j.isprsjprs.2015.08.003
Herrmann, I., Pimstein, A., Karnieli, A., Cohen, Y., Alchanatis, V., and Bonfil, D. J. (2011). LAI Assessment of Wheat and Potato Crops by VENμS and Sentinel-2 Bands. Remote Sensing Environ. 115, 2141–2151. doi:10.1016/j.rse.2011.04.018
Hogart, P. J. (2010). The Biology of Mangroves and Seagrass. Second Edition. New York: Oxford University Press.
Hu, L., Xu, N., Liang, J., Li, Z., Chen, L., and Zhao, F. (2020). Advancing the Mapping of Mangrove Forests at National-Scale Using Sentinel-1 and Sentinel-2 Time-Series Data With Google Earth Engine: A Case Study in China. Remote Sensing. 12, 3120. doi:10.3390/rs12193120
Huang, H., Legarsky, J., and Othman, M. (2007). Land-Cover Classification Using Radarsat and Landsat Imagery for St. Louis, Missouri. Photogramm Eng. Remote Sensing. 73, 37–43. doi:10.14358/pers.73.1.37
Immitzer, M., Vuolo, F., and Atzberger, C. (2016). First Experience With Sentinel-2 Data for Crop and Tree Species Classifications in Central Europe. Remote Sensing. 8, 166. doi:10.3390/rs8030166
Jia, M., Wang, Z., Wang, C., Mao, D., and Zhang, Y. (2019). A New Vegetation Index to Detect Periodically Submerged Mangrove Forest Using Single-Tide Sentinel-2 Imagery. Remote Sensing. 11, 2043. doi:10.3390/rs11172043
Jolliffe, I. T., and Cadima, J. (2016). Principal Component Analysis: a Review and Recent Developments. Phil. Trans. R. Soc. A. 374, 20150202. doi:10.1098/rsta.2015.0202
Juniansah, A., Tama, G. C., Febriani, K. R., Baharain, M. N., Kanekaputra, T., Wulandari, Y. S., et al. (2018). Mangrove Leaf Area Index Estimation Using sentinel 2A Imagery in Teluk Ratai, Pesawaran Lampung. IOP Conf. Ser. Earth Environ. Sci. 165, 012004. doi:10.1088/1755-1315/165/1/012004
Kamaruzaman, J., and Kasawani, I. (2007). Imaging Spectrometry on Mangrove Species Identification and Mapping in Malaysia. WSEAS Trans. Biol. Biomed. 4, 118–126. ISSN: 1109-9518.
Kanniah, K., Sheikhi, A., Cracknell, A., Goh, H., Tan, K., Ho, C., et al. (2015). Satellite Images for Monitoring Mangrove Cover Changes in a Fast Growing Economic Region in Southern Peninsular Malaysia. Remote Sensing. 7, 14360–14385. doi:10.3390/rs71114360
Kovacs, J. M., Flores-Verdugo, F., Wang, J., and Aspden, L. P. (2004). Estimating Leaf Area Index of a Degraded Mangrove forest Using High Spatial Resolution Satellite Data. Aquat. Bot. 80, 13–22. doi:10.1016/j.aquabot.2004.06.001
Kuenzer, C., Bluemel, A., Gebhardt, S., Quoc, T. V., and Dech, S. (2011). Remote Sensing of Mangrove Ecosystems: A Review. Remote Sensing. 3, 878–928. doi:10.3390/rs3050878
Kumar, T., Mandal, A., Dutta, D., Nagaraja, R., and Dadhwal, V. K. (2019). Discrimination and Classification of Mangrove Forests Using EO-1 Hyperion Data: a Case Study of Indian Sundarbans. Geocarto Int. 34, 415–442. doi:10.1080/10106049.2017.1408699
Li, Y., Wang, H., and Li, X. B. (2015). Fractional Vegetation Cover Estimation Based on an Improved Selective Endmember Spectral Mixture Model. Plos One. 10, e0124608. doi:10.1371/journal.pone.0124608
Liu, L., Peng, D., Hu, Y., and Jiao, Q. (2013). A Novel In Situ FPAR Measurement Method for Low Canopy Vegetation Based on a Digital Camera and Reference Panel. Remote Sensing. 5, 274–281. doi:10.3390/rs5010274
Liu, X., Fatoyinbo, T. E., Thomas, N. M., Guan, W. W., Zhan, Y., Mondal, P., et al. (2021). Large-Scale High-Resolution Coastal Mangrove Forests Mapping Across West Africa With Machine Learning Ensemble and Satellite Big Data. Front. Earth Sci. 8. doi:10.3389/feart.2020.560933
Long, J. B., and Giri, C. (2011). Mapping the Philippines' Mangrove Forests Using Landsat Imagery. Sensors. 11, 2972–2981. doi:10.3390/s11030297210.3390/s110302972
Ma, L., Li, M., Ma, X., Cheng, L., Du, P., and Liu, Y. (2017). A Review of Supervised Object-Based Land-Cover Image Classification. ISPRS J. Photogrammetry Remote Sensing. 130, 277–293. doi:10.1016/j.isprsjprs.2017.06.001
Main-Knorn, M., Pflug, B., Debaecker, V., and Louis, J. (2015). Calibration and Validation Plan for the L2A Processor and Products of the Sentinel-2 Mission. Int. Arch. Photogramm. Remote Sens. Spat. Inf. Sci. XL-7/W3, 1249–1255. doi:10.5194/isprsarchives-XL-7-W3-1249-2015
Manna, S., and Raychaudhuri, B. (2019). Stress Mapping of Sundarban Mangroves With Sentinel-2 Images Using Discriminant Normalised Vegetation Index (DNVI) and Fuzzy Classification Technique. J. Geomatics. 13, 111–117.
Pastor-Guzman, J., Atkinson, P., Dash, J., and Rioja-Nieto, R. (2015). Spatiotemporal Variation in Mangrove Chlorophyll Concentration Using Landsat 8. Remote Sensing. 7 (11), 14530–14558. doi:10.3390/rs71114530
Prasad, K. A., and Gnanappazham, L. (2016). Multiple Statistical Approaches for the Discrimination of Mangrove Species of Rhizophoraceae Using Transformed Field and Laboratory Hyperspectral Datafield and Laboratory Hyperspectral Data. Geocarto Int. 31, 891–912. doi:10.1080/10106049.2015.1094521
Primavera, J. H., Sadaba, R. B., Lebata, M. J. H. L., and Altamirano, J. P. (2004). Handbook of Mangroves in the Philippines - Panay. Iloilo, Philippines: Aquaculture Department, Southeast Asian Fisheries Development Center Tigbauan. Available at: http://hdl.handle.net/10862/3053.
Primavera, J. H., and Sadaba, R. B. (2012). Beach forest Species and Mangrove Associates in the Philippines. Philippines: Southeast Asian Fisheries Development Center (SEAFDEC).
Primavera, J. H. (1998). The Tungog (Ceriops Taga L) Industry and Prospects for Mangrove Rehabilitation. SEAFDEC Asian Aquaculture. XX (6).
Proisy, C., Mougin, E., Fromard, F., Trichon, V., and Karam, M. A. (2002). On the Influence of Canopy Structure on the Radar Backscattering of Mangrove Forests. Int. J. Remote Sensing. 23, 4197–4210. doi:10.1080/01431160110107725
Ragavan, P., Mohan, P. M., Jayaraj, R. S. C., Ravichandran, K., and Saravanan, S. (2015). Rhizophora mucronata Var. Alokii - a New Variety of Mangrove Species From the Andaman and Nicobar Islands, India (Rhizophoraceae). PhytoKeys. 52, 95–103. doi:10.3897/phytokeys.52.5037
Ramsey, E. W., and Jensen, J. R. (1996). Remote Sensing of Mangrove Wetlands: Relating Canopy Spectra to Site-Specific Data. Photogramm. Eng. Rem. Sens. 62, 939–948.
Rao, M., Silber-Coats, Z., Powers, S., Fox III, L., and Ghulam, A. (2017). Mapping Drought-Impacted Vegetation Stress in California Using Remote Sensing. GIScience & Remote Sensing. 54, 185–201. doi:10.1080/15481603.2017.1287397
Roslani, M. A., Mustapha, M. A., Lihan, T., and Juliana, W. A. W. (2013). Classification of Mangroves Vegetation Species Using Texture Analysis on RapidEye Satellite Imagery. AIP Conf. Proc. 1571, 480. doi:10.1063/1.4858701
Rouse, J. W., Has, R. H., Schell, J. A., and Deering, D. W. (1973). “Monitoring Vegetation Systems in the Great Plains with ERTS,” in Proceedings of the Third ERTS Symposium (NASA), Washington, DC, USA, SP-351 I, 309–317.
Ruiliang Pu, R. L., Peng Gong, P., Biging, G. S., and Larrieu, M. R. (2003). Extraction of Red Edge Optical Parameters From Hyperion Data for Estimation of forest Leaf Area index. IEEE Trans. Geosci. Remote Sensing. 41, 916–921. doi:10.1109/tgrs.2003.813555
Ruwa, R. K. (1993). Disturbances in Mangrove Vegetation and Their Possible Influence on Other Biota. SAREC Documentation: Conf. Rep. 1, 104–126.
Samadder, A., and Jayakumar, S. (2015). Leaf Anatomy of Some Members of Rhizophoracae (Mangroves) in Port Blair, Andaman and Nicobar Islands. J. Andaman Sci. Assoc. 20, 178–185.
SEAFDEC. Southeast Asian Fisheries Development Center (2010). “Katunggan it Ibajay Mangrove Eco-Park in Aklan,” in AQD Matters: In-House Newsletter of the SEAFDEC Aquaculture Department, Philippines.
Setyawan, A. D., and Ulumuddin, Y. I. (2012). Species Diversity of Rhizophora in Tambelan Islands, Natuna Sea, Indonesia. Biodiversitas. 13, 172–177. doi:10.13057/biodiv/d130402
Shalaby, A., and Tateishi, R. (2007). Remote Sensing and GIS for Mapping and Monitoring Land Cover and Land-Use Changes in the Northwestern Coastal Zone of Egypt. Appl. Geogr. 27, 28–41. doi:10.1016/j.apgeog.2006.09.004
Sharma, S., Yasuoka, J., Nakamura, T., Watanabe, A., and Nadaoka, K. (2014). “The Role of Hydroperiod, Soil Moisture and Distance From the River Mouth on Soil Organic Matter in Fukido Mangrove Forest, Ishigaki Island, Japan,” in Proceeding of the Intl. Conf. on Advances in Applied Science and Environmental Engineering. 2014. ISBN: 978-1-63248-004-0.
Sun, Q., Jiao, Q., and Dai, H. (2018). “Evaluating the Capabilities of Vegetation Spectral Indices on Chlorophyll Content Estimation at Sentinel-2 Spectral Resolutions,” in Mippr 2017: Remote Sensing Image Processing, Geographic Information Systems, and Other Applications. Proceedings of SPIE. Editors N. Sang, J. Ma, and Z. Chen (Spie-Int Soc Optical Engineering). doi:10.1117/12.2285611
Surya, S., and Hari, N. (2018). Leaf Anatomical Adaptation of Some True Mangrove Species in Kerala. Int. J. Pharm. Sci. Res. 2, 11–14.
The Fish Site. (2009). Mangrove: Species Diversity, Community Structure and Current Status. Available at: https://thefishsite.com/articles/mangrove-species-diversity-community-structure-and-current-status (Accessed March, 2020)
Tian, J., Wang, L., Li, X., Gong, H., Shi, C., Zhong, R., et al. (2017). Comparison of UAV and WorldView-2 Imagery for Mapping Leaf Area Index of Mangrove Forest. Int. J. Appl. Earth Observation Geoinformation. 61, 22–31. doi:10.1016/j.jag.2017.05.002
Topaloğlu, R. H., Sertel, E., and Musaoğlu, N. (2017). Assessment of Classification Accuracies of Sentinel-2 and Landsat-8 Data for Land Cover/Use Mapping. Int. Arch. Photogramm. Remote Sens. Spat. Inf. Sci. XLI-B8, 1055–1059. doi:10.5194/isprs-archives-xli-b8-1055-2016
Valderrama-Landeros, L., Flores-de-Santiago, F., Kovacs, J. M., and Flores-Verdugo, F. (2018). An Assessment of Commonly Employed Satellite-Based Remote Sensors for Mapping Mangrove Species in Mexico Using an NDVI-Based Classification Scheme. Environ. Monit. Assess. 190, 23. doi:10.1007/s10661-017-6399-z
Wang, J., Xu, Y., and Wu, G. (2020). The Integration of Species Information and Soil Properties for Hyperspectral Estimation of Leaf Biochemical Parameters in Mangrove forest. Ecol. Indicators. 115, 106467. doi:10.1016/j.ecolind.2020.106467
Weiss, M., and Baret, F. (2016). S2 ToolBox Level 2 Products: LAI, FAPAR, FCOVER”, Version 1.1. ESA. S2 Toolbox Level 2 Product Algorithms v1.1. Issued 05.
Wen, J., Lai, X., Shi, X., and Pan, X. (2013). Numerical Simulations of Fractional Vegetation Coverage Influences on the Convective Environment Over the Source Region of the Yellow River. Meteorol. Atmos. Phys. 120, 1–10. doi:10.1007/s00703-013-0241-0
Winarso, G., Purwanto, A. D., and Yuwono, D. M. (2014). “New Mangrove Index as Degradation/Health Indicator Using Remote Sensing Data: Segara Anakan and Alas Purwo Case Study,” in 12th Biennial Conference of Pan Ocean Remote Sensing Conference.
Xiao, H., Su, F., Fu, D., Lyne, V., Liu, G., Pan, T., et al. (2021). Optimal and Robust Vegetation Mapping in Complex Environments Using Multiple Satellite Imagery: Application to Mangroves in Southeast Asia. Int. J. Appl. Earth Observation Geoinformation. 99, 102320. doi:10.1016/j.jag.2021.102320
Xu, H. (2006). Modification of Normalised Difference Water Index (NDWI) to Enhance Open Water Features in Remotely Sensed Imagery. Int. J. Remote Sensing. 27, 3025–3033. doi:10.1080/01431160600589179
Xue, J., and Su, B. (2017). Significant Remote Sensing Vegetation Indices: A Review of Developments and Applications. J. Sensors. 2017, 1–17. doi:10.1155/2017/1353691
Yuvaraj, E., Dharanirajan, K., Jayakumar, S., Saravanan, , and Balasubramaniam, J. (2017). Distribution and Zonation Pattern of Mangrove Forest in Shoal Bay Creek, Andaman Islands, India. Indian J. Geo Mar. Sci. 46 (03), 597–604.
Zhang, S., Chen, H., Fu, Y., Niu, H., Yang, Y., and Zhang, B. (2019). Fractional Vegetation Cover Estimation of Different Vegetation Types in the Qaidam Basin. Sustainability. 11, 864. doi:10.3390/su11030864
Zhang, X., and Tian, Q. (2013). A Mangrove Recognition Index for Remote Sensing of Mangrove Forest From Space. Curr. Sci. 105, 1149–1154.
Zhao, Y., Yan, C., Lu, S., Wang, P., Qiu, G. Y., and Li, R. (2019). Estimation of Chlorophyll Content in Intertidal Mangrove Leaves With Different Thicknesses Using Hyperspectral Data. Ecol. Indicators. 106, 105511. doi:10.1016/j.ecolind.2019.105511
Keywords: mangrove forest, mangrove zonation, mangrove extent, Sentinel-2, biophysical layers
Citation: Baloloy AB, Blanco AC, Sharma S and Nadaoka K (2021) Development of a Rapid Mangrove Zonation Mapping Workflow Using Sentinel 2-Derived Indices and Biophysical Dataset. Front. Remote Sens. 2:730238. doi: 10.3389/frsen.2021.730238
Received: 24 June 2021; Accepted: 23 August 2021;
Published: 21 September 2021.
Edited by:
Juan Carlos Jimenez, University of Valencia, SpainReviewed by:
Mustafa Tolga Esetlili, Ege University, TurkeyLachezar Filchev, Space Research and Technology Institute (BAS), Bulgaria
Copyright © 2021 Baloloy, Blanco, Sharma and Nadaoka. This is an open-access article distributed under the terms of the Creative Commons Attribution License (CC BY). The use, distribution or reproduction in other forums is permitted, provided the original author(s) and the copyright owner(s) are credited and that the original publication in this journal is cited, in accordance with accepted academic practice. No use, distribution or reproduction is permitted which does not comply with these terms.
*Correspondence: Alvin B. Baloloy, YWJiYWxvbG95QHVwLmVkdS5waA==