 Melinda Laituri1*
 Orion S. E. Cardenas-Ritzert2
 Jody C. Vogeler2
 Shahriar Shah Heydari2
 Melissa R. McHale3
- 1Department of Ecosystem Science and Sustainability, Colorado State University, Fort Collins, CO, United States
- 2Natural Resource Ecology Laboratory, Colorado State University, Fort Collins, CO, United States
- 3Department of Forest Resources Management, University of British Columbia, Vancouver, BC, Canada
Urbanization is one of the leading drivers of Land Cover Land Use Change (LCLUC) globally, and African countries are at the forefront of urban expansion trends, specifically in small and medium sized cities. Multiresolution spatial datasets can be used to guide sustainable urban management and assess progress towards the U.N. Sustainable Development Goals (SDGs), specifically SDG 11.3.1 indicator (the relationship between land consumption rate and population growth rate) to track urban change. We present a two-tiered land imaging approach identifying urban change hotspots in three African countries between 2016 and 2020 and characterize urban expansion in three secondary cities that have an SDG 11.3.1 indicator ratio greater that two (Mekelle, Ethiopia; Polokwane, South Africa, Benin City, Nigeria). This ratio indicates that land consumption outpaces population growth where patterns of urban expansion include leapfrog development, infill, and corridors revealing a dynamic urban expansion that outpaces administrative boundaries. We propose a “pixels to people” approach that defines not only urban form but includes urban function in secondary cities at multiple spatial scales where fine resolution depictions and local engagement create more robust, comprehensive datasets for urban planning.
1 Introduction
Urbanization is one of the leading drivers of Land Cover Land Use Change (LCLUC) globally, and African countries are at the forefront of urban expansion trends. Predictions indicate that in Africa, urban populations will double by 2050 outnumbering people living in cities around the world (United Nations DESA, 2018; African Union, 2024). By 2030, global urban expansion will increase by 1.2 million km2 of new built-up areas (World Bank Group, 2023) exhibiting a 12-fold increase in urban land area (Fourchard, 2011; Angel, 2023). These predictions indicate that a majority of LCLUC globally will transform both natural and managed landscapes to residential neighborhoods, informal settlements, and intensely modified cityscapes. Policy makers and planners need to know more about the quality of different urban areas (e.g., access to services, infrastructure), and LCLUC scientists need to be more explicit in mapping the development of multifunctional land uses of cities over time to better inform planning efforts (McHale et al., 2015).
Africa is leading the way in rapid urbanization in small and medium sized cities. These secondary cities are the new vital economic centers for large regions of the world, often providing safer, less polluted refuge for urban residents seeking a higher quality of life (Roberts, 2014). There is growing evidence that with the development of secondary cities, this urbanization process is divergent from what we have experienced in the Global North historically (McHale et al., 2013; Nagendra et al., 2018). Secondary cities are the fastest growing urban areas, and especially in lower-and middle-income countries (LMIC), are experiencing the negative consequences of unplanned development including managing urbanization, sustainable development, investment for job creation and educational resources, as well as ensuring access to basic services across the range of economic levels. Furthermore, these cities are unique environments that generally have limited data and information on infrastructure, land tenure, and other planning resources (Roberts, 2014; United Nations HABITAT, 2021a, 2021b; Laituri and Sternlieb, 2018), while also largely neglected in remote sensing studies of urban land change (Reba and Seto, 2020). A better understanding of the impacts from LCLUC in rapidly expanding urban centers, such as secondary cities, can enhance efforts to plan for more sustainable development, mitigate long term influences on social and ecosystem services, and assess the health of urban socio-ecological function.
Multi-resolution spatial datasets that are widely available and consistently produced can be used for guiding sustainable urban management to improve the overall quality of urban environments. Such improved datasets and approaches can assist policy makers and planners to assess our progress towards internationally recognized Sustainable Development Goals (SDGs) developed by the United Nations as a universal call to action to end poverty, protect the planet, and ensure that by 2030 all people enjoy peace and prosperity. As the variety, quantity, and quality of Earth Observation platforms increase and computing capabilities and processing techniques rapidly advance, the value of monitoring resources in support of SDG indicators can be enhanced through applied research in the development and testing of improved spatial products and planning-relevant toolsets.
SDG 11 focuses on creating inclusive, safe, and resilient cities and human settlements. This goal tracks a suite of indicators to support more sustainable urban planning using Earth Observation Satellites and other widely available data sources. Specifically, we examine SDG Indicator 11.3.1. This indicator focuses on urban land expansion through a comparison of developed land use areas and population growth rates requiring data at moderate to high resolution capturing where and how cities are expanding to evaluate local urban change (Table 1). Using LCLUC approaches we can identify areas of rapid urban growth—hotspots—that exhibit urban patterns reflecting socio-ecological implications and define indicators of equitable growth (i.e., access to services, availability of green space, encroachment on rural villages). Hotspots may include locations of leap-frog development (new urban areas discontinuous from urban areas but functionally linked), urban corridors (urban development adjacent to major roadways), infill (new development in existing urban areas), extension (development at edge of urban areas), and inclusion (engulfing outlying urban areas, rural urbanization) (United Nations HABITAT, 2021a, 2021b).
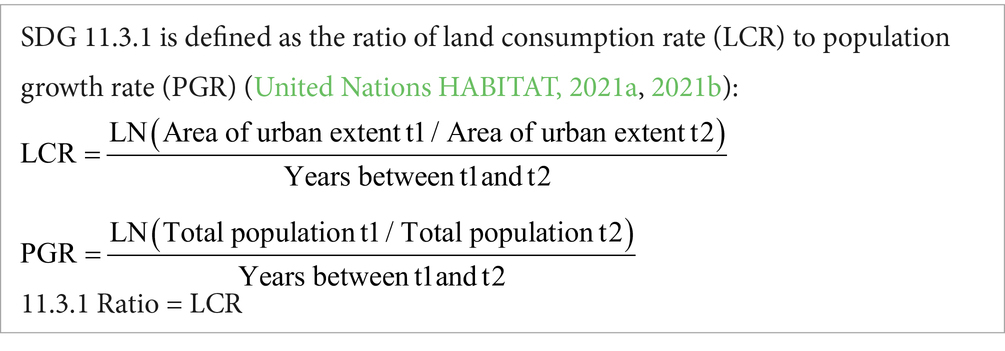
Table 1. Sustainable development goal 11.3.1 calculation (United Nations HABITAT, 2021a, 2021b).
The study of urbanization and its consequences has traditionally occurred at quite different scales and resolutions: (1) regional scales (including national and global), coarse (> 30 m pixels) and moderate (30 m pixels) resolution urbanization patterns, and (2) fine scale (city, neighborhood, parcel), very high resolution (< 3 m pixels) studies of urban heterogeneity. The regional scale and coarse/moderate resolution approaches are good for understanding the dynamic boundaries of urban growth, and how urban land expands into other surrounding land uses over time (Meentemeyer et al., 2013), while the strengths of the fine scale method enable scientists to analyze urban heterogeneity and accurately view all land covers within each land use with high spatial precision (Cadenasso et al., 2007). Studies that implement the first type of analysis are termed “red blob urbanization” analyses, where a series of maps over time presents a single urban class expanding across the landscape (Feng et al., 2018; Xu et al., 2016). Studies implementing fine scale methods attempt to understand landscape quality, human-environmental interactions, and tradeoffs in ecosystem services (Wang et al., 2022; Guan et al., 2023) but are often restricted in space and time due to limited access to Earth Observation data that support analyses at this resolution consistently across broad extents.
Urban mappable units derived from image processing and analysis of pixelated surfaces are based upon classification methods and urban mapping concepts (e.g., urban gradient, boundary, and form) (Figure 1). The configuration and composition of urban mappable units enable calculations of landscape metrics such as pattern, cluster, fragmentation, and urban extent (Pontius and Cheuk, 2006). Higher spatial resolution of urban pixels increases accuracy of land use capturing urban heterogeneity (Murtaza and Romshoo, 2014). The classification of urban mappable units yields added information to identify urban expansion and related hotspots to inform land planning strategies.
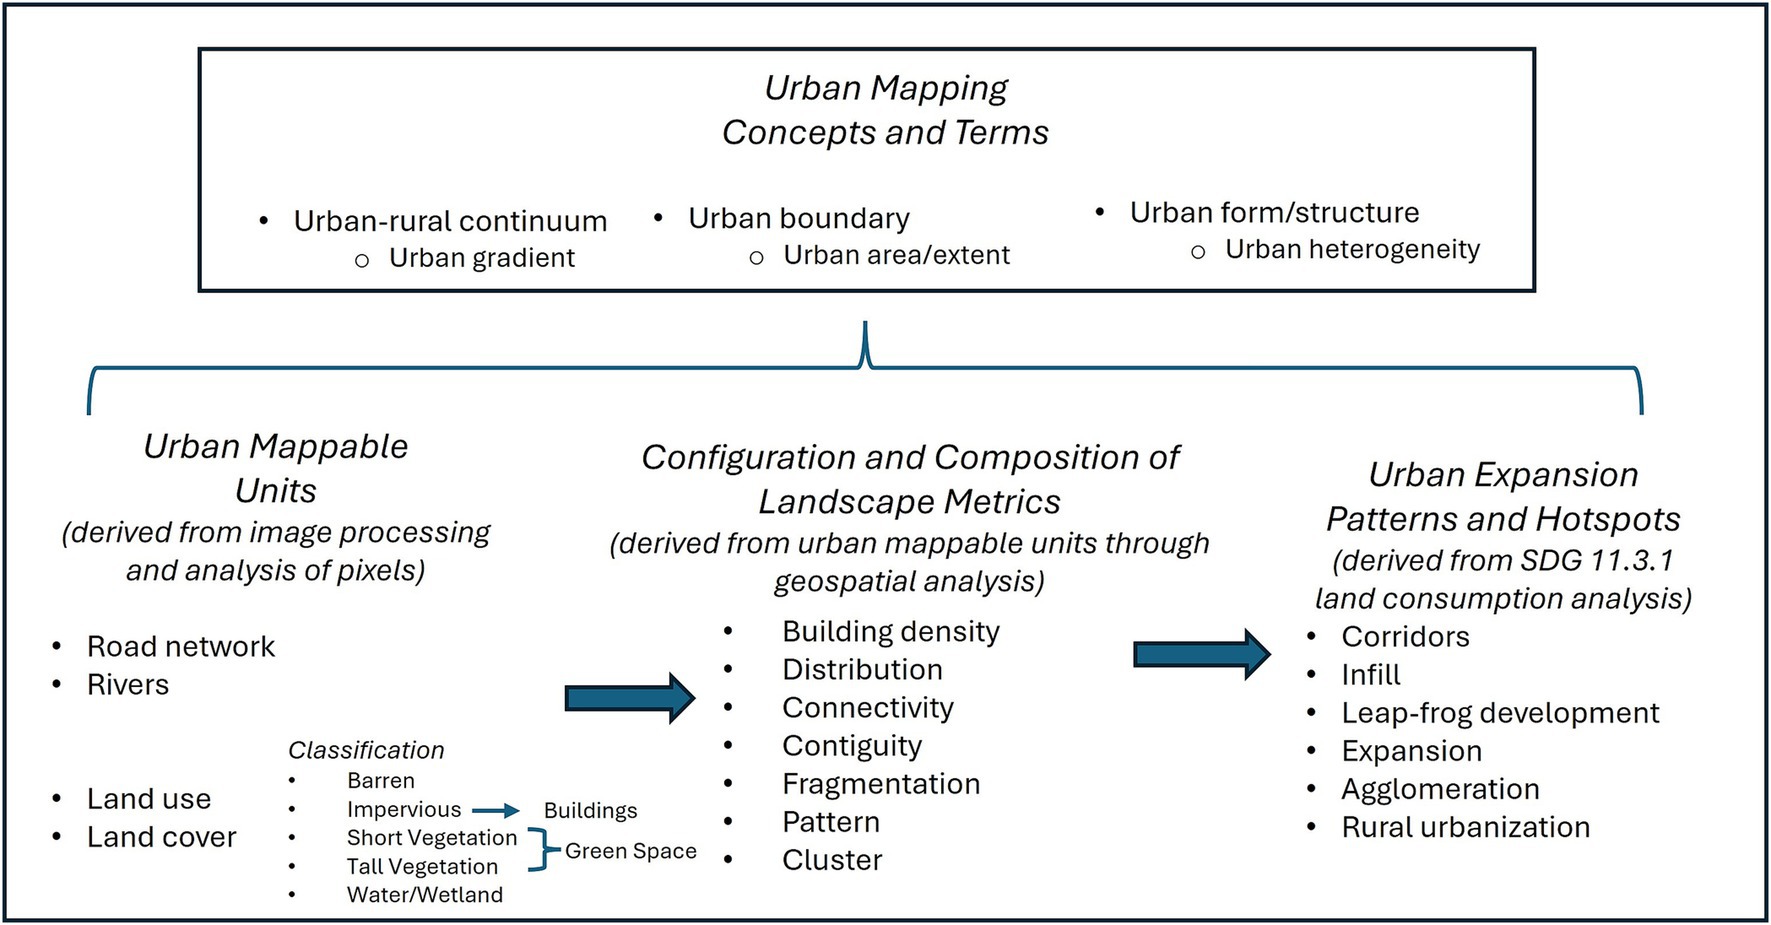
Figure 1. Urban mapping concepts define the urban mappable units, the urban pixel—used for urban analyses.
Our overarching goal was to interrogate traditional LCLUC approaches and show where and how available remotely sensed data and geospatial applications can advance a cross-scale “pixels to people” approach to define and clarify urban change patterns and hot spots of urban growth in secondary cities. Using a two-tiered multi-resolution case study analysis of urban change hotspots in three Africa counties (Ethiopia, Nigeria, and South Africa) and example secondary cities (Mekelle, Benin City, Polokwane, respectively), we demonstrate how LCLUC classification methods drive the process of identifying and defining mappable urban units. We explore the conceptual basis of urban change mapping, applying SDG 11.3.1 to demonstrate how elements such as urban extent, dynamic urban boundaries, urban clusters, and land consumption rates characterize urban change. We observe that monitoring and management efforts utilizing remote sensing products and geospatial approaches require a nuanced depiction of urbanization, one that dissects the homogenous, amorphous “red blob” representing the urban landscape to better capture urbanization driven land cover changes (Cadenasso et al., 2007; Reba and Seto, 2020; Zhu et al., 2019). Finally, we discuss how these results can help scientists and policy makers reflect on equitable processes for using integrated datasets and information in the Global South to inform policy regarding high-impact urban change hotspots.
2 Literature review
2.1 Mapping urban change in Africa
Analysis and classification of satellite imagery transforms pixels into mappable urban units based upon remote sensing techniques and methods where common definitions of urban terms remain elusive and dependent on the application or analysis undertaken (Kuffer et al., 2016; Zhu et al., 2019; Heinrigs, 2020). Many of these terms are used interchangeably and inconsistently making comparisons between methods and results of urbanization analyses difficult. The term urban, inclusive of urban area and urban agglomeration, is highly contested; there is no agreement on the definition, and it varies widely between countries (Ritchie, 2018; Fang and Yu, 2017). The United Nations has adopted the term urban agglomeration that is “the population contained within the contours of a contiguous territory inhabited at urban density levels without regard to administrative boundaries” (United Nations DESA, 2018). This definition is used in the application of the SDG 11.3.1 calculation. Previous reviews of remote sensing of urbanization (Reba and Seto, 2020; Zhu et al., 2019) have identified primary limitations and data gaps hindering the analyses of urban change dynamics necessary for guiding more sustainable land planning. These limitations include: (1) a gap in geographic coverage of LMIC and the Global South; (2) neglect of small-medium sized cities in favor of megacities (>5 million population); (3) limited temporal resolution in urban change mapping; and (4) a failure to capture urban heterogeneity in structure and form by oversimplifying urban landscapes into a single class (i.e., “the red blob”). The unique geography of places is obscured when mapping urbanization as a single land use class (e.g., developed); cities differ, and their composition reflects local and regional socio-economic conditions as well as environmental and demographic change referred to as “non-observable indicators” (Pratomo et al., 2017). These limitations are identified in many remote sensing and urban studies papers (Zhou et al., 2022; Lausch et al., 2015; Yu and Fang, 2023), and are embedded in the methods and tools employed, the type and structure of data used, and the fuzziness of urban concepts.
The African continent reflects these challenges of urban mapping compounded by a lack of up-to-date demographic data and the diversity of urban forms that create spectral confusion between urban classes (Adepoju et al., 2006; Schneider, 2012). Heinrigs (2020) suggests that the African continent is more urban than it appears due to numerous agglomerations that are not recognized by international statistical definitions. For example, the United Nations World Populations Prospects, (2024) only lists agglomerations of over 300,000 inhabitants. However, African urban areas include urban sprawl, peri-urban fringe zones, urbanizing rural areas, and emerging metropolitan regions. These areas are better recognized by the European Commission (2020) universal definition for settlements that include urban core (minimum of 50,000 people with minimum density of 1,500 people/sq. km), urban cluster (minimum population of 5,000 with minimum density of 300 people/sq. km), and rural areas (<5,000 people). However, population data across the African continent can be unreliable where data are not updated, have low accuracy, and lack standardization (Heinrigs, 2020; Chai and Seto, 2019).
Multiple research studies explore urban mapping across Africa demonstrating the application of LCLUC analysis of selected themes. This includes articles tracking urban expansion: land use/land cover projections in Nigerian cities (Amaechi et al., 2024; Wang and Maduako, 2018; Adepoju et al., 2006; Olayiwola and Igbavboa, 2014); rapid urbanization and population trends in West Africa (Hermann et al., 2020) and urban growth in Ghana (Sondou et al., 2024). Several studies examine climate change and temperature impacts in African cities: urban heat islands (Simwanda et al., 2019), land surface temperatures change in Nairobi, Kenya (Oyugi et al., 2017), and comparative assessment of temperature and land cover change in southwest Ethiopia cities (Gemeda et al., 2024). Other research topics include mapping informal urban areas, such as informal settlements or slums on the African continent (Kuffer et al., 2016), and urban sprawl in Tanzania (Shao et al., 2021). Theoretical contributions discuss modeling the dynamics of urbanization in Africa for sustainability (Radoine et al., 2024), infrastructure development (El-Bouayady et al., 2024) and inclusive growth (Ngounou et al., 2024). Several articles discuss the SDG 11.3.1 methods to assess land consumption and land use efficiency (Barau et al., 2019; Laituri et al., 2021; Mudau et al., 2020; Cardenas-Ritzert et al., 2024a, 2024b).
Urban expansion, one part of the SDG 11.3.1 indicator equation, tracks the dynamic nature of the urban extent where land consumption often outpaces population growth in African urban areas (Angel, 2023). At the country scale, a suite of cities may be representative of urban change hotspots with several rapidly expanding urban areas (e.g., urban sprawl, leap-frog development) highlighting the need for improved urban planning such as in South Africa (Mudau et al., 2020) and Ethiopia (Koroso et al., 2021). Alternatively, identification of sub-city urban hotspots of change, such as detection of peri-urban green areas in Egyptian cities (Riadi et al., 2020) and of informal settlement areas in South Africa reveal areas of infill within existing urban boundaries (Kemper et al., 2014). Van Den Hoek and Friedrich (2021) examined newly emerging urban hotspots, such as refugee camps in Uganda reflecting rural urbanization, and explore the limitations of detecting human settlements using satellite-based human settlement datasets. The commonalities amongst these studies are the use of multiresolution satellite imagery (i.e., Landsat, nighttime lights, LiDAR), a diversity of methods (i.e., change detection analysis, landuse/landcover classification, modeling), and ancillary data to complement the thematic areas of inquiry (i.e., population, climate, ecological data), and a persistent caveat that the definition of “urban” remains elusive, hence, urban is defined for each study.
2.2 Multiple resolution approaches for defining urban extent
Delineation of the urban extent is challenging but essential for SDG 11.3.1. A recommendation by the European Statistical Commission describes a methodology for delineating urban extent for international statistical comparisons. The process is dependent on access to population data to define cities, towns, and rural areas (Degree of Urbanization Level 1) and urban and rural centers, clusters, and low-density peri-urban grid cells (Degree of Urbanization Level 2) (European Commission, 2020). The Degree of Urbanization approach coupled with population data informs the SDG 11.3.1 using geo-coded census and gridded population data (i.e., GHS-POP and World Pop). This gridded approach is based on assumptions about access to adequate population data, which is limited in LMIC, specifically at the city and sub-national scales (Laituri et al., 2021). Disaggregating global population grids to finer spatial scales is a promising approach to develop city-scale data and track SDGs but may not provide the necessary details to identify hotspots of urban change. For example, World Pop data has a 100 m resolution. Mapping the urban extent often remains dependent on coarse/moderate resolution information (≥30 meter), such as nighttime lights data and Landsat (Hu et al., 2020; Goldblatt et al., 2018).
New methods and technologies are bridging the gap between traditional moderate (30 m) and very high (≤3 m) resolutions, such as those incorporating the 10 m resolution information from Sentinel-2. For example, the Global Human Settlement Layer (GHSL—https://human-settlement.emergency.copernicus.eu/index.php) maps human settlements based on Sentinel-2 information at 10 m resolutions and is a valuable resource for mapping urban extents based on built-up areas (Wang et al., 2022). We define this emerging class of transitional resolution data as “high resolution,” which shows promise for balancing the need for finer depictions of heterogenous landscapes while also providing data availability and consistency across global extents. While Sentinel-2 provides information at multiple resolutions, the 10 m resolution spectral bands are comparable to those traditionally used from Landsat at 30 m resolutions and are collected at temporal resolutions appropriate for monitoring urban change patterns (although with limited historical context as compared to the rich Landsat archive).
Methodological frameworks integrating multi-resolution datasets provide a valuable solution for leveraging complementary datasets from different sensors (e.g., spectral data, nighttime light data) for enhanced characterization of various dimensions of heterogenous urban landscapes and change in Africa (Shah Heydari et al., 2024). Spectral signatures identify urban heat areas using satellite imagery such as High-Resolution Impervious Layer and land surface temperature to quantify heat island intensity in east Africa (Garuma, 2023) overlaid with population data and urban structure to identify thermal inequities in urban areas (Degefu et al., 2023). Chai and Seto (2019) delineate urban areas to map locations of micro-urbanization across Africa using landscape metrics (i.e., small, patchy built-up areas discontinuous from urban areas) and time series derived from Landsat and nighttime light data. Satellite observations using multi-resolution datasets may better capture aspects of urban form such as urban housing density (Sanya and Mwebaze, 2020), and peri-urbanization such as informal settlements (Schneider, 2012), providing enhanced information for monitoring and planning efforts. Furthermore, studies that not only integrate multiple resolution data, but that also develop multi-resolution product suites, may be a valuable solution for leveraging the value of readily accessible datasets to meet multiple planning needs, such as moderate resolution LCLUC change analyses paired with finer depictions of heterogenous urban landscapes and their change patterns with focused urban land cover products (Shah Heydari et al., 2024).
3 Methods
To highlight the potential value of integrated multi-resolution urban mapping product suites for assessing impacts of urbanization-driven LCLUC hotspots, we present a two-tiered land imaging approach in Ethiopia, Nigeria, and South Africa. Our study countries and cities exhibit a range of ecosystems and societal dynamics that demonstrate the flexibility of this method. This multi-tiered approach provides: 1) insights from SDG 11.3.1 calculation about urban expansion (land consumption) and urban land use change patterns (where and type); and 2) the application of landscape metrics to observe urban heterogeneity by assessing the relationship between building density to green space. We selected three representative secondary cities (Mekelle, Ethiopia; Benin City, Nigeria; Polokwane, South Africa) of urban expansion hotspots according to SDG 11.3.1 to present examples of the indicator outputs and to examine urban land use change patterns (Figure 2). As a synthesis paper, we summarize this methodology and reference Cardenas-Ritzert et al. (2024a) and Shah Heydari et al. (2024), which provide detailed methods and procedures, summarized as follows (Figure 3):
1. Conduct an urban land use/land cover analysis (2016–2020). We combined moderate resolution LCLUC information (Landsat 8 and Sentinel-2 spectral time series, Sentinel-1 radar backscatter metrics, and VIIRS nighttime lights imagery) across 5 years (2016–2020) to quantify annual temporal and spatial urban trends across two tiers of analysis (Tier 1-30 m2) and Tier 2-10 m2). Training pixels for Tier 1 and 2 classifications and an additional set of validation pixels for each resolution and country were selected. A Random Forest classification modeling approach was used for both tiers for model selection (classification), validation, and accuracy assessment.
2. Identify developed land use pixels. Land use pixels were identified and grouped into urban clusters (e.g., core and non-core) using World Pop data and city, town points derived from OpenStreetMap, and the Openrouteservice tool (measure travel distance and connectivity between urban clusters).
3. Delineate urban areas. Using metrics such as distances between urban clusters connectivity was measured between core and non-core areas to identify an urban boundary. Analysis was limited to the largest cluster within each urban area with a minimum of 500 hectares.
4. Define urban agglomerations. We defined urban agglomerations using our moderate resolution analysis based on Landsat and nighttime light imagery with land use mapped at 30 m resolutions (Shah Heydari et al., 2024) and an automated dynamic urban delineation approach—Steps 2–5 (Cardenas-Ritzert et al., 2024a).
5. Calculate SDG 11.3.1 to assess urban expansion. The SDG 11.3.1 ratio was calculated for our three study cities to measure the relationship between land consumption and population growth (Table 1).
6. Identify hot spots of urban expansion We delineated urban boundaries using Tier 1 results and identified SDG 11.3.1 hotspots (Cardenas-Ritzert et al., 2024a). Using 2 Sentinel 1 and Sentinel 2 land cover products were within all delineated urban boundaries. Landscape metrics from land cover products were used to calculate all delineated boundaries (Shah Heydari et al., 2024). Building density was calculated as the number of pixels within Tier 2 land cover maps labeled as building within a neighborhood of 15×15 pixels. Landscape configuration metrics of patches were used to quantify urban green space combining tall and short vegetation.

Figure 2. Selected study site countries and secondary cities. Map of land use (Tier 1—30 m2) for Ethiopia, Nigeria, and South Africa. Inset maps with land cover (Tier 2—10 m2) of the urban extent that defines the urban agglomerations of Mekelle, Ethiopia, Benin City, Nigeria, and Polokwane, South Africa. Note: Each city has several urban clusters associated with the larger urban area.
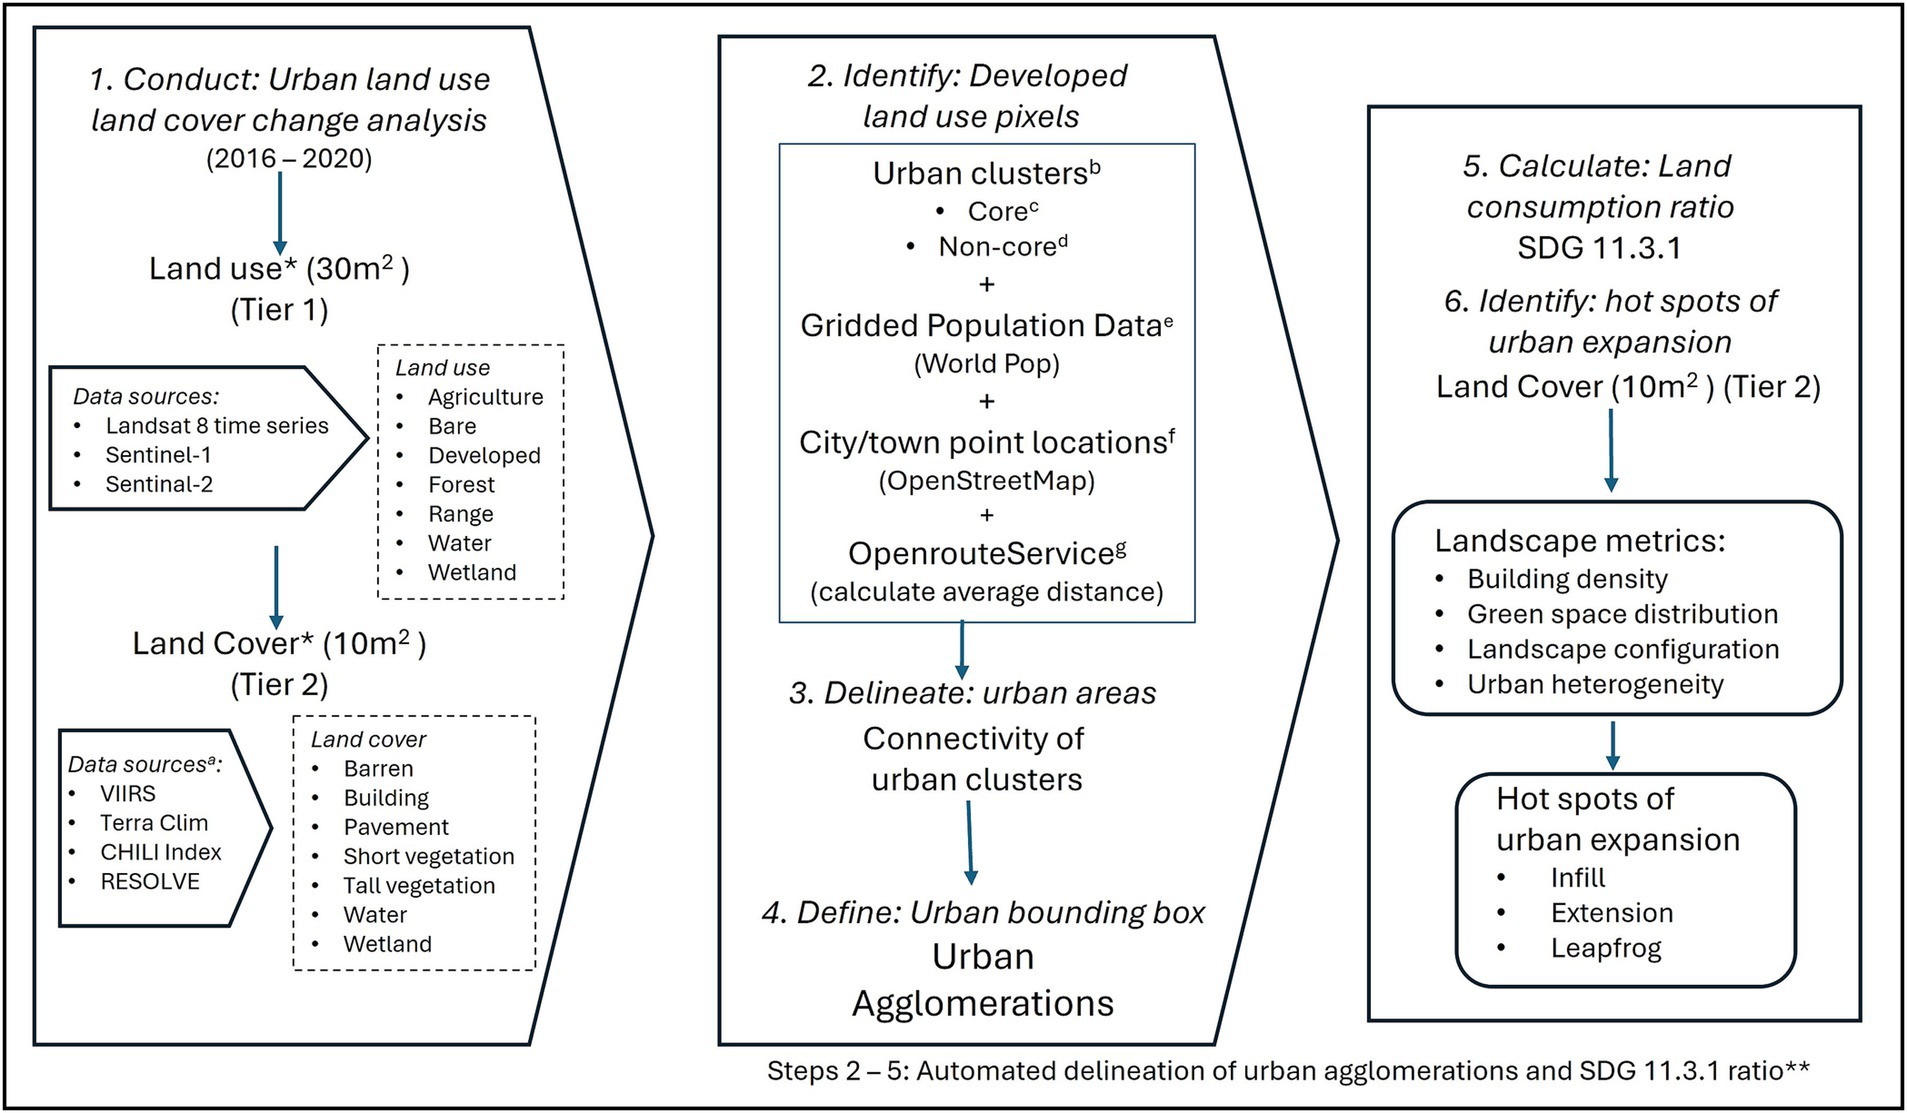
Figure 3. Methodology to assess hotspots of urban change. *See Shah Heydari et al. (2024) for LCLUC process. **See Cardenas-Ritzert et al. (2024a) for detailed Urban Agglomeration automated delineation process. (1) Urban land uses land cover change analysis conducted for 2016 and 2020 using a synchronized multi-resolution Tier 1 (30m2) and Tier 2 (10m2) using Random Forest classification modeling. aAdditional data sources for land cover classification include VIIRS (Visible Infrared Imaging Radiometer Suite), Terra Clim (monthly temperature/precipitation statistics, CHILI Index (Continuous Heat-Insolation Load Index), RESOLVE (map of World Ecoregions). (2)–(4) Developed urban pixels were defined and delineated to identify urban agglomeration using a suite of tools bUrban clusters are defined as urban, suburban, urbanized open space pixels. cCore = identifies urban center. dNon-urban core = includes peripheral areas including towns, suburbs, and other human settlements. eUrban core population threshold = 5,000 people based on WorldPop data. fCity and town point data extracted from OpenStreetMap. gOpenrouteservice tool is used to measure travel distance and connectivity. (5) SDG 11.3.1 ratio was calculated to assess the relationship between the land consumption rate and population growth rate. (6) Change detection between 2016 and 2020 identified urban expansion hotspots from which landscape metrics were extracted based on the Tier 2 classification to identify urban heterogeneity and ascertain the type of urban expansion taking place.
3.1 Study site areas
The study site countries, Ethiopia, Nigeria, and South Africa are similar in geographic size, population growth rates and changes developed land area (Table 2). Our study site cities have SDG ratios greater than two where the rate of urban expansion was double the rate of population growth (Table 3) (Cardenas-Ritzert et al., 2024a). These cities are within the top five ranked hotspot agglomerations and meet the characteristics of a secondary city: rapidly growing regional centers of commerce, government, or transportation that have limited spatial data on infrastructure, land tenure, and planning (Laituri et al., 2021; Cardenas-Ritzert et al., 2024a).
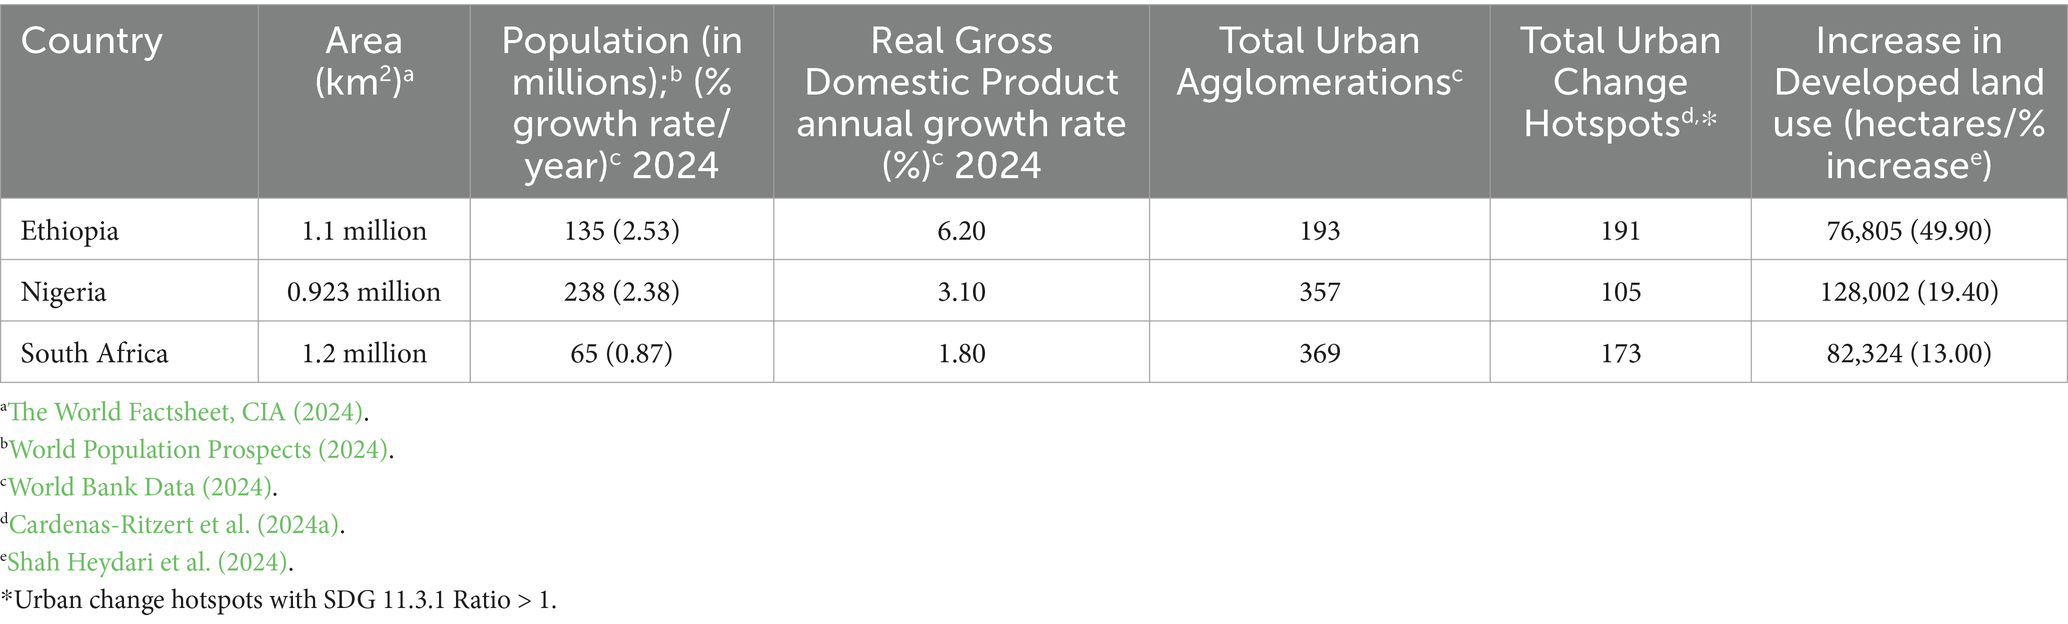
Table 2. Selected study site countries comparisons (2016–2020).
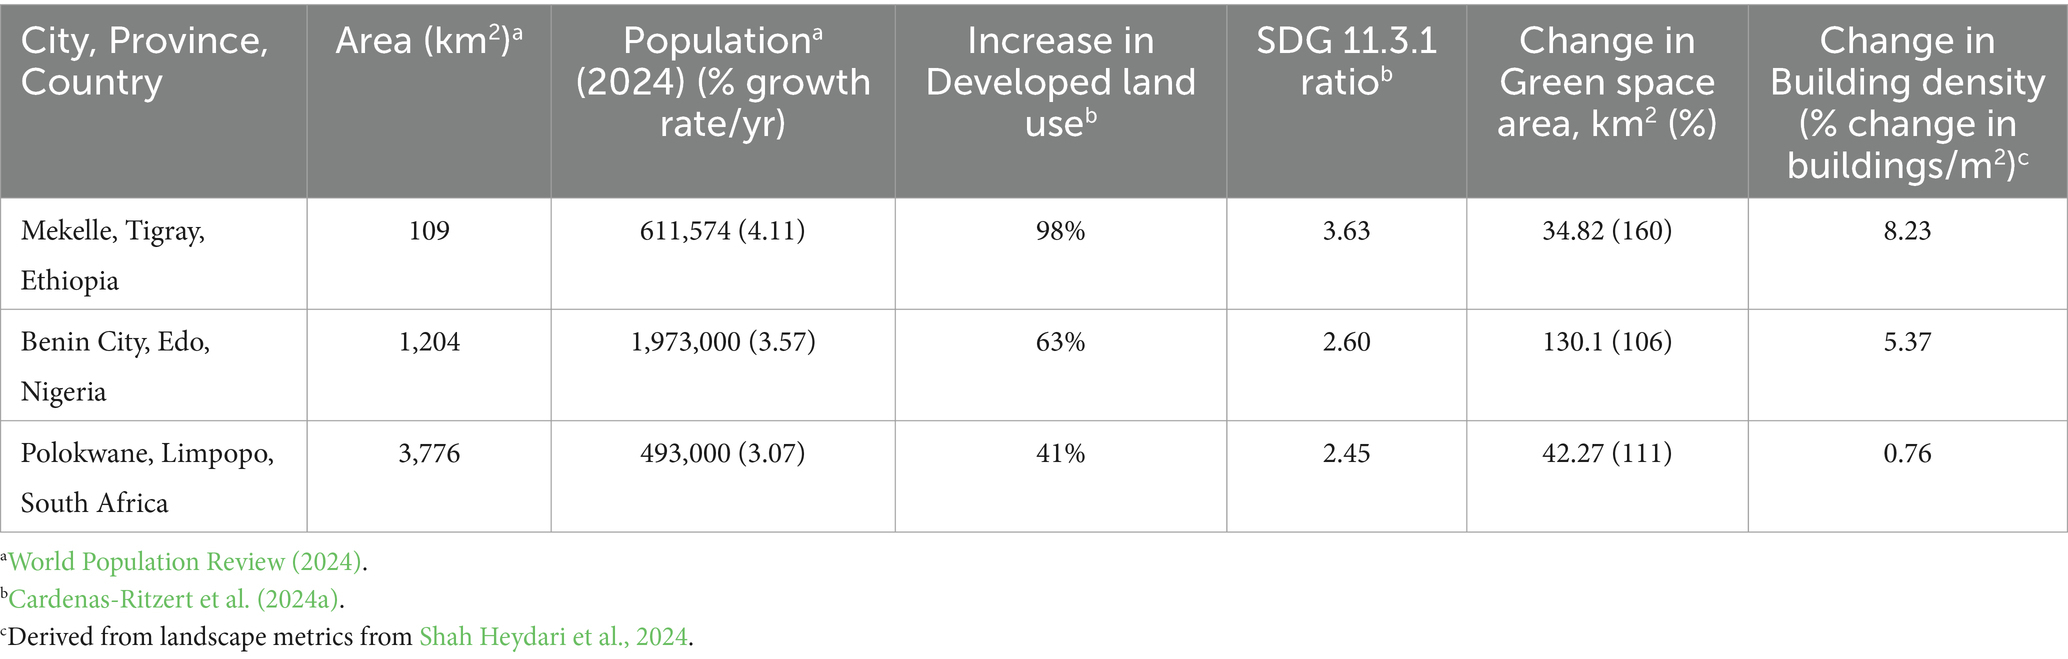
Table 3. Study site city comparisons (2016–2020).
Ethiopia, located in western Africa, is one of the fastest growing economies and has a rapidly growing urban population despite being one of the least urbanized countries in Africa (Organization for Economic Co-operation and Development, 2022). Mekelle, Ethiopia is the capital of the Tigray region of Ethiopia. However, in 2020–2023 the Tigray region has been embroiled in regional conflict. Mekelle is a center for coordinating access to services for approximately 545,000 internally displaced people (IDP) (United Nations HCR, 2022) creating refugee camps within the city and complicating access to urban services. The city has seven districts (“sub-cities”), encouraging urban expansion to areas surrounding the airport located 11 kilometers from the city center, a classic example of leapfrog development.
Located in eastern Africa, Nigeria is the economic powerhouse of Africa and the most populous (Foluke and Pius Olakunle, 2019). Benin City, Nigeria is the capital and largest city of Edo State and the sixth largest city in Nigeria. The city is the center of the country’s rubber industry. Nigerian cities are experiencing rapid urban growth fueled by demand for housing, deteriorating housing conditions, and inadequate urban services. Urban settlement is concentrated in peri-urban areas—non-urban areas adjacent to urban edges and located on the fringes of the city where housing costs are lower (Olayiwola and Igbavboa, 2014).
South Africa, the southernmost country in Africa, is the most diversified economy as well as one of the most urbanized countries in Africa and is a biodiversity hotspot (Organization for Economic Co-operation and Development, 2022). Polokwane (or Pietersburg) is the capital city of Limpopo Province of South Africa. The city is located on a major road and rail system connecting the Zimbabwean border region with linkages to Johannesburg and other major centers. Clusters of informal settlements are located at the fringes of the city encompassing semi-rural areas with limited services and infrastructure (Polokwane Local Municipality, 2024).
4 Results
We found that our multi-tiered LCLUC approach supported the identification of hotspots of urban expansion and identify urban agglomerations across the 5-year study period (2016–2020). Shah Heydari et al. (2024) examined the land use patterns in the three selected countries (Tier 1) and observed (1) the urban area was quite small in comparison to country size (~1.5%) and (2) urban change in the three countries were generally the result of the transformation of agricultural and rangelands to urban land use. While land use classification provides an overview of where urban areas are located, the small areas of cities do not adequately reflect the impact of urbanization (i.e., the urban footprint) and the supply chains that support them. The Tier 2 urban land cover analysis using high resolution remotely sensed data (and Tier 1 products of urban delineation) enables the assessment of land cover changes as well as the application of landscape metrics (i.e., building density and distance between green spaces) to begin to address urban heterogeneity. Landscape metrics that describe spatial distribution patterns, intermixing of land cover classes, aggregation of buildings, and distance between vegetation land cover characterize urban form and configuration enabling comparisons between the three countries. Landscape pattern metrics revealed that Nigerian and South African cities generally have higher building densities which may indicate greater intermixing of land cover, while Ethiopia tends towards less dense and more interspersed land cover configurations and lower building densities.
Using overlay analysis of dynamic urban agglomerations (2016 and 2020) and administrative boundaries we demonstrate mapping urban concepts (Figure 4). Frames A, B, C includes the boundaries for Mekelle, Ethiopia that includes dynamic urban boundaries (A—2016; B—2020) and the urban woreda or district administrative boundary. Similarly, Frames D, E, and F show the Polokwane, South Africa boundaries and Frames G, I, J show the Benin City, Nigeria boundaries. Frames C, F, and J overlay the 2016 and 2020 boundary with the administrative boundary for all study site cities. All cities have clearly defined urban clusters (core and non-core) for 2016 and 2020 with an increase in the size and number of urban clusters in 2020 indicating leapfrog development. The urban woreda for Mekelle is the unit of governance, and this overlay analysis reveals how the governance unit is outpaced by unplanned urban growth. In contrast the administrative boundaries for both Polokwane and Benin City are much larger (blue area in Frames F and J, respectively), include multiple urban agglomerations, and can obscure the type of urban change that is occurring and can be overlooked by local planners who do not have access to these types of analyses.
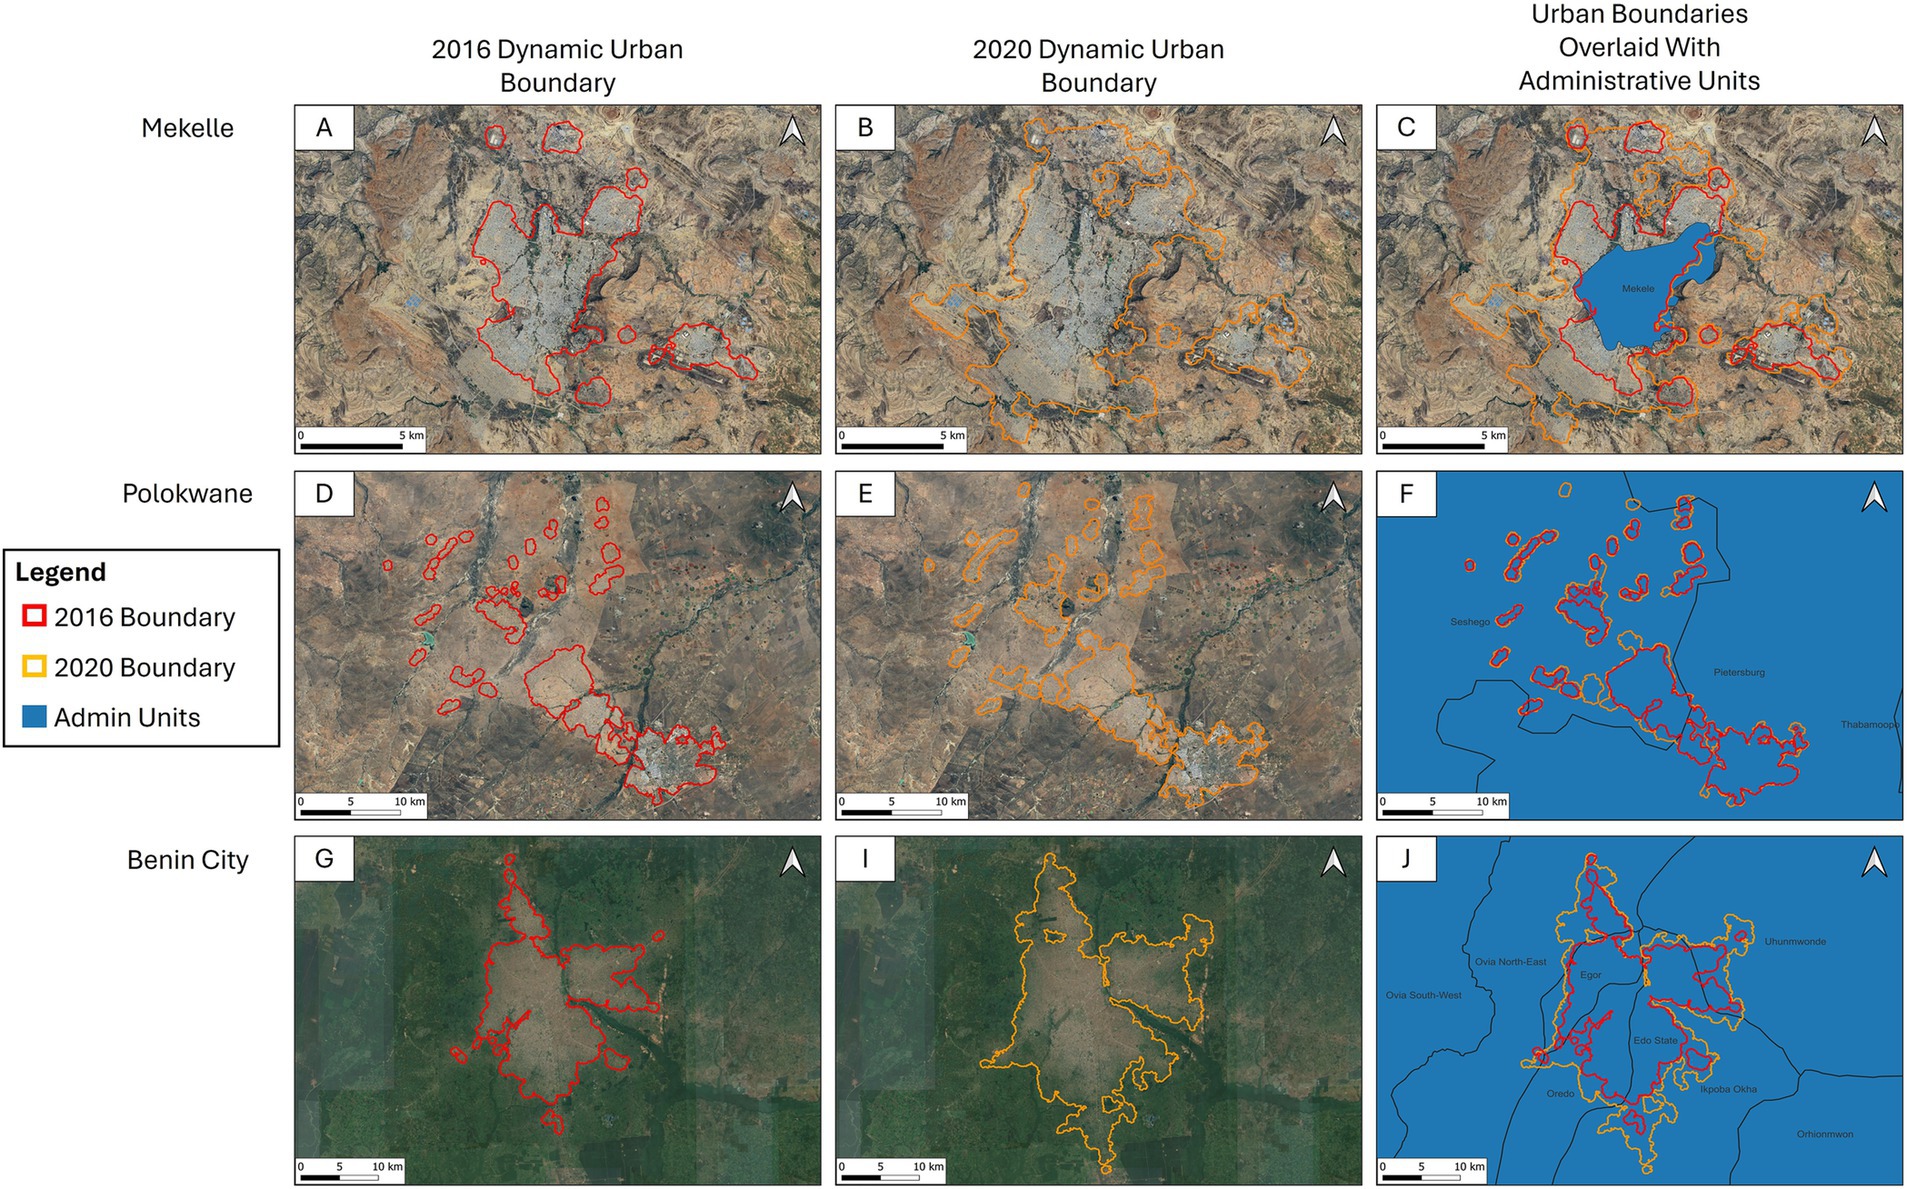
Figure 4. Differences between static administrative boundaries and dynamic urban boundaries (derived from urban agglomeration delineation) for Mekelle, Ethiopia, Polokwane, South Africa, and Benin City, Nigeria. (A,B) 2016 (red) and 2020 (orange) dynamic urban boundaries; (C) Overlay of dynamic urban boundaries with administrative boundary (blue) of Mekelle reveal urban expansion beyond the governance unit represented by the administrative boundary. (D,E) 2016 (red) and 2020 (orange) dynamic urban boundaries; (F) Overlay of dynamic urban boundaries with administrative boundary (blue, Polokwane). (G,I) 2016 (red) and 2020 (orange) dynamic urban boundaries; (J) Overlay of dynamic urban boundaries with administrative boundary (blue). Note dynamic urban boundaries for all cities have urban clusters that form the urban agglomerations (C,F,J). (F,J) The administrative boundaries (black) of multiple local governmental areas about the delineation of the urban agglomerations where several urban agglomerations are located within these boundaries. * Basemap imagery is from Google Earth and utilizes a variety of sources to display a mosaic from highest quality images as of May 2024. Administrative boundaries accessed from DIVA GIS.
The SDG 11.3.1 ratio varied across the study site countries; our study sites are representative of secondary cities with high SDG 11.3.1 ratios. All three cities exhibited increases in developed land use per capita over the study period with urban expansion occurring primarily in the form of extension (contiguous urban growth) and leapfrog development with limited infill development. Spatial analysis revealed four observations: 1) the dynamic nature of urban expansion exhibited by the increasing number of urban clusters; 2) the identification of urban hotspots can direct efforts for future planning and assessment of access to services when urban growth surpasses administrative boundaries; 3) the type of expansion (extension, leapfrog, infill) yields insights about patterns of connectivity, proximity, and contiguity and 4) landscape metrics can be calculated to assess urban heterogeneity. For example, both green space and building density changed between 2016 and 2020 exposing patterns of urban expansion with more green space (tall and short vegetation) on the periphery of each city, fewer patches of green space within the urban area, and increased building density (Table 3; Figure 5).
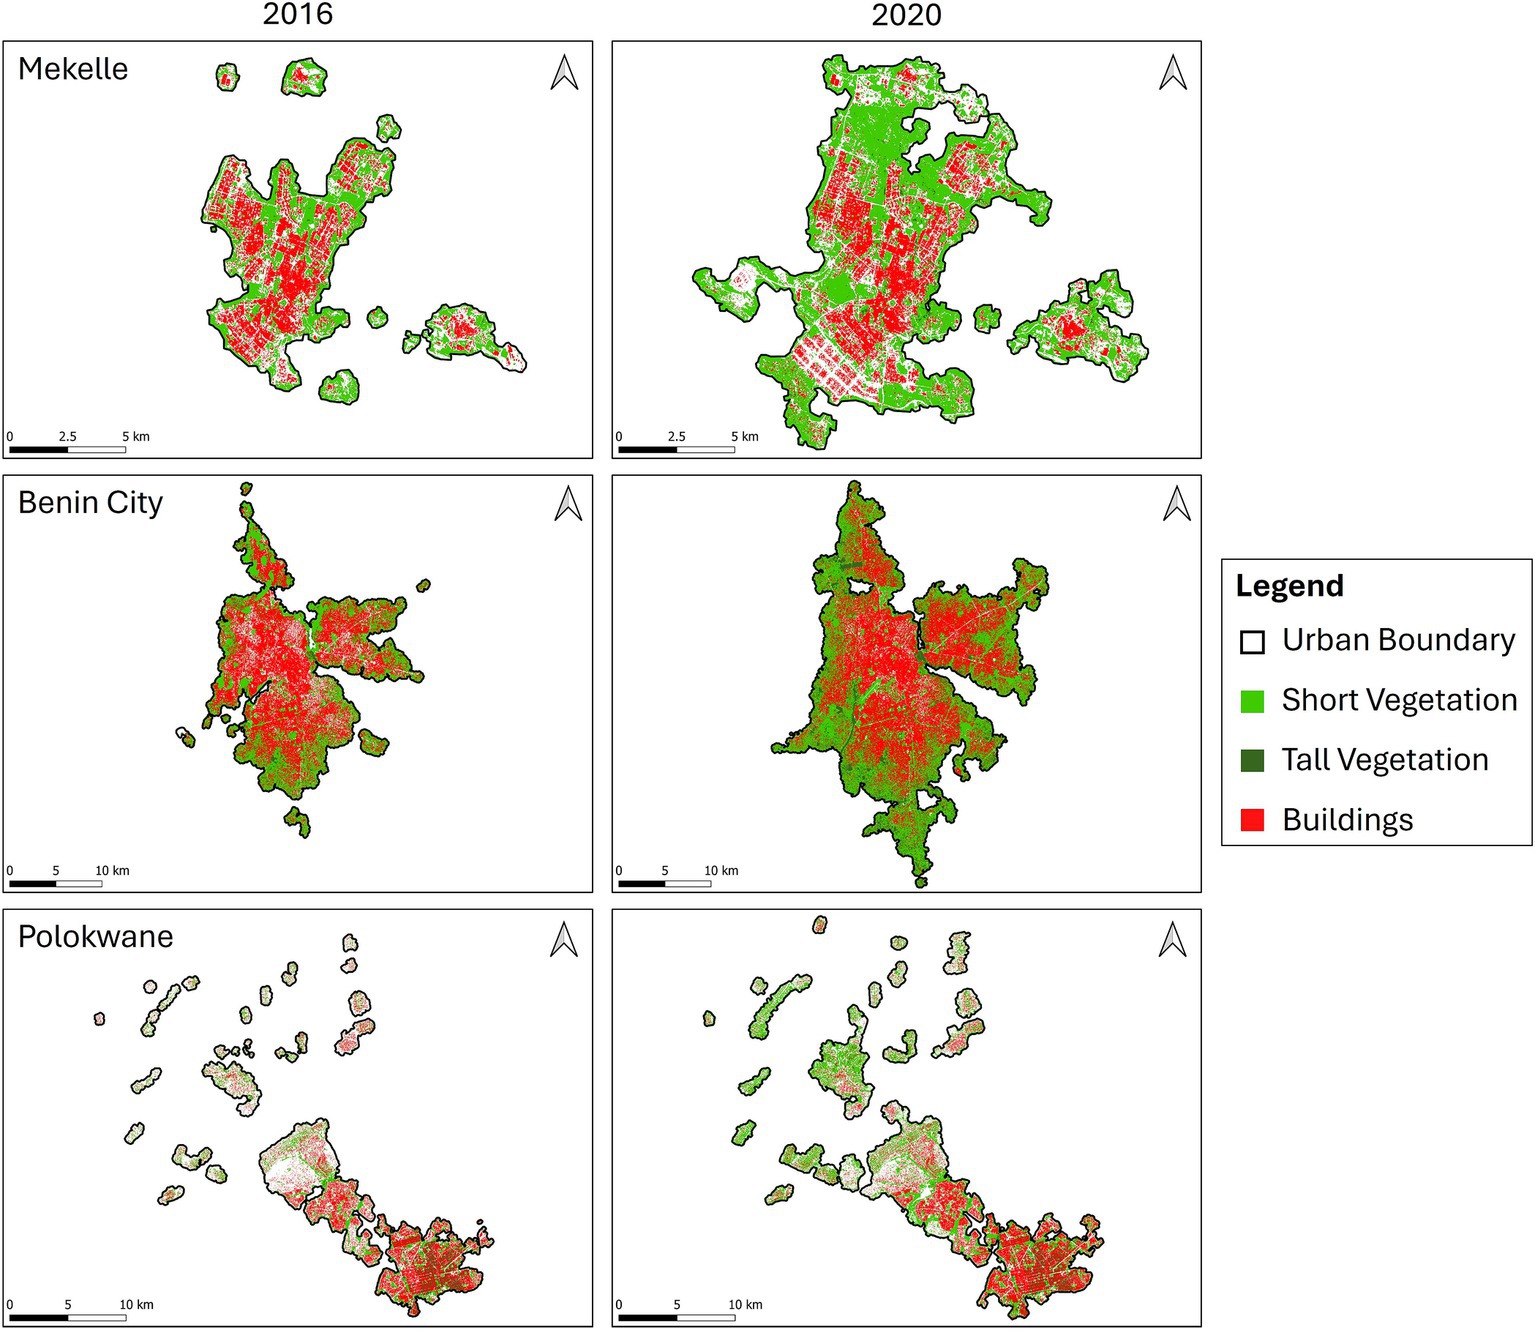
Figure 5. Urban agglomerations for study site cities. Short and tall vegetation defines green space. Urban agglomeration increased in all study site cities between 2016 and 2020. Mekelle, Ethiopia expanded to include several nearby urban clusters; green space increased due to connectivity between clusters; buildings (red) increased in the southern eastern portion of the city and leap frog development to the east of the city. Benin City green space expanded with additional buildings (red) to the south and east (green); increased densification of buildings with fewer green areas in 2020 demonstrating infill. Polokwane has increased the number of urban clusters nearby that are also increasing in area creating corridors.
Mekelle, Ethiopia is an example of how mapping the urban agglomeration can contribute to urban planning. Figure 6 overlays the 2016 (blue) and 2020 (red) dynamic boundaries on OpenStreetMap. Platforms such as OpenStreetMap provide a means to fill in data gaps that include attributes of landscape features such as street names, whether roads are paved or not, building footprints, building materials, number of floors, and type of business or household. These results provide critical information for urban planners about where urban change is occurring but is limited in terms of understanding urban function and equitable growth—why, where, and what is located on the urban landscape.
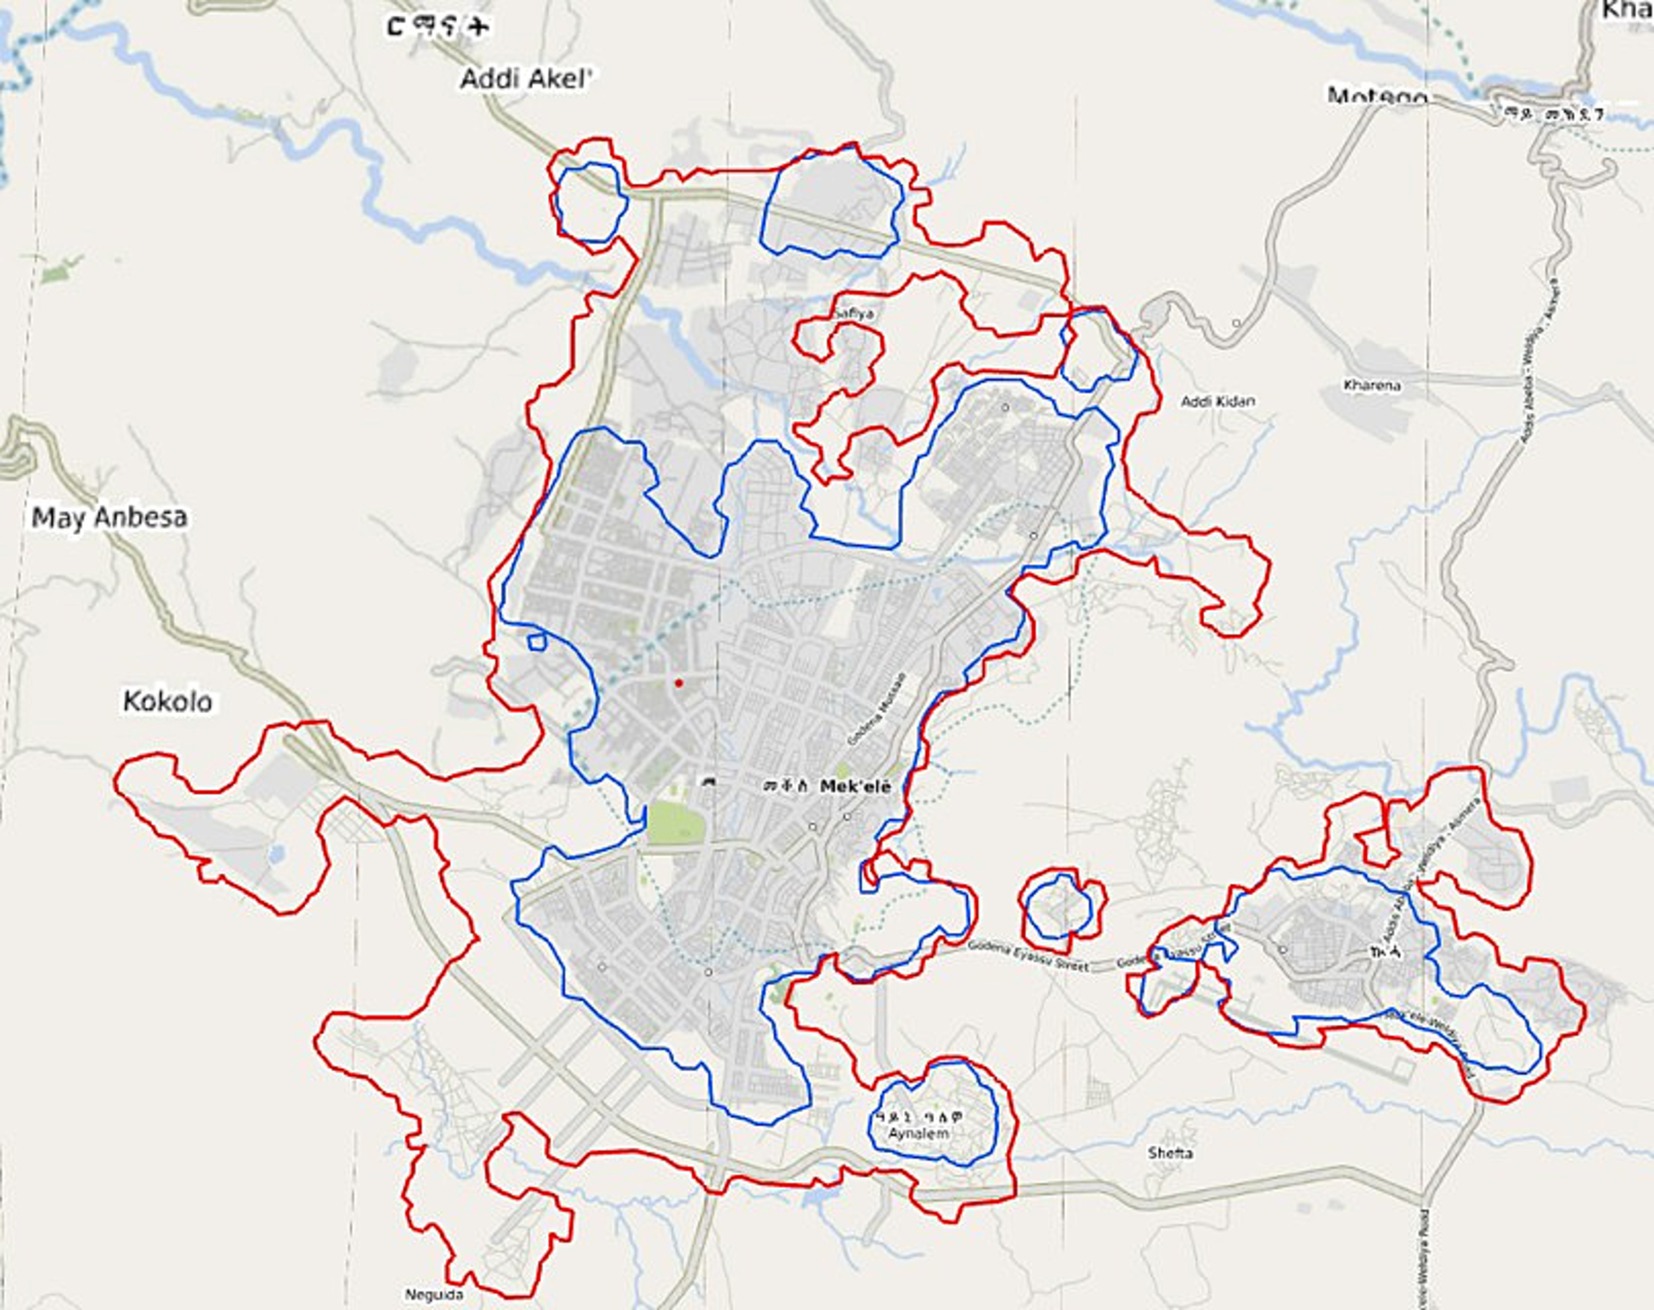
Figure 6. Mekelle 2016 urban extent (blue line) and 2020 urban extent (red line) overlaid on OpenStreetMap (OSM) demonstrate urban expansion. OSM data shows road network, green space, and rivers to fill in data gaps for base maps. *OpenStreetMap contributors, https://planet.osm.org, 2024. Made available under the Open Database License: http://opendatecommons.org/licenses/odbl/1.0/.
5 Discussion
We learned that how an urban pixel is defined informs decisions about how the spatial extent of the “red blob” is determined. Through our multi-resolution datasets and analyses we observe patterns of urban change (Cardenas-Ritzert et al., 2024b). The process of deriving SDG metrics requires decisions about land cover, land use, and urban functions where decisions about what type of land cover or use can have real impacts on those people living in the city. For example, the urban core has a different spatial structure than an informal settlement. However, the terms imply both land use and land cover. Green space lumps all kinds of socio-ecological functions together and obscures both function and form of the classified pixel. Our land cover classification products dissect urban agglomerations using landscape metrics that include identification of fine resolution urban objects, such as green spaces, and building density aiding research and planning efforts to better understand trends of urban change and configuration.
Applying SDG 11.3.1 is an example of data integration where population data and satellite imagery reveal land consumption patterns. Land consumption alludes to tradeoffs and synergies of ecosystem service provisioning. The type of land consumption (why LULUC is occurring) is the result of drivers beyond the scope of the SDG 11.3.1 ratio and reflect changing urban functions such as access to basic services (i.e., installation of new water infrastructure), types of development (i.e., leapfrog or infilling), and disruption of ecosystem services (i.e., changes to urban green space and parks).
Our approach developed an integrated mapping framework supporting multi-resolution datasets and openly accessible tools to conduct LCLUC assessments of urbanization. We developed an automated approach to define urban agglomerations within different countries in Africa. We highlighted three African countries as examples and identified rapidly growing secondary cities to assess hotspots of urban expansion to provide information for urban monitoring objectives. Our analysis synchronized two different tiers of multi-resolution datasets. Tier 1 used moderate resolution imagery to identify urban boundaries and land use drivers of change that informed the Tier 2 analysis using higher resolution to examine the “red blob” and extract metrics of urban heterogeneity. This approach can provide the basis for ongoing monitoring, can be applied to different years of imagery, and be applied to new locations.
Coupled with socio-economic metrics, our suite of analytical products assists in identifying drivers of land use change that fuel urban expansion. For example, economic indicators regarding public investment in Ethiopia in form of roads, infrastructure, and housing (World Bank Group, 2023) and service sector and industrial development employment opportunities in urban South Africa (World Bank Group, 2023) contribute to urban growth. Alternatively, Nigeria has the highest fertility rate (5.3) of the three countries where the natural increase outpaces migration fueling urban increase (Menashe-Oren and Bocquier, 2021). Using LCLUC approaches we can identify areas of urban expansion that reflect socio-ecological conditions and begin to define spatial indicators of equitable growth (i.e., access to services, availability of green space, encroachment on rural villages).
We are challenged by identifying urban functions that require both social and remote sensing in situ. The availability and structure of existing data (i.e., resolution of images; access to images) is incompatible with socio-ecological data (i.e., different scales of analysis, data formats). Indeed, we are dependent upon deriving surrogates for socio-ecological data where characteristics of the spectral bands of satellite images influence decisions in classification compounded by disciplinary and cultural backgrounds of the researchers. Approaches that are holistic and comprehensive are needed as we build more integrated datasets that become the basis for long term planning, scenario-building, and forecasting (Pickett et al., 2020). Tracking the potential for equitable distribution of social and ecological services within secondary cities is needed to support policy and sustainable planning goals informed by the SDGs.
Liverman et al. (1998) discussed this conundrum and identified the need for transdisciplinary action to facilitate complex analyses of urban change. The integration of human geography data (i.e., data about people) and satellite sensors create an information pixel useful to people for planning urban landscapes. For example, the Normalized Difference Vegetation Index (NDVI), the Modified Normalized Difference Water Index (MNDWI), and the bare soil index (BI) are all calculations derived from Landsat satellite imagery to identify built-up, or developed, area extents (Dolean et al., 2020). The Modified Socio-environmental Vulnerability Index (M-SEVI) and the Soil and Water Assessment Tool can be used to measure ecosystem services (Norman et al., 2012). These methods can identify tradeoffs in provisioning of ecosystem services with urban growth and LCLUC around, and within, urbanization hotspots.
Coupling remote sensing products with local information (e.g., private/public land) assists in defining urban function by creating more robust data. While remotely sensed nighttime-light and spectral information are helpful in delineating urban areas, cities are far more complicated; efforts to assess, monitor, and manage urban development are dependent upon understanding the urban socio-ecological function that creates healthy cities. And the use of very high-resolution imagery is challenging due to image availability, calibrations between sensors and cities, and high computational needs necessary for consistent products for planning and monitoring across space and time. Hot spots of urban change reveal varying urban function and the impacts on socio-ecological services. “Pixels to people” refers to how people experience and use the land on which they live and work—an aspect of urban form and function to derive from robust classification strategies (Figure 7). Metrics such as SDG 11.3.1 and SDG 11.7.1 require higher resolution information at the local scale to understand the changing nature of urban function. This requires very high-resolution imagery (≤3 m) for object-based analysis linked to social sensing techniques (i.e., participatory mapping) and local knowledge (i.e., mobile mapping on site, surveys) to capture urban function (Lui et al., 2015). Satellite imagery using different sensors (e.g., Planet Dove, Maxar WorldView) can enrich the analysis to measure development of impacts on ecosystems services, access to urban green space (SDG 11.7.1), and the distribution of social and ecological services—the nature and combination of urban functions across the cityscape.
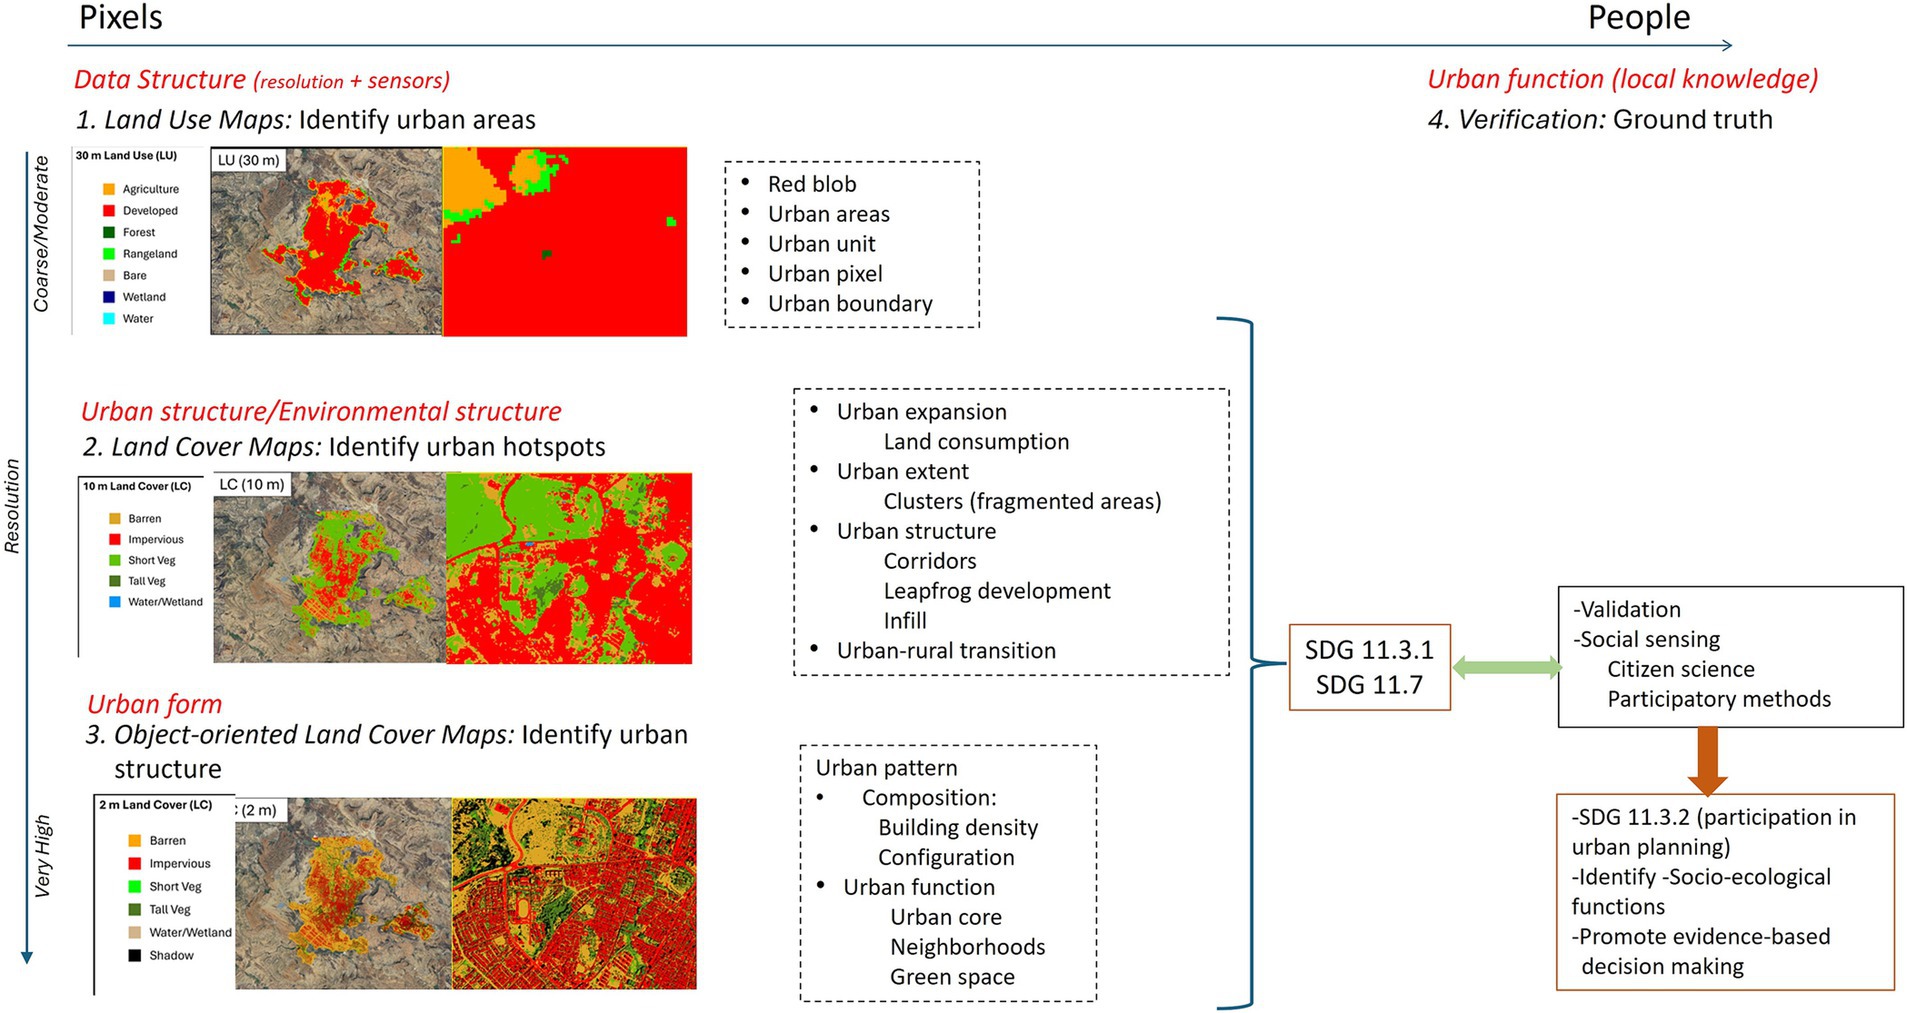
Figure 7. Pixels to People. Using remotely sensed data products from classification of urban pixels 1. Land uses maps (data structure); 2. Land cover maps (urban structure); 3. Object-oriented land cover maps (urban form) to identify mappable urban units (in dotted-lined boxes) and calculate SDG indicators. This suite of products can be used to input from local communities (4. Urban function identified via field verification and ground truthing) to promote sustainable urban planning and development.
Our study leveraging the two-tiered urban monitoring approach lays the groundwork for further urban analysis to inform decision making and assess links to socio-ecological functions in different cities using widely accessible data sources.
6 Conclusion
The development of a 2- or even 3-tiered methodological framework fusing remote sensing data sources at varying spatial and temporal resolutions and extents supports quantifying temporal trends in urban development and analyzing the societal and ecological impacts of rapid population growth within urban centers. Our data products and analyses directly inform SDG monitoring for policy development, ecological impact assessments, and provide insights into the patterns of access to ecological and social services. There is an urgent need for baseline information about urban expansion by world health organizations and national and local planning entities. As these methods and products related to LCLUC and fine resolution depictions of urban features are made publicly available, they serve as important steppingstones for future research efforts including forecast modeling under various urban planning and natural disaster scenarios, as well as informing future NASA Earth Observation missions.
We are poised to conduct the next step in our methodology which is to add a third focal spatial tier to our multi-tiered framework and to apply our frameworks to SDG 11.7.1, which focuses on the equitable distribution and access to urban green spaces, promoting access to urban ecosystem services through sustainable urban planning. Tier-1 and Tier-2 LCLUC data products enable future analyses coupled with very high resolution imagery (≤ 3 m resolution imagery) to extract green spaces and evaluate riparian/non-riparian area, surrounding building density, distance to edge of the urban area, connectivity between spaces, and other potential surrogates for characterizing the quality, multi-use potential, and access of the public areas (Cardenas-Ritzert et al., 2024b). We can quantify changes in these green spaces and other public areas within the 5-year time series in relation to expansions of other urban features and population growth. Developing multi-tiered frameworks may fill data gaps in support of policy and planning applications to use multi-resolution LCLUC classifications within other secondary cities to determine the equitable distribution of social and ecological services.
However, identifying where land consumption is taking place requires engagement with local representatives to ascertain why particular locations are hotspots. Such observations can capture functions which require local knowledge, ancillary data, and field verification to map the multifunctional land uses within a city. Urban extent, expansion and hotspots need to be harmonized between multiple perspectives to calibrate urban mapping concepts. For example, juxtaposing the administrative boundary of the city—the urban unit of management for city planners—with the dynamic urban extent captured from time series analysis using remotely sensed data, can identify rapidly changing areas for monitoring and management and characterize types of urban change. The drivers of urbanization are different than they were in the past, they are highly variable in different geographic locations, with correlations and relationships uncovering more questions about how to achieve sustainability than answers (Robinson, 2002; Henderson and Turner, 2020).
African urbanization, inclusive of new forms of urbanism due to economic influences (Koti, 2022) and the ongoing rural–urban transformation (Sakketa, 2023) coupled with a young growing labor pool (i.e., the median age is 19.5 years) (Worldometer, 2024) mean that urban transformation in Africa will be at the forefront of the urban century (Organization for Economic Co-operation and Development, 2022). Many socio-ecological services are not only spatial in nature, such as access to services, green spaces, and supply chains, but also demonstrate the (in)equitable process of urban expansion. Cross-scale and multi-resolution data about African cities is essential to understand ecological, economic, and social outcomes (Zhou et al., 2022). African cities are the economic centers of improved outcomes and higher standards of living that often outpace national averages where secondary cities are central to promoting economic and political integration (Institut Europeen de Cooperation et de Development, 2022). The challenges of African urban growth require planning, innovative policies, and sound data-driven decisions to ensure equitable and inclusive outcomes.
Multi-resolution data sets such as those presented within our study can be enhanced for additional analyses, such as the distribution of services, through the fusion with locally collected citizen scientist data sets. Workshops and training can aid in how to use these types of data enhancements through instruction of the data to stakeholders with a range of spatial data expertise. Receiving feedback as to how stakeholders perceive value in LCLUC maps and other NASA data products for incorporation into local and national level research and planning efforts provides insight into the best way to support and promote those efforts. By engaging local partners and conducting outreach we can help put NASA-driven data products into the hands of those who are working to promote more sustainable urban land planning and policy development. Next steps aim to enrich the definition and usefulness of hotspots of urban change to enable cohesive planning through improved and accessible remote sensing products and participatory approaches to include local communities to empower local governments and people (Espey et al., 2024).
Data availability statement
The datasets presented in this study can be found in online repositories. The names of the repository/repositories and accession number(s) can be found below: the code for dynamic urban delineations can be accessed at the following repository: https://github.com/VogelerLab/SDG-11.3.1-Automated-Urban-Delineation-Code.git (accessed on 10 June 2024). The multi-tiered land cover and land use data products are archived on the ORNL DAAC under the title: Annual Land Use and Urban Land Cover maps: Ethiopia, Nigeria, and South Africa 2016–2020 (doi: 10.3334/ORNLDAAC/2367). The population, geographic, and network data and tools referenced in this study are available at the following URLs: https://www.worldpop.org; https://www.openstreetmap.org/; https://openrouteservice.org (accessed on 10 June 2024).
Author contributions
ML: Conceptualization, Formal analysis, Methodology, Visualization, Writing – original draft, Writing – review & editing. OC-R: Conceptualization, Data curation, Formal analysis, Methodology, Software, Visualization, Writing – review & editing. JV: Conceptualization, Data curation, Formal analysis, Funding acquisition, Methodology, Project administration, Supervision, Writing – original draft, Writing – review & editing. SS: Conceptualization, Methodology, Software, Writing – review & editing. MM: Conceptualization, Methodology, Writing – original draft, Writing – review & editing.
Funding
The author(s) declare that financial support was received for the research, authorship, and/or publication of this article. This research was funded by the NASA Land Cover and Land Use Change Program, grant number 80NSSC21K0313.
Acknowledgments
We would like to acknowledge other members of the Vogeler Research Lab at Colorado State University for constructive discussions supporting this work.
Conflict of interest
The authors declare that the research was conducted in the absence of any commercial or financial relationships that could be construed as a potential conflict of interest.
Generative AI statement
The author(s) declare that no Generative AI was used in the creation of this manuscript.
Publisher’s note
All claims expressed in this article are solely those of the authors and do not necessarily represent those of their affiliated organizations, or those of the publisher, the editors and the reviewers. Any product that may be evaluated in this article, or claim that may be made by its manufacturer, is not guaranteed or endorsed by the publisher.
References
Adepoju, M., Millington, A., and Tansey, K. (2006). Land use/land cover detection in metropolitan Lagos (Nigeria). ASPRS 2006 Annual Conference, Reno, NV, May 105. Available at: https://www.asprs.org/a/publications/proceedings/reno2006/0002.pdf.
African Union (2024). Africa urban forum, sustainable urbanization for Africa’s transformation: Agenda 2063. Background document, September 4–6, 2024. Ethiopia: Addis Ababa.
Amaechi, C., Ogbemudia, O., and Okoduwa, A. (2024). Land use/land cover change projection for the year 2050:an assessment of Lagos state, Nigeria. Ethiop. J. Environ. Stud. Manag. 17, 244–256.
Angel, S. (2023). Urban expansion: theory, evidence and practice. Build. Cities 4, 124–138. doi: 10.5334/bc.348
Barau, A., Pinho, P., Luz, A., and Nunes, A. (2019). Land restoration for achieving the sustainable development goals: make cities and human settlements inclusive, safe, resilient and sustainable. Land Restoration for Achieving the Sustainable Development Goals. Available at: https://www.resourcepanel.org/reports/land-restoration-achieving-sustainable-development-goals (Accessed February 19, 2025).
Cadenasso, M. L., Pickett, S. T., and Schwarz, K. (2007). Spatial heterogeneity in urban ecosystems: reconceptualizing land cover and a framework for classification. Front. Ecol. Environ. 5, 80–88. doi: 10.1890/1540-9295(2007)5[80:SHIUER]2.0.CO;2
Cardenas-Ritzert, O. S. E., Vogeler, J. C., Shah Heydari, S., Fekety, P. A., Laituri, M., and McHale, M. (2024a). Automated geospatial approach for assessing SDG Indicator 11.3.1: a multi-level evaluation of urban land use expansion across Africa. ISPRS Int. J. Geo Inf. 13:226. doi: 10.3390/ijgi13070226
Cardenas-Ritzert, O. S. E., Vogeler, J. C., Shah Heydari, S., Fekety, P. A., Laituri, M., and McHale, M. R. (2024b). Effects of land use data spatial resolution on SDG Indicator 11.3.1 (urban expansion) assessments: a case study across Ethiopia. Sustain. For. 16:9698. doi: 10.3390/su16229698
Chai, B. H., and Seto, K. C. (2019). Conceptualizing and characterizing micro-urbanization: a new perspective applied to Africa. Landsc. Urban Plan. 190:103595. doi: 10.1016/j.landurbplan.2019.103595
Degefu, M., Argaw, M., Feyisa, G., and Degefa, S. (2023). Dynamics of green spaces – land surface temperature intensity nexus in cities of Ethiopia. Heliyon 9:E13274. doi: 10.1016/j.heliyon.2023.e13274
Dolean, B., Bilasco, S., Petrea, D., Moldovan, C., Vescan, I. R., and Fodorean, I. (2020). Evaluation of the build-up area dynamics in the first ring of Cluj-Napoca metropolitan areas, Romania by semi-automatic GIS analysis of landsat satellite images. Appl. Sci. 10:7722. doi: 10.3390/app10217722
El-Bouayady, R., Radoine, H., El Faouzi, N., Tayi, S., and Ozkan, H. (2024). Assessing and modeling the impact of urbanization on infrastructure development in Africa: a data-driven approach. Cities 155:105486. doi: 10.1016/j.cities.2024.105486
Espey, J., Keith, M., Parnell, S., Schwanen, T., and Seto, K. (2024). Designing policy for Earth’s urban future. Science 383, 364–367. doi: 10.1126/science.adi6636
European Commission. (2020). A recommendation on the method to delineate cities, urban and rural areas for international statistical comparisons. Available at: https://ghsl.jrc.ec.europa.eu/degurbaDocumentation.php (Accessed November 15, 2024).
Fang, C., and Yu, D. (2017). Urban agglomeration: an evolving concept of an emerging phenomenon. Landsc. Urban Plan. 162, 126–136. doi: 10.1016/j.landurbplan.2017.02.014
Feng, D., Yu, L., Zhao, Y., Cheng, Y., Xu, Y., Li, C., et al. (2018). A multiple dataset approach for 30-m resolution land cover mapping: a case study of continental Africa. Int. J. Remote Sens. 39, 3926–3938. doi: 10.1080/01431161.2018.1452073
Foluke, O. A., and Pius Olakunle, O. (2019). Africa as the Centre-piece of Nigeria’s foreign policy: an overview. International journal of development strategies in humanities. Manag. Soc. Sci. 9, 20–27.
Fourchard, L. (2011). Between world history and state formation: new perspectives on African cities. J. Afr. Hist. 52, 223–248. doi: 10.1017/S0021853711000259
Garuma, G. (2023). Tropical surface urban heat islands in East Africa. Sci. Rep. 13:4509. doi: 10.1038/s41598-023-31678-6
Gemeda, D., Kenea, G., Teshome, B., Daba, G., Argu, W., and Roba, Z. (2024). Impact of land use land cover change on land surface temperature: comparative studies in four cities in southwestern Ethiopia. Environ. Challeng. 16:101002. doi: 10.1016/j.envc.2024.101002
Goldblatt, R., Stuhlmacher, M., Tellman, N., Clinton, G., Hanson, M., Georgescu, C., et al. (2018). Using Landsat and nighttime lights for supervised pixel-based image classification of urban land cover. Remote Sens. Environ. 205, 253–275. doi: 10.1016/j.rse.2017.11.026
Guan, J., Wang, R., Van Berkel, D., and Liang, Z. (2023). How spatial patterns affect urban green space equity at different equity levels: a Bayesian quantile regression approach. Landsc. Urban Plan. 233:104709. doi: 10.1016/j.landurbplan.2023.104709
Heinrigs, P. (2020). Africa’s urbanisation dynamics 2020: Africapolis, Mapping a New Urban Geography, West African Studies. Paris: OECD Publishing.
Henderson, J. V., and Turner, M. A. (2020). Urbanization in the developing world: too early or too slow? J. Econ. Perspect. 34, 150–173. doi: 10.1257/jep.34.3.150
Hermann, S., Brandt, M., Rasmussen, K., and Fensholt, R. (2020). Accelerating land cover change in West Africa over four decades as population increased. Commun. Earth Environ. 1, 1–10. doi: 10.1038/s43247-020-00053-y
Hu, X., Qian, Y., Pickett, S., and Zhou, W. (2020). Urban mapping needs up-to-date approaches to provide diverse perspectives of current urbanization: a novel attempt to map urban areas with nighttime light data. Landsc. Urban Plan. 195:103709. doi: 10.1016/j.landurbplan.2019.103709
Institut Europeen de Cooperation et de Development (2022). Annual Report. Sowing Seeds for the Future. Available at: https://www.iecd.org/en/annual-report-2022/. (Accessed January 23, 2025).
Kemper, T., Madau, N., Mangara, P., and Pesaresi, M. (2014). Towards a country-wide mapping & monitoring of formal and informal settlements in South Africa. Joint Research Centre, European Commission, Science and Policy Reports, SANSA. Available at: https://ec/europa.eu/jrc (Accessed February 19, 2025).
Koroso, N., Lengobioni, M., and Zevenbergen, J. (2021). Urbanization and urban land use efficiency: evidence from regional and Addis Ababa satellite cities, Ethiopia. Habitat Int. 117:102437. doi: 10.1016/j.habitatint.2021.102437
Koti, F. (2022). “Resilience amid uncertainty: COVID-19 pandemic, the urban informal sector, and livelihoods in sub-Saharan Africa” in The geographies of COVID-19. eds. M. Laituri, R. Richardson, and J. Kim (Switzerland: Springer Nature).
Kuffer, M., Pfeffer, K., and Sliuzas, R. (2016). Slums from space −15 years of slum mapping using remote sensing. Remote Sens. 8:455. doi: 10.3390/rs8060455
Laituri, M., Davis, D., Sternlieb, F., and Galvin, K. (2021). SDG Indicator 11.3.1 and secondary cities: an analysis and assessment. ISPRS Int. J. Geo Inf. 10:713. doi: 10.3390/ijgi10110713
Laituri, M., and Sternlieb, F. (2018). Secondary cities: Mapping secondary cities for resiliency, human security, and emergency preparedness. State Report: June 2015-Dec 2017. Secondary Cities Initiative, US Department of State.
Lausch, A., Blaschke, T., Haase, D., Herzog, F., Syrbe, R., Tischendorf, L., et al. (2015). Understanding and quantifying landscape structure – a review on relevant process characteristics, data models and landscape metrics. Ecol. Model. 295, 31–41. doi: 10.1016/j.ecolmodel.2014.08.018
Liverman, D., Moran, E., Rindfuss, R., and Stern, P. (1998). People and pixels: Linking remote sensing and social science. Washington, D.C: National Academy Press.
Lui, Y., Liu, X., Gao, S., Gong, L., Kang, C., Zhi, Y., et al. (2015). Social sensing: a new approach to understanding our socioeconomic environments. Ann. Assoc. Am. Geogr. 105, 512–530. doi: 10.1080/00045608.2015.1018773
McHale, M., Bunn, D., Barnes, E., and Carter, N. (2013). Urban ecology in a developing world: why advanced socioecological theory needs Africa. Front. Ecol. Environ. 11, 556–564. doi: 10.1890/120157
McHale, M. R., Pickett, S. T., Barbosa, O., Bunn, D. N., Cadenasso, M. L., Childers, D. L., et al. (2015). The new global urban realm: complex, connected, diffuse, and diverse social-ecological systems. Sustain. For. 7, 5211–5240. doi: 10.3390/su7055211
Meentemeyer, R. K., Tang, W., Dorning, M. A., Vogler, J. B., Cunniffe, N. J., and Shoemaker, D. A. (2013). FUTURES: multilevel simulations of emerging urban–rural landscape structure using a stochastic patch-growing algorithm. Ann. Assoc. Am. Geogr. 103, 785–807. doi: 10.1080/00045608.2012.707591
Menashe-Oren, A., and Bocquier, P. (2021). Urbanization is no longer driven by migration in low-and middle-income countries (1985-2015). Popul. Dev. Rev. 47, 639–663. doi: 10.1111/padr.12407
Mudau, N., Mwaniki, D., Tsoeleng, L., Mashalane, M., Beguy, D., and Ndugwa, R. (2020). Assessment of SDG Indicator 11.3.1 and urban growth trends in major and small cities in South Africa. Sustain. For. 12:7063. doi: 10.3390/su12177063
Murtaza, K. O., and Romshoo, S. A. (2014). Assessing the impact of spatial resolution on the accuracy of land cover classification. J. Himal. Ecol. Sustain. Dev. 9, 33–45.
Nagendra, H., Bai, X., Brondizio, E. S., and Lwasa, S. (2018). The urban south and the predicament of global sustainability. Nat. Sustain. 1, 341–349. doi: 10.1038/s41893-018-0101-5
Ngounou, B., Oumbe, H., Nkoa, B., and Domguia, E. (2024). Inclusive growth in the face of increasing urbanization: what experience for African countries? Rev. Dev. Econ. 28, 34–70. doi: 10.1111/rode.13026
Norman, L., Villarreal, M., Lara-Valencia, F., Yuan, Y., Nie, W., Wilson, S., et al. (2012). Mapping socio-environmentally vulnerable populations access and exposure to ecosystem services at the US-Mexico borderlands. Appl. Geogr. 34, 413–424. doi: 10.1016/j.apgeog.2012.01.006
Olayiwola, W., and Igbavboa, O. (2014). Land use dynamics and expansion of the built-up area in Benin City, Nigeria. Mediterr. J. Soc. Sci. 5:20. doi: 10.5901/mjss.2014.v5n20p2506
Organization for Economic Co-operation and Development (2022). UN ECA/AfDB-Africa’s urbanization dynamics 2022: The economic power of Africa’s cities, west African studies. Paris: OECD Publishing.
Oyugi, M., Odenyo, V., and Karanju, F. (2017). Mapping the effect of land use and land cover variations on the surface temperature values of Nairobi city, Kenya. Resour. Environ. 7, 145–159. doi: 10.5923/j.re.2017076.01
Pickett, S., Cadenasso, M., Baker, M., Band, L., Boone, C., Buckley, G., et al. (2020). Theoretical perspectives of the Baltimore ecosystem study: conceptual evolution in a social–ecological research project. Bio Sci. 70, 297–314. doi: 10.1093/biosci/biz166
Polokwane Local Municipality. (2024). Polokwane local municipality: Spatial development framework. Available at: https://www.polokwane.gov.za/wp-content/uploads/2024/04/Polokwane-SDF-2024-JS.pdf (Accessed February 19, 2025).
Pontius, R., and Cheuk, M. (2006). A generalized cross-tabulation matrix to compare soft-classified maps at multiple resolutions. Int. J. Geogr. Inf. Sci. 20, 1–30. doi: 10.1080/13658810500391024
Pratomo, J., Kuffer, M., Martinez, J., and Kohli, D. (2017). Coupling uncertainties with accuracy assessment in object-based slum detections, case study: Jakarta, Indonesia. Remote Sens. 9:1164. doi: 10.3390/rs9111164
Radoine, H., Bajja, S., Dakyaga, F., Celik, A., Kamana, A., Yakubu, H., et al. (2024). Modeling the dynamics of urbanization for urban sustainability in West Africa. J. Urban Manag. 13, 580–595. doi: 10.1016/j.jum.2024.06.004
Reba, M., and Seto, K. (2020). A systematic review and assessment of algorithms to detect, characterize and monitor urban land change. Remote Sens. Environ. 242:111739. doi: 10.1016/j.rse.2020.111739
Riadi, P. R., Graefe, S., and Buerkert, A. (2020). Landscape transformation processes in two large and two small cities in Egypt and Jordan over the last five decades using remote sensing data. J. Lands. Urban Plan. 197:103766. doi: 10.1016/j.landurbplan.2020.103766
Ritchie, H. (2018). How urban is the world? Published online at our world InData.org. Available at: https://ourworldindata.org/how-urban-is-the-world (Accessed February 19, 2025).
Roberts, B.H. (2014). Managing Systems of Secondary Cities: policy responses in international development. Available at: https://www.citiesalliance.org/sites/citiesalliance.org/files/1d%20(i)%20-%20Managing%20Systems%20of%20Secondary%20Cities%20Book_low_res.pdf (Accessed February 19, 2025).
Robinson, J. (2002). Global and world cities: a view from off the map. Int. J. Urban Reg. 26, 531–554. doi: 10.1111/1468-2427.00397
Sakketa, T. (2023). Urbanisation and rural development in sub-Saharan Africa: a review of pathways and impacts. Res. Glob. 6:100133. doi: 10.1016/j.resglo.2023.100133
Sanya, R., and Mwebaze, E. (2020). Identifying patterns of urban housing density in developing countries using convolutional networks and satellite imagery. Heliyon 6:e05617. doi: 10.1016/j.heliyon.2020.e05617
Schneider, A. (2012). Monitoring land cover change in urban and peri-urban areas using dense time stacks of Landsat satellite data and a data mining approach. Remote Sens. Environ. 124, 689–704. doi: 10.1016/j.rse.2012.06.006
Shah Heydari, S., Vogeler, J. C., Cardenas-Ritzert, O. S. E., Filippelli, S. K., McHale, M., and Laituri, M. (2024). Multi-tier land use and land cover mapping framework and its application in urbanization analysis in three African countries. Remote Sens. 16:2677. doi: 10.3390/rs16142677
Shao, Z., Sumari, N., Portnov, A., Ujoh, F., Musakwa, W., and Mandela, P. (2021). Urban sprawl and its impact on sustainable urban development: a combination of remote sensing and social media data. Geo-spat. Inf. Sci. 24, 241–255. doi: 10.1080/10095020.2020.1787800
Simwanda, M., Ranagalage, M., Estoque, R., and Murayama, Y. (2019). Spatial analysis of surface urban heat islands in four rapidly growing African cities. Remote Sens. 11:1645. doi: 10.3390/rs11141645
Sondou, T., Anoumou, K., Aholou, C., Chenal, J., and Colombo, V. (2024). Urban growth land artificialization in secondary African cities: a spatiotemporal analysis of Ho (Ghana) and Kpalime (Togo). Urban Sci. 8:207. doi: 10.3390/urbansci8040207
The World Factsheet, CIA. (2024). Available at: https://www.cia.gov/the-world-factbook/countries/ethiopia/factsheets/ (Accessed January 23, 2025).
United Nations DESA. (2018). Available at: https://population.un.org/wup/Publications/Files/WUP2018-Report.pdf (Accessed January 23, 2025).
United Nations HABITAT (2021a) The sustainable development goals report. E-ISBN: 978-92-1-047887-8. Available at: https://unhabitat.org/sustainable-development-goals-report-2021 (Accessed January 23, 2025).
United Nations HABITAT. (2021b). SDG Indicator Metadata. Available at: https://unstats.un.org/sdgs/metadata/files/Metadata-11-03-01.pdf (Accessed November 15, 2024).
United Nations HCR. (2022). Ethiopia situation-global report. Available at: https://reporting.unhcr.org/ethiopia-situation-global-report-022#:~:text=Efforts%20to%20bring%20humanitarian%20aid,the%20operation%2C%20affecting%20UNHCR's%20response (Accessed January 23, 2025).
United Nations World Populations Prospects. (2024). Department of Economic and Social Affairs. Available at: https://population.un.org/wpp/ (Accessed January 23, 2025).
Van Den Hoek, J., and Friedrich, H. (2021). Satellite-based human settlement datasets inadequately detect refugee settlements: a critical assessment at thirty refugee settlements in Uganda. Remote Sens. 13:3574. doi: 10.3390/rs13183574
Wang, S., Hu, M., Wang, Y., and Xia, B. (2022). Dynamics of ecosystem services in response to urbanization across temport and spatial scale in a mega metropolitan area. Sustain. Cities Soc. 77:103561. doi: 10.1016/j.scs.2021.103561
Wang, J., and Maduako, I. (2018). Spaito-temporal urban growth dynamics of Lagos metropolitan region of Nigeria based on hybrid methods for LULC modeling and predictions. Europ. J. Remote Sens. 51, 251–265. doi: 10.1080/22797254.2017.1419831
World Bank Data. (2024). Available at: datacatalog.org.worldbank.org (Accessed 15 November 2024).
World Bank Group. (2023). Available at: https://www.worldbank.org/en/topic/urbandevelopment/overview (Accessed January 12, 2025).
World Population Prospects. (2024). Available at: https://population.un.org/wpp/ (Accessed November 15, 2024).
World Population Review. (2024). Available at: https://worldpopulationreview.com/world-cities/benin-city-population (Accessed November 15, 2024).
Worldometer. (2024). Available at: https://www.worldometers.info/world-population/ethiopia-population/ (Accessed January 12, 2025).
Xu, M., He, C., Liu, Z., and Dou, Y. (2016). How did urban land expand in China between 1992 and 2015? A multi-scale landscape analysis. PLoS One 11:e0154839. doi: 10.1371/journal.pone.0154839
Yu, D., and Fang, C. (2023). Urban remote sensing with spatial big data: a review and renewed perspective of urban studies in recent decades. Remote Sens. 15:1307. doi: 10.3390/rs15051307
Zhou, Y., Xuecao, L., Chen, W., Meng, L., Wu, Q., Gong, P., et al. (2022). Satellite mapping of urban build-up heights reveals extreme infrastructure gaps and inequalities in the global south. Proc. Natl. Acad. Sci. 119:e2214813119. doi: 10.1073/pnas.22214813119
Keywords: urbanization, land use change, hotspots, Sustainable Development Goals, Africa
Citation: Laituri M, Cardenas-Ritzert OSE, Vogeler JC, Shah Heydari S and McHale MR (2025) The last urban frontier—assessing hotspots of urban change associated with LCLUC in Africa. Front. Sustain. Cities. 7:1529440. doi: 10.3389/frsc.2025.1529440
Edited by:
Gang Xu, Wuhan University, ChinaCopyright © 2025 Laituri, Cardenas-Ritzert, Vogeler, Shah Heydari and McHale. This is an open-access article distributed under the terms of the Creative Commons Attribution License (CC BY). The use, distribution or reproduction in other forums is permitted, provided the original author(s) and the copyright owner(s) are credited and that the original publication in this journal is cited, in accordance with accepted academic practice. No use, distribution or reproduction is permitted which does not comply with these terms.
*Correspondence: Melinda Laituri, bWVsaW5kYS5sYWl0dXJpQGNvbG9zdGF0ZS5lZHU=