
95% of researchers rate our articles as excellent or good
Learn more about the work of our research integrity team to safeguard the quality of each article we publish.
Find out more
ORIGINAL RESEARCH article
Front. Sustain. Cities , 25 March 2025
Sec. Health and Cities
Volume 7 - 2025 | https://doi.org/10.3389/frsc.2025.1497768
This article is part of the Research Topic Intelligent Systems for Sustainable Building: Balancing IEQ with Energy Efficiency View all articles
 Md. Monabbir Hossain1
 Md. Tariqul Islam2,3*†
 Sujit Kumar Sikder4
 Sarah L. Hemstock5Md. Aminul Islam6,7Mahmud Hossain Faruquee8Md. Zakir Hossain9
Improving the urban environment is an urgent task in the fast-growing mid-sized cities of South Asia. Ambient air pollution is worsened by unplanned urban land use and a lack of green and waterbodies, which combined cause a rapid increase in the urban heat island (UHI) effect. This study focuses on pervasive ambient air pollution in the urban environment, primarily driven by particulate matter (PM), which presents a dire public health threat. An in-situ investigation of 48 sites in a mid-sized but fast-growing city, Mymensingh, Bangladesh, suggested that the PM2.5 concentration (118 ± 64 μg/m3) is about eight times higher than the daily average suggested by WHO (15 μg/m3). Weekdays and weekends do not show significant differences in PM generation. Geospatial analysis suggests that good air quality conditions are not found in the study area, and > 50% of people are exposed to PM10 in very unhealthy conditions (≥151 μg/m3). Traffic and commercial land cover generate the highest PM level. The monsoon climatic events control precipitation and are the most influential factor in diminishing PM concentrations. However, fast-growing mid-sized cities, like Mymensingh in Bangladesh and others throughout South Asia, are facing extreme ambient air pollution that severely impacts public health. Therefore, more action-oriented research initiatives are needed to formulate policies to control air pollution, considering local experiences, indigenous knowledge, logistics capabilities, cultural orientation, transparency, accountability, and strong collaboration, cooperation, and commitment among the public-private partnership.
More focus in recent years has been given to the urban climate in fast-growing mid-sized cities in South Asia, rather than focusing on mega cities as has been done in the past. Proven approaches include the integrated Land use-Mobility-Energy-Environmental approach in urban development (e.g., Sikder et al., 2018; Alipour and Dia, 2023). Poor urban land use planning leads to ambient air pollution (e.g., ozone and nitrogen oxide), which further affects urban heat islands (UHI) (e.g., Sarrat et al., 2006; Li et al., 2018; Ulpiani, 2021). In fact, urban pollution islands (UPI) and UHI are two major concerns for the urban environment that exist simultaneously (e.g., Agarwal and Tandon, 2010; Ulpiani, 2021).
The World Health Organization (WHO) has stated that nearly the entire global population (99%) is exposed to air that exceeds the WHO’s permissible air pollution standards (WHO, 2021), and the highest suffering is experienced in low and middle-income countries (WHO, 2024a). Since 1987, WHO has been providing health-based air quality (AQ) guidelines (AQG) for governments and society to reduce human exposure to air pollution (WHO, 2021), which are related to Sustainable Development Goals (SDGs) targets 3.9.1, 7.1.2, and 11.6.2 (WHO, 2024b). In 2019, air pollution was the fourth leading risk factor for premature death (4.2 million) globally, with 89% occurring in low-and middle-income countries, and the greatest risk experienced in Southeast Asia and the Western Pacific Regions (HEI, 2020; WHO, 2022). These deaths were associated with air pollution-related ischemic heart disease and stroke (37%), chronic obstructive pulmonary disease (18%), acute lower respiratory infections (23%), and cancer within the respiratory tract (11%) (WHO, 2022). In addition, it has long-term effects, for example lower labor productivity and slowing plant development and agricultural productivity (Kapoor et al., 2024a).
Particulate Matter (PM) is the major component of air pollutants and is comprised of sulphate, nitrates, ammonia, sodium chloride, black carbon, mineral dust, and water particles (WHO, 2024c). The health risks associated with PM2.5 (diameter ≤ 2.5 μm) and PM10 (diameter ≤ 10 μm) are well documented due to their ability to penetrate deep into the lungs and the bloodstream (WHO, 2024c). A 1% increase in exposure to PM2.5 over WHO’s AQG (5 μg/m3 annual average and 15 μg/m3 24-h average) can cause an approximately 12.8% increase in breathing difficulties, 12.5% increase in wet coughs, and 8.1% higher risk of lower respiratory tract infection (World Bank, 2022). The cleanest city in Bangladesh, Sylhet (Figure 1), has a PM2.5 level ⁓10 times higher than the WHO’s AQG (Islam et al., 2020).
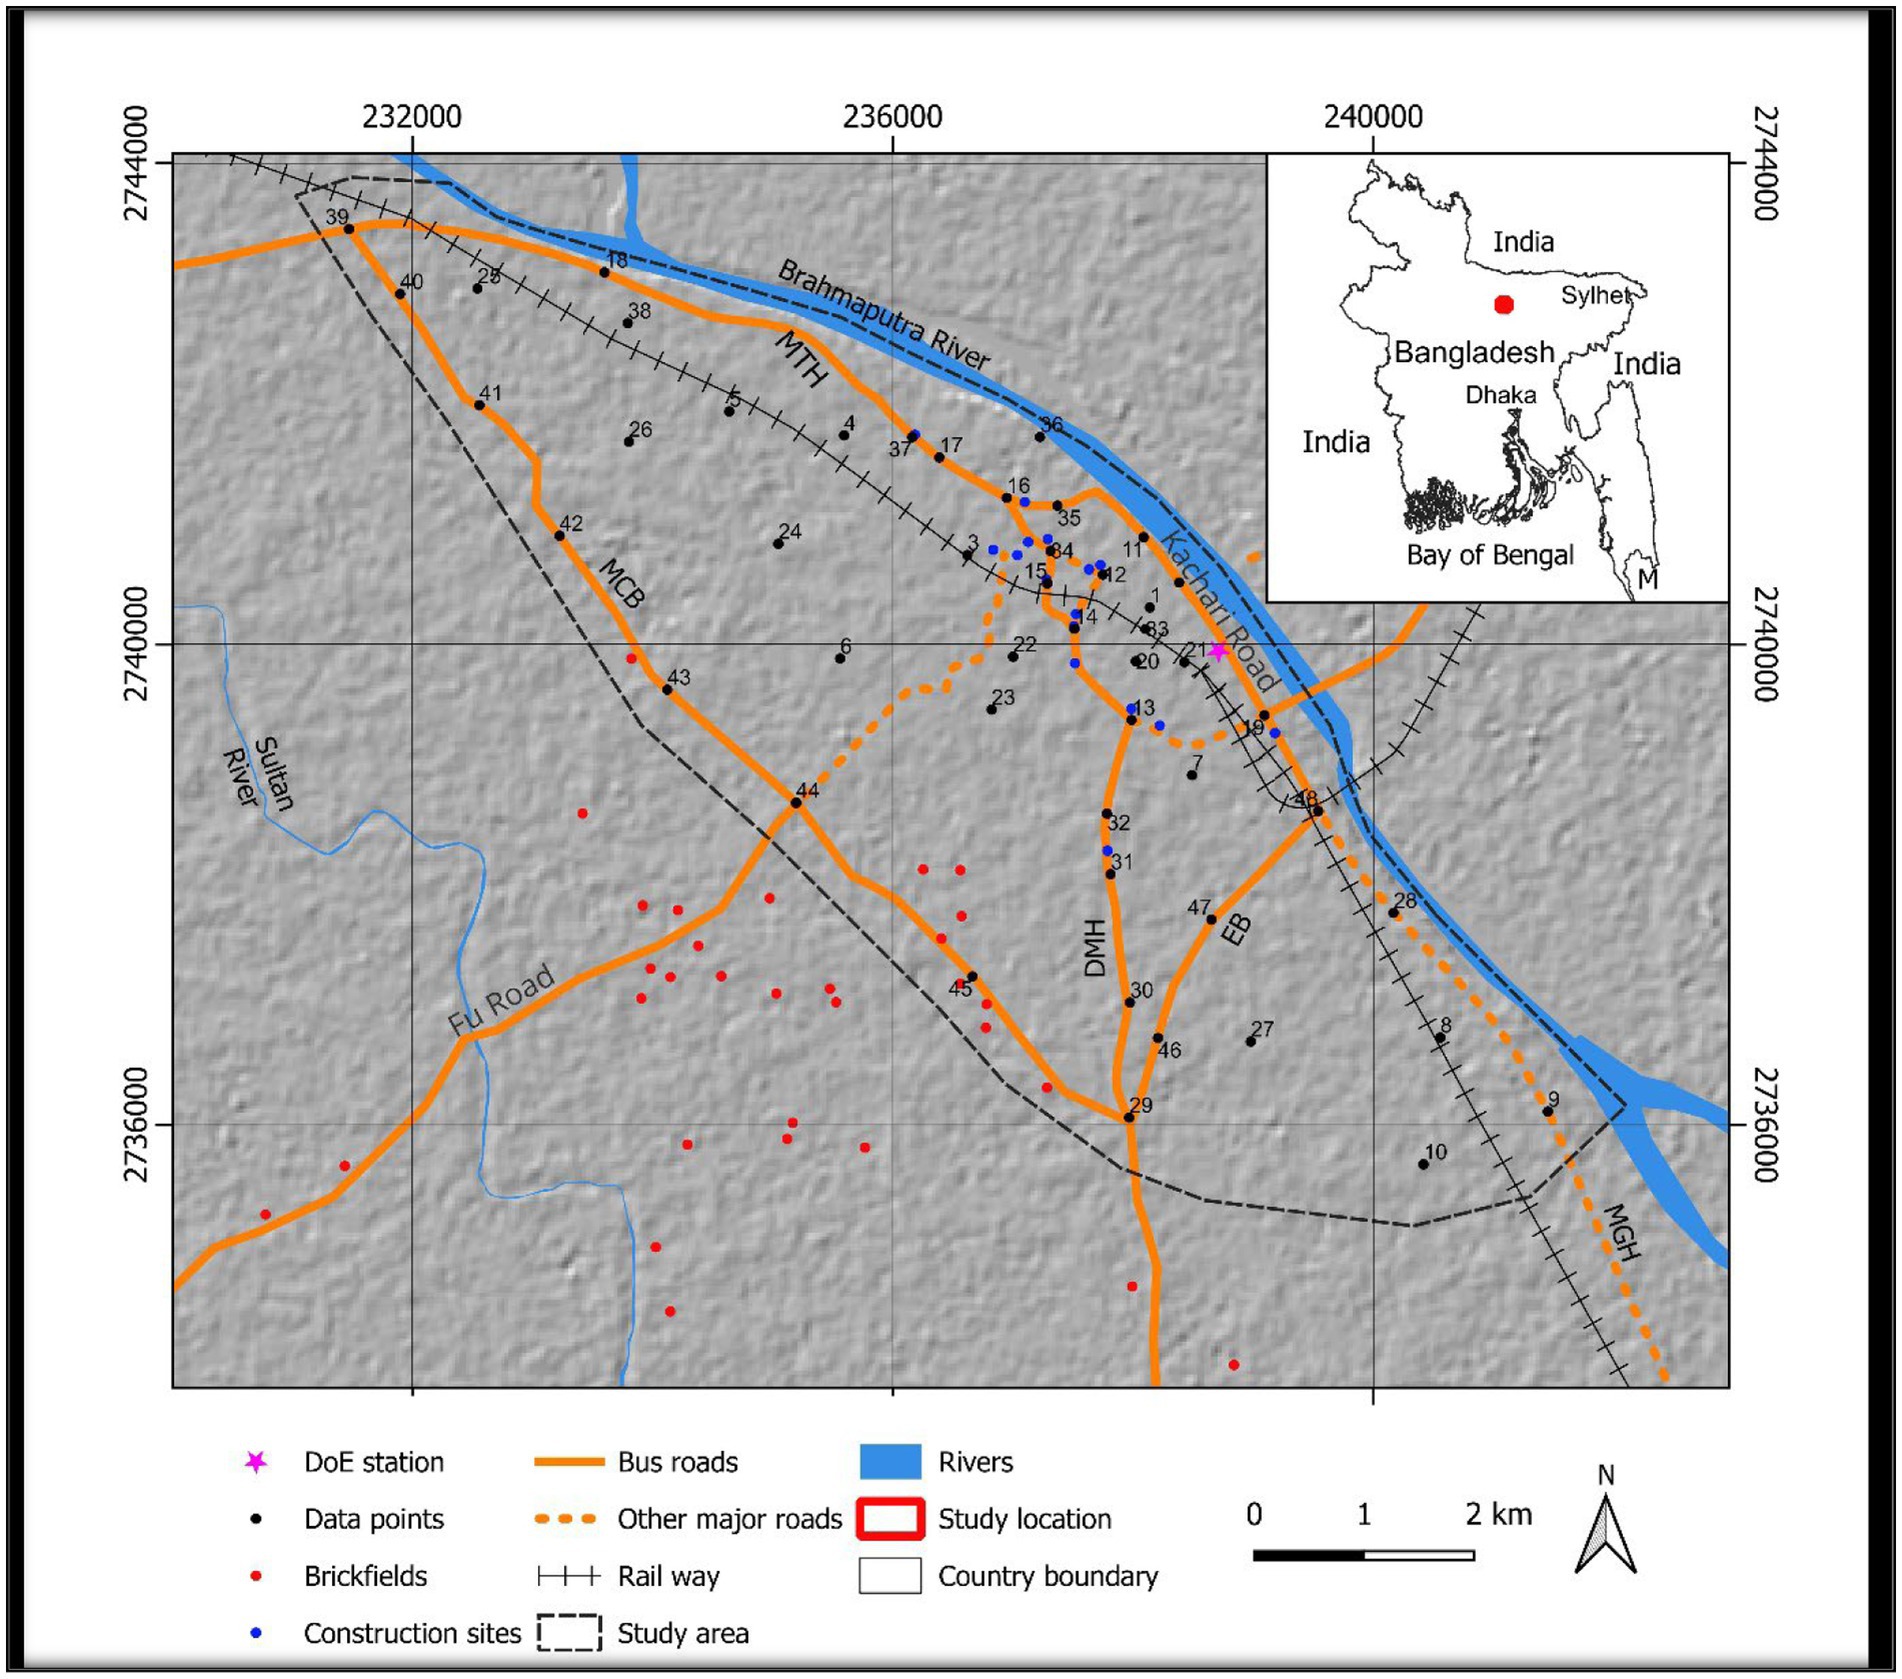
Figure 1. The location map of the study area—Mymensingh City Corporation. The locations of Mymensingh Tangail Highway (MTH), Mymensingh City Bypass (MCB), Dhaka Mymensingh Highway (DMH), Eastern Bypass (EB), Mymensingh Gafargaon Highway (MGH), and Myanmar (M) are also located. The hill shade map in the background is produced from 30 m resolution SRTM data (Farr et al., 2007). The unit of the grid is meters is presented in WGS 84, UTM Zone 46 N.
In Bangladesh, 78,145–88,229 deaths in 2019 were caused by air pollution, costing the country 3.9–4.4% of GDP (World Bank, 2022). Poor ambient air pollution puts people at risk of breathing difficulties, cough, lower respiratory tract infections, depression, and other health conditions (World Bank, 2022). During 2018–2021, Bangladesh and its capital city, Dhaka (Figure 1), were ranked the most polluted country and second most polluted city in the world, respectively. Reasons for air pollution, e.g., for Dhaka city, are listed as smoke from brickfield kilns (58%), exhaust from transport vehicles (⁓10%), road dust (⁓8%), soil dust (⁓8%), biomass burning (⁓7%), sea salt (⁓1%), and dust from construction sites due to rapid urbanization (Begum et al., 2013). This city’s air pollution rate is increasing 10% per year.
A significant number of studies have examined ambient AQ and public health in Bangladesh’s major cities, including Dhaka and Chittagong (see Table 1). These cities have predominantly developed organically, though certain areas have undergone targeted, pocket-based development due to planning principles. This study aims to examine a mid-sized fast-growing city, where findings may offer significant insights for urban planners and policymakers. The major objectives of this study are (1) to estimate the population exposure under different levels of PM2.5 and PM10 set by local regulatory authorities using high spatial resolution in-situ observation and (2) to identify possible sources of air pollution (excluding quantification). This study also explores the relationship between PM2.5 and PM10 with other environmental and demographic factors and seasonal variation. An empirical case study has been conducted in a mid-sized city in Bangladesh named Mymensingh (Figure 1).
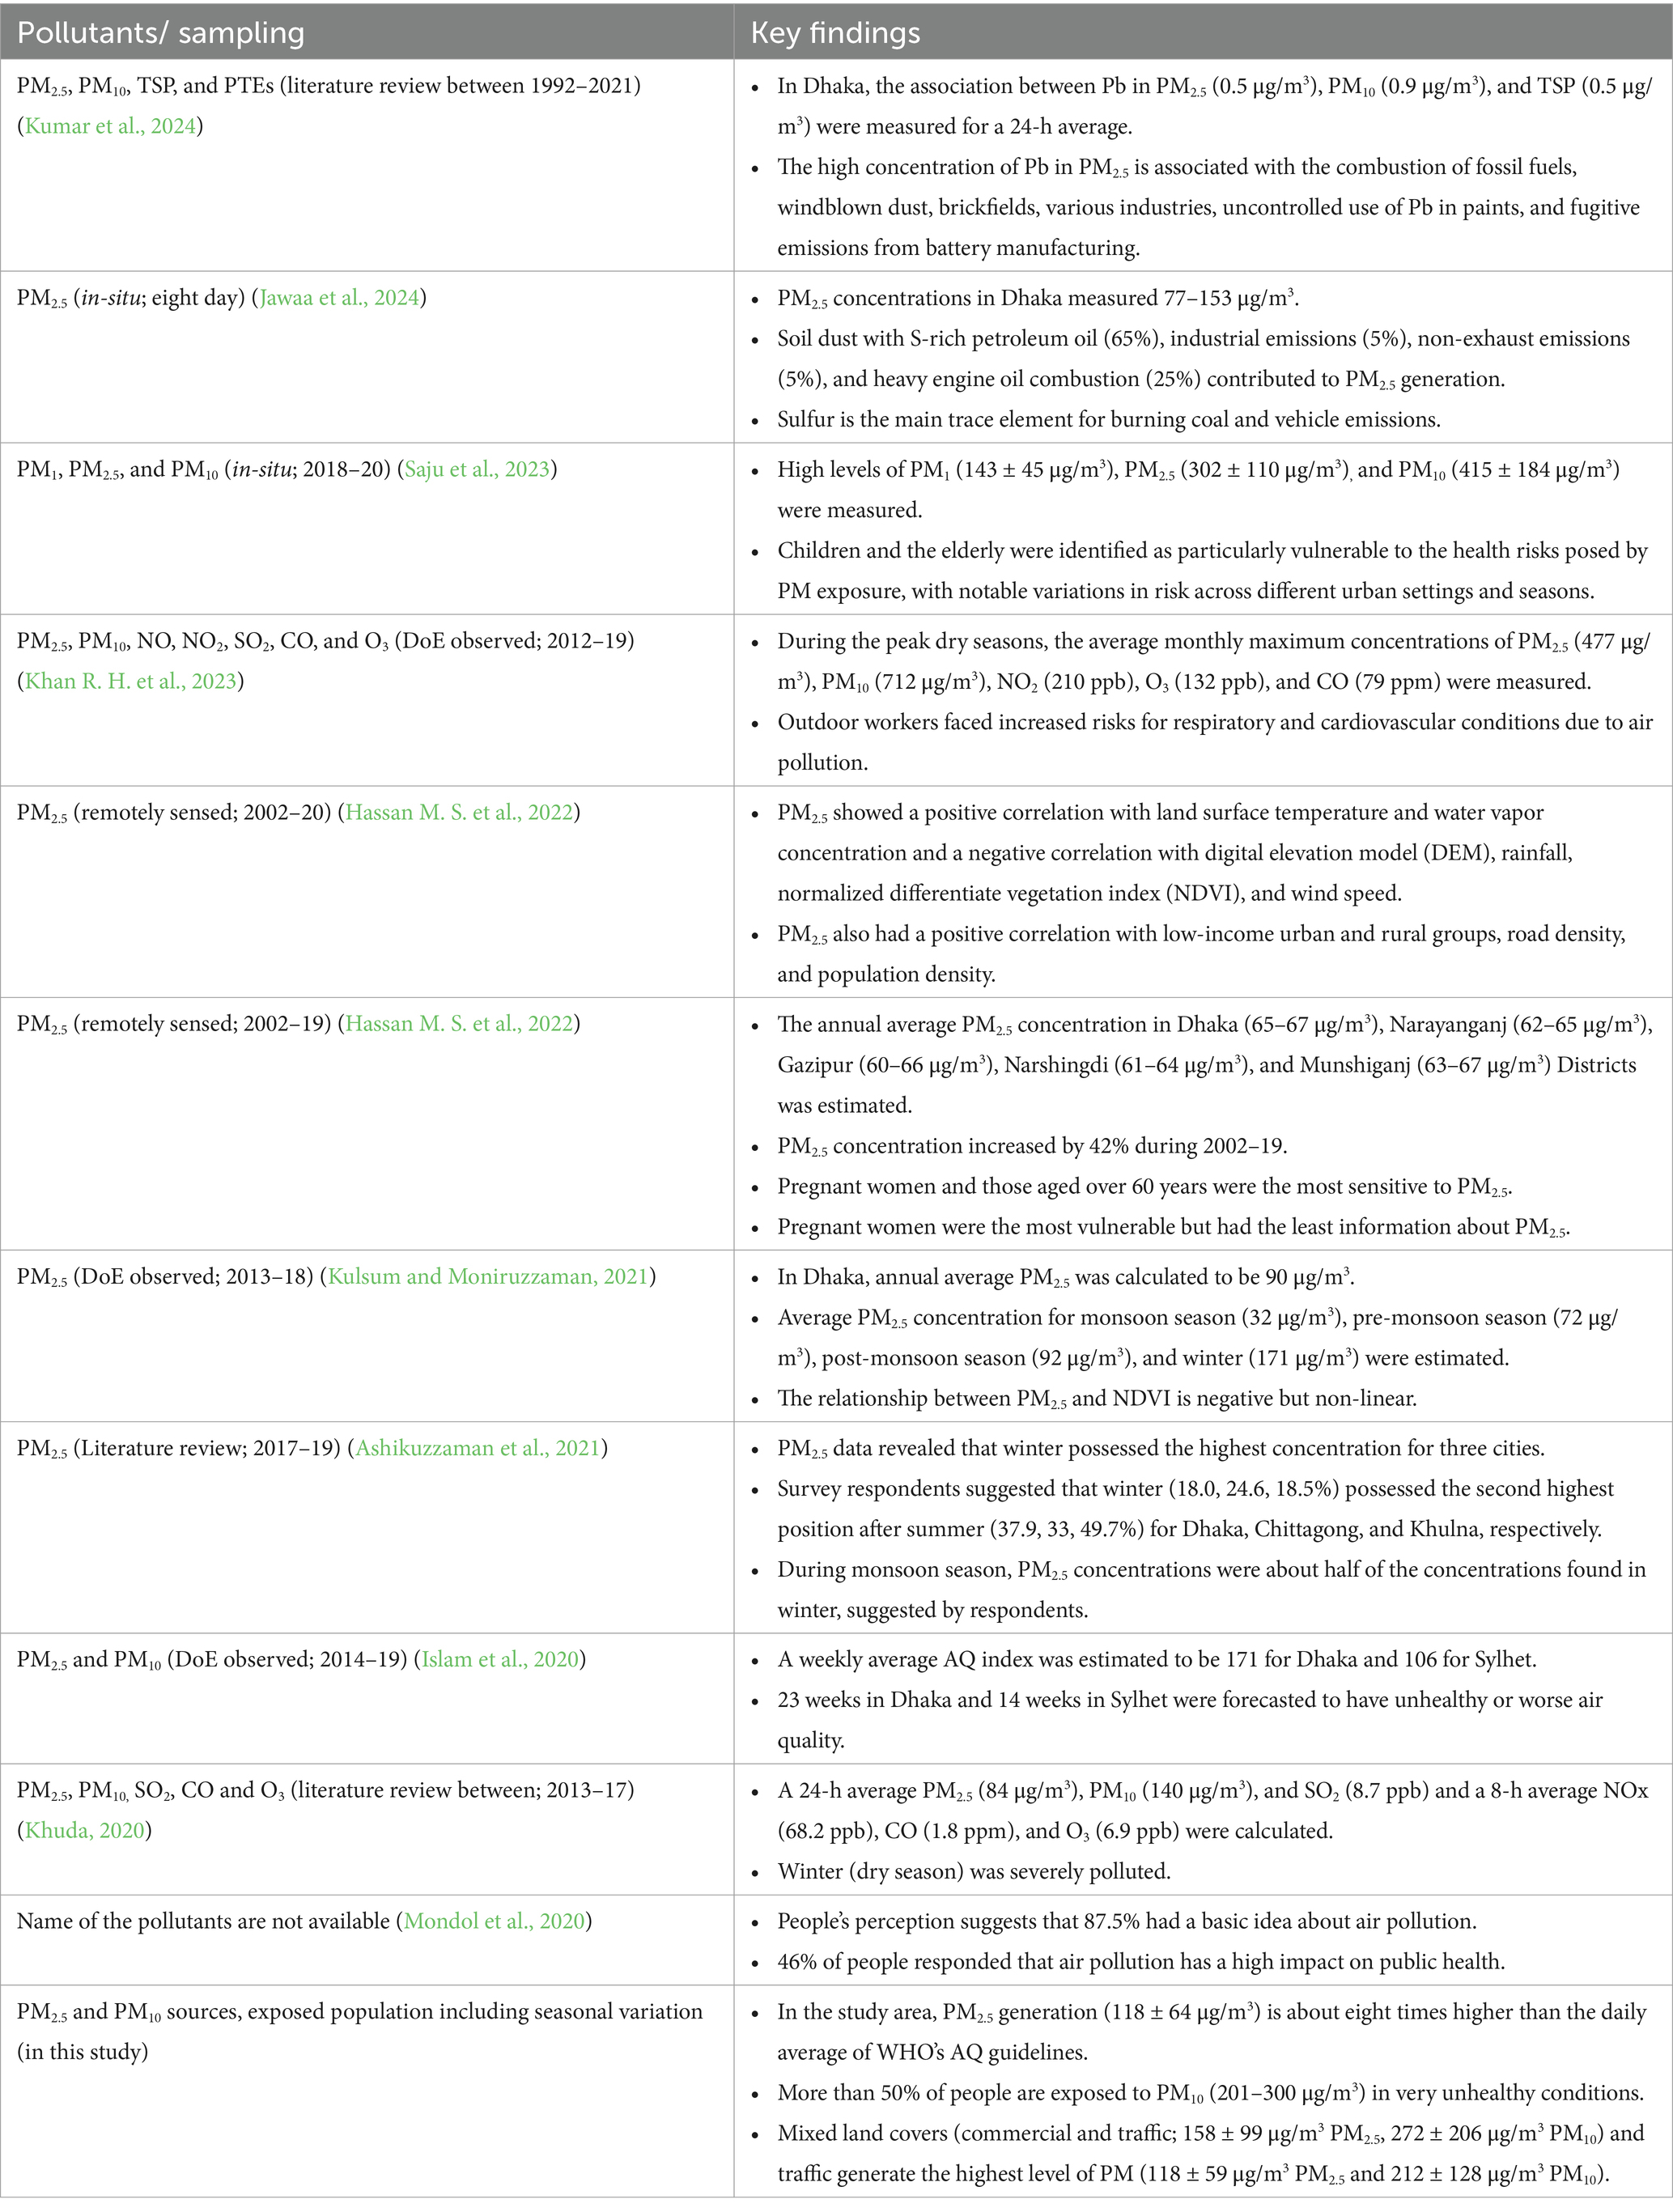
Table 1. Most recent literature on air pollution and public health in Bangladesh.
A semi-systematic (e.g., Snyder, 2019) literature review approach was adopted and widely used to identify the research gaps and scope (Snyder, 2019; Zunder, 2021). Google Scholar, ScienceDirect, and Web of Science were used to search the documents. The keywords searched for were “particulate matter pollution,” “air pollution trends,” “indoor and outdoor air pollution,” “impact of particulate matter on human health,” “particulate matter concentration in urban areas,” “sources of particulate matter pollutants,” and “seasonal variation of particulate matter.” Bangladesh-related peer-reviewed articles were considered for in-depth research analysis, and concepts and theories from international literature were synthesized. Backward and forward citation searching was also applied (e.g., Haddaway et al., 2022). A total of 30 documents related to ambient air pollution, PMs, potential sources, and impact on public health in Bangladesh were reviewed qualitatively, and the most recent literatures were documented in a tabular format (Table 1).
Ambient air pollution in Bangladesh is a serious issue, and thousands of people die every year from causes related to it (World Bank, 2022). However, detailed research is minimal compared to other global southern countries. Most of the research was dependent on the Department of Environment’s (DoE) AQ Index (AQI) (mainly PM2.5), although they have very few permanent monitoring stations and remotely sensed processed data with very coarse spatial resolution (DoE, 2024). Very few studies have been conducted on in-situ observation of air pollutants with very coarse spatial and temporal resolution.
The impact of air pollution on public health was linked to stakeholders’ perceptions by using questionnaires, surveys, or interviews. One study conducted a pathological investigation using blood samples, but it has not been completed yet (Haque et al., 2024). However, the impacts of air pollutants, e.g., PM and nitrogen oxides [NOx = nitric oxide (NO) + nitrogen dioxide (NO2)] among others (e.g., total suspended particles (TSP), potentially toxic elements (PTE), sulfur dioxide (SO2), carbon monoxide (CO), carbon dioxide (CO2), and ozone (O3)), on public health are well established. Therefore, many researchers estimated the number of exposed people to the level of polluted air.
Recent studies analyzed in-situ observations with high spatial resolution but poor temporal resolution (Hossain et al., 2023). There is scope for detailed analysis to take advantage of high spatial resolution in-situ observation. Analysis of the additional data with high temporal resolution from DoE (2024) might offer insights into the ongoing air pollution conditions and exposed populations. This study used those opportunities. A summary of the most recent studies is presented in Table 1.
Mymensingh City Corporation (MCC), which has a total area of 5,679 ha, is a mid-sized South Asian city located in Bangladesh (Figure 1). It extends from longitude 90°19′53.18″ east to 90°27′35.48″ east and latitude 24°42′4.71″ north to 24°47′46.87″ north. The area is of low altitude (2–39 m), with a very gentle slope up to 31.5 degrees. It was a district headquartered by the British Indian government in 1787 and became a divisional headquarters in 2015. Mymensingh City was upgraded from a Municipality to a City Corporation in 2018. Being recently promoted to divisional headquarters and city corporation, a massive construction development is underway in the MCC area. It also became a hub for commercial and administrative activities. Therefore, the mass population travels from within this district and neighboring districts.
The yearly average temperature in Mymensingh is 28.73°C, ranging from 8.2°C in January to 46.12°C in May, and this temperature is about 1 % higher than the Bangladesh average. This area receives rainfall of ⁓70.7 mm, ranging from 1.33 mm in January to 134.34 mm in May. The average relative humidity in this area is about 67.18%, ranging from 46.47% in February to 81.95% in July (Weather and Climate, 2023).
According to Banglapedia (2023), officially there are six seasons in Bangladesh, but some seasons flow into other seasons and make others shorter. According to hotness-coldness and dryness-rainfall, three distinct seasons are observed in this country: very hot pre-monsoon summer (March–May), rainy monsoon (June–October), and cold and dry winter (November–February).
The Brahmaputra River and the Mymensingh City Bypass bound the northeast and southwest borders of the study area. Around the Mymensingh City Bypass and south of it, 34 brickfields can be identified from Google Map (Figure 1). Heavy vehicles for both passenger and goods transportation are seen on bus roads, as illustrated in Figure 1. In addition, passengers and goods are transported by human-wheelers and battery-powered three-wheelers (rickshaws and vans).
Recently, the status of Mymensingh Paurashava (the local government unit in the urban area) has changed to City Corporation. Therefore, massive urbanization and urban activities have increased, leading to high air pollution. This study explores the extent of air pollution due to PM2.5 and PM10 in Mymensingh City Corporation.
PM (PM2.5 and PM10) data were collected from secondary sources: field campaigns conducted from 27 March to 02 April 2023 (dry season) using a portable Airveda PM2.5 and PM10 AQ Monitor (Supplementary Table A1) (Airveda, 2022). The measurements were conducted in 148 sample sites (Figure 1) including commercial areas (12 sites), mixed-use areas (7 sites), residential areas (10 sites), and traffic-heavy areas (19 sites) in proximity to the possible sources of air pollutants, with three different time intervals: 7–9 a.m., 12–2 p.m., and 5–7 p.m. In Bangladesh, peak traffic hours are typically observed between 7–9 a.m. and 5–7 p.m. Conversely, 12–2 p.m. is characterized by significantly lower traffic flow (off-peak). To comprehensively capture the traffic-related pollution variability, these time intervals were included. It was a snapshot measurement where the measurement instrument was run for 5–10 min. The value was noted when it showed a relatively stable reading (excluding high measurements due to real-time source encounters). Therefore, the measured PM data represents the general state of ambient air pollution. Geographical locations were also captured in the World Geodetic System 1984 (WGS 84) coordinate system. Further, PM2.5 (μg/m3) concentration data between 13 February 2023 and 10 April 2024, measured at a permanent station (Figure 1) in the study area operated by DoE, was accessed from DoE (2024).
The cloud-free Sentinel 2A data were occupied from Copernicus (2024), which were processed by ESA. This data was captured on 11 April 2023, which ensures that the environmental conditions of PM data are similar to those measured in the field.
Populated and built-up area data were grid-based (raster) (Table 2). Each pixel represents the number of people living in that particular area in 2020 (for population) and the percent of built-up area in 2018 (for built-up area).
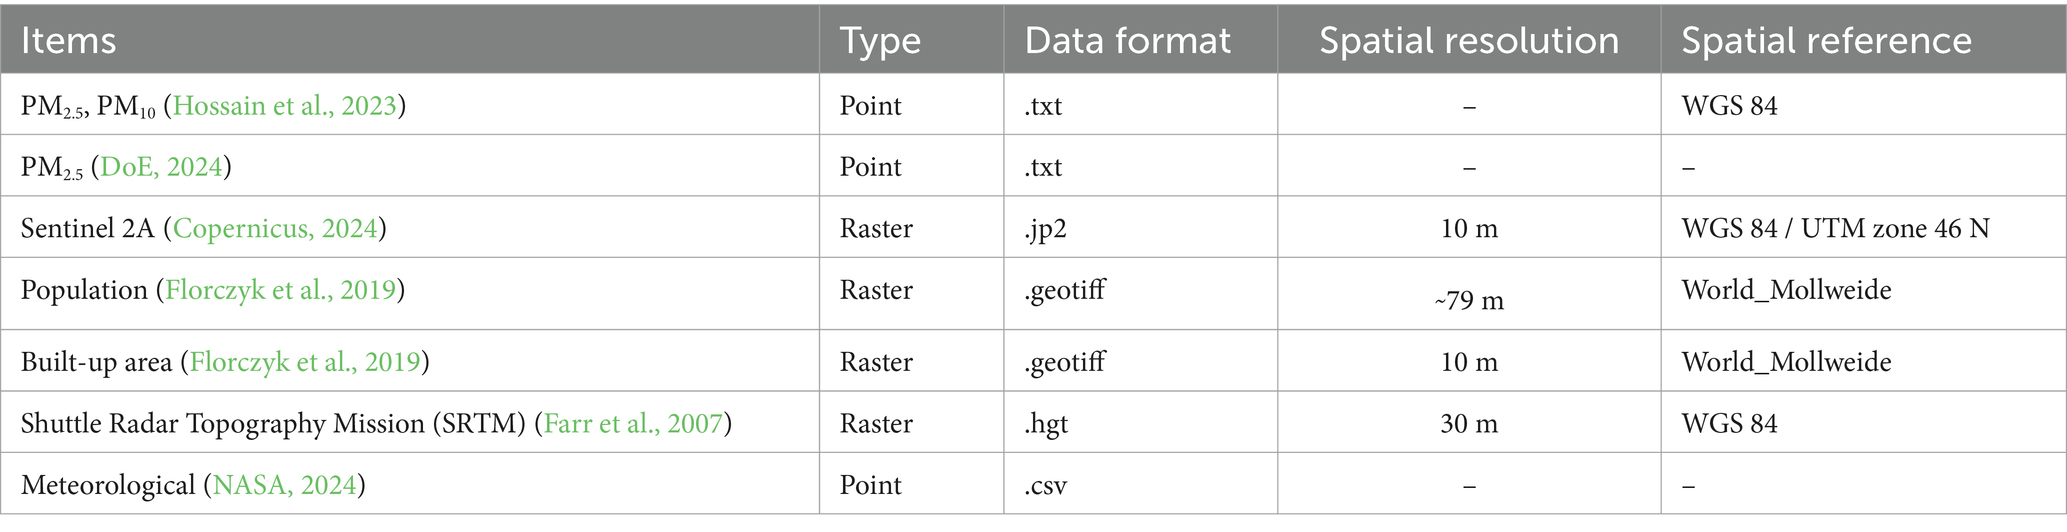
Table 2. Description of used datasets in this study.
Shuttle Radar Topography Mission (SRTM) data was also grid-based, with each pixel representing elevation in meters. Meteorological data, such as precipitation (mm), temperature (°C), and relative humidity (%) at a two-meter height at the location of the DoE permanent station, were accessed from NASA (Table 2).
R software was used to analyze the descriptive statistics of PM data (Supplementary Table B1). The explorative findings are presented with graphs and box plots. This enables the visualization of the site-specific, land cover-specific, and weekdays-weekends variation of data. The 27th (Monday) to 30th (Thursday) of March and 2nd (Sunday) of April 2023 were the weekdays and the 31st of March (Friday) and 1st of April (Saturday) were the weekends in Bangladesh. The average PM concentration (μg/m3) was also presented in a graphical and tabular format.
To quantify the vulnerable population under exposed PM, a continuous surface map of PM with 30 m spatial resolution was generated using the inverse distance weighted interpolation method, where measured PM data points were used as input using QGIS (QGIS.org, 2024). The PM surface layers were classified based on a classification scheme from the DoE. The classification scheme used categories of good (0–50 μg/m3), moderate (51–100 μg/m3), caution (101–150 μg/m3), unhealthy (151–200 μg/m3), very unhealthy (201–300 μg/m3) and extremely unhealthy (301+ μg/m3) for both PM2.5 and PM10. These classified PM layers were used to clip the population layer to calculate the number of populations living in different conditions of pollution levels. A summarization of the population (aggregate and percentage) was estimated (Supplementary Table B2). However, for the visualization, the population layer was converted to a density map (population/ha), overlaid by contours of different pollution levels generated from classified PM layers (Figure 2).
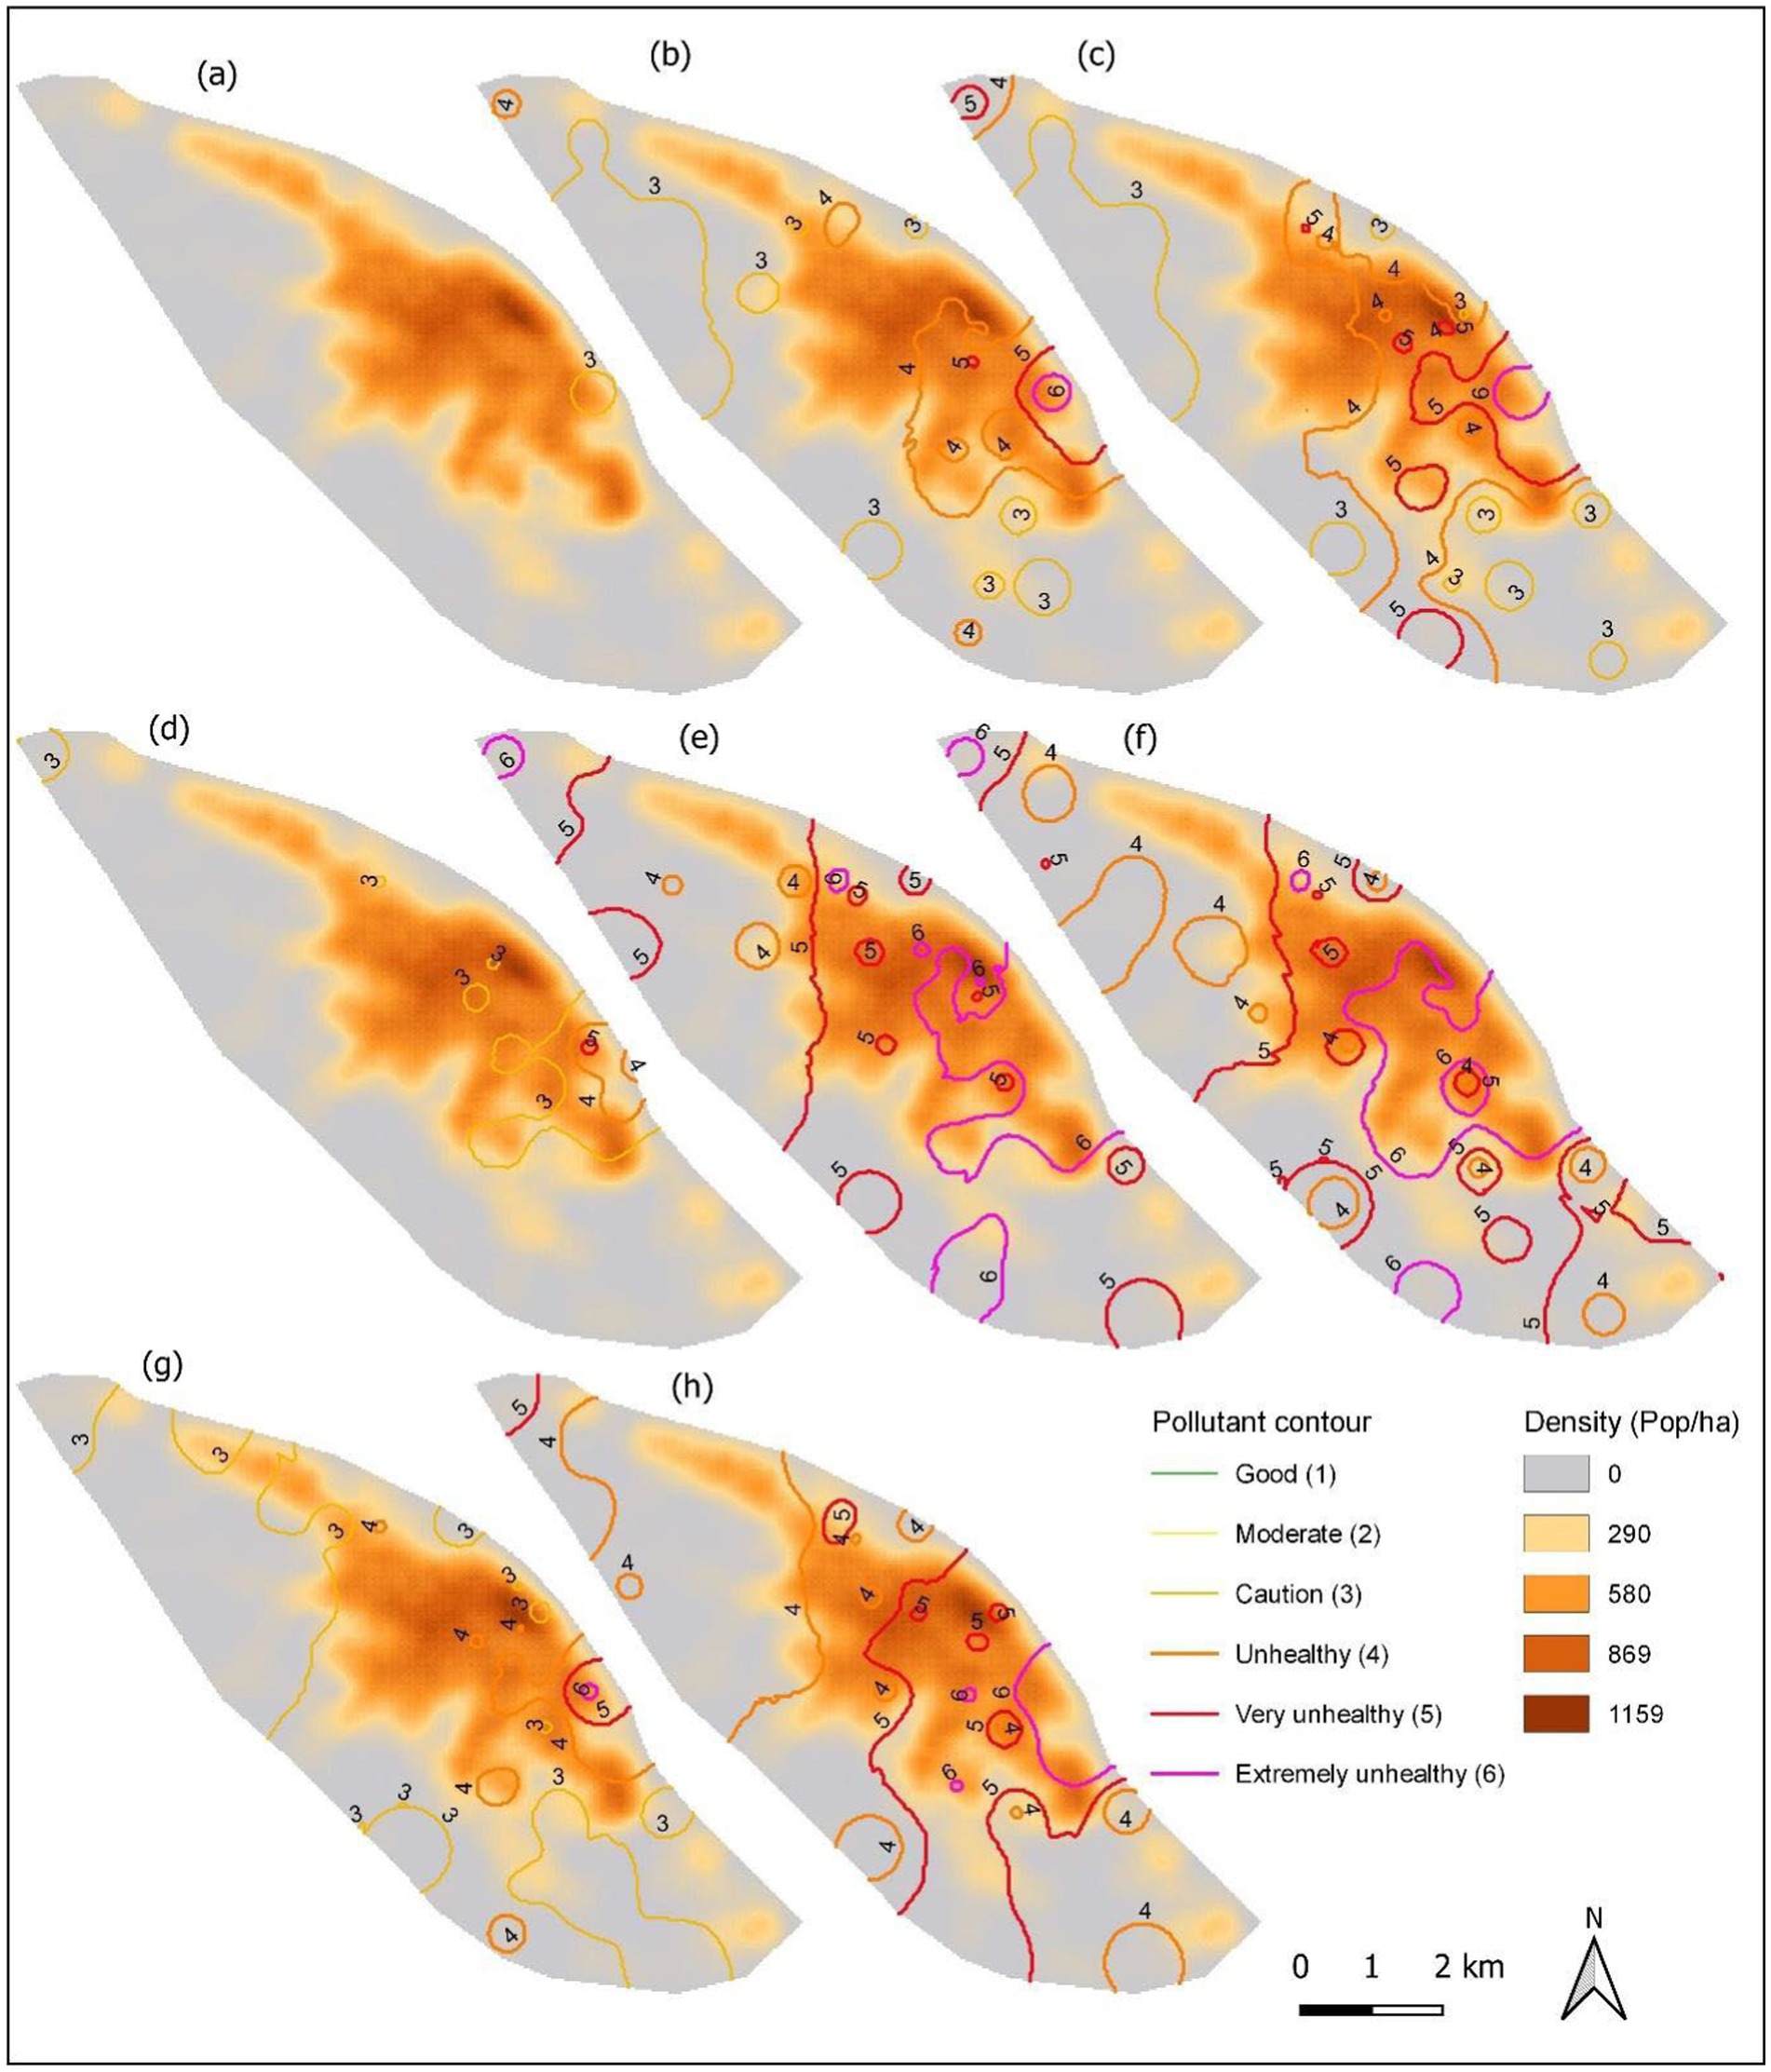
Figure 2. Population density overlaid by air pollution level contour, with particulars (a) PM2.5 at 7–9 a.m., (b) PM2.5 at 12–2 p.m., (c) PM2.5 at 5–7 p.m., (d) PM10 at 7–9 a.m., (e) PM10 12–2 p.m., (f) PM10 at 5–7 p.m., (g) PM2.5 average, and (h) PM10 average.
To explore the relationship among PM, NDVI, DEM (in meter), slope (in degree), built-up area (in %), and population density (person/ha), a multivariate ordinary least squares regression (MOLSR), Pearson’s product–moment correlation (PPC), and geographically weighted regression (GWR) were conducted.
The general of MOLSR is as follows in Equation 1:
where y is the dependent variable, β0 is constant, and β1, β2, β3, …, βn are the coefficient to the independent variables x1, x2, x3, …, xn. However, in the GWR, the locational term is considered with MOLST and the general form of GWR is as follows in Equation 2 (e.g., Hassan S. et al., 2022; Majumder et al., 2023):
where y is the dependent variable at location u, β0 is constant, and β1, β2, β3, …, βn are the coefficient of the dependent variables x1, x2, x3, …, xn at the same location u. GWR executes separately for every spatial unit i of the study area.
In MOLSR, PM (PM2.5 and PM10, separately) were considered to be dependent variables, and NDVI, DEM, slope, population density, and built-up were taken as independent variables. MOLSR was performed in four different levels: (i) exact location of PM point data, (ii) 100 m buffer, (iii) 250 m buffer, and (iv) 500 m buffer of PMs point data.
For MOLSR and PPC, measured values of PM were used for the exact location of PM point data. NDVI, DEM, slope, population density, and built-up data were extracted from their continuous surface layer using the Sample raster values tool of QGIS, where measured PM point data location was used as the Input layer.
NDVI was prepared following an Equation 3 using Sentinel 2A data (Table 1) applying a tool, Raster Calculator of QGIS (e.g., Islam, 2014; Islam et al., 2022b):
where the spectral resolutions of DNRED (Red) and DNNIR (Near-infrared) were 0.6491–0.6801 μm and 0.7798–0.8858 μm, respectively (ESA, n.d.). The slope (in degree) of the study area was created using DEM data. The DEM and built-up (in %) data (Table 1) were used in raw format. Density data was taken from an earlier step.
However, in the case of 100 m, 250 m, and 500 m buffer zones, corresponding zones were created using measured PM data location. Then PM data for these buffer zones were generated by clipping the IDW interpolation point data (converted from IDW interpolated raster to point). Further, these PM point data were used as input to extract NDVI, DEM, slope, density, and built-up data, similar to the early steps. To perform MOLSR and PPC, R software was used and summarized in Supplementary Table B3.
Further, GWR was performed similarly to MOLSR using ArcGIS version 10.8. However, for GWR, (i) exact location of PM point data and (ii) 100 m buffer of PM point data was considered. GWR is a widely used method (Hassan M. S. et al., 2022) (Fotheringham et al., 2019; Zhou et al., 2019) to conduct such a study. Note that GWR is an extended version of MOLSR. For more details about how GWR works, see ESRI (ESRI, 2023).
PM2.5 from 13 February 2023 and 10 April 2024 was used to examine the seasonal response. The data was processed and visualized using R in Supplementary Table B5 and box plot (Figures 3, 4). PM2.5 concentrations were presented according to months and seasons. Further, the time series of PM2.5, temperature, and relative humidity were presented against precipitation. The precipitation and relative humidity were downscaled, respectively, by dividing six and three for visualization, which is widely practiced in the scientific community to explore visual relationships (Islam et al., 2022a). The vertical left and right axes were presented by daily precipitation (mm) and PM2.5 concentration (μg/m3). Furthermore, PM2.5 was plotted against temperature, precipitation, and relative humidity with linear regression lines.
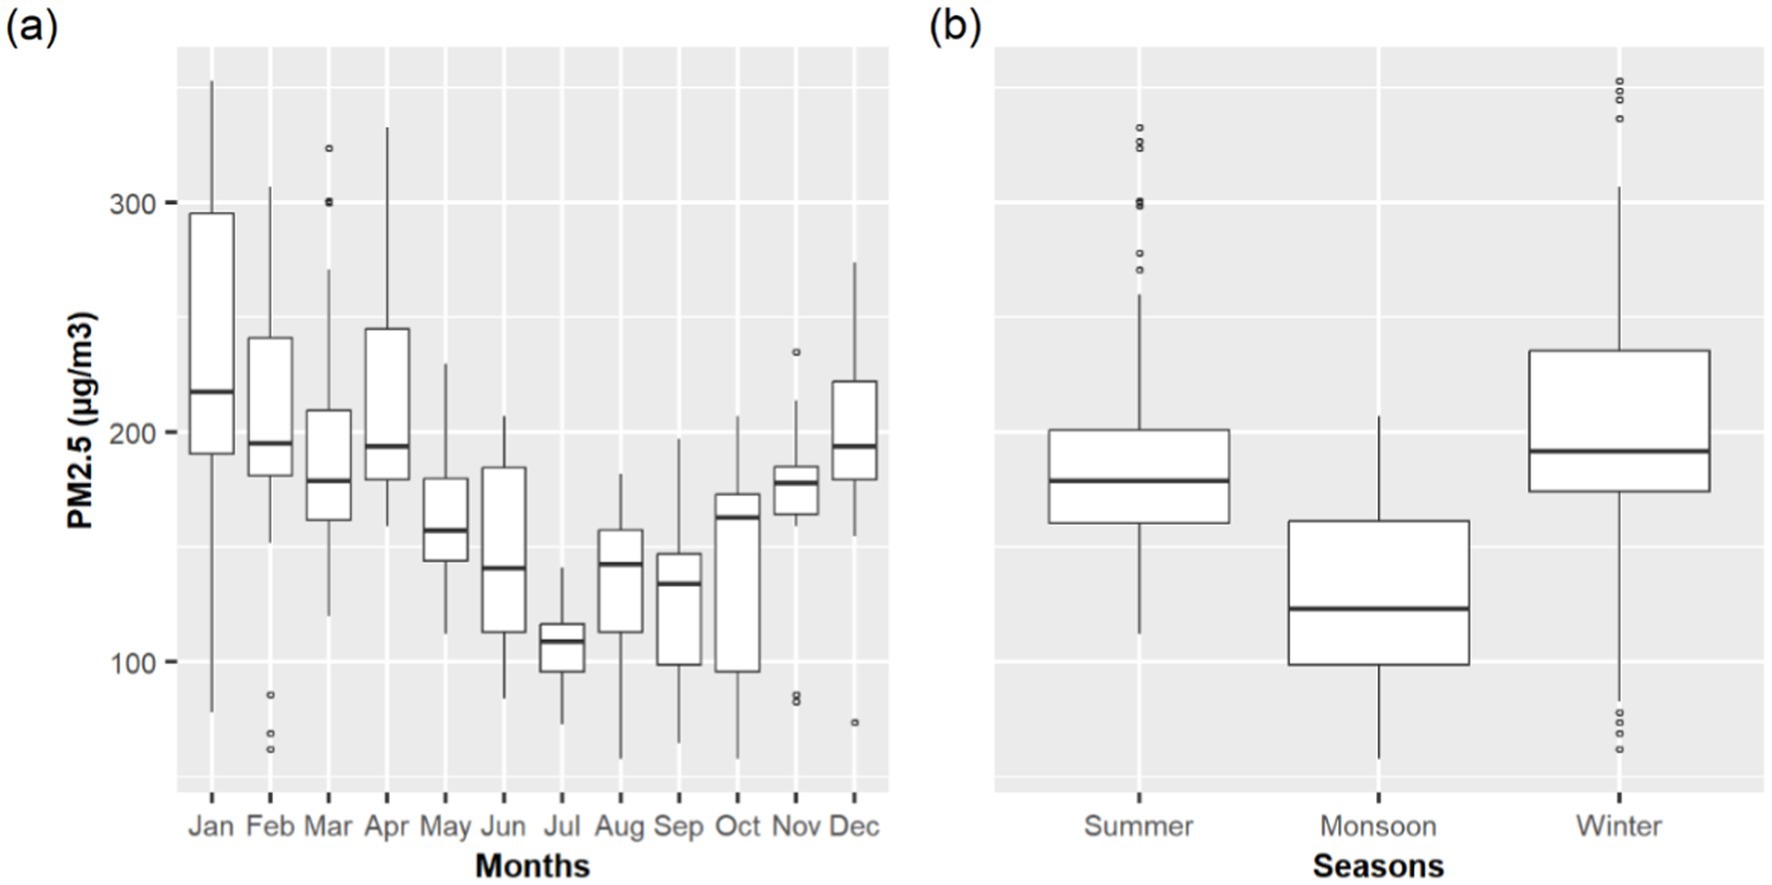
Figure 3. Month- (a) and season- (b) specific PM2.5 concentration (μg/m3) for the study area.
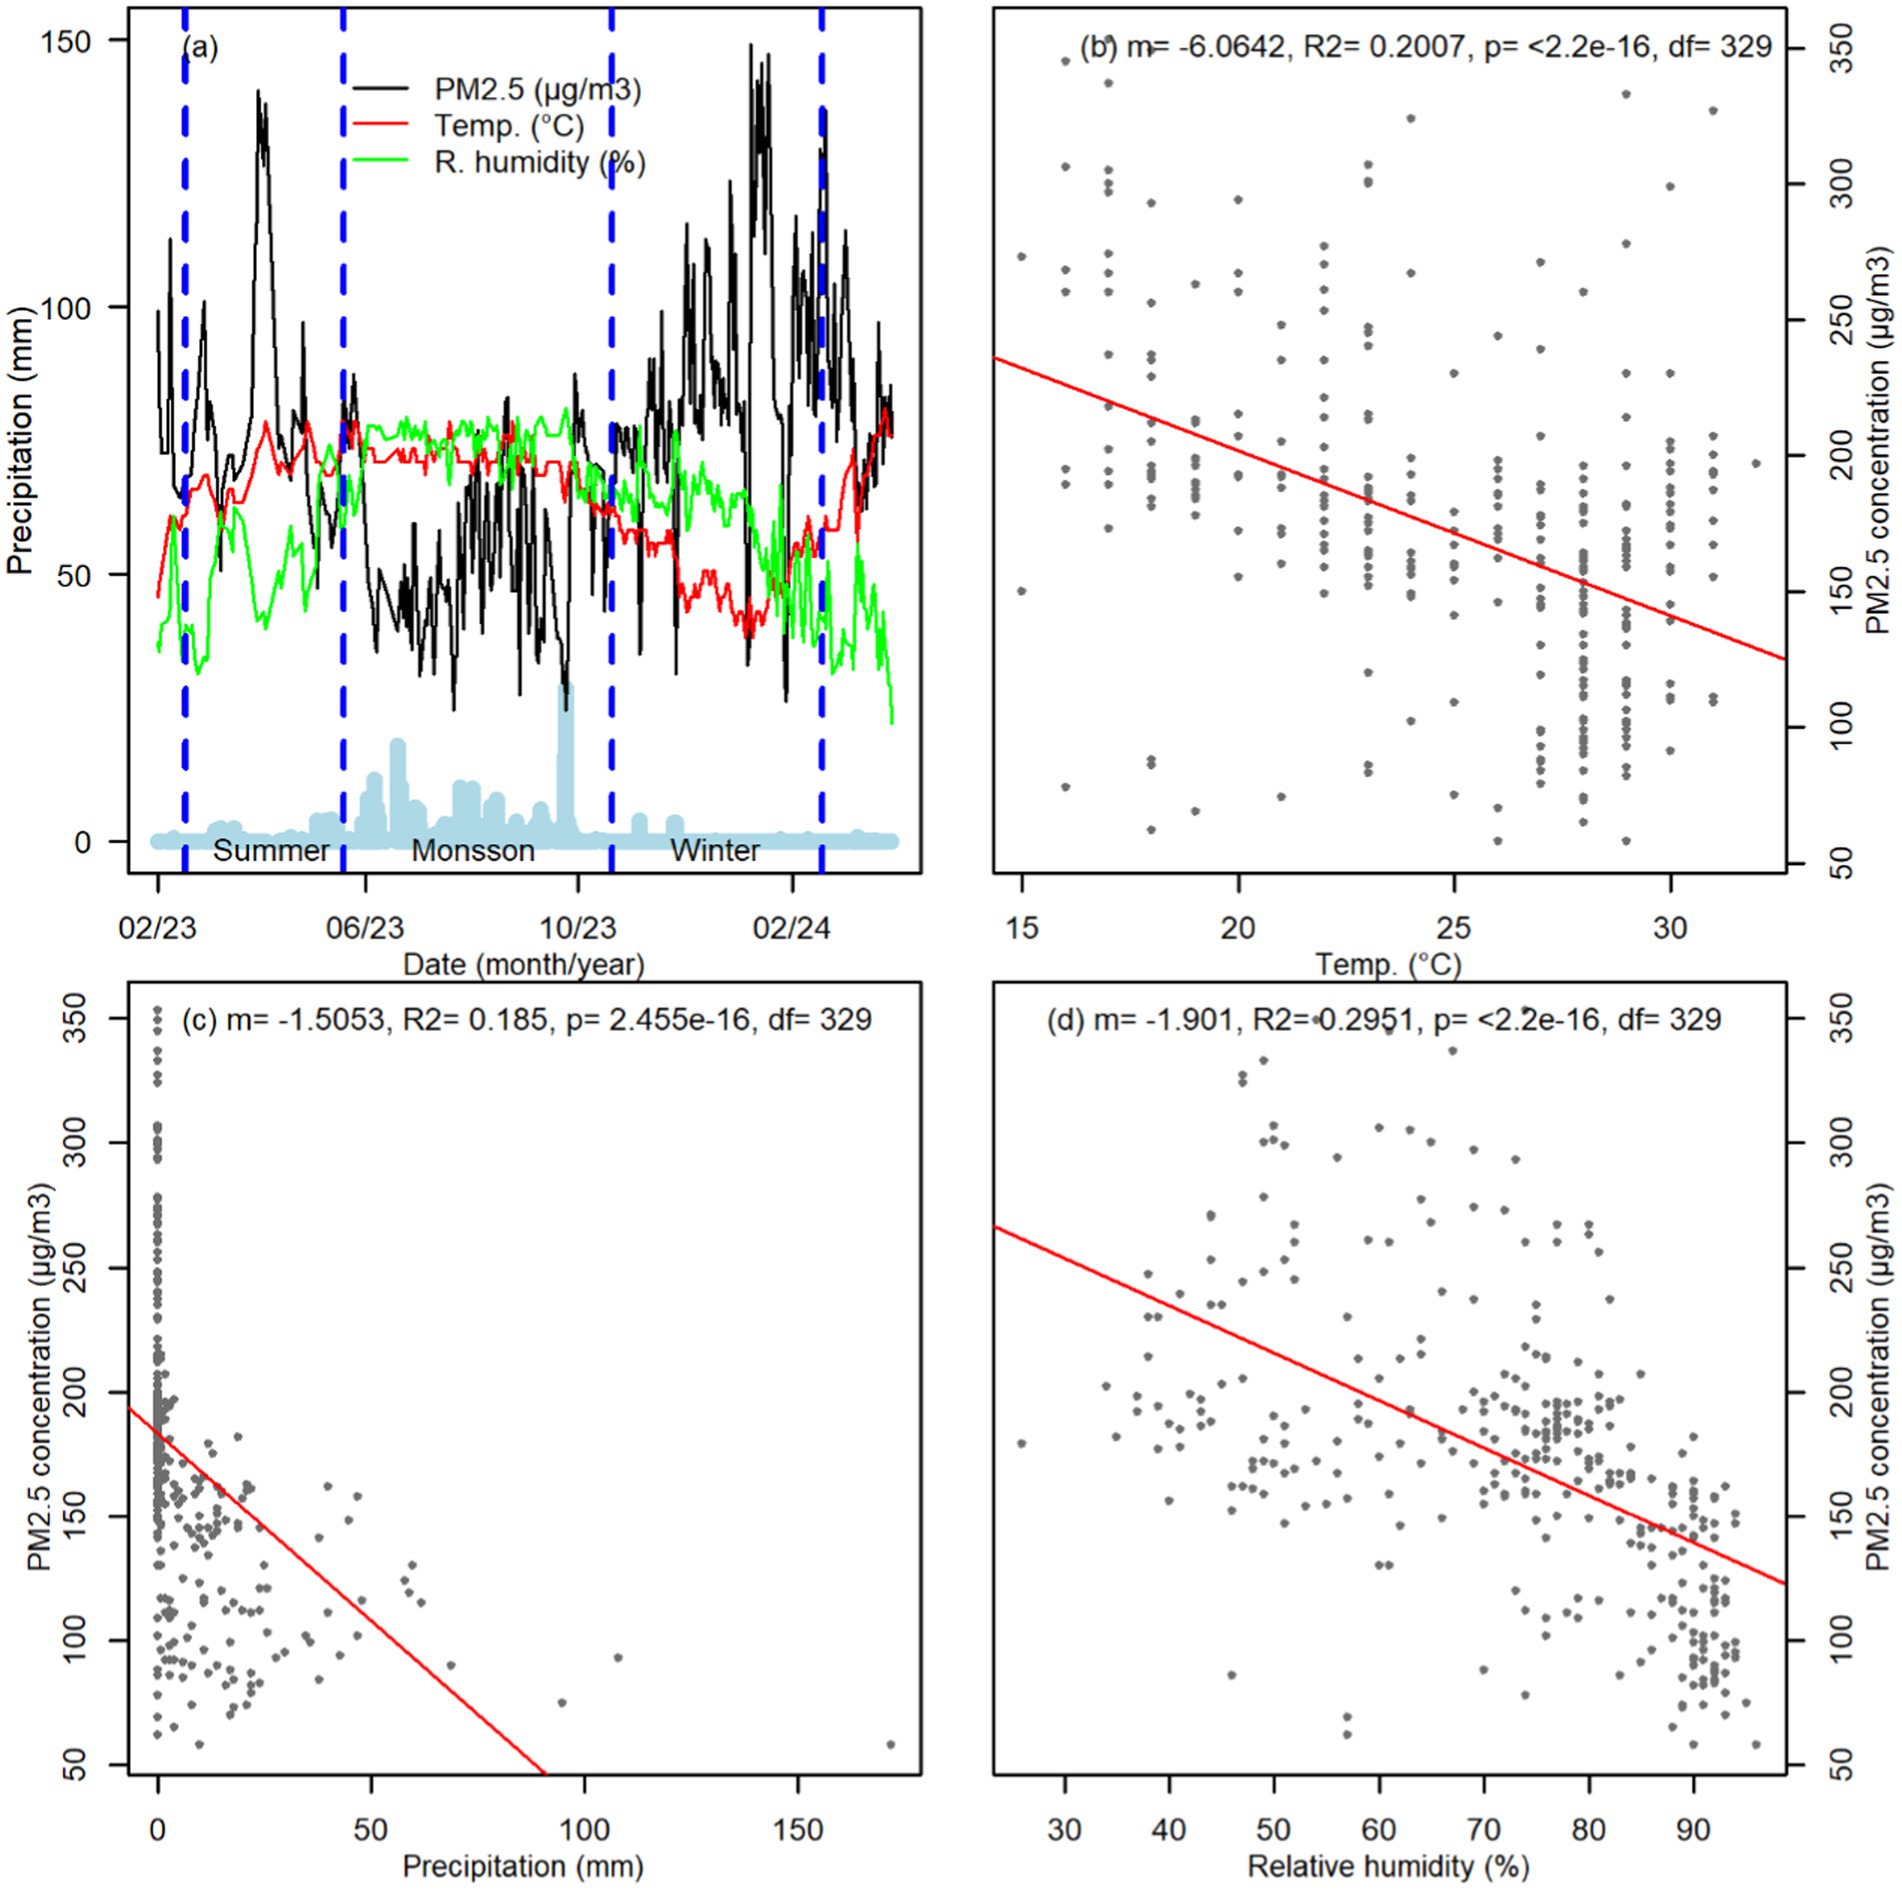
Figure 4. Time series of daily precipitation (mm), temperature (°C), relative humidity (%), and PM2.5 concentration (μg/m3) in the study area. The precipitation (light-blue histogram) is downscaled (divided by 6), and temperatures (×6) and relative humidity (×2) are upscaled for visualization (a). A linear relationship (red lines) between PM2.5 concentration and temperature (b), precipitation (c), and relative humidity (d) is also shown. Inceptor (m), residual square (R2), probability (p), and degree of freedom (df) are also shown (b–d).
Potential sources of PMs in the study area were examined following (i) literature reviews, (ii) in-situ AQ monitoring, (iii) field visits, and (iv) stakeholder consultations. The literature review helped us understand potential sources of PM in urban Bangladesh. In-situ monitored AqQ was also used to identify potential sources and locations of PM in the study area. The locations with high PM concentrations were identified for field observations.
Field observations were then conducted to assess the local environment where high PM concentrations were identified. This involved site visits within the study area. The local environment was surveyed, with factors such as industrial activities, vehicular traffic patterns, construction sites, and other potential PM sources (compared with literature findings) taken note of. These field assessments were carried out at different times of the day to capture potential variations in PM levels and sources.
Finally, stakeholder consultations and interviews were carried out as part of a study to supplement field observations, providing valuable insights into specific PM sources. The stakeholders were selected randomly to ensure a diverse representation of perspectives. The interactions involved engaging with various individuals, including teachers, students, and residents, amongst others. The interviews were open-ended, allowing participants to discuss their experiences, concerns, and insights on PM in the study area. Note that the quantification and ranks of the air pollution sources were not recorded as they were considered to be out of the study scope. A methodological flow chart is presented in Figure 5.
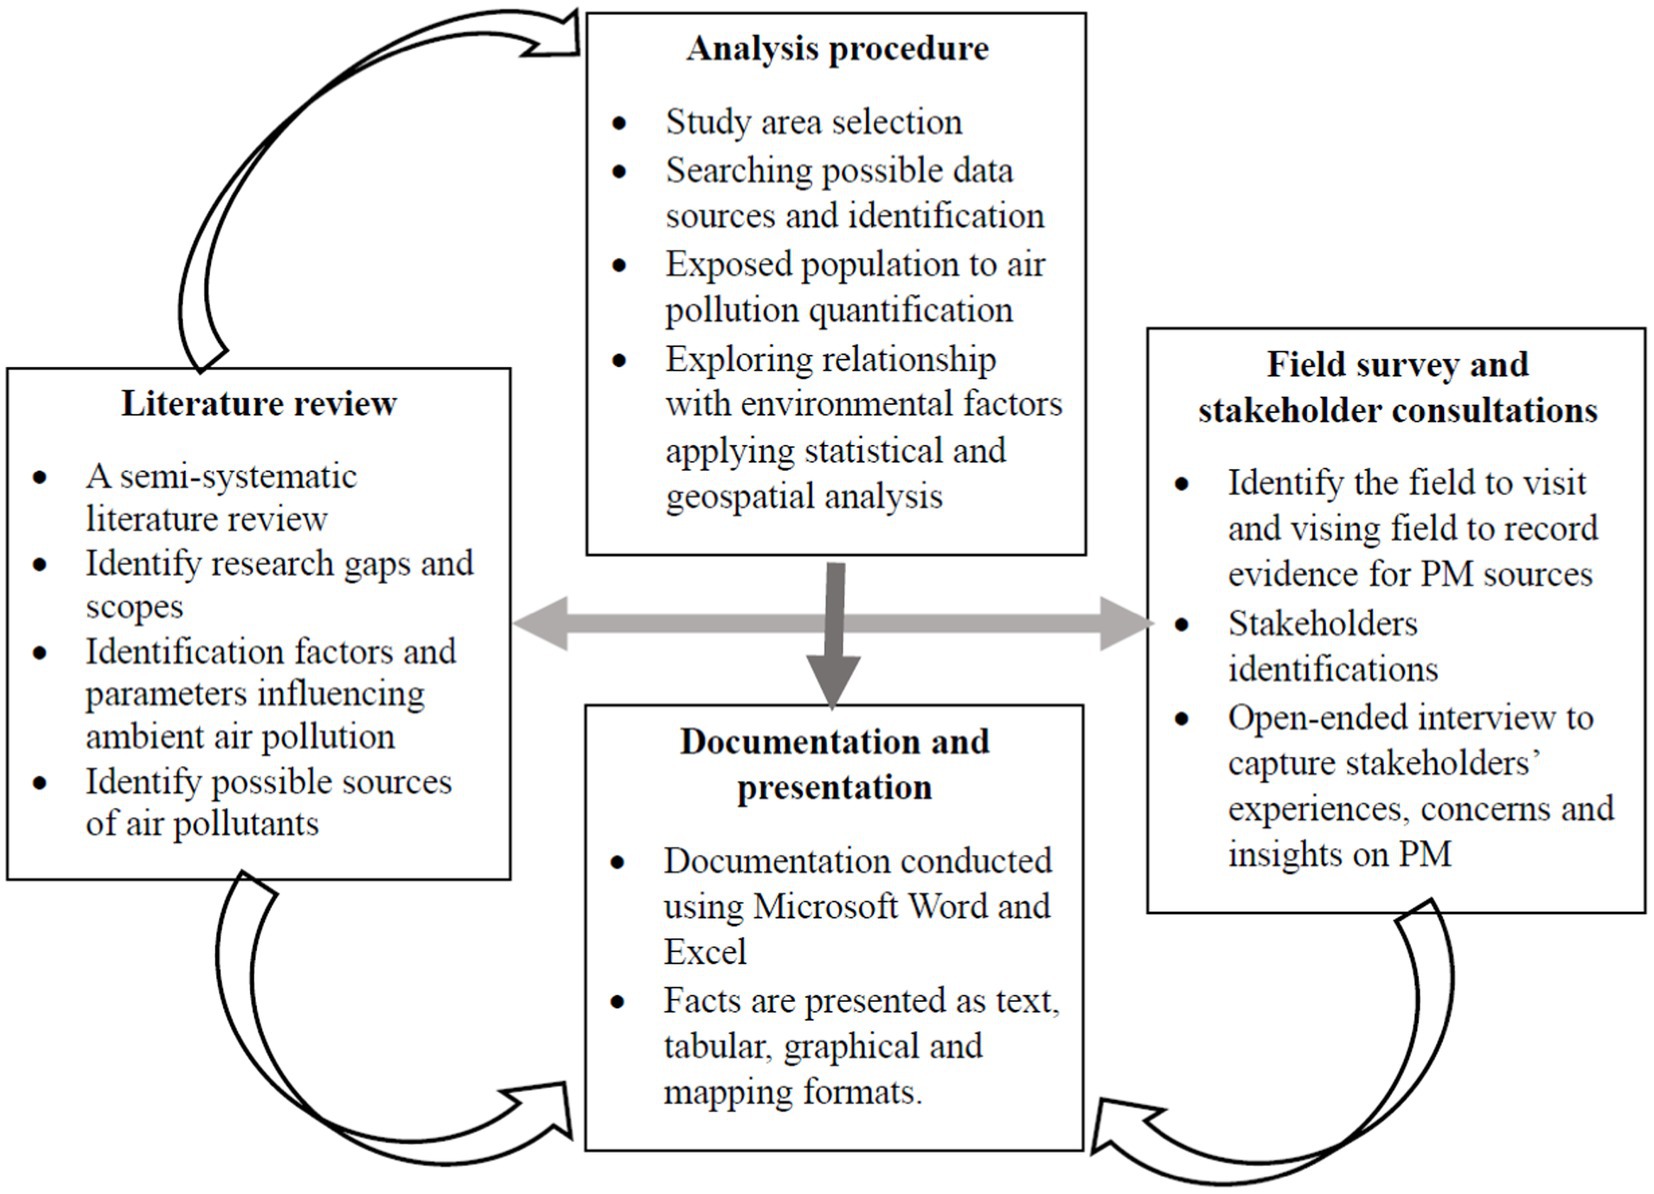
Figure 5. Methodological flow chart of this study.
The PM data measurement reveals a total of 1,008 points at 48 sites on commercial, mixed, residential, and traffic land covers. Of these, 993 points of data were identified as valid since the PM10 concentration of the remaining 15 data points was lower than the PM2.5 concentration, which voids the PM measurement principle. In the measured data, PM2.5 ranges from 50 to 449 μg/m3 with a mean of 118 μg/m3, and PM10 ranges from 59 to 857 μg/m3 with a mean of 200 μg/m3. The minimum concentration of PM2.5 (50 μg/m3) was measured in the morning session (7–9 a.m.) on residential land cover (id 26) on weekends and traffic land cover (id 46) on weekdays. However, the maximum PM2.5 concentration (449 μg/m3) was on mixed land cover (id 43) on weekday evenings (Figure 1). For PM10, minimum concentration (59 μg/m3) was recorded in the morning on commercial (id 2) and traffic (id 36 and 38) land covers on weekdays, however, the maximum concentration was found in the afternoon on mixed land cover (id 19) on weekdays (Figure 1).
According to the land covers, the least (98 ± 46 μg/m3 PM2.5 and 156 ± 89 μg/m3 PM10) and the most (158 ± 99 μg/m3 PM2.5 and 272 ± 207 μg/m3 PM10) PM is generated on residential and mixed types of land covers, respectively (Supplementary Table B1; Figure 6a). Concerning the time of day, PMs levels are at their lowest in the mornings (66 ± 12 μg/m3 PM2.5 and 87 ± 27 μg/m3 PM10), and highest in the afternoons (259 ± 124 μg/m3 PM10) and evenings (151 ± 72 μm/m3 PM2.5). The box plots show that there is no significant variation in PM level between weekdays and weekends (Supplementary Table B1; Figures 6a,b).
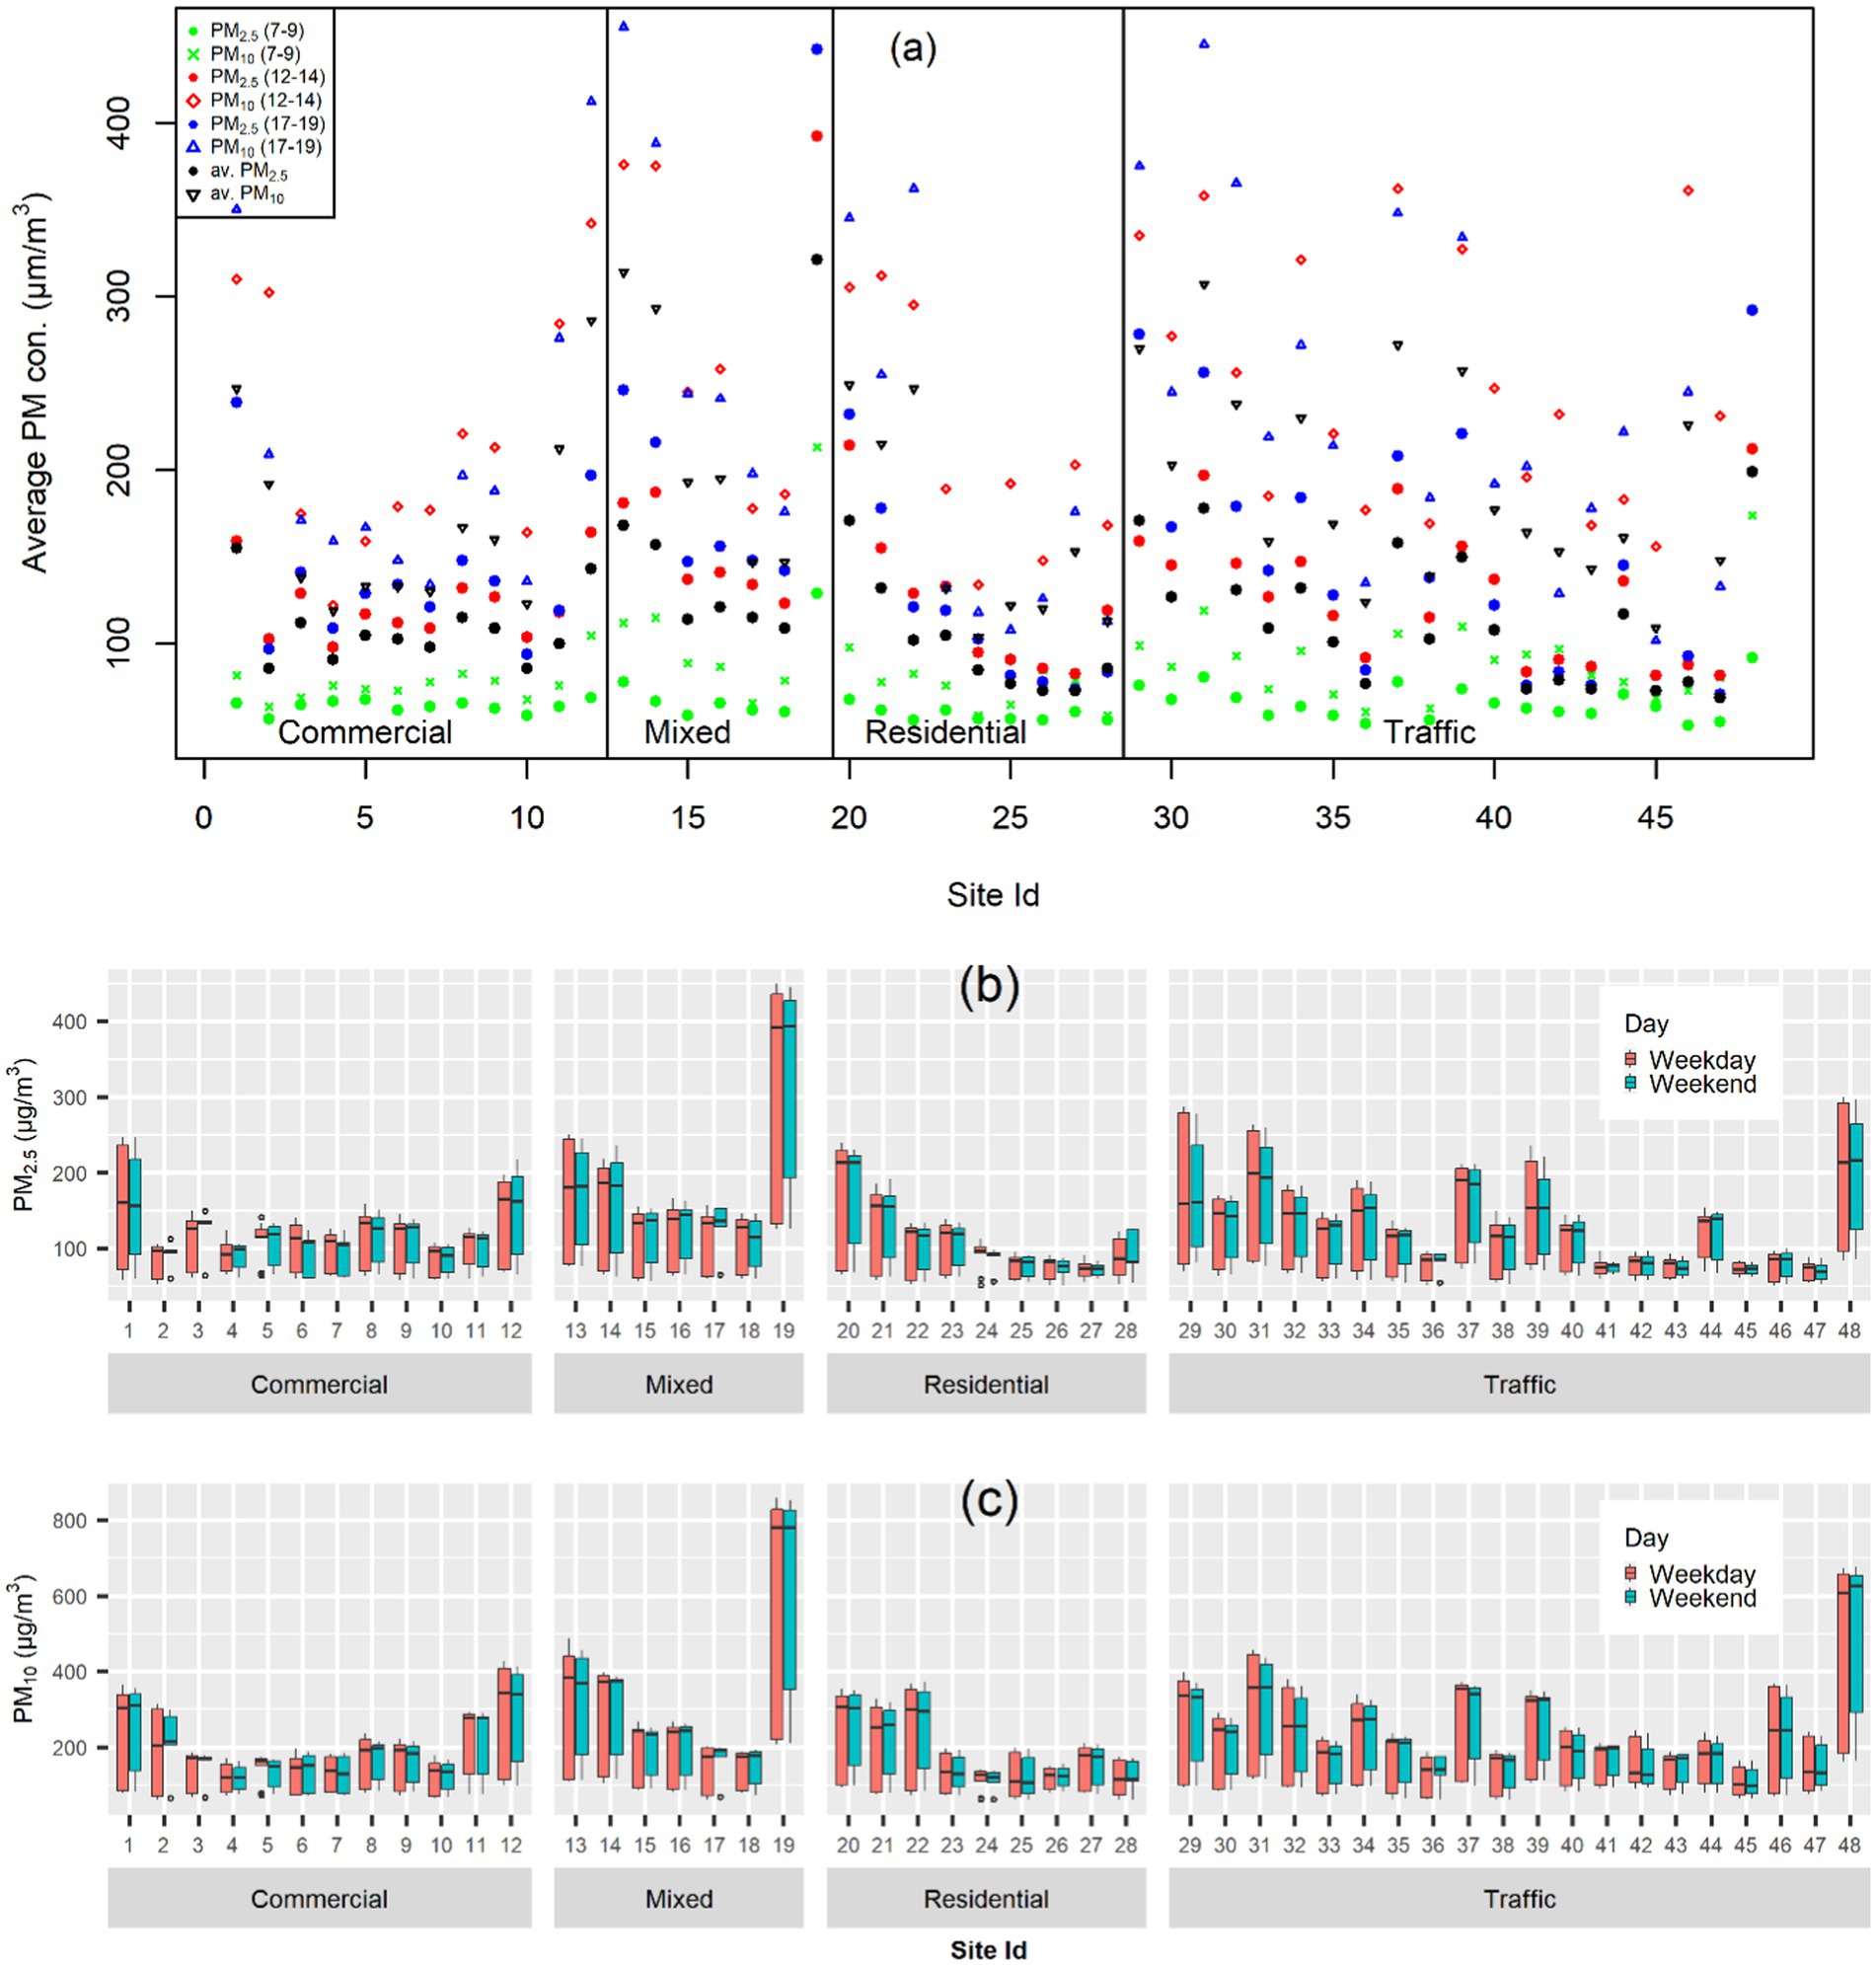
Figure 6. PM concentration (μg/m3) in the study area according to land cover: average PM concentration according to the time of day (a), box plot for PM2.5 (b), and PM10 (c) on weekdays and weekends.
According to the DoE (DoE, 2024), good AQ levels were not found in the study area (Figure 2; Supplementary Table B2). About 43% of the population was exposed to very unhealthy PM10 levels, and 7% were exposed to extremely unhealthy PM10 levels. In the afternoon, approximately 31% of the population was exposed to unhealthy to extremely unhealthy PM2.5 levels, and about 49% were exposed to unhealthy to extremely unhealthy PM10 levels. The situation worsened in the evening, with about 49% of the population exposed to unhealthy to extremely unhealthy PM2.5 levels and approximately 98% exposed to similarly unhealthy PM10 levels (Supplementary Table B2). The central part of the study area experienced the highest levels of pollution (Figure 2).
In this study, the relationship between particulate matter (PM) and factors such as NDVI, population density, slope, DEM, and built-up % are varied across different methods (MOLSR, PPC, and GWR) and sample points (Supplementary Tables B3, B4). PM (both PM2.5 and PM10) showed a negative correlation with NDVI, slope, DEM, and built-up % and a positive correlation with population density at exact point locations (n = 48) and within a 100 m buffer (n = 1,645). In 250 m and 500 m buffer zones, PM (both PM2.5 and PM10) had a negative correlation with NDVI, DEM, and built-up % and a positive correlation with slope and population density. However, within the 250 m buffer zone, PM2.5 had a positive correlation with built-up % (Supplementary Table B3). Both MOLSR and GWR showed the same coefficient for exact point locations (n = 48), but GWR estimated a slightly lower coefficient than MOLSR for the 100 m buffer zone (n = 1,645) (Supplementary Tables B1, B2). The appendix provides detailed statistics and significant relationships between PM and other independent variables (Supplementary Tables B3, B4).
PM’s relationship with all other variables may not be a straightforward linear relationship. For example, in this study, PM’s (for both PM2.5 and PM10) relationship with NDVI was more non-linear (exponential) (Residual standard error: 43.09 for MP2.5 and 90.63 for PM10) than linear (Residual standard error: 42.83 for PM2.5 and 90.63 for PM10) (Figure 7).
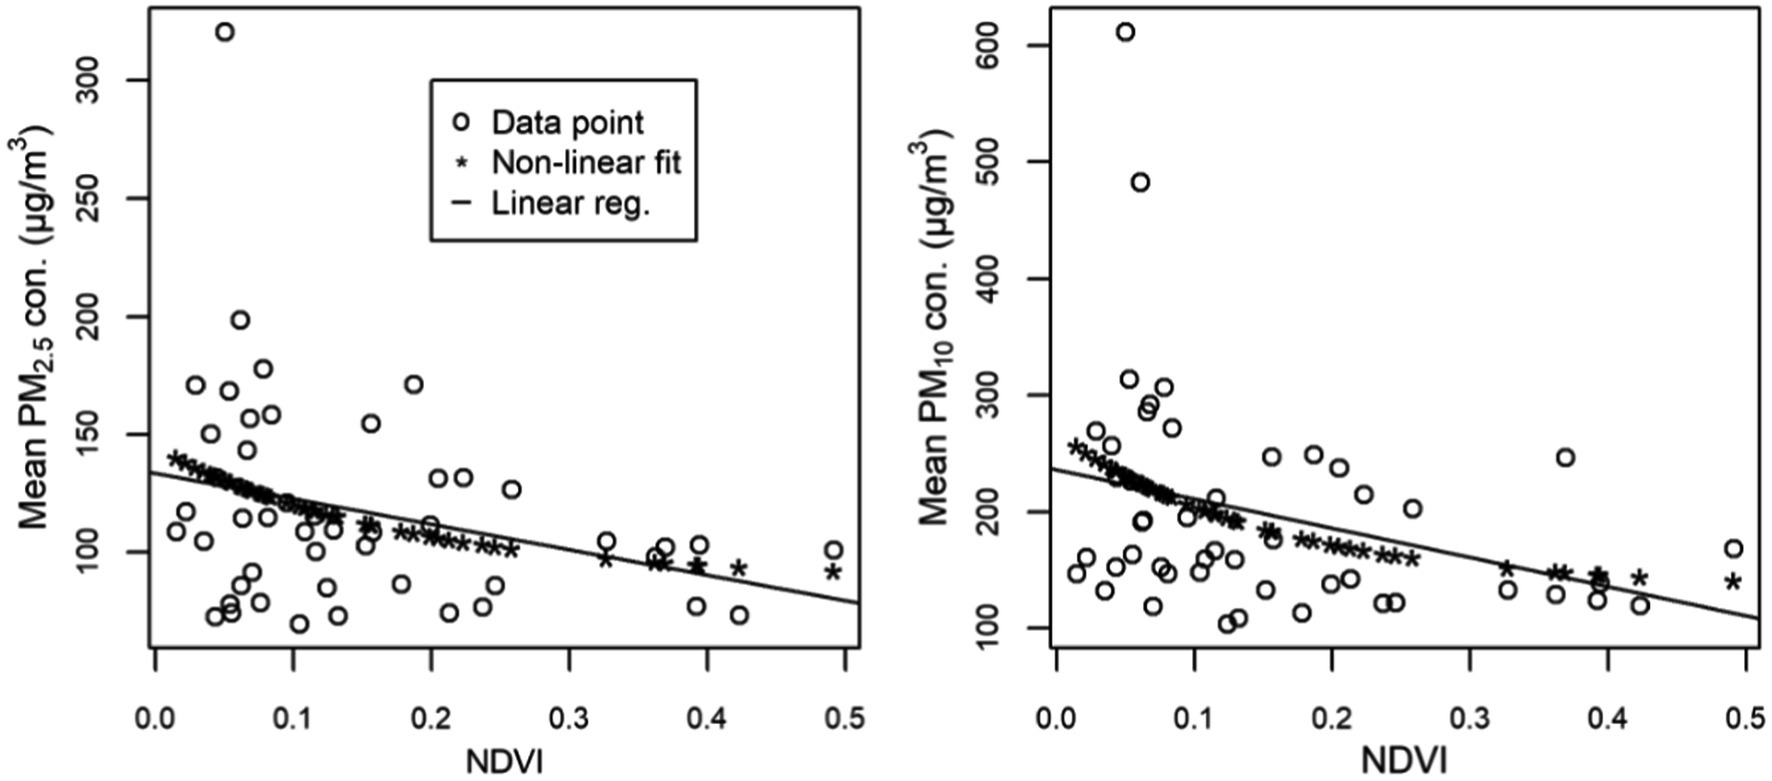
Figure 7. Linear and non-linear relationship between PM and NDVI.
PM2.5 concentration varies widely according to seasonal response (Supplementary Table B5; Figure 3). The highest and lowest concentrations were observed, respectively, in January (237 ± 72 μg/m3) and July (107 ± 17 μg/m3) (Figure 3a; Supplementary Table B5). During June–August, a monthly average high precipitation of 17–20 mm, relative humidity of 85–89%, and temperature of 28–29°C were found. This period is dominated by monsoon (Figure 3b), which showed a negative correlation with PM2.5 concentration.
It was noted that precipitation has the most impact on lowering PM2.5 concentration (Figure 4c). Relative humidity also negatively impacts PM2.5 concentration (Figure 4d). Temperature is the least impacted factor among these three, where an increase of more than 6°C temperature minimizes a one μg/m3 PM2.5 concentration (Figure 4b).
The DoE observed PM2.5 concentration was 166 ± 5 μg/m3 between 27 March and 2 April (precipitation 12 mm and relative humidity 75%). The field-measured concentration was 184 ± 6 μg/m3 at the nearest measurement station, Id 21 (Figure 1), which is ⁓300 m southwest of the DoE station.
The potential sources of PMs and their location in the study area, including brickfields, major construction sites, and other pollution sources, were identified (Figure 8). Each source plays a crucial role in contributing to the observed levels of PM. Brick kilns are significant PM generation sources (Figures 1, 8a). These kilns rely on the combustion of solid fuels such as coal or biomass during the brick-making process, releasing substantial amounts of particulate matter into the atmosphere. The emissions from brick kilns contain various fine particulates and PM, including ash and soot. Ongoing construction and demolition activities generate significant amounts of dust, contributing to the ambient PM concentration. Areas with construction projects, such as those related to high-rise building construction along with road construction and development, serve as hotspots for PM generation due to the release of dust particles during excavation, material handling, and other construction activities. This dust is transported through wind currents by being suspended in the air. Vehicle emissions, including those from diesel and gasoline engines, were major contributors to PM in the study area due to the combustion of fossil fuels releasing particulate matter into the atmosphere. Additionally, brake and tire wear also contribute to PM emissions. The major roads in the study area (Figure 1) are packed with heavy traffic most times of the day, contributing to PM along with black carbon emissions. In commercial areas, burning wood and biomass products for cooking or heating purposes is another significant source of PM (Figure 8d). PM is emitted into the air during biomass combustion. Central Business District (CBD) areas with high population densities often experience elevated PM levels due to anthropogenic activities and urbanization processes. Dust accumulation from vehicular traffic, construction activities, and industrial operations contributes to PM in these areas. Additionally, improper waste management practices in residential and commercial areas contribute to higher PM concentrations (Figure 8f). Inadequate waste disposal and burning facilities lead to PM pollution by releasing smoke-containing PM that can travel longer distances.
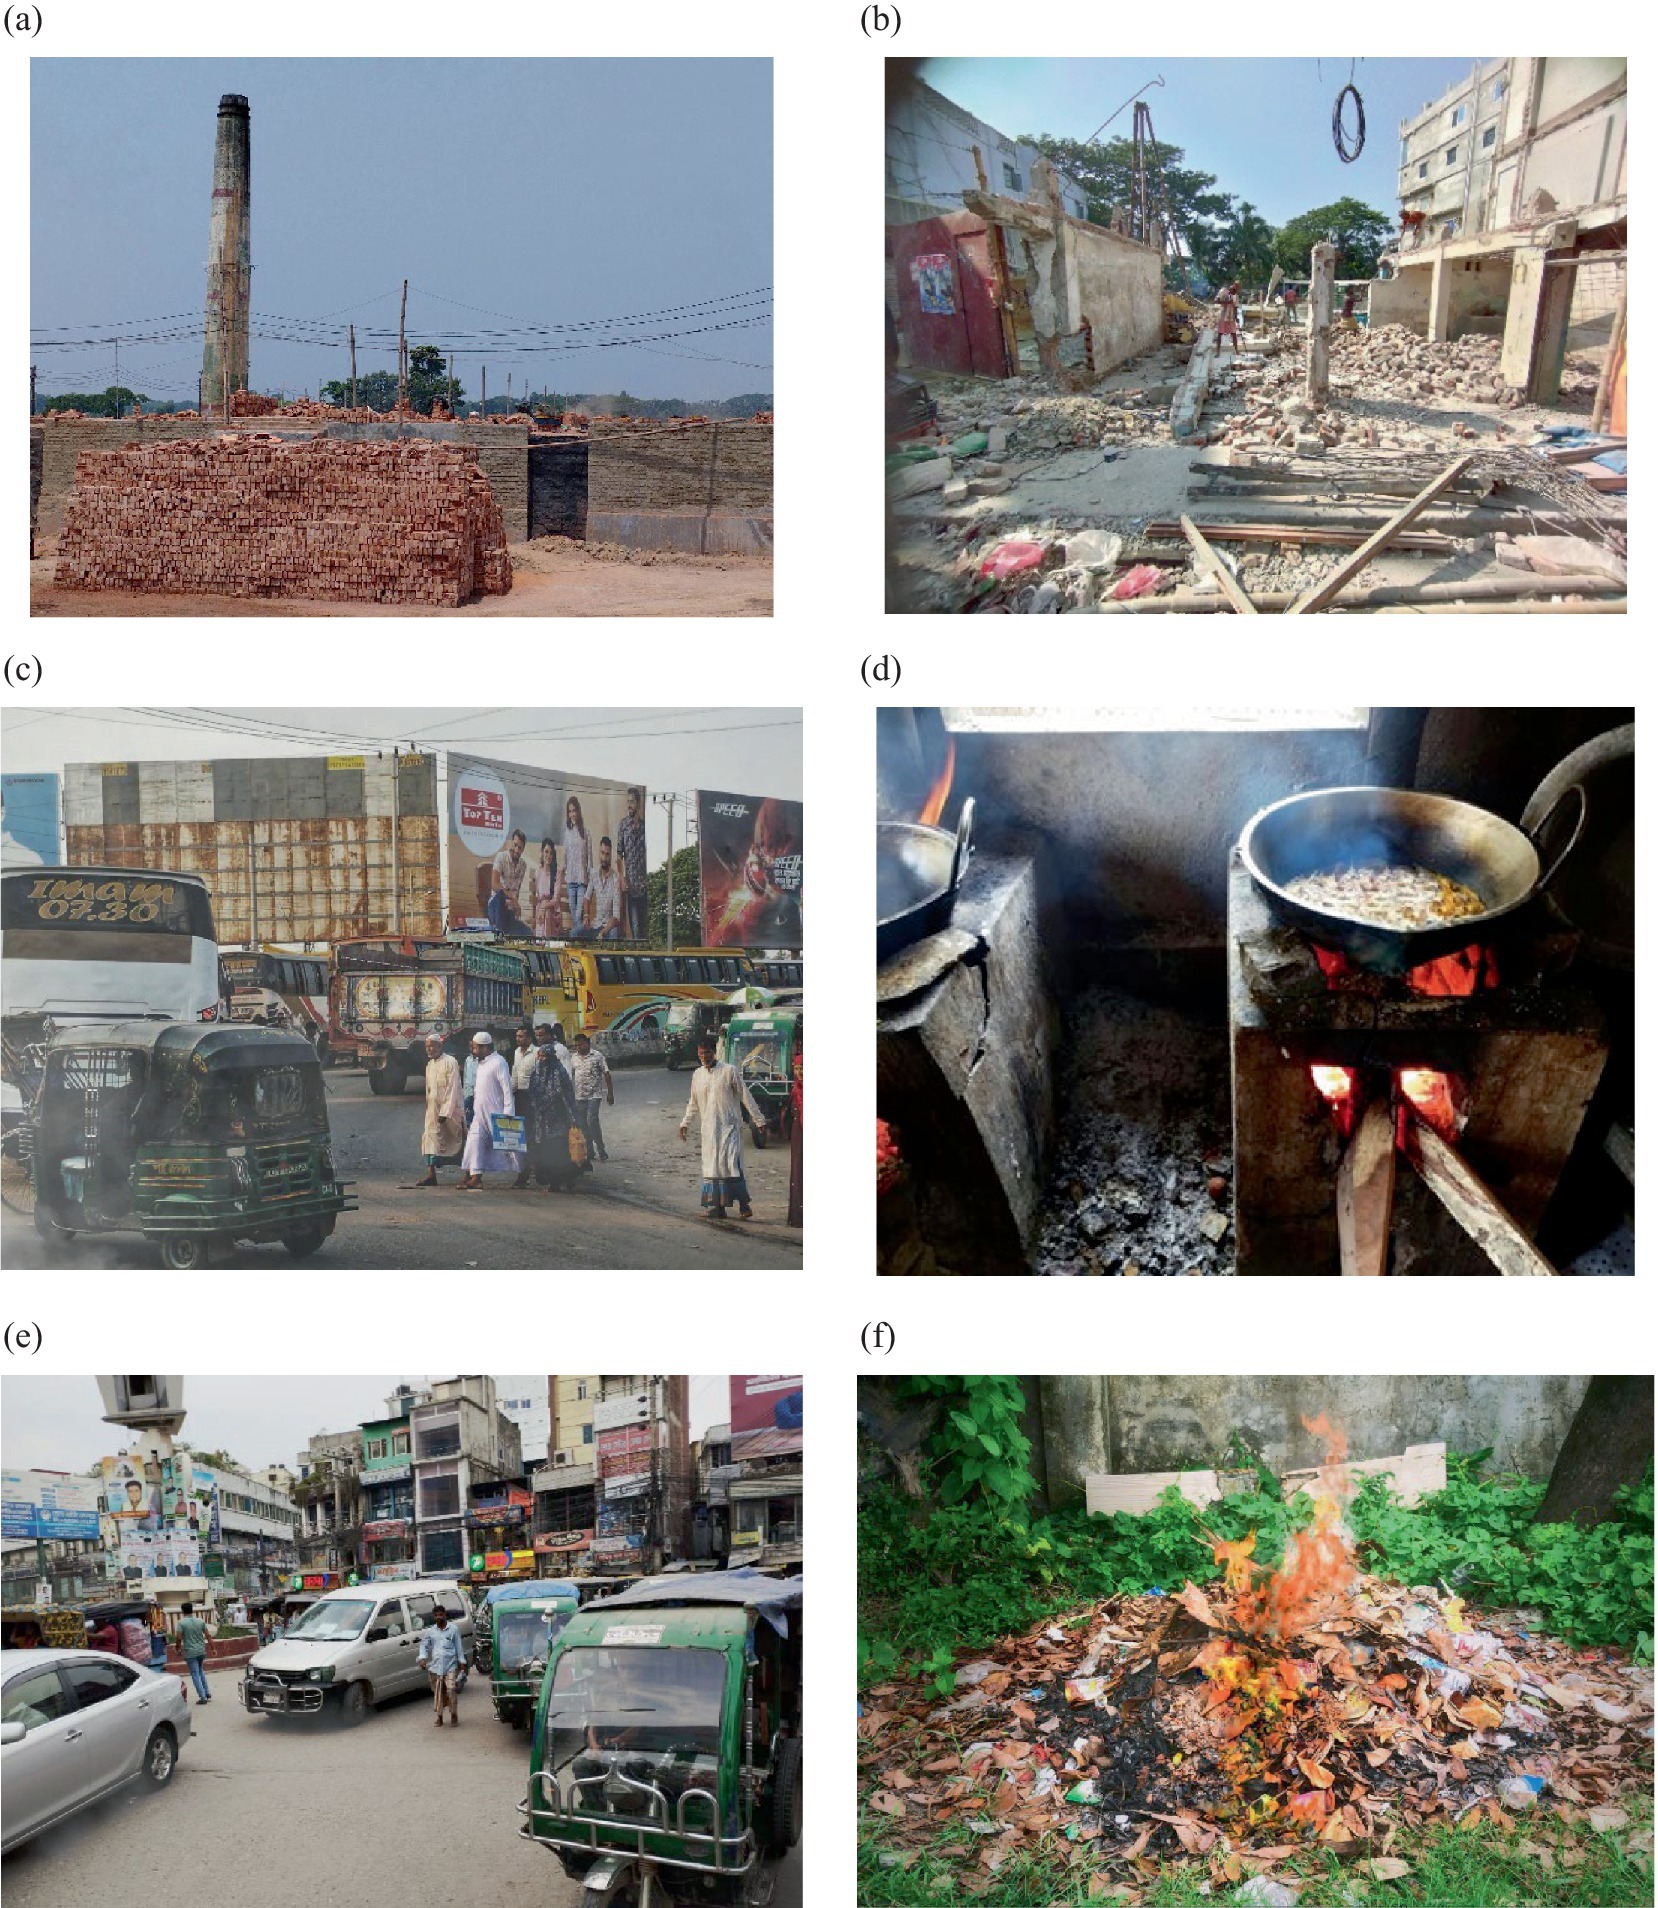
Figure 8. Existing PM sources. (a) Brickfield. (b) Construction sites. (c) Transport vehicles. (d) Burning wood in the commercial area. (e) CBD area with high pop. and dust. (f) Residential communal waste burning. Photo source: author.
The collected query-based data confirmed the consequences and issues involving PM. A college lecturer underscored the significant role of vehicles in producing PM. He said, “Vehicular emissions constitute a primary source of PM.” Moreover, the increased number of private automobiles in Mymensingh city emerges as a crucial contributing factor to MP, exacerbating the environmental challenges experienced by urban areas. A graduate university student highlighted, “PM emissions originated from household activities and construction sites, attributing the responsibility to human actions.” Individuals from grassroots communities provided varied responses due to a lack of in-depth understanding of the topic. Their mixed responses underscore the diverse perspectives and awareness levels within society regarding this environmental issue, highlighting the importance of inclusive education and outreach initiatives to improve public awareness and engagement. A university academic (environment) commented, “Contribution of various factors, such as outdated brick kilns, waste incineration, biomass burning, and massive transportation, highlights the multifaceted nature of PM sources.”
The level of PM2.5 in Sylhet, the cleanest city in the country, is 9.7 times higher than the World Health Organization (WHO)-accepted maximum levels (5 μg/m3 annual mean and 15 μg/m3 24-h mean) (WHO, 2021). Similarly, in the study area, no location met the AQ standards defined by the Department of Environment (DoE, 2024). In fact, the PM levels in the study area are more than 10 times higher than the WHO-recommended levels (WHO, 2021) (Figure 6; Supplementary Table B3). Approximately 98% of the population in the study area experienced unhealthy to extremely unhealthy air conditions for some hours each day (Supplementary Table B3). This reflects the general state of AQ in other cities in Bangladesh (Haque et al., 2024; Hassan M. S. et al., 2022; Jawaa et al., 2024; Khan M. W. et al., 2023; Saju et al., 2023).
In general, PM has a robust relationship with environmental factors (e.g., NDVI, DEM, slope, land surface temperature), meteorological factors (e.g., precipitation, wind speed, and direction), and economic factors (e.g., GDP, income level, poverty level). These findings also correspond to the work of other researchers (Hassan M. S. et al., 2022; Kulsum and Moniruzzaman, 2021). However, due to limited resources and available data sets, only NDVI, DEM, slope, density, and built-up % were considered to explore the relationship with PM. Additionally, the study area was small and relatively flat, limiting variations in land surface temperature, wind speed, and direction. In this study, PM correlated negatively with NDVI (Supplementary Tables B3, B4), similar to other findings (Hassan M. S. et al., 2022; Kulsum and Moniruzzaman, 2021). NDVI indicates green space and the health of green infrastructure (Islam, 2014). High NDVI may suggest more generation of biogenic volatile organic compounds, contributing to O3 generation and PM2.5 levels depending on tree species (Cai et al., 2024). Similarly, PM showed a negative relationship with DEM and slope (Supplementary Tables B3, B4), consistent with other studies (Hassan M. S. et al., 2022), despite limited variation in DEM and slope in the study area. PM is positively related to population density, which is also expected (Budde et al., 2024). Surprisingly, PM had a negative correlation with built-up % (Supplementary Tables B3, B4), contradicting other findings (Lin et al., 2013; Yuan et al., 2019; Halim et al., 2020). Typically, a higher built-up percentage indicates more urban activities and less green-blue space and green infrastructure, therefore generating more PM.
MOLSR considers a multivariable linear regression relationship, and PPC considers a one-to-one relationship. However, the relationship between a dependent and a set of independent variables may not be linear. For example, a nonlinear function may better explain PM’s relationship with NDVI (Figure 3) (Kulsum and Moniruzzaman, 2021). However, GWR is an extended version of MOLSR and considers stationary and local nonstationary (geographic) values of variables (Meik and Lawing, 2017). Therefore, GWR might be the superior method to chart a relationship between a dependent and a set of independent variables since, in geography, everything is related to everything else, but near things are more connected than distant things (Tobler, 1970) and geographical variables exhibit uncontrolled variance (Goodchild, 2004). The GWR model in this study probably gave better fits between dependent (PM) and independent variables (e.g., NDVI, DEM, population density). Coefficients obtained in GWR models tended to be lower and tended more towards zero than the MOLSR model, even though it generated a slightly higher standard error (Supplementary Tables B3, B4). However, use of other statistical and geostatistical models, e.g., structural (e.g., Bose et al., 2023; Roy et al., 2023), linear mixed-effect (e.g., Sajjad Abdollahpour et al., 2024; Venter et al., 2024), or linear mixed-effect with spatial correlation models (e.g., Halla-aho and Lähdesmäki, 2020), may change the amplitude of coefficients and the direction of relationships.
In terms of seasonal variation, PM2.5 concentration showed a negative relationship with ambient temperature (Figure 8b), consistent with other urban environments in Bangladesh (Khan R. H. et al., 2023) but contrary to findings in the USA (Jhun et al., 2015). During the summer, PM2.5 concentration and temperature exhibited a positive relationship, while in the winter, their relationship was negative (Figure 8a). Precipitation is the strongest factor in reducing ambient PM2.5 concentration in Bangladesh (Hassan M. S. et al., 2022) and other parts of the world (Zalakeviciute et al., 2018; Liu et al., 2020). Except for in very hot summers, the climate in Bangladesh is influenced by the monsoon, resulting in heavy rainfall and relatively high temperatures (Figure 4; Supplementary Table B5). Therefore, precipitation may have a more significant impact than temperature on controlling ambient air pollution in the study area and country. In winter, high PM2.5 concentrations are observed at low temperatures (Figure 8b). Relative humidity is positively related to precipitation, equally affecting the reduction of ambient PM2.5 in the study area (Figure 8d). However, relative humidity might have an inverse impact on ambient PM2.5 in traffic environments, as found in Ecuador (Zalakeviciute et al., 2018).
Regarding PM sources, no differences were identified when comparing other urban environments in Bangladesh. Brick production, vehicular emission, biomass burning, improper waste management, and construction activities were found in the study area that have been shown to substantially increase environmental stress (Begum et al., 2013; Begum and Hopke, 2019; Kumar et al., 2024). Brick kilns are widespread in the landscape and are a significant contributor to PM generation in the study area (Figure 1). PM emissions occur due to the combustion of solid fuels during brick-making processes (Ahmad et al., 2022). Vehicular emissions are now a major source of PMs due to the increasing combustion of fossil fuels caused by high traffic volumes (Kumar et al., 2021). The burning of biomass materials (e.g., wood burning for domestic cooking and, in commercial areas, domestic and communal waste burning) releases considerable amounts of PMs into the atmosphere (Figure 8) (Johnston et al., 2019). Ongoing construction and demolition operations substantially contribute to PM concentration, particularly in areas experiencing rapid urbanization and infrastructure development (Muleski et al., 2005). Dust particles released during excavation, material handling, and other construction processes aggravate the problem of declining AQ and lead to localized pollution hotspots (Cheriyan and Choi, 2020). Moreover, Central Business District (CBD) areas, characterized by a large population density and a wide range of human activities, are hotspots for elevated PM concentrations (Menon and Nagendra, 2018). Dust accumulation from vehicular traffic, coupled with industrial activity, leads to elevated PM concentrations in CBD areas. Modelling might help in quantifying ambient PM2.5 concentration with high temporal and spatial resolution (e.g., Suri et al., 2023; Kapoor et al., 2024b). However, not all PMs are locally generated. PMs can stay in the atmosphere for a long period (e.g., hours for PM10, weeks for PM2.5, and even longer for ultra-fine particles) and can travel thousands of km in dry conditions (Ali et al., 2019; Kumar et al., 2024; Pima County, 2024). The lifespan and traveling distance of PMs are highly dependent on particle size, aerodynamics (e.g., wind pressure, speed, and direction), and meteorological conditions (e.g., temperature, precipitation, and humidity). Further, climate change impacts trigger higher PM concentrations, affecting public health (Jacob and Winner, 2009; Doherty et al., 2017; Pienkosz et al., 2019).
Ambient air pollution in urban environments largely varies in relation to city size in countries around the world. Generally, urban air pollution increases in relation to city size; therefore, AQ in mid-sized cities is much better than in large cities and/or megacities in China and South Asia (e.g., in India, Pakistan) (Liu et al., 2018; Tabinda et al., 2020). On the other hand, the AQ in large cities is better in Europe, North America, and Latin America (Han et al., 2016). Therefore, the relationship between urban AQ is determined by urban function and land use rather than city size alone. Even though our case is a mid-sized city, it is one of the fastest-growing cities in South Asia. Therefore, ambient AQ should be identical to the large cities and/or megacities in the country (e.g., Jawaa et al., 2024; Kulsum and Moniruzzaman, 2021; Islam et al., 2020).
The urban areas in Bangladesh have turned into contaminated gas chambers due to severe air pollution which has increased the UHI effect, posing a significant public health risk that we are currently grappling with. However, this is common for mid-sized and fast-growing cities in South Asia, e.g., in India (Roy and Singha, 2020, 2021), Pakistan (Anwar et al., 2021), and Sri Lanka (Ileperuma, 2020). Legislatively, AQ in Bangladesh is protected and promoted by several acts, rules, and regulations by the DoE (DoE, 2024). However, the reality is that air pollution is occurring in the study area and, in general, in urban areas in Bangladesh, similar to particularly fast-growing cities in South Asia. There are big gaps in policy execution in this regard, e.g., managing traffic effectively, controlling pollution-generating backdated unfit vehicles, and instating environmentally friendly brick production (Figure 8). Poor practice in plan execution is another example, e.g., Dhaka city’s green space reduced from 56% in 1989 to ~2% in 2020 (Khan M. W. et al., 2023). Many authors have suggested nature-based solutions, e.g., ensuring enough green infrastructure by promoting proper land use planning, which would have mitigate UPI (e.g., Ren et al., 2023; Wu and Chen, 2023) and UHI (e.g., Peng and Jim, 2015; Zardo et al., 2017), improve urban flood management (Jarden et al., 2016) and biodiversity and ecological services (e.g., Capotorti et al., 2019; Nakamura et al., 2020), and positively affect physical and mental health (e.g., Felappi et al., 2020; Moreira et al., 2022). However, studying such issues is out of the scope of this research. Therefore, immediate actions have to be taken to secure the interest of public health. Decisive, transparent, and accountable leadership, with strong collaboration and cooperation amongst public-private organizations and agencies, is a pre-requisite to governing the actions for controlling air pollution.
Data-driven urban public policy can help to promote a clean urban environment. This study adopted a geospatial approach to studying ambient AQ in a mid-sized Bangladeshi city. This empirical case study estimates the population’s exposure to air pollution using high spatial resolution empirical in-situ observations to identify possible sources of air pollution and explore a relationship with other environmental and demographic factors, including seasonal variation. Findings suggested that, even though the AQ in Bangladesh cities should be protected to ensure public health, it is being polluted due to increased anthropogenic factors that in turn are facilitated by poor land use planning. Snapshot measurements in the field campaign between 27 March and 02 April 2023 confirm that
• more than 50% of people in the study area are exposed to PM10 in very unhealthy conditions,
• generated PM2.5 level is about eight times higher than the daily average of WHO’s AQG,
• mixed land covers (commercial and traffic) and traffic generate the highest level of PM (158 ± 99 μg/m3 PM2.5 and 272 ± 206 μg/m3 PM10 for mixed land covers and 118 ± 59 μg/m3 PM2.5 and 212 ± 128 μg/m3 PM10 for traffic),
• weekdays and weekends do not have a significant difference in PM generation, and
• measured PM2.5 concentration (184 ± 6 μg/m3) is slightly higher than what was observed by the DoE (166 ± 5 μg/m3).
The observations and data analysis on air pollution between 13 February 2023 to 10 April 2024 suggest that
• PM2.5 generation is the highest and lowest in January (237 ± 72 μg/m3) and July (107 ± 17 μg/m3), respectively,
• during monsoon season (June–October), PM2.5 generation (130 ± 36 μg/m3) is much lower than in summer (March–May, 184 ± 29 μg/m3) and winter (November–February, 203 ± 57 μg/m3) due to the effect of precipitation, and
• the effect of precipitation on PM2.5 is greater than the effect of temperature.
Some avoidable limitations were not possible to overcome. The PM measurements were taken over seven consecutive days with three time slots each day, making it a snapshot measurement. Continuous measurements over a 2-h slot would likely provide a more representative dataset. Additionally, in-situ observation only reflects conditions during the dry winter season. For seasonal analysis, the study relied on observed data from a fixed station operated by the DoE.
Prevention of and protection from pollution sources is necessary. As mentioned earlier, the environment and, therefore, AQ in Bangladesh is protected by legislative acts and regulations, however, they need to be properly enforced. Many people do not know that little actions could protect from the worsening of AQ, e.g., burning residential and communal waste. Private, non-governmental, and community-based organizations could increase awareness in this regard. To control air pollution, the researchers suggested a package of activities for short-, mid-, and long-term measures (Hossain et al., 2023; Khan R. H. et al., 2023). However, many of these suggestions do not align with local experiences and knowledge, logistics capabilities, and cultural orientation. Intensive research is required for practical policy suggestions, their implications, and the realities posed by their implementation, which is out of the scope of this study.
The original contributions presented in the study are included in the article/Supplementary material, further inquiries can be directed to the corresponding author.
The requirement of ethical approval was waived by oral consents were taken during the interview. For the studies involving humans because it was anonymous but consents were taken from the respondents. The studies were conducted in accordance with the local legislation and institutional requirements. Written informed consent for participation was not required from the participants or the participants’ legal guardians/next of kin because oral consents were taken during the interview. Written informed consent was obtained from the individual(s) for the publication of any potentially identifiable images or data included in this article.
MH: Data curation, Formal analysis, Investigation, Methodology, Writing – original draft, Writing – review & editing. MI: Data curation, Formal analysis, Investigation, Methodology, Writing – original draft, Writing – review & editing, Conceptualization, Resources, Software, Supervision, Validation, Visualization. SS: Supervision, Writing – review & editing, Investigation. SH: Writing – review & editing. MAI: Writing – review & editing. MF: Writing – review & editing. MZH: Writing – review & editing.
The author(s) declare that no financial support was received for the research and/or publication of this article.
The authors would like to thank all respondents who took part in the interview. The editor and the reviewers are also thankfully acknowledged for their constructive valuable comments.
The authors declare that the research was conducted in the absence of any commercial or financial relationships that could be construed as a potential conflict of interest.
All claims expressed in this article are solely those of the authors and do not necessarily represent those of their affiliated organizations, or those of the publisher, the editors and the reviewers. Any product that may be evaluated in this article, or claim that may be made by its manufacturer, is not guaranteed or endorsed by the publisher.
The Supplementary material for this article can be found online at: https://www.frontiersin.org/articles/10.3389/frsc.2025.1497768/full#supplementary-material
Agarwal, M., and Tandon, A. (2010). Modeling of the urban heat island in the form of mesoscale wind and of its effect on air pollution dispersal. Appl. Math. Model. 34, 2520–2530. doi: 10.1016/j.apm.2009.11.016
Ahmad, H. R., Farooqi, Z. U. R., Sabir, M., and Sardar, M. F. (2022). “Brick kilns: types, emissions, environmental impacts, and their remedial measures” in Biodiversity, conservation and sustainability in Asia. eds. M. Öztürk, S. M. Khan, V. Altay, R. Efe, D. Egamberdieva, and F. O. Khassanov (Cham: Springer International Publishing), 945–958.
Airveda (2022). Product catalogue: Airveda PM2.5 PM10 monitor. Available online at: https://www.airveda.com/airveda-pm-air-quality-monitor(Accessed November 7, 2024).
Ali, M. U., Liu, G., Yousaf, B., Ullah, H., Abbas, Q., and Munir, M. A. M. (2019). A systematic review on global pollution status of particulate matter-associated potential toxic elements and health perspectives in urban environment. Environ. Geochem. Health 41, 1131–1162. doi: 10.1007/s10653-018-0203-z
Alipour, D., and Dia, H. (2023). A systematic review of the role of land use, transport, and energy-environment integration in shaping sustainable cities. Sustain. For. 15, 1–29. doi: 10.3390/su15086447
Anwar, M. N., Shabbir, M., Tahir, E., Iftikhar, M., Saif, H., Tahir, A., et al. (2021). Emerging challenges of air pollution and particulate matter in China, India, and Pakistan and mitigating solutions. J. Hazard. Mater. 416, 1–12. doi: 10.1016/j.jhazmat.2021.125851
Ashikuzzaman, M., Ahmed, S., Hasan, J., and Aktar, S. (2021). University students’ perception on CITY’S air quality: a tale of three cities in Bangladesh. PLAN PLUS 11, 1–16. doi: 10.54470/planplus.v11i1.1
Banglapedia (2023). National Encyclopedia of Bangladesh. Available online at: https://en.banglapedia.org/index.php/Season (Accessed December 31, 2023).
Begum, B. A., and Hopke, P. K. (2019). Identification of sources from chemical characterization of fine particulate matter and assessment of ambient air quality in Dhaka, Bangladesh. Aerosol Air Qual. Res. 19, 118–128. doi: 10.4209/aaqr.2017.12.0604
Begum, B. A., Hopke, P. K., and Markwitz, A. (2013). Air pollution by fine particulate matter in Bangladesh. Atmos. Pollut. Res. 4, 75–86. doi: 10.5094/APR.2013.008
Bose, A., Basak, D., Roy, S., Chowdhury, I. R., Abdo, H. G., Aldagheiri, M., et al. (2023). Evaluation of urban sustainability through perceived importance, performance, satisfaction and loyalty: an integrated IPA–SEM-based modelling approach. Sustain. For. 15, 1–22. doi: 10.3390/su15129788
Budde, S., Agrawal, S., and Chani, P. S. (2024). Utilising GIS for studying urban entropy, population dynamics, and ventilation disparity: a case study of changing land use, land cover, and socially vulnerable hotspots in Hyderabad, India. Phys. Chem. Earth 136:103748. doi: 10.1016/j.pce.2024.103748
Cai, B., Cheng, H., and Kang, T. (2024). Establishing the emission inventory of biogenic volatile organic compounds and quantifying their contributions to O3 and PM2.5 in the Beijing-Tianjin-Hebei region. Atmos. Environ. 318, 1–13. doi: 10.1016/j.atmosenv.2023.120206
Capotorti, G., Alós Ortí, M. M., Copiz, R., Fusaro, L., Mollo, B., Salvatori, E., et al. (2019). Biodiversity and ecosystem services in urban green infrastructure planning: a case study from the metropolitan area of Rome (Italy). Urban For. Urban Green. 37, 87–96. doi: 10.1016/j.ufug.2017.12.014
Cheriyan, D., and Choi, J. (2020). A review of research on particulate matter pollution in the construction industry. J. Clean. Prod. 254, 1–15. doi: 10.1016/j.jclepro.2020.120077
Copernicus (2024). Copernicus open access hub. Available online at: https://scihub.copernicus.eu/ (Accessed January 1, 2024).
DoE (2024). Department of Environment, government of the People’s Republic of Bangladesh. Available at: http://www.doe.gov.bd/ (Accessed January 1, 2024).
Doherty, R. M., Heal, M. R., and O’Connor, F. M. (2017). Climate change impacts on human health over Europe through its effect on air quality. Environ. Health 16, 33–76. doi: 10.1186/s12940-017-0325-2
ESA (n.d.). Resolution and swath, spatial and spectral resolutions. Available online at: https://sentinels.copernicus.eu/web/sentinel/missions/sentinel-2/instrument-payload/resolution-and-swath (Accessed December 31, 2023).
ESRI (2023). Hot spot analysis (Getis-Ord Gi*) (spatial statistics). Available online at: https://pro.arcgis.com/en/pro-app/latest/tool-reference/spatial-statistics/hot-spot-analysis.htm (Accessed August 12, 2023).
Farr, T. G., Rosen, P. A., Caro, E., Crippen, R., Duren, R., Hensley, S., et al. (2007). The shuttle radar topography mission. Rev. Geophys. 45, 1–33. doi: 10.1029/2005RG000183
Felappi, J. F., Sommer, J. H., Falkenberg, T., Terlau, W., and Kötter, T. (2020). Green infrastructure through the lens of “one health”: a systematic review and integrative framework uncovering synergies and trade-offs between mental health and wildlife support in cities. Sci. Total Environ. 748, 1–12. doi: 10.1016/j.scitotenv.2020.141589
Florczyk, A., Corban, C., Ehrlich, D., Carneiro Freire, S., Kemper, T., Maffenini, L., et al. (2019). GHSL Data Package 2019, EUR 29788 EN, JRC117104. Luxembourg: doi: 10.2760/290498
Fotheringham, A. S., Yue, H., and Li, Z. (2019). Examining the influences of air quality in China’s cities using multi-scale geographically weighted regression. Trans. GIS 23, 1444–1464. doi: 10.1111/tgis.12580
Goodchild, M. F. (2004). The validity and usefulness of laws in geographic information science and geography. J. Assoc. Am. Geogr. 94, 300–303.
Haddaway, N. R., Grainger, M. J., and Gray, C. T. (2022). Citationchaser: a tool for transparent and efficient forward and backward citation chasing in systematic searching. Res. Synth. Methods 13, 533–545. doi: 10.1002/jrsm.1563
Halim, N. D. A., Latif, M. T., Mohamed, A. F., Maulud, K. N. A., Idrus, S., Azhari, A., et al. (2020). Spatial assessment of land use impact on air quality in mega urban regions, Malaysia. Sustain Cities Soc. 63:102436. doi: 10.1016/j.scs.2020.102436
Halla-aho, V., and Lähdesmäki, H. (2020). LuxUS: DNA methylation analysis using generalized linear mixed model with spatial correlation. Bioinformatics 36, 4535–4543. doi: 10.1093/bioinformatics/btaa539
Han, L., Zhou, W., Pickett, S. T. A., Li, W., and Li, L. (2016). An optimum city size? The scaling relationship for urban population and fine particulate (PM 2.5) concentration. Environ. Pollut. 208, 96–101. doi: 10.1016/j.envpol.2015.08.039
Haque, R., Hanson, M., Shariful Islam, M., Akter, N., Moniruzzaman, M., Alam, M. J., et al. (2024). Pivotal relationship between heavy metal, PM2.5 exposures and tuberculosis in Bangladeshi children: protocol paper of a case–control study. BMJ Open 14, 1–6. doi: 10.1136/bmjopen-2023-075010
Hassan, M. S., Islam, M. T., and Bhuiya, M. A. H. (2022). Assessment of health impacts of particulate matter (PM2.5) on the vulnerable groups in the central part of Bangladesh. Res. Sq. doi: 10.21203/rs.3.rs-1358115/v1
Hassan, S., Islam, T., and Bhuiyan, M. A. H. (2022). Effects of economic and environmental factors on particulate matter (PM2.5) in the middle parts of Bangladesh. Water Air Soil Pollut. 233, 1–20. doi: 10.1007/s11270-022-05819-y
HEI (2020). State of global air 2020. Boston. Available online at: https://www.stateofglobalair.org/resources/report/state-global-air-report-2020 (Accessed May 9, 2024).
Hossain, M. M., Hassan, M. R., and Miah, M. A. (2023). GIS-based spatial mapping of the atmospheric particulate pollutant (PM2.5 and PM10) at Mymensingh City Corporation areas of Bangladesh. J. Mater. Environ. Sci. 14, 1007–1036. Available at: https://www.jmaterenvironsci.com/Document/vol14/vol14_N9/JMES-2023-14091-Hossain.pdf (Accessed December 31, 2023).
Ileperuma, O. A. (2020). Review of air pollution studies in Sri Lanka. Ceylon J. Sci. 49, 1–15. doi: 10.4038/cjs.v49i3.7773
Islam, M. T. (2014). Vegetation changes of Sundarbans based on Landsat imagery analysis between 1975 and 2006. Landsc. Environ. 8, 1–9. Available at: https://ojs.lib.unideb.hu/landsenv/article/view/2304 (Accessed December 31, 2023).
Islam, M. T., Bradley, A. A., Sowter, A., Andersen, R., Marshall, C., Long, M., et al. (2022a). Potential use of APSIS-InSAR measures of the range of vertical surface motion to improve hazard assessment of peat landslides. Mires Peat 28, 1–19. doi: 10.19189/MaP.2021.OMB.StA.2356
Islam, M. T., Hemstock, S. L., Charlesworth, M., and Kabir, K. H. (2022b). Assessment of the domestic energy use impacts of unplanned refugee settlements on the forest ecology of Cox’s bazar, Bangladesh. Ecocycles 8, 86–98. doi: 10.19040/ecocycles.v8i1.225
Islam, M. M., Sharmin, M., and Ahmed, F. (2020). Predicting air quality of Dhaka and Sylhet divisions in Bangladesh: a time series modeling approach. Air Qual. Atmos. Health 13, 607–615. doi: 10.1007/s11869-020-00823-9
Jacob, D. J., and Winner, D. A. (2009). Effect of climate change on air quality. Atmos. Environ. 43, 51–63. doi: 10.1016/j.atmosenv.2008.09.051
Jarden, K. M., Jefferson, A. J., and Grieser, J. M. (2016). Assessing the effects of catchment-scale urban green infrastructure retrofits on hydrograph characteristics. Hydrol. Process. 30, 1536–1550. doi: 10.1002/hyp.10736
Jawaa, Z. T., Biswas, K. F., Khan, M. F., and Moniruzzaman, M. (2024). Source and respiratory deposition of trace elements in PM2.5 at an urban location in Dhaka city. Heliyon 10, 1–16. doi: 10.1016/j.heliyon.2024.e25420
Jhun, I., Coull, B. A., Schwartz, J., Hubbell, B., and Koutrakis, P. (2015). The impact of weather changes on air quality and health in the United States in 1994–2012. Environ. Res. Lett. 10, 1–12. doi: 10.1088/1748-9326/10/8/084009
Johnston, H. J., Mueller, W., Steinle, S., Vardoulakis, S., Tantrakarnapa, K., Loh, M., et al. (2019). How harmful is particulate matter emitted from biomass burning? A Thailand perspective. Curr. Pollut. Rep. 5, 353–377. doi: 10.1007/s40726-019-00125-4
Kapoor, N. R., Kumar, A., Kumar, A., Arora, H. C., and Kumar, A. (2024a). “A review of economic burden and negative health impacts due to air pollution” in Diseases and health consequences of air pollution. eds. M. H. Dehghani, R. R. Karri, T. Vera, and S. K. M. Hassan (New York: Academic Press), 257–273.
Kapoor, N. R., Kumar, A., Kumar, A., Kumar, A., and Arora, H. C. (2024b). Air quality modeling for smart cities of India by nature inspired AI—A sustainable approach. Adv. Comput. 135, 129–154. doi: 10.1016/bs.adcom.2023.11.012
Khan, M. W., Hossain, M. S., and Alam, M. (2023). GIS-based analysis to identify the distribution and accessibility of urban green space in Dhaka Metropolitan City, Bangladesh. J. Geogr. Inf. Syst. 15, 35–52. doi: 10.4236/jgis.2023.151003
Khan, R. H., Quayyum, Z., and Rahman, S. (2023). A quantitative assessment of natural and anthropogenic effects on the occurrence of high air pollution loading in Dhaka and neighboring cities and health consequences. Environ. Monit. Assess. 195, 1–19. doi: 10.1007/s10661-023-12046-3
Khuda, K. E. (2020). Air pollution in the Capital City of Bangladesh: its causes and impacts on human health. Pollution 6, 737–750. doi: 10.22059/poll.2020.300588.775
Kulsum, U., and Moniruzzaman, M. (2021). Quantifying the relationship of vegetation cover and air pollution: a spatiotemporal analysis of PM2.5 and NDVI in greater Dhaka, Bangladesh. Jagannath Univ. J. Sci. 7, 54–63.
Kumar, G. P., Lekhana, P., Tejaswi, M., and Chandrakala, S. (2021). Effects of vehicular emissions on the urban environment-a state of the art. Mater Today Proc. 45, 6314–6320. doi: 10.1016/j.matpr.2020.10.739
Kumar, S., Saha, N., Mohana, A. A., Hasan, M. S., Rahman, M. S., Elmes, M., et al. (2024). Atmospheric particulate matter and associated trace elements pollution in Bangladesh: a comparative study with global megacities. Water Air Soil Pollut. 235, 1–29. doi: 10.1007/s11270-024-07021-8
Li, H., Meier, F., Lee, X., Chakraborty, T., Liu, J., Schaap, M., et al. (2018). Interaction between urban heat island and urban pollution island during summer in Berlin. Sci. Total Environ. 636, 818–828. doi: 10.1016/j.scitotenv.2018.04.254
Lin, G., Fu, J., Jiang, D., Hu, W., Dong, D., Huang, Y., et al. (2013). Spatio-temporal variation of PM2.5 concentrations and their relationship with geographic and socioeconomic factors in China. Int. J. Environ. Res. Public Health 11, 173–186. doi: 10.3390/ijerph110100173
Liu, Z., Shen, L., Yan, C., Du, J., Li, Y., and Zhao, H. (2020). Analysis of the influence of precipitation and wind on PM2.5 and PM10 in the atmosphere. Adv. Meteorol. 2020, 1–13. doi: 10.1155/2020/5039613
Liu, Y., Wu, J., Yu, D., and Ma, Q. (2018). The relationship between urban form and air pollution depends on seasonality and city size. Environ. Sci. Pollut. Res. 25, 15554–15567. doi: 10.1007/s11356-018-1743-6
Majumder, S., Roy, S., Bose, A., and Chowdhury, I. R. (2023). Multiscale GIS based-model to assess urban social vulnerability and associated risk: evidence from 146 urban centers of eastern India. Sustain. Cities Soc. 96, 1–21. doi: 10.1016/j.scs.2023.104692
Meik, J. M., and Lawing, A. M. (2017). “Considerations and pitfalls in the spatial analysis of water quality data and its association with hydraulic fracturing” in Advances in chemical pollution, environmental management and protection. eds. K. A. Schug and Z. L. Hildenbrand (Amsterdam: Elsevier), 227–256.
Menon, J. S., and Nagendra, S. M. S. (2018). Personal exposure to fine particulate matter concentrations in central business district of a tropical coastal city. J. Air Waste Manage. Assoc. 68, 415–429. doi: 10.1080/10962247.2017.1407837
Mondol, M. A., Hossain, M., Sultana, S., Islam, M. A., and Biswas, P. (2020). Impact of air pollution in Mymensingh city of Bangladesh: focusing peoples’ perception. Progress. Agric. 31, 154–163.
Moreira, T. C. L., Polize, J. L., Brito, M., da Silva Filho, D. F., Chiavegato Filho, A. D. P., Viana, M. C., et al. (2022). Assessing the impact of urban environment and green infrastructure on mental health: results from the São Paulo megacity mental health survey. J. Expo. Sci. Environ. Epidemiol. 32, 205–212. doi: 10.1038/s41370-021-00349-x
Muleski, G. E., Cowherd, C., and Kinsey, J. S. (2005). Particulate emissions from construction activities. J. Air Waste Manage. Assoc. 55, 772–783. doi: 10.1080/10473289.2005.10464669
Nakamura, F., Ishiyama, N., Yamanaka, S., Higa, M., Akasaka, T., Kobayashi, Y., et al. (2020). Adaptation to climate change and conservation of biodiversity using green infrastructure. River Res. Appl. 36, 921–933. doi: 10.1002/rra.3576
NASA (2024). The power project: Multiple data access options. Available online at: https://power.larc.nasa.gov/ (Accessed April 17, 2024).
Peng, L., and Jim, C. (2015). Seasonal and diurnal thermal performance of a subtropical extensive green roof: the impacts of background weather parameters. Sustain. For. 7, 11098–11113. doi: 10.3390/su70811098
Pienkosz, B. D., Saari, R. K., Monier, E., and Garcia-Menendez, F. (2019). Natural variability in projections of climate change impacts on fine particulate matter pollution. Earths Future 7, 762–770. doi: 10.1029/2019EF001195
Pima County (2024). Particulate matter information. Available online at: https://www.pima.gov/504/Particulate-Matter-Information (Accessed May 9, 2024).
QGIS.org (2024). QGIS 3.38. Geographic information system. Available online at: http://www.qgis.org (Accessed October 6, 2023).
Ren, W., Zhao, J., and Ma, X. (2023). Analysis of spatial differentiation and air quality impact of green space landscape in Xi’an, China. Int. J. Environ. Sci. Technol. 20, 12449–12463. doi: 10.1007/s13762-023-04844-6
Roy, S., Basak, D., Bose, A., and Chowdhury, I. R. (2023). Citizens’ perception towards landfill exposure and its associated health effects: a PLS-SEM based modeling approach. Environ. Monit. Assess. 195, 1–19. doi: 10.1007/s10661-022-10722-4
Roy, S., and Singha, N. (2020). Analysis of ambient air quality based on exceedance factor and air quality index for Siliguri City, West Bengal. Curr. World Environ. 15, 236–246. doi: 10.12944/CWE.15.2.11
Roy, S., and Singha, N. (2021). Reduction in concentration of PM2.5 in India’s top most polluted cities: with special reference to post-lockdown period. Air Qual. Atmos. Health 14, 715–723. doi: 10.1007/s11869-020-00974-9
Sajjad Abdollahpour, S., Qi, M., Le, H. T. K., and Hankey, S. (2024). Urban spatial structure and air quality in the United States: evidence from a longitudinal approach. Environ. Int. 190, 1–10. doi: 10.1016/j.envint.2024.108871
Saju, J. A., Bari, Q. H., Mohiuddin, K. A. B. M., and Strezov, V. (2023). Measurement of ambient particulate matter (PM1.0, PM2.5 and PM10) in Khulna City of Bangladesh and their implications for human health. Environ. Syst. Res. 12, 1–17. doi: 10.1186/s40068-023-00327-2
Sarrat, C., Lemonsu, A., Masson, V., and Guedalia, A. D. (2006). Impact of urban heat island on regional atmospheric pollution. Atmos. Environ. 40, 1743–1758. doi: 10.1016/j.atmosenv.2005.11.037
Sikder, S. K., Nagarajan, M., Kar, S., and Koetter, T. (2018). A geospatial approach of downscaling urban energy consumption density in mega-city Dhaka, Bangladesh. Urban Clim. 26, 10–30. doi: 10.1016/j.uclim.2018.08.004
Snyder, H. (2019). Literature review as a research methodology: an overview and guidelines. J. Bus. Res. 104, 333–339. doi: 10.1016/j.jbusres.2019.07.039
Suri, R. S., Jain, A. K., Kapoor, N. R., Kumar, A., Arora, H. C., Kumar, K., et al. (2023). Air quality prediction - a study using neural network based approach. J. Soft Comput. Civ. Eng. 7–1, 93–113. doi: 10.22115/scce.2022.352017.1488
Tabinda, A. B., Ali, H., Yasar, A., Rasheed, R., Mahmood, A., and Iqbal, A. (2020). Comparative assessment of ambient air quality of major cities of Pakistan. Mapan 35, 25–32. doi: 10.1007/s12647-019-00335-7
Tobler, W. Y. (1970). A computer movie simulating urban growth in the Detroit region. Econ. Geogr. 46, 234–240. doi: 10.2307/143141
Ulpiani, G. (2021). On the linkage between urban heat island and urban pollution island: three-decade literature review towards a conceptual framework. Sci. Total Environ. 751, 1–31. doi: 10.1016/j.scitotenv.2020.141727
Venter, Z. S., Hassani, A., Stange, E., Schneider, P., and Castell, N. (2024). Reassessing the role of urban green space in air pollution control. Proc. Natl. Acad. Sci. 121, 1–9. doi: 10.1073/pnas.2306200121
Weather and Climate (2023). Mymensingh climate summary. Available online at: https://weatherandclimate.com/bangladesh/dhaka/mymensingh#:~:text=Mymensingh%20Climate%20Summary&text=The%20district’s%20yearly%20temperature%20is,%25%20of%20the%20time)%20annually (Accessed December 31, 2023).
WHO (2021). WHO global air quality guidelines. Particulate matter (PM2.5 and PM10), ozone, nitrogen dioxide, sulfur dioxide and carbon monoxide. Geneva. Available online at: https://iris.who.int/bitstream/handle/10665/345329/9789240034228-eng.pdf (Accessed January 1, 2024).
WHO (2022). Ambient (outdoor) air pollution. Available online at: https://www.who.int/news-room/fact-sheets/detail/ambient-(outdoor)-air-quality-and-health (Accessed January 10, 2024).
WHO (2024a). Air pollution. Available online at: https://www.who.int/health-topics/air-pollution#tab=tab_1 (Accessed January 10, 2024).
WHO (2024b). Air quality and health: Sustainable development goals & air pollution. Available online at: https://www.who.int/teams/environment-climate-change-and-health/air-quality-and-health/policy-progress/sustainable-development-goals-air-pollution (Accessed January 10, 2024).
WHO (2024c). Air quality and health: Types of pollutants. Available online at: https://www.who.int/teams/environment-climate-change-and-health/air-quality-and-health/health-impacts/types-of-pollutants (Accessed January 10, 2024).
World Bank (2022). High air pollution level is creating physical and mental health hazards in Bangladesh: World Bank. Available online at: https://www.worldbank.org/en/news/press-release/2022/12/03/high-air-pollution-level-is-creating-physical-and-mental-health-hazards-in-bangladesh-world-bank (Accessed January 10, 2024).
Wu, L., and Chen, C. (2023). Does pattern matter? Exploring the pathways and effects of urban green space on promoting life satisfaction through reducing air pollution. Urban For. Urban Green. 82, 1–10. doi: 10.1016/j.ufug.2023.127890
Yuan, M., Song, Y., Huang, Y., Shen, H., and Li, T. (2019). Exploring the association between the built environment and remotely sensed PM2.5 concentrations in urban areas. J. Clean. Prod. 220, 1014–1023. doi: 10.1016/j.jclepro.2019.02.236
Zalakeviciute, R., López-Villada, J., and Rybarczyk, Y. (2018). Contrasted effects of relative humidity and precipitation on urban PM2.5 pollution in high elevation urban areas. Sustain. For. 10, 1–21. doi: 10.3390/su10062064
Zardo, L., Geneletti, D., Pérez-Soba, M., and Van Eupen, M. (2017). Estimating the cooling capacity of green infrastructures to support urban planning. Ecosyst. Serv. 26, 225–235. doi: 10.1016/j.ecoser.2017.06.016
Zhou, Q., Wang, C., and Fang, S. (2019). Application of geographically weighted regression (GWR) in the analysis of the cause of haze pollution in China. Atmos. Pollut. Res. 10, 835–846. doi: 10.1016/j.apr.2018.12.012
Keywords: urban land use, urban heat Island, ambient air quality, particulate matter, spatial analysis, public health risk
Citation: Hossain MM, Islam MT, Sikder SK, Hemstock SL, Islam MA, Faruquee MH and Hossain MZ (2025) The urban environment in South Asia: studying the ambient air quality in a mid-sized city in Bangladesh. Front. Sustain. Cities. 7:1497768. doi: 10.3389/frsc.2025.1497768
Edited by:
Nishant Raj Kapoor, Academy of Scientific and Innovative Research (AcSIR), IndiaReviewed by:
Muhammad Rashidul Hasan, Chittagong University of Engineering and Technology, BangladeshCopyright © 2025 Hossain, Islam, Sikder, Hemstock, Islam, Faruquee and Hossain. This is an open-access article distributed under the terms of the Creative Commons Attribution License (CC BY). The use, distribution or reproduction in other forums is permitted, provided the original author(s) and the copyright owner(s) are credited and that the original publication in this journal is cited, in accordance with accepted academic practice. No use, distribution or reproduction is permitted which does not comply with these terms.
*Correspondence: Md. Tariqul Islam, dGFyaXF1bC5pc2xhbUBjcmFuZmllbGQuYWMudWs=
†ORCID: Md. Tariqul Islam, orcid.org/0000-0003-2831-2252
Disclaimer: All claims expressed in this article are solely those of the authors and do not necessarily represent those of their affiliated organizations, or those of the publisher, the editors and the reviewers. Any product that may be evaluated in this article or claim that may be made by its manufacturer is not guaranteed or endorsed by the publisher.
Research integrity at Frontiers
Learn more about the work of our research integrity team to safeguard the quality of each article we publish.