 Aamir Mehmood Shah1,2
 Gengyuan Liu1,3*
 Asim Nawab1,4
 Hui Li1
 Duo Xu1
 Frederick Kwame Yeboah1
 Qing Yang5
 Lixiao Zhang1,3
- 1State Key Joint Laboratory of Environment Simulation and Pollution Control, School of Environment, Beijing Normal University, Beijing, China
- 2College of Landscape Architecture, Sichuan Agricultural University, Chengdu, Sichuan, China
- 3Beijing Engineering Research Center for Watershed Environmental Restoration and Integrated Ecological Regulation, Beijing, China
- 4Department of Environmental Sciences, University of Peshawar, Peshawar, KPK, Pakistan
- 5Advanced Interdisciplinary Institute of Environment and Ecology, Beijing Normal University, Zhuhai, China
The rapid urbanization witnessed in recent years has led to the deterioration of urban ecosystems, resulting in various environmental and socioeconomic challenges. In response to these concerns, the implementation of Green and Blue Infrastructures (GBI) has gained prominence as a sustainable urban planning approach. GBI is a planned network system of natural and semi-natural spaces, along with other environmental elements, managed and designed to provide a wide range of ecosystem services and improve ecological conditions, thereby contributing to citizens' wellbeing and quality of life. This study presents a comprehensive assessment of the costs, benefits (ecosystem services), and impacts (ecosystem dis-services) associated with the incorporation of GBI in urban environments using the technique of emergy accounting. To achieve this, the research paper introduces a novel integrated valuation framework. This framework encompasses key components such as constructing/maintenance costs, ecosystem services, needed costs to human health and biodiversity damage, as well as ecosystem dis-services. Furthermore, the study conducts a comparative analysis of the costs, benefits, and impacts associated with different urban GBIs via ternary phase diagram, shedding light on their varying contributions to the urban ecosystem. The findings reveal that green roofs offer more ecosystem benefits as compared to other GBIs, but this study also highlights that green roof entail higher initial construction costs and produce a greater number of dis-services. Conversely, street trees have lower initial costs and impacts yet generate higher benefits. Furthermore, green walls, despite having a lower input emergy value and fewer benefits, result in higher impacts compared to other green-blue ecosystems. These findings provide valuable insights for urban planners, policymakers, and stakeholders, enabling them to make informed decisions in developing sustainable cities for the wellbeing of present and future generations.
1 Introduction
Cities worldwide are currently confronted with urgent challenges brought about by climate change, water security concerns, air pollution, and declining public health and wellbeing (Hoek et al., 2013; Netherlands Environmental Assessment Agency, 2018; WHO and UN-Habitat, 2016). With global urbanization ongoing, it is projected that nearly 68% of the global population will be residing in urban areas by 2050 (United Nations, 2018), underscoring the growing importance of addressing these challenges. As a result, cities are actively exploring new techniques to mitigate climate-related impacts and other environmental issues. One proposed policy approach to tackle these challenges is the expansion of green and blue spaces within urban areas. Notably, the United Nations' Sustainable Development Goal focused on the New Urban Agenda (United Nations, 2017), and the sustainable cities (United Nations, 2015) explicitly call for more green spaces in urban areas. Likewise, the European Union has formulated an innovative research policy that promotes the integration of green-blue spaces into urban planning as a means to address social challenges (European Commission, 2015).
Urban green and blue infrastructure (GBI) is commonly referred to as urban green and blue space, defined as a strategically organized network of natural and semi-natural areas along with other environmental features, to provide various ecosystem services (ESs) within a city's boundaries (European Commission, 2013). Examples of urban GBI include green roofs, street trees, parks, and urban water bodies. ESs are typically described as the benefits or contributions that ecosystems offer to people (Díaz et al., 2018; Haines-Young and Potschin, 2018). In urban settings, key ESs encompass air quality regulation, local temperature control, and recreational opportunities (Gómez-Baggethun and Barton, 2013; Haase et al., 2014; Keeler et al., 2019; Shah et al., 2021; Meng et al., 2023). Certain types of urban GBI possess the potential to deliver ESs that address several sustainability challenges. For instance, parks not only promote health benefits through recreational opportunities but also help mitigate climate change by reducing flood events and extreme summer temperatures (Escobedo et al., 2011; Livesley et al., 2016; Roy et al., 2012). On the other hand, specific GBI types like rain gardens or constructed wetlands are explicitly designed to tackle particular challenges, such as climate change adaptation and water quality improvement (Prudencio and Null, 2018; Schlea et al., 2014; Shah et al., 2020).
The development and improper management of urban green spaces can lead to ecosystem dis-services (EDs), which refers to the adverse impacts of nature on human wellbeing (Blanco et al., 2019). It is crucial to determine the threshold at which an urban green area transitions from providing services to causing EDs. For example, pollen emission via vegetation can heighten the risk of allergies (Lara et al., 2019). Another significant drawback of green spaces is the safety concern regarding animal attacks or crimes, as observed in other locations. Moreover, the presence of ecological corridors can promote the proliferation of predators and pests (Tian et al., 2020). Additionally, constructed wetlands or lakes might lead to increased methane emissions and the transmission of vector-borne diseases (da Silva Pereira et al., 2022). Trees located near pedestrian paths can cause infrastructure damage, such as pavement cracking, and urban green areas often contend with animal waste (Kruize et al., 2019). In brownfield areas, dust can pose health risks, and plant litter is viewed as a significant disadvantage (Weeks et al., 2021), despite its potential benefits for soil ESs. Lastly, the use of tractors for managing urban green areas can lead to soil compaction, diminishing soil functions like flood and erosion control as well as carbon sequestration (Saco et al., 2021). While numerous drawbacks are associated with urban green-blue areas that serve as Nature-Based Solutions (NBS), their presence is crucial for enhancing the livability of urban spaces. Therefore, when implementing GBI, it is essential to consider the associated drawbacks and develop strategies to mitigate them.
Determining the ecological and economic values of GBI in city regions is a challenging task, and various techniques have been proposed by researchers. While many of these methods utilize monetary or economic approaches, accurately calculating the ESs and dis-services of urban GBI remains challenging. For example, Song et al. (2015) measured the ESs value of urban green spaces by using survey-based contingent valuation methods. Further, Tian et al. (2020) evaluated the ESs and dis-services values through the willingness-to-pay method because an economic or monetary value is easier to understand for urban managers to monitor the policy results (Greenhalgh et al., 2017). However, some scholars have criticized this approach as being limited by a narrow focus on human preferences (Brown and Ulgiati, 2011; Franzese et al., 2017). They argue that such methods often prioritize current social values with a limited time horizon (Mellino et al., 2015), neglecting the interests of future generations and other species (Brown and Ulgiati, 2011) and providing an incomplete picture of environmental benefits (Häyhä and Franzese, 2014).
Regarding the choice of the Emergy accounting approach, it is a widely recognized method for evaluating the sustainability of systems (Brown and Ulgiati, 2004). Emergy refers to the total energy, both direct and indirect, needed to produce a service or product (Odum, 1996). The fundamental idea of the emergy method is to measure all flows of resources—such as energy, labor, material, information, and services—by applying a common metrological reference, called solar emergy. In the context of assessing Ecosystem Services Valuation (ESV), the generation of ESs is viewed as an ecological thermodynamic process (Franzese et al., 2017). Specifically, from a production standpoint, emergy can describe and evaluate material flows and energy exchanges, measure the environmental impact of each flow and stock, and assess specific biophysical and thermodynamic factors. While emergy has been widely utilized in ESV assessment (Shah et al., 2023, 2022; Zhang et al., 2017), it still lacks a comprehensive assessment method that can be applied across various urban green-blue ecosystems to reveal their ESs formation mechanisms. Past studies have assessed several ESs of urban GBI using the emergy accounting method (Duan et al., 2011; Thompson, 2018). However, these studies did not account few adverse effects or cover certain benefits, such as fire damage, infrastructure damage and water storing capacity. It is crucial to consider negative impacts when conducting a comprehensive evaluation of the costs and benefits associated with GBI.
To address these research gaps, this paper aims (1) to develop a consistent emergy-based assessment method for green-blue ecosystems, (2) to evaluate ESs and dis-services across six key green-blue ecosystems using the newly proposed framework; and lastly, (3) to compare emergy analysis outcomes (including inputs, ESs, and EDs performance metrics) through ternary phase diagrams. This research serves as a crucial tool for policymakers to steer green development, fostering an ecologically-driven urban perspective and encouraging the adoption of integrated ecological civilization reform. This, in turn, promotes ecological civilization construction and the sustainable growth of cities, all of which hinge upon the evaluation of ESs.
2 Methods
2.1 Emergy diagrams of the urban green and blue infrastructure
Emergy diagrams (Figure 1) provide a holistic and quantitative representation of the energy flows and resource utilization within a system. When applied to urban GBI such as street trees, green walls, green roofs, sunken green spaces, bio-retention ponds, and constructed wetlands, emergy diagrams help assess the contributions and sustainability of these elements within an urban environment (Odum, 1996). From left to right in the diagrams, urban green-blue spaces have some common renewable resources (R), such as sunlight, that drive the process of photosynthesis within the GBI system. As a result, net primary productivity (NPP) occurs, leading to the sequestration of carbon dioxide from the atmosphere into the plants. This carbon sequestration is vital for mitigating greenhouse gas emissions and helps in regulating the overall atmospheric carbon balance. Similarly, some common non-renewable resources such as tools, machinery, labor, and services are also used in construction, irrigation, or transportation for maintenance.
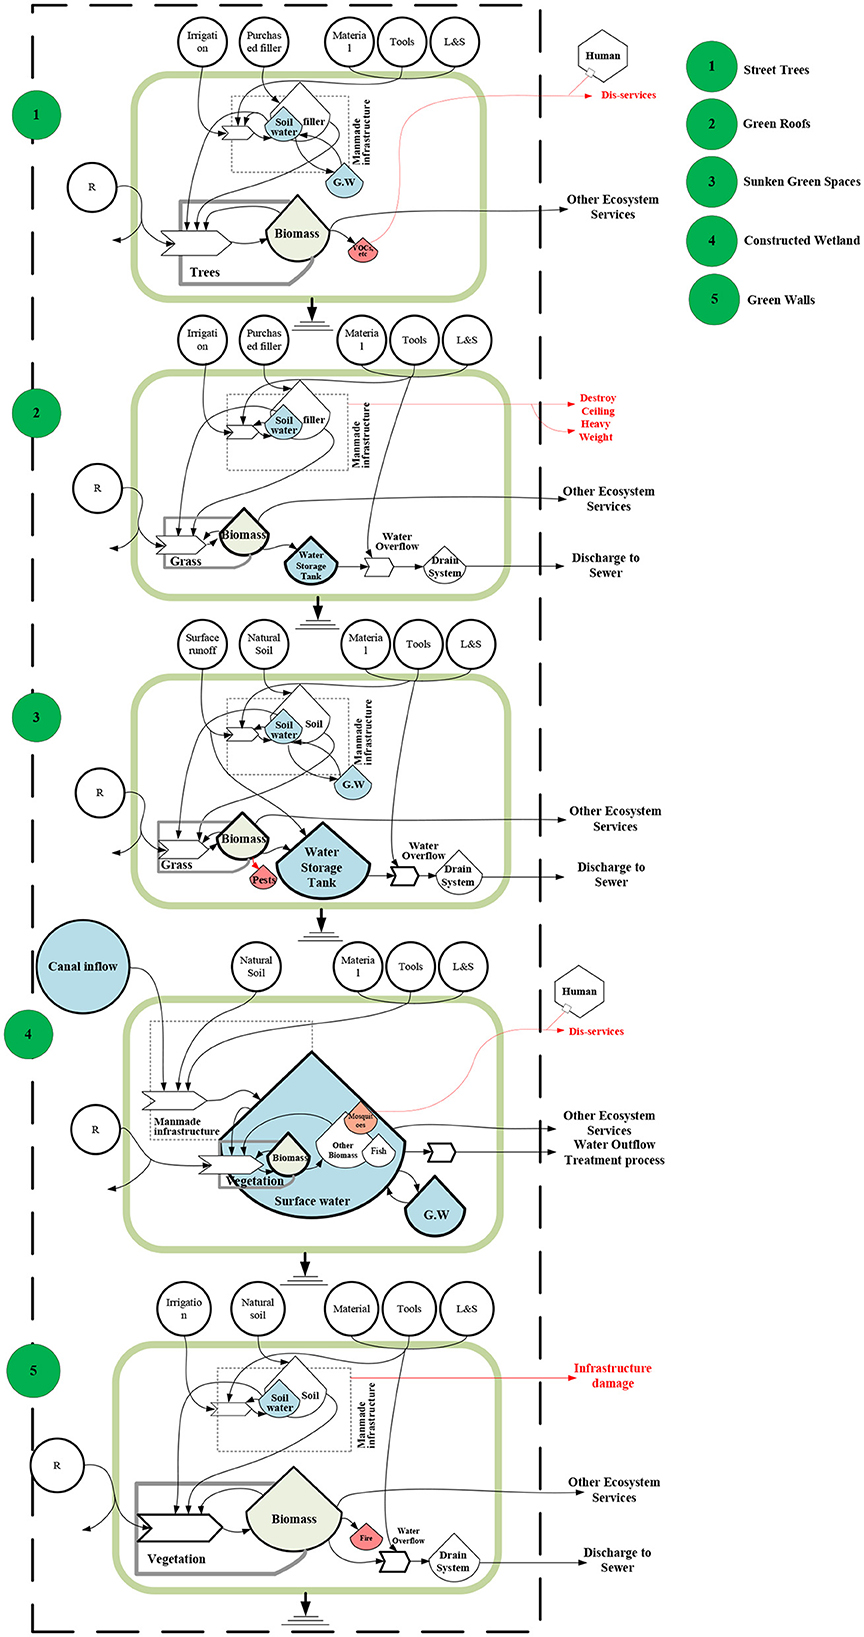
Figure 1. Emergy analysis flow diagram of GBI ecosystem services (R, renewable inputs; G.W, groundwater; L&S, labor & services; red line shows ecosystem dis-services).
However, certain non-renewable resources are specific to certain types of infrastructures. For instance, Polyethylene (PE) liners are employed in constructed wetlands for wastewater treatment to inhibit contaminated water from seeping into the groundwater table (Hammer, 1989). Similarly, moving from the top to the bottom part of the diagram, the major source of water for street trees, green roofs, and walls is artificial irrigation. The availability of water is crucial for the growth and survival of these green spaces, and their roots are supported by organic-rich filler soil, which provides essential nutrients. Wetlands, on the other hand, do not require artificial irrigation water because they mostly use untreated or sewage wastewater. These cumulative benefits are illustrated on the left and right sides of Figure 2. In practice, green-blue spaces often overlap and complement each other in urban planning and design, leading to integrated approaches that maximize the combined benefits.
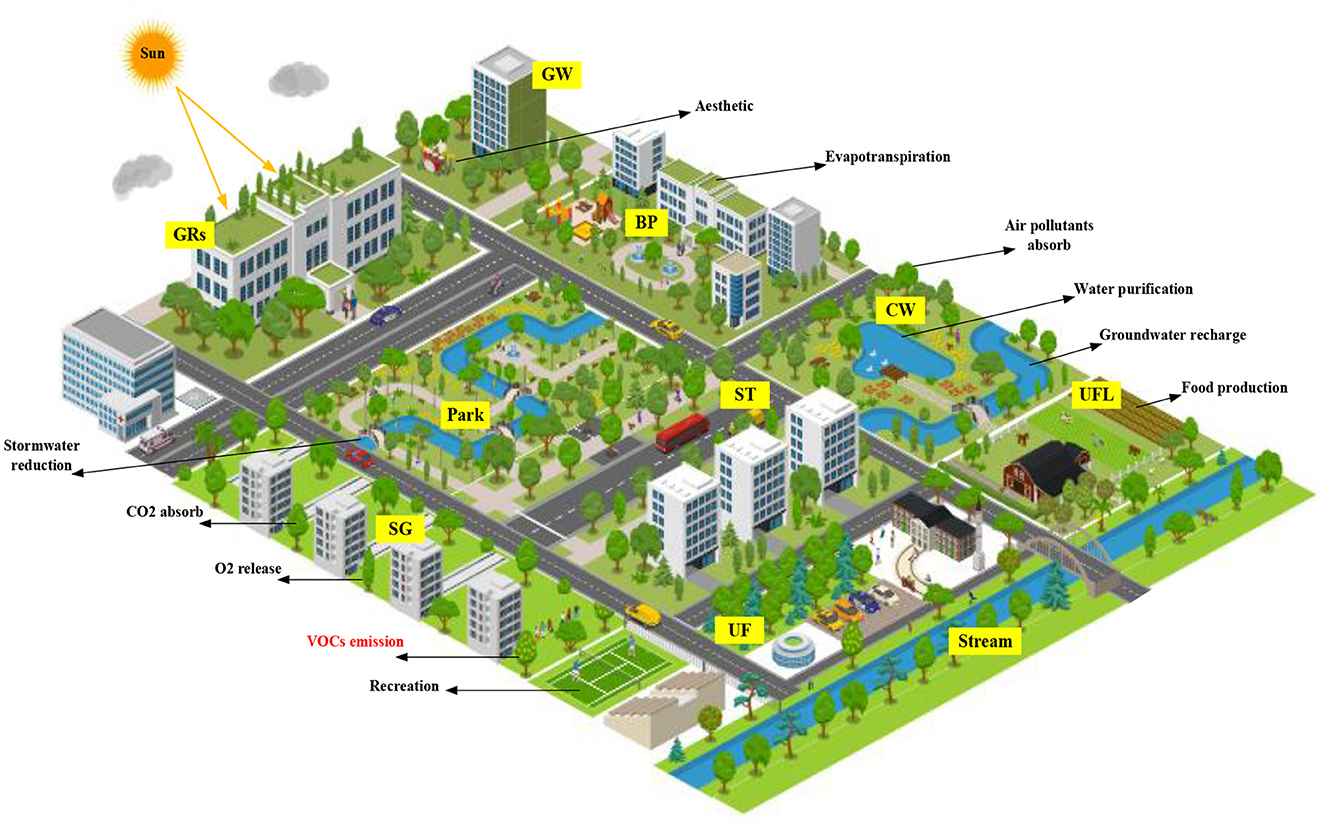
Figure 2. Ecosystem services and dis-services provided by urban green and blue ecosystems (GRs, green roof; GW, green wall; UF, urban forest; ST, street trees; UFL, urban farming land; BP, bioretention pond; CW, constructed wetland; SG, sunken green spaces; VOCs, volatile organic compounds).
2.2 Emergy-based integrated valuation framework of urban GBI
Urban green-blue spaces have been assessed from four different perspectives:
1) Constructing/maintenance cost. This input value comprehensively evaluates and measures the emergy resources necessary to construct and maintain a thriving urban GBI. The cost is determined using the conventional emergy procedure, which involves multiplying all input flows contributing to the product by their UEV (Unit Emergy Value) to ascertain the emergy associated with each flow. Subsequently, a cumulative emergy value is calculated by summing up all emergy inflows (refer to the case study, Tables 1, 2).
2) Ecosystem services (ESs). Ecosystem services can be categorized into intermediate and final services. (1) Intermediate services refer to ecological functions, such as net primary productivity (NPP), which form the foundation for final services by supporting essential processes. (2) Final ecosystem services represent the aspects of nature that are directly utilized, consumed, or experienced by humans, contributing to their wellbeing. These services are carbon sequestration, water regulation, etc., (Boyd and Banzhaf, 2007). Emergy analysis involves calculating the amount of emergy associated with the performance of the i-th ecosystem service (ESs) provided by GBIs, such as net primary productivity (NPP) increase, carbon sequestration, microclimate regulation, water storing and others. This calculation is based on the following equation:
Here, S(Pi) represents the “magnitude” of the i-th service provided (e.g., CO2 sequestration), and UEV is the Unit Emergy Value, corresponding to the amount of emergy required for 1 unit of the i-th service/process (e.g., for the sequestration of 1 g of CO2). Both the S(Pi) value specific to a GBI and the UEV values for the considered i-th service/process can be obtained from relevant literature in the field.
3) Needed cost for human health and biodiversity damage. The GBI can aid in repairing or replacing specific items that might have been damaged due to societal and economic processes, thereby obviating the need for technological interventions. To assess such cases, the Life Cycle Assessment (LCA) ReCiPe Endpoint 2016 Impact Assessment Method (Ecoinvent 3.5 software) is utilized (Goedkoop et al., 2009; Huijbregts et al., 2017). This method yields measures of human health damage (DALY—Disability Adjusted Life Years) and biodiversity damage [Potentially Disappeared Fraction of species (PDF) × area × time, i.e., PDF × m2 × yr] which are then multiplied by the respective UEVs for human life and biodiversity. Consequently, these measures are converted into their emergy values, representing an approximate estimation of the replacement cost. Let's suppose that no direct environmental service is available to mitigate the impact that needs to be regulated (e.g., the absence of trees, shrubs, and grass in the area to absorb CO2). In such a scenario, we calculate the total environmental cost (total emergy Emp) required to prevent the damage or to replace an item damaged by an uncontrolled impacting flow, P, using a technological process (e.g., technology for CO2 sequestration or technology to address damage to human health or biodiversity caused by CO2 through global warming).
or
The environmental cost of addressing an impact using technology can be measured and compared to the environmental resources required by a service that aims to prevent the damage rather than repair it after it occurs.
4) Ecosystem dis-services (EDs). Green-blue spaces can also lead to certain damages or dis-services when they are not adequately compatible with the urban environment. This research delves into the emergy cost required to rectify these damages, encompassing the emergy needed to address human health and biodiversity losses. For instance, this includes repairing roads damaged by tree roots and human health damage by pollens.
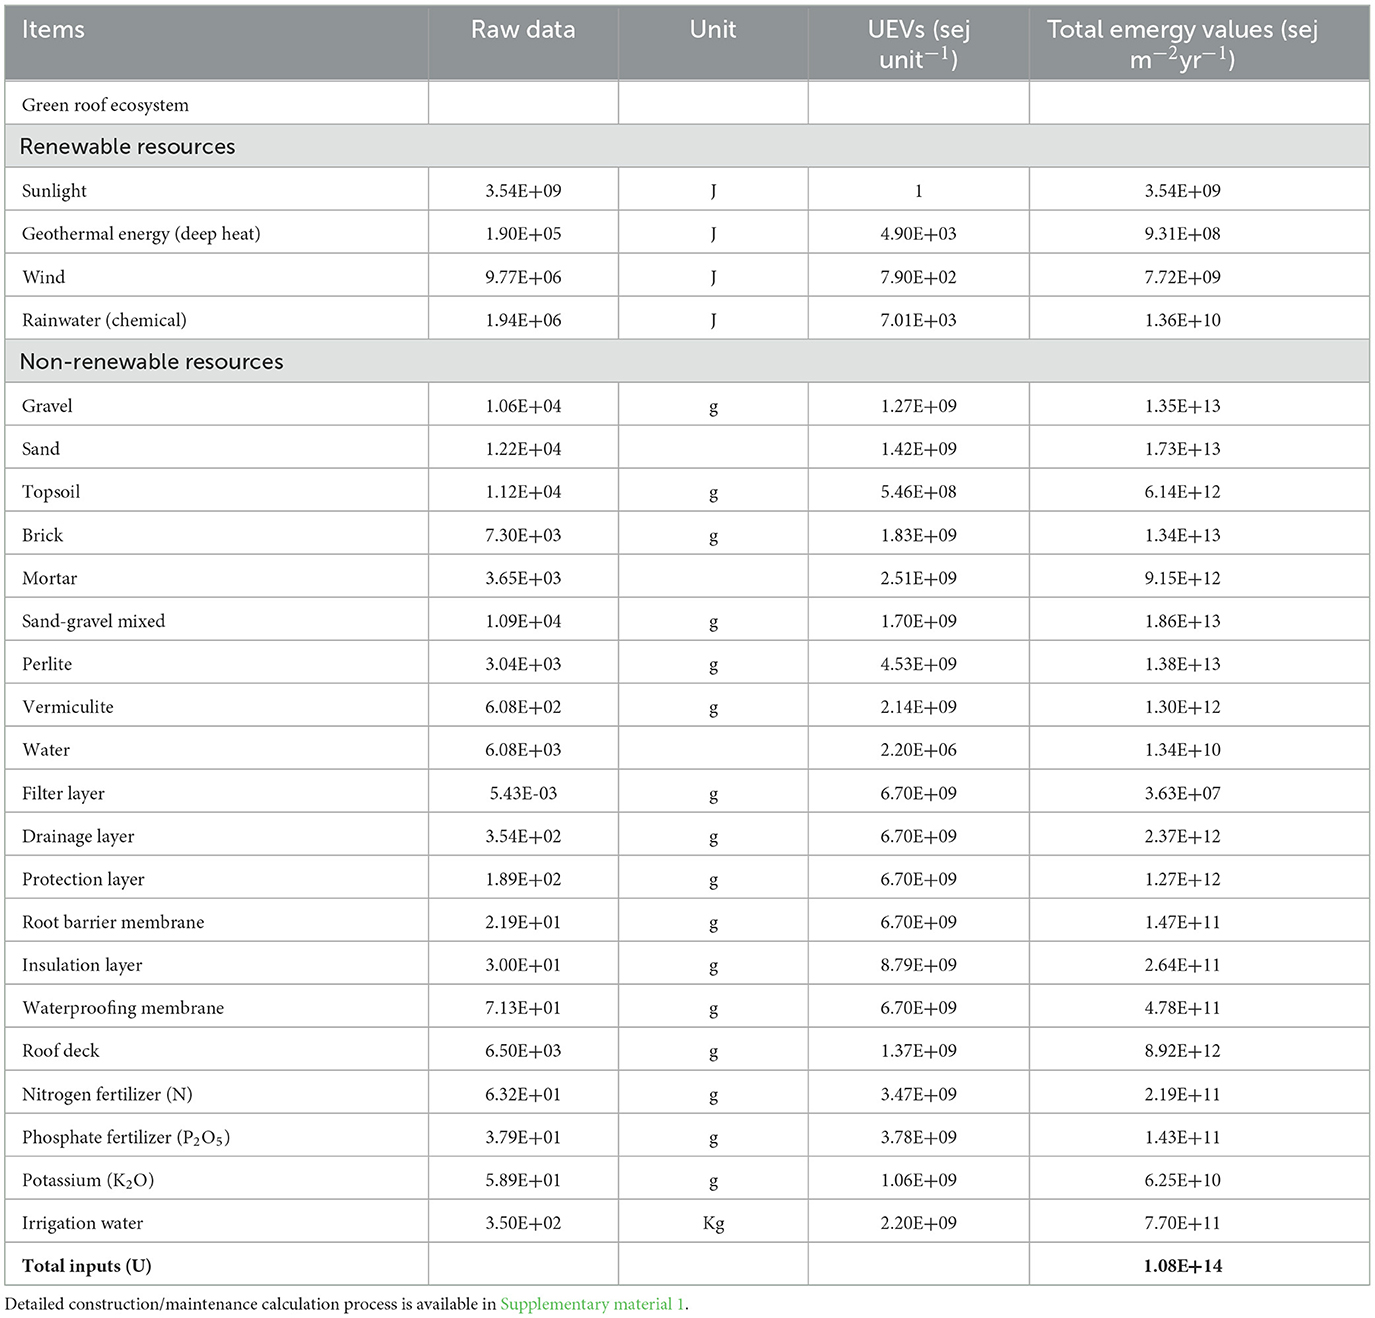
Table 1. Environmental and technological inputs to an intensive green roof ecosystem in Beijing.
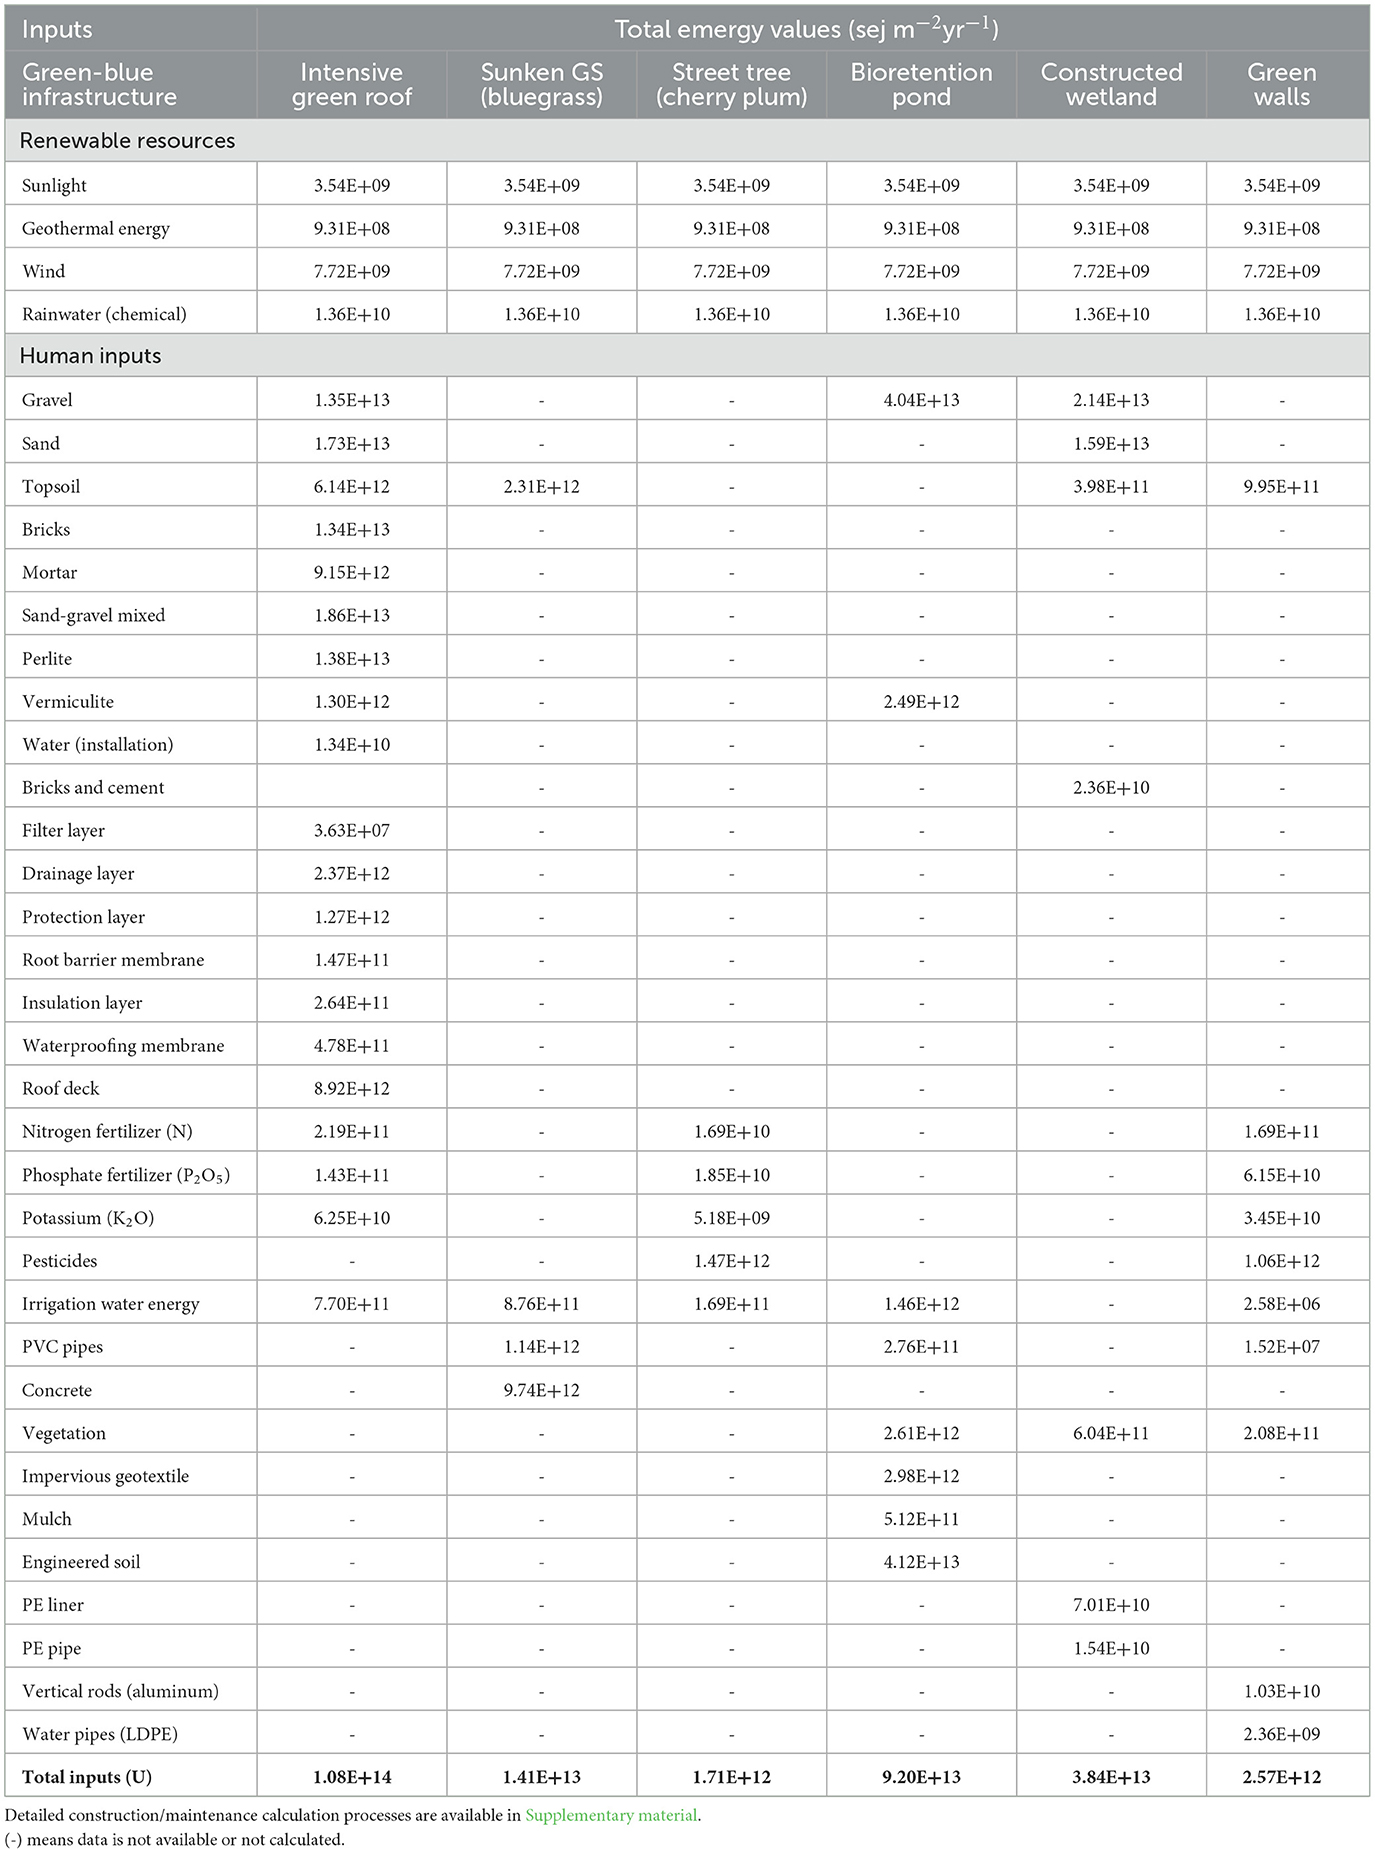
Table 2. Environmental and technological inputs to different GBI ecosystem in Beijing.
2.3 Emergy-based accounting methods of urban GBIs
2.3.1 Ecosystem services
2.3.1.1 NPP increase
NPP (net primary productivity) denotes the net carbon accumulation by plants, representing the equilibrium between carbon acquired via photosynthesis and carbon emitted through plant respiration (Chapin and Eviner, 2007). The emergy driving NPP increase is computed as follows:
where Em NPP represents the emergy (sej/m2/yr) required by NPP; ∑ R(i) is the summation (over i from “a” to “e”) of all renewable emergy (sej/m2/yr) inflows to the analyzed GBI ecosystem. Specifically, the following renewable emergy inflows have been considered: (a) solar, Emsolar, (b) geothermal, Emgeoth, (c) wind, Emwind, in addition to (d) chemical emergy associated with evapotranspirated rain, Emrain and (e) emergy linked to the geopotential and chemical potential energy of runoff water, Emrunoff.
Finally, ∑P(i) is the summation (over i from 1 to n) of all emergy related to the annual human inputs (e.g., sand, gravel, pesticides, irrigation etc.), per unit area (m2), to the investigated GBI. Detailed information regarding human inputs is available in the Supplementary material.
2.3.1.2 Carbon sequestration
Carbon dioxide from the atmosphere undergoes conversion into carbohydrates and becomes fixed in plants and soil as organic carbon during photosynthesis. The carbon present in vegetation moves into the soil, leading to carbon sequestration within the soil. Hence, the value of carbon sequestration is determined by the disparity between carbon sequestration during photosynthesis and carbon sequestration within the soil. The carbon sequestration equation of GBI is as follows:
where EmCS is the total emergy supporting the carbon sequestration process (sej/m2/yr); CFRi means the yearly carbon fixation rate of GBI component i (g/m2/yr); UEVCSi represents the specific emergy of carbon uptake by the GBI ecosystems (sej/gC).
2.3.1.3 Water storing
The emergy driving water retention in soil is calculated as follows
where, EmWR represents the emergy required by water retention in soil (sej/m2/yr); Rwri represents the rainwater retention on i-th GBI (e.g., green roof) ecosystem (g/m2/day); 0.001 represents the conversion from g to kg; Rf shows the number of days rainfall in a year (day/yr); UEVws means the specific emergy of water retention in soil (sej/kg).
2.3.1.4 Microclimate regulation
City green-blue ecosystems contribute to regulating the microclimate by enhancing humidity and precipitation while reducing temperatures. As the energy absorbed during evapotranspiration matches the energy utilized for increasing humidity and lowering temperature within the ecosystem, the energy needed for evapotranspiration serves as a metric for measuring the increase in humidity and decrease in temperature. This ESs value is accounted as:
where, EmET is the emergy needed to regulate microclimate (sej/m2/yr); Etri is evapotranspiration of i-th GBI ecosystem (mm/yr); ρ represents the water density (kg/m3); 1,000 is the conversion factor from kg to g; UEVmr shows the specific emergy of water vapor (sej/g).
2.3.1.5 Groundwater recharge
Green and blue spaces contribute significantly to groundwater recharge by facilitating natural processes like infiltration, surface water-groundwater interaction, and stormwater management. Vegetated areas such as forests, parks, and wetlands absorb rainwater, allowing it to seep into the ground and replenish aquifers. The roots of plants and trees in these areas break up compacted soil, enhancing soil permeability and enabling water to penetrate deeper. Additionally, bodies of water like rivers, streams, and lakes not only store water but also allow for direct interaction with groundwater through seepage. The calculation equation is as follows:
where Emgw shows the emergy applied to groundwater recharge (sej/m2/yr); Ri is the amount of rainfall in the i-th GBI ecosystem (m/yr); ρ is the density of water (kg/m3); G represent the Gibbs free energy (J/g); ki shows the infiltration coefficient of the case study; UEVgw is the UEV for groundwater (sej/J).
2.3.1.6 Soil retention
The connection between biodiversity and soil erosion is highly complex. Erosion is widely acknowledged as a significant soil threat, with ~2.8 Mg of soil lost per hectare each year globally (European Commission, 2021). Consequently, urban GBI are frequently viewed as a universal solution for managing soil erosion. The roots of plants aid in soil stabilization and cohesion, while their branches serve to intercept heavy rainfall that might otherwise harm vulnerable plants and dislodge loose soil. This ESs is measured through the following equation
where, Emer represents the emergy of soil retention (sej/m2/yr); Ser is the potential soil erosion in GBI ecosystem (t/km2); Rer is the actual erosion (t/km2); 10−3 is the conversion factor from t/km2 to kg/m2; UEVC means the specific emergy of soil (sej/kg).
2.3.1.7 Water purification
Urban GBI (e.g., CW) have the potential to enhance water quality by lowering phosphorus, nitrogen, and chemical oxygen demand (COD). These pollutants can otherwise foster excessive algal growth, diminishing the quality, recreational appeal, and functional value of Green and Blue Infrastructure (Irwin et al., 2018). Although this study primarily concentrates on nitrogen, phosphorus, and COD for clarity, it's worth noting that they can also eliminate additional contaminants during operation, including total suspended solids. The water quality equation is outlined below.
where EmWP shows the emergy applied to water purification (sej/m2/yr); Pa is the amount of pollutant accumulated (g/m2/yr); UEVPoll refers to the specific emergy of pollutant (sej/g).
2.3.2 Emergy cost of human health and biodiversity damage
2.3.2.1 Damages from air pollution
Various methods have been employed in the past to assess the environmental impact of harmful emissions (Hasan and Rahman, 2017; Stolaroff et al., 2018). However, it would be advantageous to incorporate the direct emergy accounting approach into a methodology capable of assessing both the environmental cost of damage to assets and humans from an emergy perspective (Liu et al., 2011). Goedkoop and Spriensma (2001) proposed the Eco-Indicator 99 assessment framework, where human health damage is quantified using DALYs (Disability-Adjusted Life Years) and ecosystem quality damage is assessed using PDF (Potentially Disappeared Fraction). This framework laid the foundation for subsequent LCA methodologies such as Huijbregts et al. (2017). Consequently, the Huijbregts et al. (2017) methodology was employed in this study instead of Eco-Indicator 99, to analyze air purification benefits, which are expressed as a cumulative reduction in human health losses. The calculation formulas are detailed hereafter:
(A1) Decline in human health losses
where EmHH means the emergy required to reduce damages to human health (sej/m2/yr), Pi shows the ability of the GBI to remove the i-th air pollutant (g/m2/yr); DALYi refers to the health loss of one individual generated by the i-th air pollutant (person yr/kg), 10−3 is the conversion factor from g to kg; UEVhealth refers to the unit emergy cost for health (sej/person/yr).
(A2) Decline of ecosystem quality degradation
The ecosystem quality degradation equation is as follows
where EmEQ indicates the emergy required to reduce damages to ecosystem quality degradation (sej/m2/yr); Pi has the same meanings as Pi in Equation 8; PDFi represents the PDF of species caused by air pollutant i-th (m2×yr × kg−1);10−3 is the conversion factor from g to kg; UEVPDF means the average unit emergy value of ecosystem biomass (sej/m2/yr).
This air purification service is calculated as:
2.3.2.2 Damages from global climate change
Climate change primarily results from global warming, acid rain, and ozone (O3) layer depletion, with global warming widely acknowledged as the most severe factor impacting people's health. According to Goedkoop and Spriensma (2001) and the IPCC (2013), global GBI systems sequester atmospheric carbon, thereby mitigating the impacts of global climate change as key regulator of the climate . This service is accounted for as follows.
where EmCRHH refers to the emergy needed for climate regulation (sej/m2/yr); PCSi represents i-th greenhouse gas (GHGs) amount sequestrated by the GBI ecosystem (g/m2/yr); DALYCSHHi means the disability-adjusted life year caused by i-th greenhouse gas (person yr/kg); 10−3 is the conversion factor from g to kg; UEVhealth refers to the unit emergy cost for health (sej/person/yr).
2.3.2.3 Damages from human activity induced noise
Urban noise pollution, exacerbated by construction, traffic, and various people activities, poses a significant challenge in cities, impacting health by causing both psychological and physiological harm. City soil, trees, small plants and belt trees, for instance, contribute to mitigating noise pollution by absorbing, deflecting, reflecting, and refracting sound waves (Aylor, 1972; Fang and Ling, 2003; Kragh, 1981). In the case of belt trees, sound waves bounce off and bend, spreading sound energy throughout leaves, branches, and even in tree bark (Chaparro and Terradas, 2009). Therefore, this ESs is quantified as follows
where EmNHH is the emergy applied to fix the human health noise-induced decline (sej/m2/yr); Nhai refers to the ability of the i-th GBI ecosystems to mitigate the sound/noise (dB/m2); DALYi is the disability created by the sound/noise pollution (person/yr/dB); UEVhealth refers to the unit emergy cost for health (sej/person).
2.3.3 Ecosystem dis-services
2.3.3.1 Green waste from the GBI
After cutting the grass in the GBI, green waste is generated, whether done by machine or by hand. The green waste equation is outlined as follows:
where, EmGW refers to the emergy of green waste (sej/m2/yr); Dcost is the disposal cost of green waste in GBI space ($/m2/yr); EMR means the unit emergy value of disposal-waste via labor (sej/$).
2.3.3.2 Health and ecosystem loss due to BVOCs
The accounting methodology for BVOCs is the same as the damage by air pollution. However, the parameter “Pi and DALYs” in Equation 8 is changed to reflect the capacity of GBI ecosystems to absorb the i-th VOCs emanation.
2.3.3.3 Greenhouse gases emission
Similar to air and BVOCs equation, the emission effect of GBI ecosystems such as N2O, CH4, and CO2 can be accounted. The parameter Pi and DALYs in Equation 8 are changed into the capacity of GBI ecosystems to absorb the i-th GHG emanation.
2.3.3.4 Pest problem
Urban CW holds considerable promise for providing wildlife habitats and enhancing water quality. Nonetheless, CW has been pinpointed potential breeding site for mosquitoes, causing tensions with residents in the vicinity. Furthermore, CWs have the potential to draw a substantial bird population, consequently elevating the chances of viral infections spreading to neighboring communities. This issue is particularly pronounced in regions experiencing limited natural mosquito populations, especially in close proximity to newly built-up regions, where conflicts often reach their peak (Knight et al., 2003). The emergy for pest control is calculated as
where Empest means the emergy of pest's problems (sej/m2/yr); Oamount is the organophosphate amount in GBI ecosystems (g/m2/yr); UEVpest is the unit emergy value of pesticides (sej/g).
2.3.3.5 Infrastructure damages
Another key EDs related to urban GBI is the physical damage caused by tree roots to nearby surfaces and underground structures, commonly called root damage Wong et al. (1988). The roots of trees planted near sidewalks often seek out moisture and nutrients in the soil, which may be more abundant under the sidewalk due to irrigation, rainwater runoff, or soil composition. As roots grow and expand, they can exert pressure on the concrete or asphalt of the sidewalk, causing it to crack, lift, or buckle. The infrastructure damage is calculated as follows
where EmIR refers to the emergy needed for repairing infrastructure damage (sej/m2/yr); ID represents the infrastructure damage in GBI ecosystems (g/m2/yr); UEVIR shows the unit emergy value of infrastructure material (sej/g).
2.3.3.6 Fire damage
Green roofs and green walls are typically kept moist to sustain vegetation and are therefore considered to be fire-resistant. However, concerns arise regarding fire risk in the absence of irrigation, particularly during drought conditions (DCLG, 2013). To quantify the specific fire protection attributes of green roofs and green walls, their characteristics must be assessed, taking into account the type of roof. Some countries, such as the United Kingdom and the USA, have established standard fire tests to categorize components of green roofs (DCLG, 2013; Standard AAAN, 2017).
Several guidelines suggest fire prevention measures, including regular maintenance and removal of dry or dead plants (Standard AAAN, 2017), the use of saturated substrates (Co Sydney, 2019) with minimal organic content (GRO, 2014; Standard AAAN, 2017), and the selection of fire-resistant plant species (e.g., grasses, perennials, and sedums; Breuning, 2008). Additionally, in larger green roofs, areas devoid of vegetation or growing media can be incorporated to prevent the spread of fire (Standard AAAN, 2017). The equation of risk of fire damages is as follows
EmGfire is the emergy of GBI fire (sej/m2/yr); Cemission shows the carbon emission from the GBI due to fire (gC/m2/yr); UEVc is the unit emergy value of carbon (sej/g) by the GBI ecosystem. Further, Table 3 shows the emergy equations of various green and blue ecosystems.

Table 3. Emergy equations of various green and blue infrastructures.
2.4 Case study and data sources
Beijing is situated between 39.230°N to 40°N latitude and 115.200°E to 117.300°E longitude, characterized by a continental monsoon climate with cold and dry winters and mild and moist summers. The city experiences an annual average precipitation of 682.9 mm, with a frost-free period lasting between 150 to 180 days (Xu et al., 2006). Beijing also experiences extreme temperature variations throughout the year, with average temperatures ranging from below freezing in winter to high 20°C in summer. Therefore, to address the environmental challenges and enhance the city's resilience against climate change, the implementation of blue-green infrastructure can play a crucial role. This study is based on secondary data and a complete calculation process and comprehensive data sources are outlined in the Supplementary material.
3 Result
3.1 Construction/maintenance cost of GBI
The emergy evaluation results of intensive green roof (intensive GR) are shown in Table 1. The input values are categorized into two types: renewable and non-renewable, or human inputs. Renewable inputs, such as sunlight, deep heat, wind, and rain, in the intensive GR ecosystem, are valued at 2.58E+10 sej m−2yr−1, making up roughly 0.02% of the total inputs. Non-renewable inputs encompass growing media (gravel, sand, topsoil, bricks, mortar, sand-gravel mixture, perlite, vermiculite) GR layers, fertilizers, and irrigation water. The emergy value for non-renewable inputs in the intensive GR ecosystem is 1.08E+14 sej m−2yr−1, accounting for ~99.98% of the total inputs. This reflects that the management and structure of the intensive GR ecosystem are primarily the result of human engineering with considerable human intervention.
Within the renewable inputs category, natural rainfall has the highest emergy value 1.36E+10 sej m−2yr−1. On the other hand, perlite (12.76%), sand (16.06%), and the sand-gravel mix (17.23%) are the most prominent among renewable and non-renewable inputs. To cut down on non-renewable inputs, municipal administrators and other stakeholders may consider proper management of perlite, sand, and sand-gravel mixtures to lower input costs or explore alternative materials with lower emergy values that are equally effective, like rock and organic materials (Wang et al., 2018). The same approach has been used for other GBI calculations, with the detailed process outlined in the Supplementary material.
All of the chosen GBI are situated in Beijing, and for this study, we assume that the renewable inputs are the same across each GBI. As indicated in Table 2, the topsoil emergy value of the intensive GR is higher (6.14E+12 sej m−2yr−1) compared to other GBI, because green roof ecosystem requires a deeper soil media or substrate layer to sustain the healthy growth of a more diverse range of plant species. These alternative ecosystems require less soil depth for dense plantings, such as grass, creepers, or wildflowers, which creates a visually striking appearance. The findings also reveal that Kentucky bluegrass, a typical species used in sunken green spaces, requires a higher quantity of irrigation water (8.76E+11 sej m−2yr−1) compared to intensive GR and green walls. This increased water demand is due to Kentucky bluegrass's inability to maintain its green appearance for extended periods during severe drought conditions (Powlen et al., 2021). As for bioretention ponds, they typically require more gravel due to their specific function and design requirements. They are designed to filter stormwater runoff and promote infiltration into the ground, and the gravel layer acts as a filter bed, trapping sediments, pollutants, and debris from the runoff before it reaches the soil and water table below. A thicker layer of gravel enhances filtration efficiency and ensures proper drainage (Hatt et al., 2007). Gravel also serves as a storage medium for excess stormwater during heavy rainfall events. A larger volume of gravel allows the bioretention pond to hold more water temporarily (Tahvonen, 2018), thus preventing the overwhelming of downstream systems and reducing the risk of flooding. According to Table 2, GBI on the basis of the respective emergy values, are ranked as follows: GR > bioretention pond > constructed wetland > sunken GS > green wall > street tree.
3.2 Benefits analysis
In this study, the assessment of ESs for green-blue spaces was carried out using a well-established framework at a local scale, allowing for a comparison of services provided by various GBIs. The emergy values for all ESs are presented in Table 4. The highest emergy value for carbon sequestration is associated with green roofs (GR) and is similar to that of sunken green spaces (GS), amounting to 1.91E+12 sej m−2yr−1, and bioretention ponds (1.33E+12 sej m−2yr−1), while the value for green walls is significantly lower (6.97E+08 sej m−2yr−1). Peng and Jim (2015) assessed multiple climate-related ESs based on modeling and localized experiment studies in the city of Hong Kong. The result of this study shows an intensive GR sequester average CO2 (25.7 tha−1yr−1 or 2,570 gm−2yr−1), which is higher than street trees value 2,050 gm−2yr−1 (Shah et al., 2022). Therefore, if a city has significant CO2 issues, city managers and building owners need to make intensive vegetative roofs inside the city to reduce the amount of carbon and other greenhouse gases. Besides that, the microclimate regulation values of GR and sunken GS are lower because of their lower evapotranspiration value when compared with street trees (4.55E+11 sej m−2yr−1). Shareef (2022) investigated the impact of vegetation and landscape design on solar irradiation and urban heat island (UHI) mitigation at Boulevard Riyadh city, Saudi Arabia. The study's findings reveal that street trees are more effective in reducing air temperature than green roofs. The results from Table 4 also indicate that sunken green spaces and bioretention ponds have a higher water storage capacity compared to street trees, although their values are similar to those of green walls. In the comparison of total ESs with and without NPP, the emergy values for all GBI are higher when NPP is included, except for street trees, where the values are lower and nearly the same (1.13E+13 and 1.29E+13 sej m−2yr−1, respectively). According to Table 4, based on the emergie values of the respective ESs, the GBIs are ranked as follows: GR > bioretention pond > sunken GS > street tree > constructed wetland > green wall.
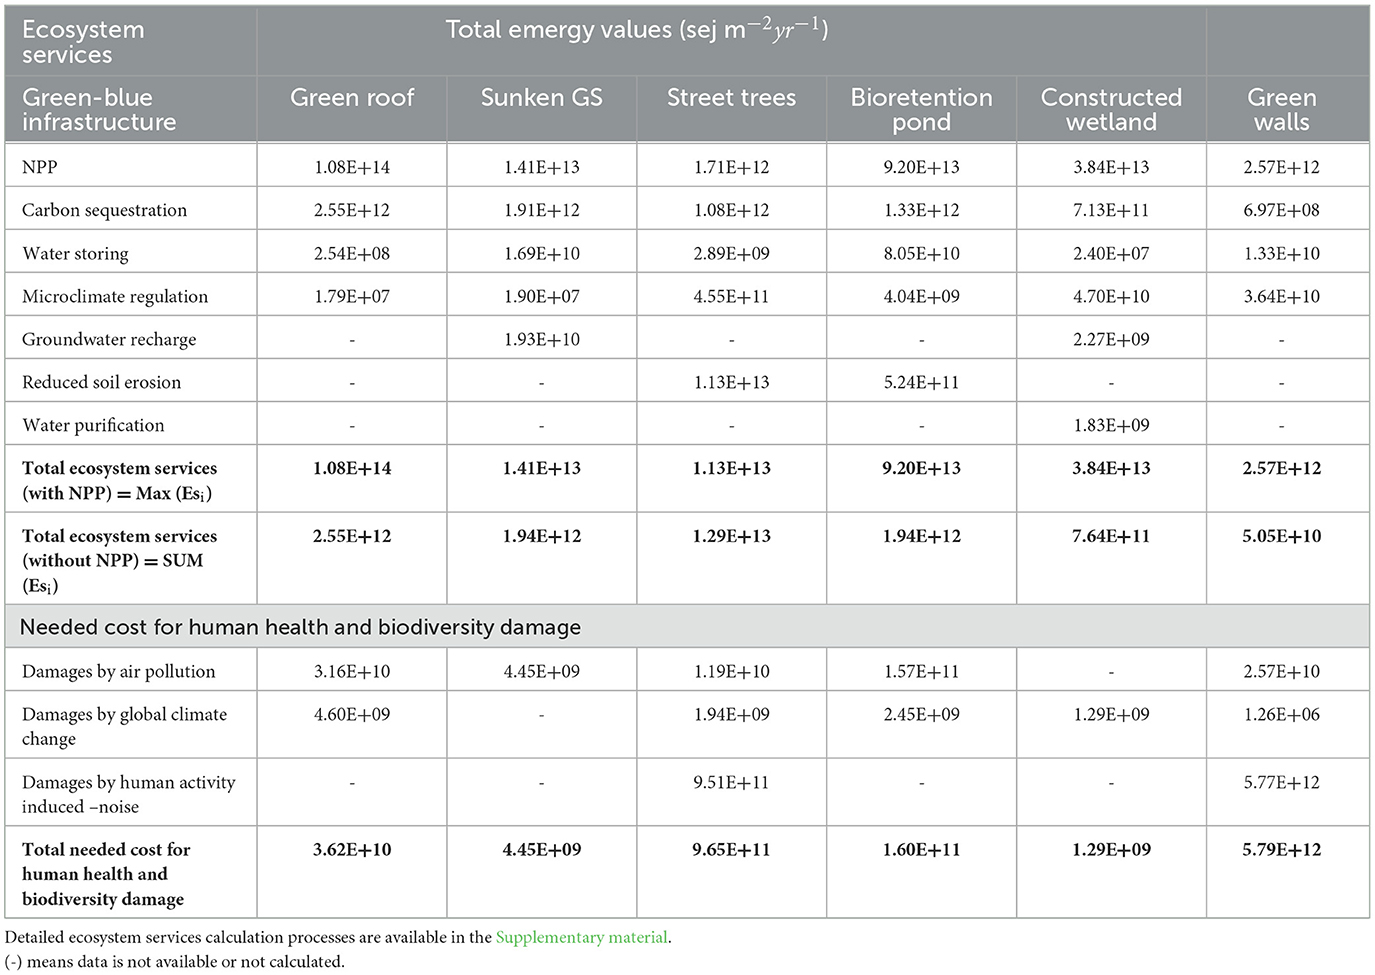
Table 4. Emergy values of various green and blue ecosystem services.
3.3 Dis-services analysis
Often overlooked in discussions about ESs are the negative impacts, or disservices, that ecosystems can generate. It is crucial to address EDs alongside services to ensure continued local support for management actions, a matter of particular significance in urban areas due to the numerous stakeholders involved in managing urban ecosystems (Sandbrook and Burgess, 2015). Table 5 shows that although the emergy associated with the disposal of green waste or bio-waste is high for all the examined GBIs, the highest emergy value (4.66E+13 sej m−2 yr−1) belongs to green roofs and is due to the clipping and landfill disposal expenses. Likewise, certain researchers have drawn attention to the environmental dis-services originating from city trees, like pollens, biogenic volatile organic compounds, and damage to infrastructure (Gómez-Baggethun et al., 2013; Lyytimäki and Sipilä, 2009; von Döhren and Haase, 2019). As for infrastructure damage dis-service, green walls have a higher value than street trees because green walls often involve more complex structures and systems compared to street trees. They may require specialized materials, irrigation systems, and support structures, all of which contribute to higher costs. Further, green walls are usually installed vertically on building facades, which can be more challenging to access and maintain than street-level trees. This vertical orientation may necessitate additional safety measures, such as scaffolding or specialized climbing equipment, further increasing costs. Moreover, the destroyed ceiling and material heavyweight of GR, risk of fire damages, and pollens emission from city trees are not calculated because of the lack of data.
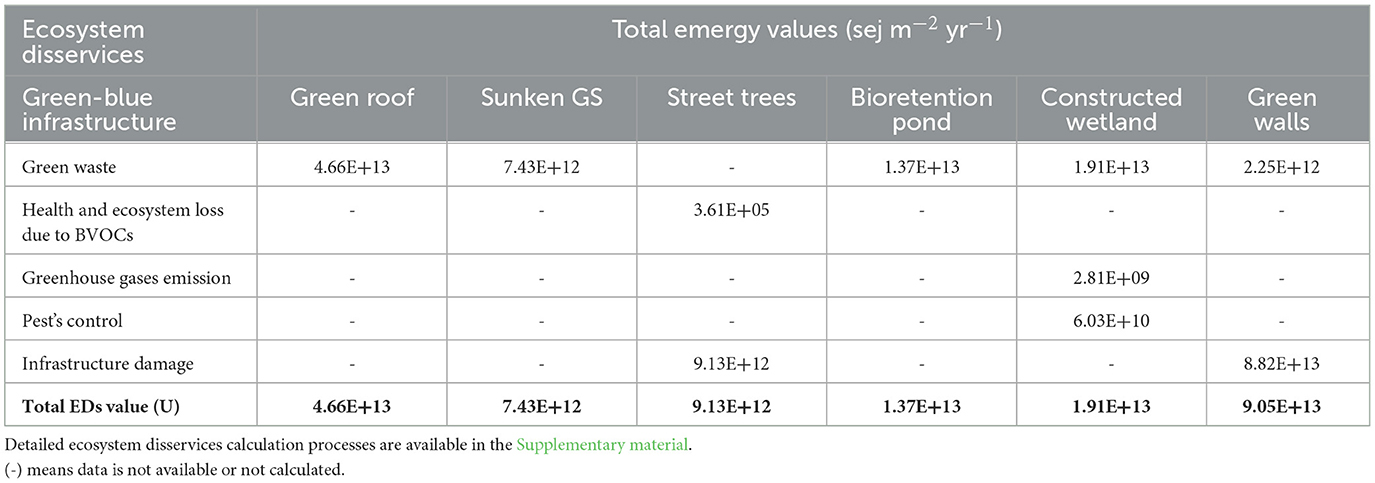
Table 5. Emergy values of GBI impacts or ecosystem dis-services.
4 Discussion
4.1 Compare cost and benefits of different green and blue infrastructure
We observed differences in constructing/maintenance emergy costs among the different types of GBI that were studied. The emergy values of the total cost of various GBI ecosystems are shown in Table 6. The results of this study observed that intensive GRs show maximum value (1.08E+14 sej m−2yr−1) in comparison with others because of many factors like equipment, growing substrate material, and labor costs influence the installation price. A few ways to decrease the initial installation cost of GRs is to adopt the low-cost practices that are developed by mature markets. In the past one study reported that the green roof cost reduces by 33–50% once the manufacturing industry has established itself (Toronto and Region Conservation, 2007). Table 6 also shows the installation value of the green wall (2.57E+12 sej m−2yr−1) which is close to another green wall study (6.61E+12 sej m−2yr−1). Pulselli et al. (2014) reported that the green walls can have much differences in the cost from other GBI, mainly due to the need for a water supply for sustenance, or as there are various systems on the international market (Manso et al., 2021). The average installation cost is 848 USD/m2 (750 €/m2) obtained for green walls (Manso et al., 2021), which is much higher than street tree. Further, the annual mean value (1.71E+12 sej m−2yr−1) is minimal for a street tree (e.g., purple-leaf plum) as compared to other GBI, maybe due to the low transformities of simple tree plantings, but the GRs construction value is much higher than other GBI which means the GRs depends much more on non-renewable resources (Thompson, 2018). These pieces of information should be combined with other factors, such as the benefits and potential negative impacts (dis-services), when strategizing and executing integrated GBI network plans.
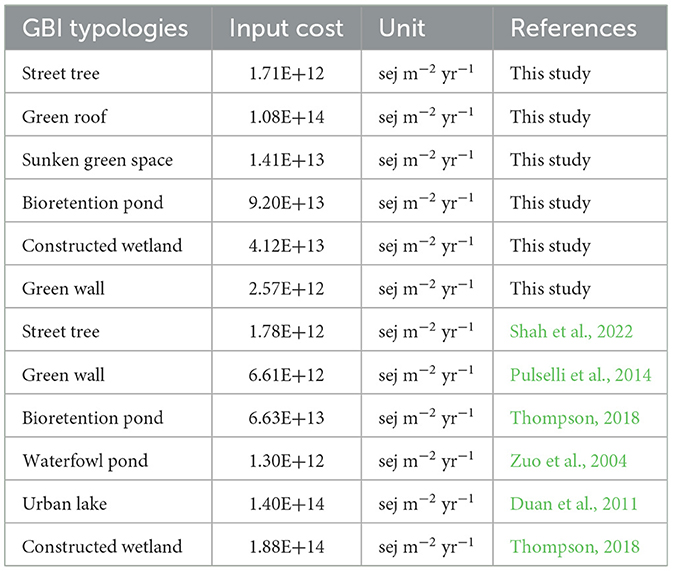
Table 6. Input value of different green and blue infrastructure.
When incorporating NPP into the evaluation of ES, it is crucial to distinguish between benefits to humans and those to the broader ecosystem. Humans depend on services (such as carbon sequestration, oxygen production, and water regulation) each of which is intrinsically linked to NPP. However, NPP also plays a critical role in maintaining biodiversity by providing essential resources like food and habitat for various species, thus supporting the overall health of ecosystems.
Consequently, NPP extends benefits to both humans and the ecosystem, as its contribution to ecological health and biodiversity ultimately underpins human wellbeing. In the absence of NPP, the focus shifts solely to the direct benefits to humans, which are commonly defined as final ESs. Therefore, recognizing NPP as part of ESs highlights its dual role in supporting both ecosystem integrity and human needs.
This link between NPP and ecosystem benefits can be further illustrated through an analysis of various GBI typologies. The past studies data of several green-blue ecosystems typologies were collected from the scientific literature and the data was examined based on the ESs or benefits to make a comparison and the results as shown in Table 7. The ESs in China (Beijing) intensive GR typologies represent maximum value (1.08E+14 sej m−2yr−1), which may be due to the organic substrate of the green roof because organic substrate gives more benefits than local natural soil. The local nature soil weight is heavy, with less rainwater retention capacity, and vegetation does not grow well. Additionally, the green wall exhibits lower emergy results (8.37E+12 sej m−2yr−1) in comparison to other GBI types. However, its value surpasses that of another study (3.42E+12 sej m−2yr−1) because they only calculate a single or limited number of ESs. For instance, the study only measured the emergy of energy saving (Pulselli et al., 2014), whereas GBI ecosystems can offer numerous ESs beyond energy conservation within urban environments. Further, the sunken green spaces offer a limited set of ecological benefits, primarily centered around rainwater capture. In contrast, both green roofs and tree plantings bring forth a diverse array of ESs associated with urban greening. However, it's noteworthy that green roofs deliver distinct infrastructural advantages that are generally not found in sunken GS and tree plantings. For instance, green roofs can provide shelter, a function typically fulfilled by non-green infrastructure alternatives. Therefore, some of the researcher still not considered many ESs in their studies because maybe they do not have this kind of methods or they do not have the data. But our data are better for further comparison.
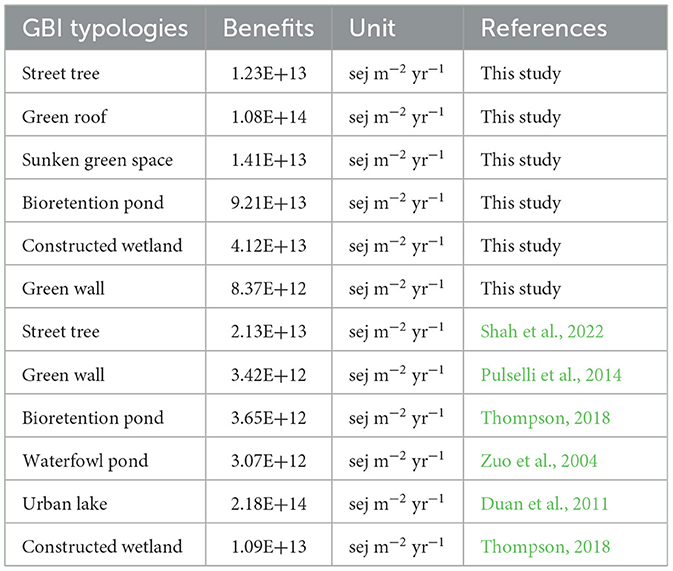
Table 7. Benefits value of different green and blue infrastructure.
Based on the past and current studies it is observed on a broader view, that variations in values seem like changes in particular values of ESs in all green-blue ecosystems typologies. This shows that highly human intensive GBI provides a maximum of ESs whereas such dependency also generates many dis-services (e.g., street trees damage the pavement, and green roofs generate the green waste). So, a significant policy should require to be adopted to accomplish more benefits in urban small scale GBI via increasing their investigation in green-blue ecosystems. Further, need to change a pattern of non-renewable inputs, for instance, using organic pesticides and fertilizers instead of man-made, making the GBI low human-intensive which will lead to the GBI on a sustainable path.
4.2 Ternary diagram
A ternary phase diagram is a graphical representation that illustrates the relationships between three components in a system and their corresponding phases or compositions at various conditions. Ternary phase diagrams have numerous benefits in various fields, including chemistry, material science, geology, and environmental science. These benefits extend beyond just understanding phase transitions and can be applied to the assessment of ecosystem services, disservices, and their impacts.
Figure 3A, illustrates the emergy values of ESs (including NPP), EDs, and costs, showing that street tree, bioretention pond, green roof, CW, and sunken GS represent maximum benefits of 54.12, 46.56, 41.12, 40.37, and 39.00%, respectively, compared to costs and impacts. In contrast, Figure 3B which excludes NPP, indicates that bioretention ponds, green roofs, constructed wetlands, and sunken green spaces incur the highest costs 85.30, 68.66, 65.87, and 60.04%, respectively compared to their impacts and benefits.
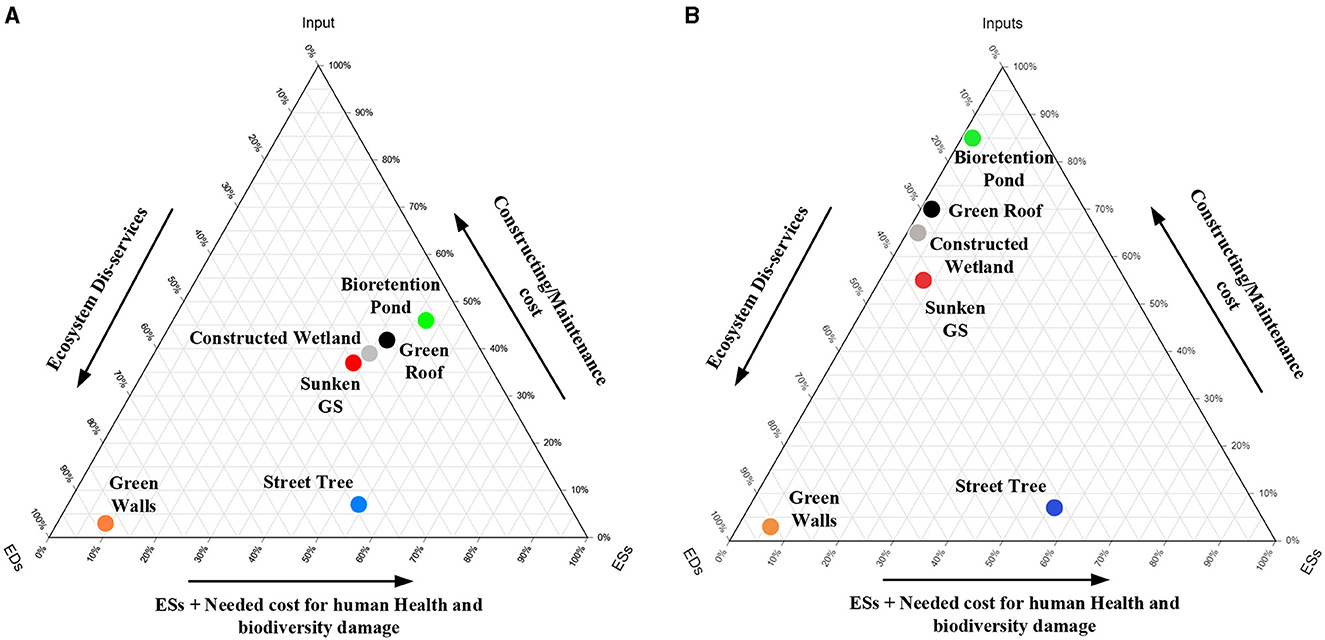
Figure 3. (A) Ternary diagram of different green-blue infrastructure (with NPP; Input, construction/maintenance cost; EDs, ecosystem disservices; ESs, ecosystem services). (B) Ternary diagram of different green-blue infrastructure (without NPP; Input, construction/maintenance cost; EDs, ecosystem disservices; ESs, ecosystem services).
By comparing both ternary Figures 3A, B, it becomes evident that NPP plays a critical role in the overall assessment of GBIs. When NPP is excluded, certain infrastructures appear more costly and less efficient, while its inclusion highlights their broader ecological contributions, making them more favorable for sustainable urban development.
The analysis of both Figures 3A, B reveals that the cost of implementing street trees remains notably lower (~7.36 and 6.91%) than their accrued benefits, even when compared with other GBI construction expenses. Similarly, the cost of constructing green wall is relatively low, but the impacts are so high (89 and 91%, respectively), maybe green walls often involve more complex structures and are exposed to different environmental conditions than street trees. Factors like wind, sunlight exposure, and water drainage can impact the structural integrity and longevity of green walls, potentially leading to higher repair and replacement costs over time. Additionally, both diagrams underscore the urban street tree infrastructure's favorable characteristics, rendering it a more favorable and sustainable choice for urban development in contrast to alternative GBI. As such, we advocate for policymakers and urban administrators to prioritize the incorporation of street trees within urban zones. This recommendation stems from the realization that street trees not only generate substantial benefits but also necessitate comparatively lower investments, making them a judicious urban development strategy.
5 Conclusions
The GBI Research has been challenging and gives a great room of chances for scientists for upcoming research. The study reviews the scientific literature regarding the multiple benefits and drawbacks of urban small green-blue ecosystems. The study then aims to develop an urban small green-blue ESs valuation accounting approach to provide the basis for green-blue ecosystems preservation and management. Urban green-blue ecosystems ESs valuation accounting approach, based on emergy analysis, is suggested to overcome the limitations of current measurements and to fill the research gap on the lack of systematic urban ESs valuation methods. This approach includes the application of a green-blue ecosystems classification, which classify into ESs, needed cost for human health and biodiversity damage, construction/maintenance cost, and ecosystem dis-services.
In all green-blue infrastructures, carbon sequestration is the most important service produced in Beijing, China (among other evaluated services). Moreover, the results also suggest that GRs provide a superior array of ESs compared to street trees, bioretention ponds, etc. Nevertheless, the findings also indicate that GRs have a higher initial construction cost, because of substantial inputs needed for construction and maintenance, such as growing media, drainage layers, plants, and consistent irrigation. These resources are essential for creating a functional green roof, representing a significant investment. In contrast, natural ecosystems like wetlands require far fewer inputs, often needing only seeds for vegetation, as the ecosystem provides water and soil. This results in much lower upfront costs. Additionally, street trees exhibit fewer benefits relative to the other three GBIs, while their associated costs and impacts are notably lower. Similarly, the ternary diagram illustrates the advantageous attributes of urban street tree infrastructure, making it a more sustainable and preferable option for urban development. The method developed in this study can increase the policy coherence to ensure that synergies and trade-offs between cost, ESs, and dis-services, which are taken into account both in the development and implementation of strategies, policies, and investment at the urban scale. The development of non-monetary approaches, robust analytical methods, and reliable data sets is a critical step toward approaching the urban green-blue systems and should therefore be focused on.
But still, there are some limitations in the current research due to incomplete data and urban green-blue infrastructure management problems. For example, some ESs and dis-services were not measured because of a lack of data such as biodiversity, risk of fire damages etc. In the future studies may face data shortages to ensure the evaluation of more complete services. Therefore, this technique might be a first footstep toward fulfilling the requirement for a biophysical-accounting method to value urban street trees, GRs, bioretention pond, constructed wetland, green walls, and sunken GS services.
Further, GBI is viewed as a promising solution for pollution control, and its best management practices offer various socio-economic and ecological benefits, but several factors (e.g., high initial construction costs, lack of awareness about GBI construction methods, and ongoing maintenance expenses) still hinder its implementation in underdeveloped countries. Addressing these challenges should be a priority in the future. Besides, most of the research has been done in cold regions as compared to hot regions. So, there is a need to choose suitable plants for the better performance of green infrastructure in hot and cold regions. Moreover, new and innovative infrastructure technology designs should be applied to all locations (e.g., street trees, green roofs, and sunken GS) for getting more synergetic benefits.
Data availability statement
The original contributions presented in the study are included in the article/Supplementary material, further inquiries can be directed to the corresponding author.
Author contributions
AS: Conceptualization, Data curation, Formal analysis, Investigation, Methodology, Resources, Software, Validation, Visualization, Writing – original draft, Writing – review & editing. GL: Conceptualization, Data curation, Funding acquisition, Investigation, Methodology, Project administration, Supervision, Validation, Visualization, Writing – original draft, Writing – review & editing. AN: Resources, Software, Validation, Writing – original draft. HL: Data curation, Investigation, Visualization, Writing – original draft. DX: Data curation, Formal analysis, Methodology, Writing – original draft. FY: Investigation, Software, Validation, Writing – original draft. QY: Methodology, Resources, Writing – original draft. LZ: Funding acquisition, Project administration, Validation, Writing – original draft.
Funding
The author(s) declare financial support was received for the research, authorship, and/or publication of this article. This work was supported by the National Science Fund for Distinguished Young Scholars (No. 52225902), National Natural Science Foundation of China (No. 52430003), Research project of Hainan National Park Research Institute (KY-23ZK02), and the Fundamental Research Funds for the Central Universities.
Conflict of interest
The authors declare that the research was conducted in the absence of any commercial or financial relationships that could be construed as a potential conflict of interest.
The author(s) declared that they were an editorial board member of Frontiers, at the time of submission. This had no impact on the peer review process and the final decision.
Publisher's note
All claims expressed in this article are solely those of the authors and do not necessarily represent those of their affiliated organizations, or those of the publisher, the editors and the reviewers. Any product that may be evaluated in this article, or claim that may be made by its manufacturer, is not guaranteed or endorsed by the publisher.
Supplementary material
The Supplementary Material for this article can be found online at: https://www.frontiersin.org/articles/10.3389/frsc.2024.1453829/full#supplementary-material
References
Aylor, D. (1972). Noise reduction by vegetation and ground. J. Acoust. Soc. Am. 51, 197–205. doi: 10.1121/1.1912830
Blanco, J., Dendoncker, N., Barnaud, C., and Sirami, C. (2019). Ecosystem disservices matter: towards their systematic integration within ecosystem service research and policy. Ecosyst. Serv. 36:100913. doi: 10.1016/j.ecoser.2019.100913
Boyd, J., and Banzhaf, S. (2007). What are ecosystem services? The need for standardized environmental accounting units. Ecol. Econ. 63, 616–626. doi: 10.1016/j.ecolecon.2007.01.002
Breuning, J. (2008). “Fire and wind on extensive green roofs,” in Proceedings of the Sixth Annual Greening Rooftops for Sustainable Communities Conference Awards and Trade Show 2008 Conference Proceedings (Baltimore), 1–6.
Brown, M. T., and Ulgiati, S. (2004). Energy quality, emergy, and transformity: HT Odum's contributions to quantifying and understanding systems. Ecol. Model. 178, 201–213. doi: 10.1016/j.ecolmodel.2004.03.002
Brown, M. T., and Ulgiati, S. (2011). Understanding the global economic crisis: a biophysical perspective. Ecol. Model. 223, 4–13. doi: 10.1016/j.ecolmodel.2011.05.019
Chaparro, L., and Terradas, J. (2009). Ecological Services of Urban Forest in Barcelona. Barcelona: Institut Municipal de Parcs i Jardins Ajuntament de Barcelona, Àrea de Medi Ambient.
Chapin, F. S., and Eviner, V. T. (2007). “Biogeochemistry of terrestrial net primary production,” in Treatise on Geochemistry, eds. H. D. Holland and K. K. Turekian (Oxford: Pergamon), 1–35.
Co Sydney (2019). Green Roof Design Resource Manual. Sydney, NSW: City of Sydney: Sydney City Council Green Roof Resource Manual.
da Silva Pereira, P. A., Inácio, M., Karnauskaite, D., Bogdzevič, K., Gomes, E., Kalinauskas, M., et al. (2022). “Nature-based solutions impact on urban environment chemistry: air, soil, and water,” in Nature-Based Solutions for Flood Mitigation: Environmental and Socio-Economic Aspects: [Monograph], eds. C. S. S. Ferreira, Z. Kalantari, T. Hartmann, and P. Pereira (Cham: Springer International Publishing), 760
Díaz, S., Pascual, U., Stenseke, M., Martín-López, B., Watson, R. T., Molnár, Z., et al. (2018). RE: Shifts, Drifts and Options-A Response to Faith. Leiden University: Science.
Duan, N., Liu, X. D., Dai, J., Lin, C., Xia, X.-H., Gao, R. Y., et al. (2011). Evaluating the environmental impacts of an urban wetland park based on emergy accounting and life cycle assessment: a case study in Beijing. Ecol. Model. 222, 351–359. doi: 10.1016/j.ecolmodel.2010.08.028
Escobedo, F. J., Kroeger, T., and Wagner, J. E. (2011). Urban forests and pollution mitigation: analyzing ecosystem services and disservices. Environ. Pollut. 159, 2078–2087. doi: 10.1016/j.envpol.2011.01.010
European Commission (2013). Green Infrastructure (GI)—Enhancing Europe's Natural Capital. Communication from the Commission to the European Parliament the Council, the European Economic and Social Committee and the Committee of the Regions, COM (2013). 249 Final. Brussels: European Commission.
European Commission (2015). Towards an EU Research and Innovation policy agenda for Nature-Based Solutions and Re-Naturing Cities. Final Report of the Horizon 2020 Expert Group on “Nature-Based Solutions and Re-Naturing Cities” (Full Version). Brussels: European Commission.
European Commission (2021). Global Soil Erosion. GLoSEM—Glonal Soil Erosion Modelling platform. Available at: https://esdac.jrc.ec.europa.eu/themes/global-soil-erosion (accessed July 10, 2023).
Fang, C. F., and Ling, D. L. (2003). Investigation of the noise reduction provided by tree belts. Landsc. Urb. Plan. 63, 187–195. doi: 10.1016/S0169-2046(02)00190-1
Franzese, P. P., Buonocore, E., Donnarumma, L., and Russo, G. F. (2017). Natural capital accounting in marine protected areas: the case of the Islands of Ventotene and S. Stefano (Central Italy). Ecol. Model. 360, 290–299. doi: 10.1016/j.ecolmodel.2017.07.015
Goedkoop, M., Heijungs, R., Huijbregts, M., De Schryver, A., Struijs, J., and van Zelm, R. (2009). ReCiPe 2008: A Life Cycle Impact Assessment Method Which Comprises Harmonised Category Indicators at the Midpoint and Endpoint Levels. 1st Edn. Report I: Characterization, The Netherlands: Ruimte en Milieu, Ministerie van Volkshuisvesting, Ruimtelijke Ordening en Milieubeheer. Amersfoort: Ruimte en Milieu, Ministerie van Volkshuisvesting, Ruimtelijke Ordening en Milieubeheer (VROM).
Goedkoop, M., and Spriensma, R. (2001). The Eco-indicator 99: A Damage Oriented Method for Life Cycle Impact Assessment. Methodology Report, 3rd Edn. Amersfoort: Pré Consultants B.V.
Gómez-Baggethun, E., and Barton, D. N. (2013). Classifying and valuing ecosystem services for urban planning. Ecol. Econ. 86, 235–245. doi: 10.1016/j.ecolecon.2012.08.019
Gómez-Baggethun, E., Gren, Å., Barton, D. N., Langemeyer, J., McPhearson, T., O'farrell, P., et al. (2013). “Urban ecosystem services,” in Urbanization, Biodiversity and Ecosystem Services: Challenges and Opportunities, eds. T. Elmqvist, M. Fragkias, J. Goodness, B. Güneralp, P. J. Marcotullio, R. I. McDonald, S. Parnell, M. Schewenius, M. Sendstad, K. C. Seto, C. Wilkinson (Dordrecht: Springer), 175–251.
Greenhalgh, S., Samarasinghe, O., Curran-Cournane, F., Wright, W., and Brown, P. (2017). Using ecosystem services to underpin cost-benefit analysis: is it a way to protect finite soil resources? Ecosyst. Serv. 27, 1–14. doi: 10.1016/j.ecoser.2017.07.005
Haase, D., Larondelle, N., Andersson, E., Artmann, M., Borgström, S., Breuste, J., et al. (2014). A quantitative review of urban ecosystem service assessments: concepts, models, and implementation. AMBIO 43, 413–433. doi: 10.1007/s13280-014-0504-0
Haines-Young, R., and Potschin, M. B. (2018). Common International Classification of Ecosystem Services (CICES) V5.1 and Guidance on the Application of the Revised Structure. Nottingham: Fabis Consulting Ltd.
Hammer, D. A. (1989). Constructed Wetlands for Wastewater Treatment (Chelsea, MI: Lewis Publishers), 702–709.
Hasan, M. M., and Rahman, M. M. (2017). Performance and emission characteristics of biodiesel-diesel blend and environmental and economic impacts of biodiesel production: a review. Renew. Sustain. Energy Rev. 74, 938–948. doi: 10.1016/j.rser.2017.03.045
Hatt, B. E., Fletcher, T. D., and Deletic, A. (2007). Treatment performance of gravel filter media: implications for design and application of stormwater infiltration systems. Water Res. 41, 2513–2524. doi: 10.1016/j.watres.2007.03.014
Häyhä, T., and Franzese, P. P. (2014). Ecosystem services assessment: a review under an ecological-economic and systems perspective. Ecol. Model. 289, 124–132. doi: 10.1016/j.ecolmodel.2014.07.002
Hoek, G., Krishnan, R. M., Beelen, R., Peters, A., Ostro, B., Brunekreef, B., et al. (2013). Long-term air pollution exposure and cardio- respiratory mortality: a review. Environ. Health 12:43. doi: 10.1186/1476-069X-12-43
Huijbregts, M. A. J., Steinmann, Z. J. N., Elshout, P. M. F., Stam, G., Verones, F., Vieira, M. D. M., et al. (2017). ReCiPe 2016 v1.1: A Harmonized Life Cycle Impact Assessment Method at Midpoint and Endpoint Level. Report I: Characterization. RIVM Report 2016-0104. Bilthoven: National Institute for Public Health and the Environment.
IPCC (2013). Climate Change: The Physical Science Basis. Stockholm: Intergovernmental Panel on Climate Change.
Irwin, N. B., Irwin, E. G., Martin, J. F., and Aracena, P. (2018). Constructed wetlands for water quality improvements: benefit transfer analysis from Ohio. J. Environ. Manag. 206, 1063–1071. doi: 10.1016/j.jenvman.2017.10.050
Keeler, B. L., Hamel, P., McPhearson, T., Hamann, M. H., Donahue, M. L., Meza Prado, K. A., et al. (2019). Social-ecological and technological factors moderate the value of urban nature. Nat. Sustainabil. 2, 29–38. doi: 10.1038/s41893-018-0202-1
Knight, R. L., Walton, W. E., O'Meara, G. F., Reisen, W. K., and Wass, R. (2003). Strategies for effective mosquito control in constructed treatment wetlands. Ecol. Eng. 21, 211–232. doi: 10.1016/j.ecoleng.2003.11.001
Kragh, J. (1981). Road traffic noise attenuation by belts of trees. J. Sound Vibr. 74, 235–241. doi: 10.1016/0022-460X(81)90506-X
Kruize, H., van Der Vliet, N., Staatsen, B., Bell, R., Chiabai, A., Muiños, G., et al. (2019). Urban green space: creating a triple win for environmental sustainability, health, and health equity through behavior change. Int. J. Environ. Res. Publ. Health 16:4403. doi: 10.3390/ijerph16224403
Lara, B., Rojo, J., Fernández-González, F., and Pérez-Badia, R. (2019). Prediction of airborne pollen concentrations for the plane tree as a tool for evaluating allergy risk in urban green areas. Landsc. Urb. Plan. 189, 285–295. doi: 10.1016/j.landurbplan.2019.05.002
Liu, G., Yang, Z., Chen, B., and Ulgiati, S. (2011). Monitoring trends of urban development and environmental impact of Beijing, 1999–2006. Sci. Tot. Environ. 409, 3295–3308. doi: 10.1016/j.scitotenv.2011.05.045
Livesley, S. J., McPherson, E. G., and Calfapietra, C. (2016). The urban forest and ecosystem services: impacts on urban water, heat, and pollution cycles at the tree, street, and city scale. J. Environ. Qual. 45, 119–124. doi: 10.2134/jeq2015.11.0567
Lyytimäki, J., and Sipilä, M. (2009). Hopping on one leg-The challenge of ecosystem disservices for urban green management. Urb. For. Urb. Green. 8, 309–315. doi: 10.1016/j.ufug.2009.09.003
Manso, M., Teotónio, I., Silva, C. M., and Cruz, C. O. (2021). Green roof and green wall benefits and costs: a review of the quantitative evidence. Renew. Sustain. Energy Rev. 135:110111. doi: 10.1016/j.rser.2020.110111
Mellino, S., Buonocore, E., and Ulgiati, S. (2015). The worth of land use: a GIS-emergy evaluation of natural and human-made capital. Sci. Tot. Environ. 506, 137–148. doi: 10.1016/j.scitotenv.2014.10.085
Meng, F., Yuan, Q., Bellezoni, R. A., de Oliveira, J. A. P., Cristiano, S., Shah, A. M., et al. (2023). Quantification of the food-water-energy nexus in urban green and blue infrastructure: a synthesis of the literature. Resour. Conserv. Recycl. 188:106658. doi: 10.1016/j.resconrec.2022.106658
Netherlands Environmental Assessment Agency (2018). The Geography of Future Water Challenges. The Hauge: Netherlands Environmental Assessment Agency.
Odum, H. T. (1996). Enviromental Accounting: Emergy and Enviromental Decision Making. New York, NY: Wiley.
Peng, L. L., and Jim, C. Y. (2015). Economic evaluation of green-roof environmental benefits in the context of climate change: the case of Hong Kong. Urb. For. Urb. Green. 14, 554–561. doi: 10.1016/j.ufug.2015.05.006
Powlen, J. S., Bigelow, C. A., Patton, A. J., Jiang, Y., and Fraser, M. L. (2021). Minimal irrigation requirements of Kentucky bluegrass and tall fescue blends in the northern transition zone. Crop Sci. 61, 2939–2948. doi: 10.1002/csc2.20340
Prudencio, L., and Null, S. E. (2018). Stormwater management and ecosystem services: a review. Environ. Res. Lett. 13:e033002. doi: 10.1088/1748-9326/aaa81a
Pulselli, R. M., Pulselli, F. M., Mazzali, U., Peron, F., and Bastianoni, S. (2014). Emergy based evaluation of environmental performances of Living Wall and Grass Wall systems. Energy Build. 73, 200–211. doi: 10.1016/j.enbuild.2014.01.034
Roy, S., Byrne, J., and Pickering, C. (2012). A systematic quantitative review of urban tree benefits, costs, and assessment methods across cities in different climatic zones. Urb. For. Urb. Green. 11, 351–363. doi: 10.1016/j.ufug.2012.06.006
Saco, P. M., McDonough, K. R., Rodriguez, J. F., Rivera-Zayas, J., and Sandi, S. G. (2021). The role of soils in the regulation of hazards and extreme events. Philos. Trans. Royal Soc. B Biol. Sci. 376:20200178. doi: 10.1098/rstb.2020.0178
Sandbrook, C., and Burgess, N. D. (2015). Biodiversity and Ecosystem Services: Not All Positive. doi: 10.1016/j.ecoser.2014.12.006
Schlea, D., Martin, J. F., Ward, A. D., Brown, L. C., and Suter, S. A. (2014). Performance and water table responses of retrofit rain gardens. J. Hydrol. Eng. 19:e05014002. doi: 10.1061/(ASCE)HE.1943-5584.0000797
Shah, A. M., Liu, G., Chen, Y., Yang, Q., Yan, N., Agostinho, F., et al. (2023). Urban constructed wetlands: assessing ecosystem services and disservices for safe, resilient, and sustainable cities. Front. Eng. Manag. 10, 582–596. doi: 10.1007/s42524-023-0268-y
Shah, A. M., Liu, G., Huo, Z., Yang, Q., Zhang, W., Meng, F., et al. (2022). Assessing environmental services and disservices of urban street trees. An application of the emergy accounting. Resour. Conserv. Recycl. 186:106563. doi: 10.1016/j.resconrec.2022.106563
Shah, A. M., Liu, G., Meng, F., Yang, Q., Xue, J., Dumontet, S., et al. (2021). A review of urban green and blue infrastructure from the perspective of food-energy-water nexus. Energies 14:4583. doi: 10.3390/en14154583
Shah, A. M., Liu, G., and Zhang, W. (2020). “Integrated ecological effects of urban green-blue infrastructure: from the perspective of food-energy-water nexus,” in Proceedings of the 12th International Conference on Applied Energy, Vol. 508. Bangkok.
Shareef, S. (2022). The influence of greenery and landscape design on solar radiation and UHI mitigation: a case study of a boulevard in a hot climate. World 3, 175–205. doi: 10.3390/world3020010
Song, X., Lv, X., and Li, C. (2015). Willingness and motivation of residents to pay for conservation of urban green spaces in Jinan, China. Acta Ecol. Sin. 35, 89–94. doi: 10.1016/j.chnaes.2015.06.003
Standard AAAN (2017). ANSI/SPRI VF-1 External Fire Design Standard for Vegetative Roofs. Waltham: SPRI.
Stolaroff, J. K., Samaras, C., O'Neill, E. R., Lubers, A., Mitchell, A. S., and Ceperley, D. (2018). Energy use and life cycle greenhouse gas emissions of drones for commercial package delivery. Nat. Commun. 9, 1–13. doi: 10.1038/s41467-017-02411-5
Tahvonen, O. (2018). Adapting bioretention construction details to local practices in Finland. Sustainability 10:276. doi: 10.3390/su10020276
Thompson, R. (2018). Evaluating the Benefits, Sustainability, and Resilience of Green Infrastructure on a Sustainable Residential Home (Ph.D. Thesis). University of Maryland, College Park, MD, United States.
Tian, Y., Wu, H., Zhang, G., Wang, L., Zheng, D., and Li, S. (2020). Perceptions of ecosystem services, disservices and willingness-to-pay for urban green space conservation. J. Environ. Manag. 260:110140. doi: 10.1016/j.jenvman.2020.110140
Toronto and Region Conservation (2007). An Economic Analysis of Green Roofs: Evaluating the Costs and Savings to Building Owners in Toronto and Surrounding Regions. Toronto, ON: Toronto and Region Conservation.
United Nations (2015). Transforming Our World: the 2030 Agenda for Sustainable Development. A/RES/70/1. New York, NY: United Nations.
United Nations (2017). New Urban Agenda. A/RES/71/256. Quito: United Nations, Habitat III Secretariat.
United Nations (2018). Department of Economic and Social Affairs. Available at: https://www.un.org/development/desa/en/news/population/2018-revision-of-world-urbanization-prospects.html (assessed September 20, 2024).
von Döhren, P., and Haase, D. (2019). Risk assessment concerning urban ecosystem disservices: the example of street trees in Berlin, Germany. Ecosyst. Serv. 40:101031. doi: 10.1016/j.ecoser.2019.101031
Wang, H. X., Xu, J. L., Sheng, L. X., and Liu, X. J. (2018). “A review of research on substrate materials for constructed wetlands,” in Materials Science Forum, Vol. 913 (Trans Tech Publications Ltd), 917–929.
Weeks, J. J., Hettiarachchi, G. M., Santos, E., and Tatarko, J. (2021). Potential human inhalation exposure to soil contaminants in urban gardens on brownfields sites: a breath of fresh air? J. Environ. Qual. 50, 782–790. doi: 10.1002/jeq2.20208
WHO and UN-Habitat (2016). Global Report on Urban Health: Equitable Healthier Cities for Sustainable Development. Geneva: World Health Organization. Available at: https://apps.who.int/iris/handle/10665/204715 (accessed June 20, 2023).
Wong, T. W., Good, J. E. G., and Denne, M. P. (1988). Tree root damage to pavements and kerbs in the city of Manchester. Arboricult. J. 12, 17–34.
Xu, Z. X., Zhang, L., and Ruan, B. Q. (2006). Analysis on the spatio-temporal distribution of precipitation in Beijing. Arid. Land George 29, 186–192.
Zhang, X., Mi, F., Lu, N., Yan, N., Kuglerova, L., Yuan, S., et al. (2017). Green space water use and its impact on water resources in the capital region of China. Phys. Chem. Earth A/B/C 101, 185–194. doi: 10.1016/j.pce.2017.02.001
Keywords: green and blue infrastructure, costs, ecosystem services, dis-services, emergy
Citation: Shah AM, Liu G, Nawab A, Li H, Xu D, Yeboah FK, Yang Q and Zhang L (2024) Sustainability and resilience interface at typical urban green and blue infrastructures: costs, benefits, and impacts assessment. Front. Sustain. Cities 6:1453829. doi: 10.3389/frsc.2024.1453829
Received: 24 June 2024; Accepted: 30 September 2024;
Published: 15 October 2024.
Edited by:
Feni Agostinho, Paulista University, BrazilReviewed by:
Giuliana Ansanelli, Italian National Agency for New Technologies, Energy and Sustainable Economic Development (ENEA), ItalyElliott Thomas Campbell, Maryland Department of Natural Resources, United States
Copyright © 2024 Shah, Liu, Nawab, Li, Xu, Yeboah, Yang and Zhang. This is an open-access article distributed under the terms of the Creative Commons Attribution License (CC BY). The use, distribution or reproduction in other forums is permitted, provided the original author(s) and the copyright owner(s) are credited and that the original publication in this journal is cited, in accordance with accepted academic practice. No use, distribution or reproduction is permitted which does not comply with these terms.
*Correspondence: Gengyuan Liu, bGl1Z2VuZ3l1YW5AYm51LmVkdS5jbg==