 Shanaka Herath
 Elizelle Juanee Cilliers
 Eveline Mussi
- 1School of Built Environment, Faculty of Design Architecture and Building, University of Technology Sydney, Ultimo, NSW, Australia
- 2Unit for Environmental Sciences and Management, North-West University, Potchefstroom, South Africa
Climate change generates multiple negative impacts for cities, such as the urban heat island effect. Social stresses, including social disadvantage and housing unaffordability, compound the poor living conditions of urban residents and make our cities less resilient. This paper considers a climate event (urban heat) and social stresses (housing affordability and urban disadvantage) to explore urban resilience in Sydney. We draw on a framework for building urban climate resilience, incorporating facets of urban resilience, social stresses that amplify crises, and solutions that strengthen individuals and communities with coping abilities to withstand climate events. The study diverges from aggregate city-level analyses that hide small-area differences in climate impacts and vulnerability. The findings reveal the spatiality of these natural and social impacts, identifying 11 critical areas in Sydney impacted by the highest levels of urban heat and urban disadvantage, and two critical areas impacted by the highest levels of urban heat and housing unaffordability. We highlight the importance of context-based approaches and place-based policies to address climate risks and social vulnerabilities on the path toward creating more resilient cities.
1 Introduction
Cities attract economic agglomeration and population growth, building on the benefits of density, proximity, and connectivity (Burdett, 2022), and the world is increasingly becoming urbanized as an estimated 1.4 million move into urban areas every week (World Bank, 2019). Cities utilize 78% of the world's energy and are responsible for the production of more than 60% of greenhouse gas emissions (United Nations, n.d.). Whilst urban areas account for 2% of the earth's surface, they are home to more than 50% of its total population. The latter accounted for only 13% in 1900 and is estimated to rise to 68% by 2050 (UN-Habitat, 2020). Urban areas are more resource-efficient, requiring less land and infrastructure to be sustainable. However, they generate a nucleus of additional challenges toward climate resilience, such as diminished biodiversity, air quality and flood resilience, increased air temperatures resulting from the urban heat island effect and even poorer physical and mental health resulting from the lack of access to nature (Piracha and Chaudhary, 2022).
The climate crisis, exemplified by the recent intensification of natural disasters including floods, bushfires, and storms, as well as other climatic events like heatwaves and rapidly rising sea levels, poses a profound existential threat to our cities and future generations. For instance, recent floods in Pakistani cities, Florida in the US, Victoria and New South Wales in Australia, and unprecedented fires on the NSW South Coast have led to a loss of human lives and inflicted substantial damage to urban infrastructure. The research evidence shows that time is running out to bend the curve of greenhouse gas emissions and prevent catastrophic global warming. One in 25 Australian properties will be effectively uninsurable by 2030, due to rising risks of extreme weather and climate change (Climate Council, 2022). In the US, more than 15% of properties in Massachusetts are at risk of flooding over the next 30 years. Boston, with the highest number of flood-prone properties, will see a 45% increase in flood risk by 2050 (Lyle and Kriesberg, 2022).
Not only are climatic hazards (flooding, heat, and drought) expected to pose an increasing threat to citizens and livelihoods, but cities' vulnerability is also being exacerbated by the social stresses that pose increasing challenges to cities worldwide. For instance, communities worldwide concurrently endure intense social stresses due to unaffordable housing (Australian Institute of Health and Welfare, 2023) and social disadvantage, affecting livability and equity in cities and urban regions, and impacting their ability to cope or adapt to climate disasters. City governments find themselves unable to provide basic services and manage risks from acute shocks and chronic stresses, leading to poor living conditions and increased crime and violence in urban areas (Byrne, 2017).
Urban resilience has taken center stage amid these great challenges. However, policy discourse and media coverage have focused predominantly on natural disasters and community resilience, particularly the resilience of infrastructure systems (Krausmann et al., 2019; Infrastructure Australia, 2021). This is because (1) investing in resilient infrastructure is considered critical for economic survival (OECD, 2017; Hallegatte et al., 2019), (2) governments have a traditional and convenient instrument in infrastructure funding (Aarhaug and Gundersen, 2017; OECD, 2021), and (3) the political popularity of infrastructure investments1 (Gupta et al., 2015; McArthur, 2017). The World Bank (2022) highlights that less attention has been given to resilient housing, albeit housing has become even more important since the onset of the COVID-19 pandemic as we live, learn, work, and spend more time in our homes. Some cities have observed the critical need for better housing and increasingly consider housing affordability as a key pillar of housing resilience (NSW Government, 2023). Moreover, the interplay between social disadvantage and urban resilience is also pertinent to achieving effective resilience outcomes. For example, Coaffee et al. (2018) put emphasis on addressing vulnerabilities such as urban disadvantage that amplify crises and erode coping abilities. Individuals experiencing extreme poverty and those disadvantaged residing in disaster-prone urban areas become increasingly vulnerable due to their limited means to cope with or adapt to such calamities.
Climate change generates multiple negative impacts for cities, such as the urban heat island effect. Social stresses, including housing unaffordability and social disadvantage, then compound the poor living conditions of urban residents and make our cities less resilient (Boschetti et al., 2017). However, the previous analyses ignore the spatial variability of these processes and the spatial relationships between these indicators from an empirical viewpoint. An aggregate city-level analysis may hide small-area differences in climate impacts and vulnerabilities (Hauer et al., 2016; Gasparrini et al., 2022) and a city-level policy may also respond to small-area level climate events and social vulnerabilities differently. We examine whether the small areas2 subjected to disruptive climate events also experience social vulnerabilities. In so doing, this paper combines three indicators measuring climate events and social stresses to explore urban resilience in Sydney. Our findings shed light on the importance of the “spatiality” of these natural and social impacts by identifying 11 critical areas in Sydney impacted by the highest levels of urban heat and urban disadvantage, and two critical areas impacted by the highest levels of urban heat and housing unaffordability.
These findings have at least two policy implications. First, the overlapping of climate events and social vulnerabilities indicates the current siloed approach to urban resilience is ineffective. In other words, rather than implementing standalone measures to mitigate climate risks, urban disadvantage and housing unaffordability, integrated solutions that strengthen resilience are required. For instance, social protection programs for the disadvantaged should provide disaster-resilient housing. Second, the accentuation of small-area differences in climate events and social vulnerabilities underscores the utility of “place-based” strategies,3 advocating for the initiation of urban resilience policies and programs in disaster-prone, low-income areas, to prioritize urgent interventions and cultivate the development of more resilient cities.
The next section sets the scene by providing a background to urban resilience and urban resilience frameworks. Section 3 discusses urban heat as a climate event and housing unaffordability and urban disadvantage as social stresses that erode the coping abilities of city dwellers. Section 4 presents the methodology, a pragmatic framework for building urban climate resilience considering the interconnections between climate events and social stresses. This section also introduces the study area and data measuring urban heat, housing affordability and urban disadvantage. The key patterns and overlaps are examined in Section 5, alongside illustrative maps showing the geographies of urban heat, housing unaffordability and urban disadvantage in Sydney. Section 6 concludes the paper with a discussion of key findings and implications.
2 Urban resilience: definitions and frameworks
2.1 Definitions of resilience
Urban resilience is a contested concept (Meerow et al., 2016). According to the World Bank Group (2016), urban resilience is “the ability of a system, entity, community, or person to adapt to a variety of changing conditions and to withstand shocks while still maintaining its essential functions” (p. 12). Similarly, Douglas and Philip (2015, p. 10) define resilience as “the capacity of a system (a city) to deal with changes and continue to develop,” further complementing that “resilience thinking is based on the belief that humans and nature are strongly coupled and should be conceived as one socio-ecological system.” Whether small or a large complex entity, resistance is associated with a coordinated “system” that is responsive and adaptive to changing circumstances.
Chandler (2014) explains that the view of resilience as a system, or as process-based, relates to a change to the classical interpretation, in which resilience refers to internalized individual abilities to resist and bounce back and regain balance after conditions of stress. Contemporary or post-classical resilience thinking is based on the idea that resilience depends not only on individual internal qualities but on conditions that promote constructive inter-relationships between individuals, communities, and the environment. As such, resilience is a systemic responsive process between internal and external factors. That is why some scholars considered an ecological perspective to explain resilience (Cadenasso and Pickett, 2012). Likewise, from an urban planning perspective, Newman et al. (2017) claim that viewing cities as an urban ecology, rather than separating their different social, economic, environmental, structural, and other elements, is fundamental for resilience. Urban ecology is based on the understanding of cities through the interaction of all living organisms (human and non-human), the environment they live in and the effect of these interactions on energy requirements, information, and other processes (Newman et al., 2017).
Also important to the post-classical interpretation of resilience is that of an evolutionary process. As such, resilience implies not only bouncing back to regain balance, as previously understood, but it is about bouncing forward and evolving from the process of responsiveness and recreation (Newman et al., 2017). Chandler (2014) remarks that such transitional or metamorphic conditions are fundamentally dependent on attributes of self-reflection and adaptability to make the most of change or crisis (or even failure), as well as creativity, flexibility, innovation, and responsive qualities of a system.
The analytical framework employed in this study (see Section 4.1) builds on the definitions that explain resilience as the capability to adapt and withstand shocks. It also aligns with the ecological perspective that identifies resilience as a system also including the environment, and the evolutionary viewpoint that entails the significance of being future-ready on the path to resilience. The former is relevant here as we contend climate events and social conditions are part of a broader resilient system. The latter perspective is forward-looking in emphasizing the importance of addressing vulnerabilities and strengthening individuals and communities with coping abilities in the process of building resilience.
2.2 Resilience frameworks
Before developing a framework to understand different facets of urban resilience, social stresses that amplify crises and erode coping abilities, and solutions that strengthen systems in Section 4.1, we review some of the existing frameworks below.
The issue of resilience is emphasized on the strength of the system being built in the five dimensions natural, economic, social, physical and institutional (Ostadtaghizadeh et al., 2015). The “physical” represents resilience in infrastructure, “natural” denotes ecological and environmental resilience, “economic” includes the development of economies and societies, “institutional” encompasses governance and mitigation policies, and “social” represents resilience of people and communities (Ribeiro and Pena Jardim Gonçalves, 2019). Some of the previous evaluations can be framed in more than one dimension or even all the five dimensions. The analysis of the literature by Ribeiro and Pena Jardim Gonçalves (2019) suggests a strong link between the institutional and social. This shows the importance of strategic and leadership structure due to the role of local authorities as the main stakeholders, and essential leadership to guide government capacities for resilience in cities.
Developing resilience requires understanding and assessing urban resilience-building measures. The essential elements of such a framework should include building awareness, coping, adaptation, and transformation (Fedele et al., 2019; World Bank, 2019):
• Building awareness by the public and private institutions as to the importance of resilience and what it takes to be resilient.
• Coping—understand the need to simply manage the difficulties when there are stresses.
• Adaptation—understand the measures to adapt to the new threats and the chronic stresses.
• Transformation—transformative impact when the city is so evolved and robust in its response to shocks and stresses that it can continue without any harm in the future.
As a system, urban resilience is not only about addressing the need for cities or of cities to withstand shocks and stress, but also about the ability of people, households, communities, and institutions to prepare for such shocks and stresses. This ability is gained through the sources of resilience (i.e., resilience capacities) that enable secure and improved wellbeing outcomes. The resilience capacities can be categorized into three groupings that reflect different dimensions of resilience (Vaughan, 2018, p. 3.):
• Absorptive resilience capacities—The ability to minimize exposure and sensitivity to shocks and stresses through preventative measures and appropriate coping strategies to avoid permanent, negative impacts. For example, disaster risk reduction, financial services, and health insurance.
• Adaptive resilience capacities—The ability to make informed choices and changes in livelihood and other strategies in response to longer-term social, economic, and environmental change. For example, income diversification, market information and trade networks.
• Transformative resilience capacities—The governance mechanisms, policies and regulations, cultural and gender norms, community networks, and formal and informal social protection mechanisms that constitute the enabling environment for systemic change. For example, infrastructure, good governance, and formal safety nets.
These capacities need to be approached in line with different characteristics of resilience. The Rockefeller Foundation (2013) identifies seven characteristics that various city systems need in order to implement resilience; that is, be: reflective, resourceful, inclusive, integrated, robust, redundant and flexible. These characteristics condition the four dimensions of a city's framework toward resilience. That is, the dimensions of leadership and governance strategies, health and wellbeing, economy and society, and infrastructure and environment, must strive to be reflective, resourceful, inclusive, and so on. The Rockefeller Foundation's framework has been widely referred to as a functional approach to encourage authorities to rethink their cities' planning and design strategies toward resilience. It also gave origin to the more recent Resilient Cities Network (RCN) when the Foundation's program closed in 2019. The RCN continues to adopt the original framework to approach urban resilience. Section 4.1 will elaborate on urban disadvantage and housing unaffordability, which undermine the above four dimensions of a resilient city, and call for action to strengthen social conditions in the path to resilience.
3 Urban climate crisis and social stresses: state of play
The United Nations Environment Program (UNEP, 2023) indicates that cities are both highly affected as well as a significant contributors to climate change. The effect and damage that climate change causes on cities have major economic and social effects, given that they comprise a high concentration of population and resource use. At the same time, urban activities are responsible for 75% of global CO2 emissions (UNEP, 2023). This was stated over a decade earlier by the Organization for Economic Co-operation and Development (OECD, 2010). However, to date, there have not been enough improvements to the conditions of cities as both a source of environmental impact and a recipient of economic and social costs associated with the climate crisis. Thus, cities continue to be the focus of attention to finding urgent solutions to the climate crisis.
3.1 Urban heat as a climate event
One of the critical effects of climate change in cities is the urban heat or urban heat island (UHI) effect. Leal Filho et al. (2018, p. 1,140) explain that “the urban heat island (UHI) effect can be defined as higher temperatures within urban areas compared to their surroundings.” Studies show that UHI is the result of urban growth, resulting in an increase in hard surface coverage with heat-absorbing materials, as well as heat production from human activities (Rizwan et al., 2008). There are many effects of UHI, impacting comfort, health, energy consumption and air and water quality, although particularly affecting human health and wellbeing (Gartland, 2008; Buchin et al., 2016). Paolini and Santamouris (2023) highlight the reality that the increase in urban heat intensity can exceed an alarming five degrees Celsius, especially in summer months, and severely impact energy demand, the concentration of harmful pollutants and rising levels of heat-related mortality and morbidity.
The C40 Cities Climate Leadership Group indicates that urban heat has a greater impact on certain sectors of the population, including those at socio-economic disadvantage, due to poor conditions of housing in urban areas, and lesser capacity to adapt and respond to critical climatic events. Leal Filho et al. (2018) explain that “a system is vulnerable if it is susceptible to the negative effects of climatic changes and unable to cope with them” (p. 1,141). They assert that there is an ever-increasing vulnerability of cities to the UHI effect, requiring urgent action to improve the resilience of urban areas. Approaching the resilience of vulnerable urban areas to the UHI effect involves first understanding where these areas are, by measuring UHI and mapping its relation to areas of greater vulnerability, of relevance here, housing unaffordability and socio-economic disadvantage, and how this should inform an urban resilience framework.
3.2 Urban disadvantage as a social stressor
Critical social stresses in specific urban areas may depend on the local context. In the state of NSW and the city of Sydney, in addition to climate change, other chronic stresses include lack of affordable housing, transport congestion, high unemployment and economic downturn (Department of Planning, Industry and Environment, 2021). The latter two could be collectively labeled as “disadvantage.” Therefore, we focus on urban disadvantage and housing unaffordability as the critical social stresses impacting resilience in Sydney.
As a social stressor, urban disadvantage refers to the situation of people in possession of relatively low material prosperity in urban areas (Randolph and Holloway, 2005). A lack of material resources may impact social participation opportunities and life outcomes. When a person lives in disadvantage, there is a chance that the person will be socially excluded as well. A “disadvantaged area” can be conceptualized in at least three different ways (Pawson and Herath, 2015): a place with a spatial concentration of “disadvantaged persons”—i.e., people experiencing poverty or deprivation; a place that inherently disadvantages its residents—e.g., due to limited access to employment, amenities, and government services; or a locality affected by high rates of social dysfunction—e.g., because of domestic violence, vandalism, and substance abuse.
The causations from susceptibility argue that if multiple demographic groups were exposed to the same climate cataclysm, the disadvantaged would suffer worse. Disadvantaged groups are less likely to have the means to change behaviors to decrease exposure. Climate events also tend to ripple into economic markets where the price of resources such as food or petrol increases, and disadvantaged groups cannot afford inflation. By nature of their status, disadvantaged groups often have less access to the resources required to recover from climate-caused tragedies. This slower rate of recovery exacerbates their “exposure” and “susceptibility,” leaving them trapped within the vulnerability cycle. There is considerable research showing that these groups are slower to recover from climate impacts than advantaged ones (Hallegatte et al., 2020). These studies point to a lack of resources (either private or public) as the leading aggravator to their adaptive recovery.
3.3 Housing unaffordability as a social stressor
Housing affordability is the relationship between housing expenditure (i.e., house price, mortgage payment, or rent) and household income. Housing unaffordability and housing stress are used interchangeably within the housing discourse to represent lower-income households that spend more than 30% of their gross income on housing costs (Parliament of Australia, 2016). Based on a more technical definition, housing stress occurs when households with the lowest 40% of income spend more than 30% of gross household income on housing costs (Australian Institute of Health and Welfare, 2021). Housing affordability can be looked at from a few different angles: housing purchase affordability (e.g., price to income ratio or PIR), housing ownership affordability (e.g., mortgage to income ratio), and rental affordability (e.g., rent to income ratio). There are other less-known indicators such as housing deposit affordability as well.
Housing affordability has become a critical issue in Australia, affecting urban productivity and social wellbeing, and The Urban Reform Institue (2022) ranked Sydney as the world's second most unaffordable housing market. Once the climate crisis deepens, the failure to provide secure and affordable housing will put the most vulnerable in our community at risk. For instance, exorbitant housing costs have resulted in families living in marginal forms of housing such as improvised dwellings, boarding houses, other temporary lodgings (e.g., caravan parks), supported accommodation for homeless people, crowded dwellings or staying temporarily with other households (Mallinson, 2019). These populations will lack the capacity and resources to respond to potential climate events. The housing and climate crises converge, especially in communities that have been denied equitable access to housing and economic opportunity.
4 Methodology, the setting, and data
4.1 A framework for building urban climate resilience
As discussed in Section 3, building awareness is needed for coping, adaptation, and transformation toward more resilient cities. Understanding housing affordability and socio-economic conditions helps assess the ability to minimize exposure and sensitivity to shocks and stresses and avoid permanent, negative impacts (i.e., absorptive resilient capacities). We investigate urban heat from this perspective, identifying the important facets of urban resilience and considering the most significant social stresses in Sydney namely urban disadvantage and housing unaffordability (see Figure 1). This enables policymakers to reflect on the interconnectedness of these different aspects from a resilience perspective. Strengthening urban systems enables improving the wellbeing and coping capabilities of residents as conditions change and new climate threats emerge (Tyler and Moench, 2012).
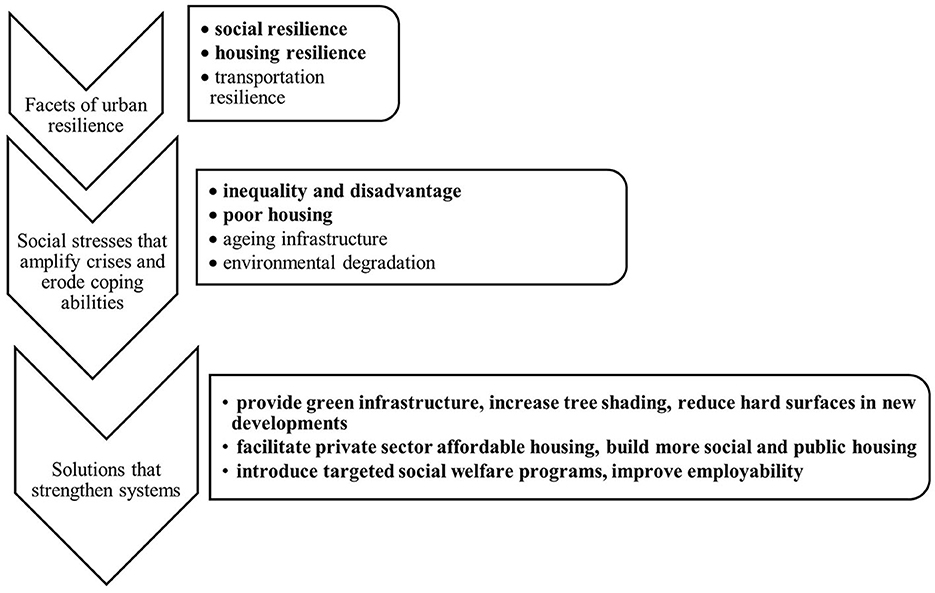
Figure 1. A framework for building urban climate resilience. Source: Author's own work based on Tyler and Moench (2012) and Coaffee et al. (2018).
This framework has practical relevance due to the increasing awareness that cities could play an essential part in guiding global urban adaptation thinking going forward, as cities have a long-standing tradition of adaptation. Cities are also known for their context-based approaches, embracing their geographical context, and accordingly dealing with their unique climate change effects and challenges (Swart et al., 2023). The nature of cities depends on aspects such as climate zones (EEA, 2020), and their landscape system (Timmermans et al., 2015). Socio-economic, cultural, and regulatory characteristics then determine their vulnerability. The geographical and socio-economic context of each city thus relates to unique climate change effects and therefore their approach to climate adaptation should be mostly context-specific (Swart et al., 2023). Climate resilience, on the urban scale, thus also implies a multi-disciplinary preparedness of the city where social, economic, and physical infrastructure culminates into a unified framework (Gunderson and Holling, 2002).
Previous studies evaluate the dimension of vulnerability to UHI, based on parameters of exposure, sensitivity, and adaptive capacity (Loughnan et al., 2013; Wolf and McGregor, 2013; Sabrin et al., 2020). However, there are many variables to this equation, and studies often take a narrower approach dismissing some of these three dimensions or interconnected elements and often focusing on short-term initiatives that are not intrinsic to urban planning and design policies. Leal Filho et al. (2018) suggest the need for short-term incentives and long-term strategies to tackle UHI vulnerability, and that its mapping and assessment can contribute to the more effective application of different intervention options, and their normalization in the development of resilient cities. The present study maps and assesses the two most significant social stresses in Sydney to contribute toward a more effective place-based application of different interventions.
4.2 The setting
The case study area is Greater Sydney (hereafter, Sydney), the largest and most populous Australian city with more than five million residents. Located on Australia's east coast, Sydney is considered Australia's commercial capital with a vibrant financial and economic center in the CBD. A renowned “world city,” Sydney contributes more than a third of Australia's total GDP (City of Sydney, 2018). Sydney draws on the benefits of density, proximity, and connectivity, and has become a productive economic agglomeration. Alongside these positive connotations, Sydney is also experiencing high population growth, exorbitant house prices and polarizing urban disadvantage.
The state of New South Wales (NSW) and Sydney City Council participate in some initiatives to build a resilient city. For instance, Sydney is part of the resilience cities network and has adopted a city-wide resilience strategy for the whole of Greater Sydney since 2018. There were three phases to the development of the strategy, including an assessment of resilience through the application of the framework, the development of the strategy, and its implementation. The strategy is structured around five directions: people-centered, living with our climate, connecting for strength, getting ready, and one city. Urban heat is a flagship action of living with our climate direction, focusing on adaptive technology, green infrastructure, and a collaborative approach to improve health, safety, and comfort (City of Sydney, 2018). The provision of affordable housing is an integral element of people-centered direction, together with transport, education, and employment opportunities. While extreme heat was recognized as Sydney's “biggest risk” (an acute shock), affordable housing was then recognized as a factor needing urgent attention in an expanding Sydney (a chronic stress). Nonetheless, we emphasize that both are intrinsically related and seldom approached together.
The chosen unit of analysis is Statistical Area Level 2 (SA2) which has a population between 3,000 and 25,000 with an average of about 10,000 people. SA2s enable the mapping of local-level geographies of urban heat, housing affordability and urban disadvantage. SA2 is designed as a “general-purpose medium-sized area … to represent a community that interacts together socially and economically” (Australian Bureau of Statistics, 2016), and it is closely synonymous with the “Australian suburb” with an intrinsic familiarity and meaning to residents and policymakers. The spatial analysis of SA2-level fine-grained information allows us to generate context-specific knowledge about the climate events and social stresses in Sydney.
4.3 Data measuring urban heat, housing affordability and urban disadvantage
We rely on a pragmatic yet meaningful indicator to measure urban heat. Australian Gridded Climate Data (AGCD) is the Bureau of Meteorology's official dataset for climate analyses covering the variable of air temperature (maximum and minimum), among others. The dataset provides consistent temporal and spatial analyses across Australia for this observed data variable. At the monthly scale, the mean monthly maximum temperature map is calculated as monthly means from the daily station maximum observations for the month, which are subsequently analyzed to a grid. The annual grids are calculated from the average of the corresponding monthly grids in a year. The mean annual maximum temperature of the closest grid point in 2016 (obtained via raster-to-point conversion) was assigned to each SA2.
In Australia, a ready-made metric is not available to measure housing affordability at the small-area level. Therefore, we developed a census-based indicator of housing affordability for localities in Australia. Specifically, housing purchase affordability was considered, and the price to income ratio (PIR)—the ratio of median household income to average median house price—was computed for 2016. The median household income data for Sydney were sourced from the ABS 2016 Census (via Census DataPacks) at the SA2 level. Average median house prices at the SA2 level were obtained from the Australian Urban Research Infrastructure Network (AURIN) as provided by Australian Property Monitors (APM). Note, the specific PIR used is not a median multiple as the annual average of monthly median prices was used to represent median house prices. Only detached house prices were used for the analysis as prices of different dwelling types could vary considerably.4
Urban disadvantage was incorporated into the analysis using a people-based approach (see Section 3.2). A widely used metric measuring “people-based social disadvantage” is the ABS census-based index of deprivation known as the Socio-Economic Indicator for Areas (SEIFA). SEIFA contains a suit of indicators measuring different aspects of disadvantage, including the Index of Relative Socio-Economic Disadvantage (IRSD)5 which is the appropriate indicator for identifying the most disadvantaged SA2s. IRSD is calculated using 16 census variables, including income, unemployment, education level, etc. This index ranks areas in Australia according to relative socio-economic disadvantage and is commonly used to determine areas that require funding and services, identify new business opportunities, and to research into the relationship between socio-economic disadvantage and various health and educational outcomes. Given our interest in exploring intracity patterns of disadvantage, the lowest quintiles of SEIFA values (thus, most disadvantaged) were computed for the Greater Sydney area.
5 Findings
5.1 The spatial patterns of urban heat, disadvantage and housing unaffordability
The quintile classification organizes the Sydney SA2s into five equal groups, considering the value for each indicator in each SA2. The lowest quintile represents the lowest fifth of the data (20%), the second quintile represents the next fifth (21–40%), etc. In the context of this analysis, it provides data classes at the extremes—lowest and highest quintiles—allowing us to identify the most affected local areas (hotspots and coldspots). Each group (or class) can also be equally represented on the maps. Overall, quintiles are useful to understand and visualize how the climate event in focus (urban heat) and the social stresses (urban disadvantage and housing unaffordability) are distributed across Sydney. The quintiles of interest here are the two highest quintiles of mean maximum temperature, the two lowest quintiles of SEIFA IRSD (measuring highest disadvantage), and the two highest quintiles of PIR (measuring highest housing unaffordability).
There are 324 SA2s in Sydney although only 306 of them are included in the analysis. This is because some SA2s do not receive a SEIFA IRSD score due to their low populations and some SA2s have not recorded a monthly median price in the AURIN dataset due to < 10 transactions over a month.
The most heat affected SA2s stretch from northwest to southwest of Sydney and include several middle and outer western Sydney areas (see Figure 2). Some key town centers of Sydney such as Penrith, Liverpool, and Campbelltown lie within or adjacent to this high-temperature zone. This is consistent with the media reporting on the issue—for instance, it was reported that some areas such as Penrith reached temperatures above 50°C in January 2020 (Thompson, 2020). The highest quintile of mean maximum temperature represents a higher population proportion (19.3%) compared to the lowest temperature quintile (16.7%)—see Table 1. The fact that higher temperatures affect more people is particularly problematic. The desired low temperature areas spread along the coastline from north of The Entrance to the Royal National Park (south of Sydney CBD) and include the Blue Mountains.
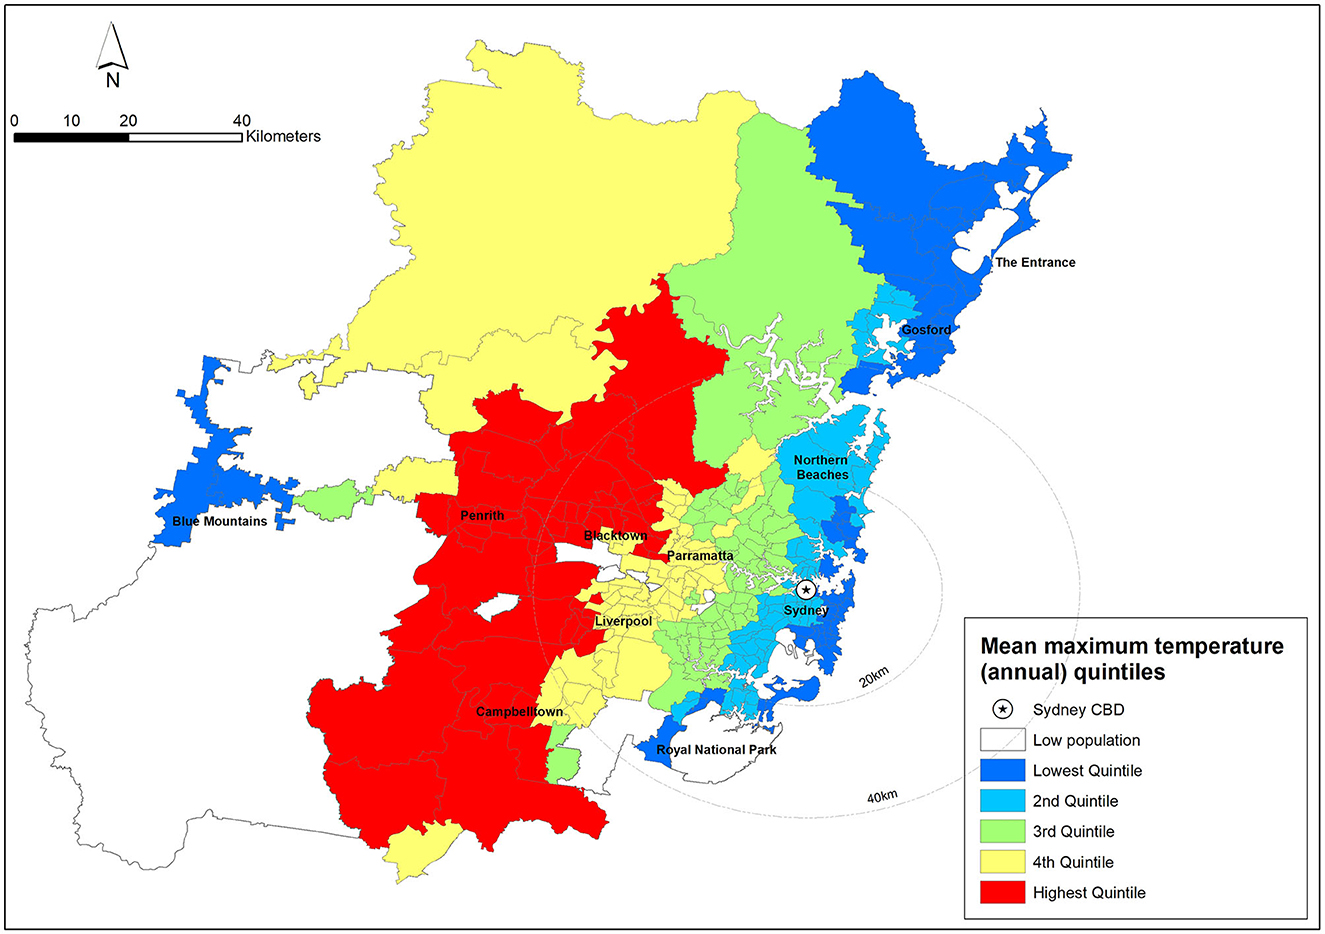
Figure 2. Mean maximum temperature (annual) quintiles, Sydney SA2s, 2016. Source: Author's own work.
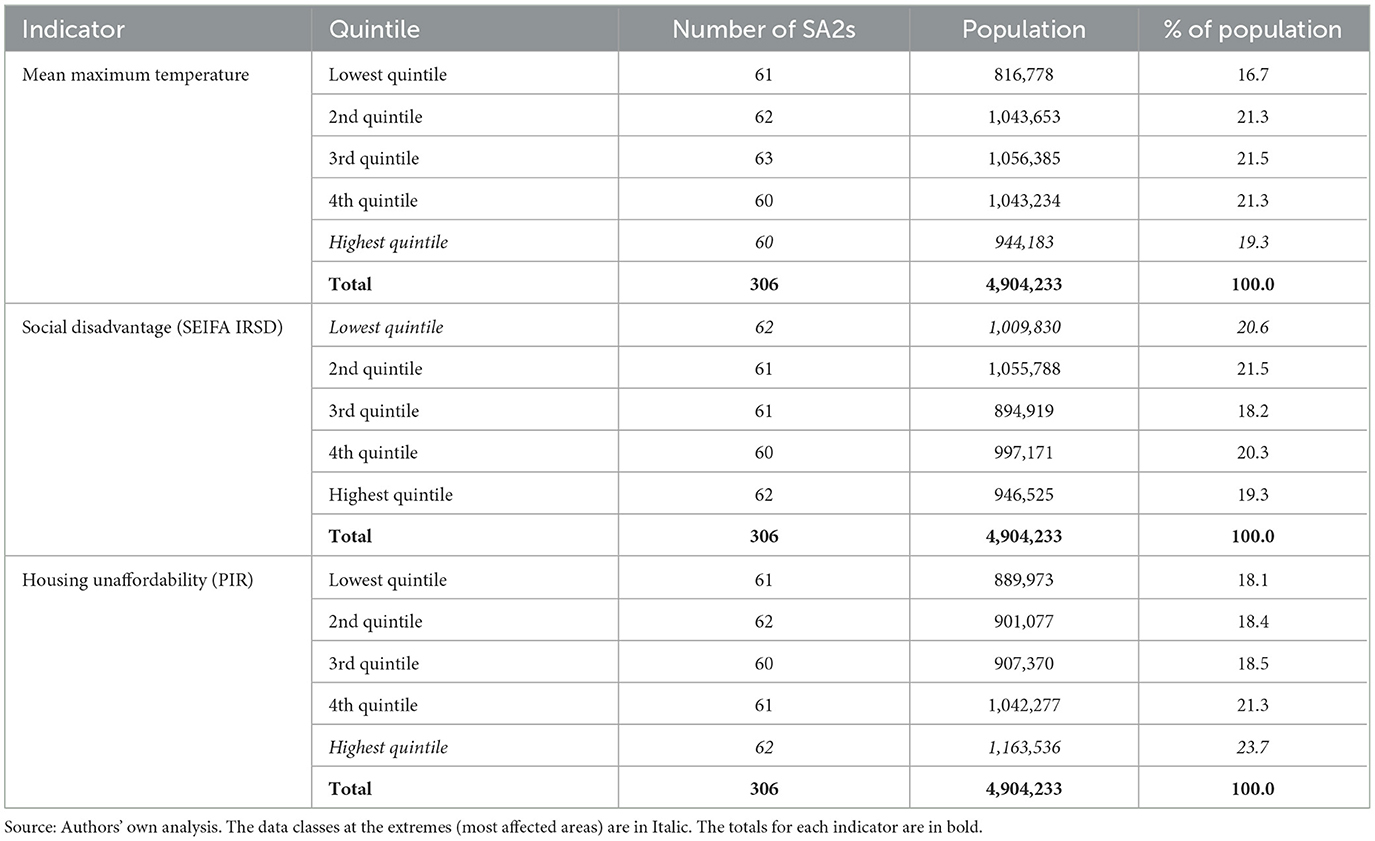
Table 1. Quintile classification summary (heat, disadvantage, and housing unaffordability).
Previous evidence supports these spatial patterns. The contiguity of natural resources and climate events can be explained by similarities of natural habitat types, topographies, and landscapes in nearby areas. For instance, Speer et al. (2023) reported that particularly Western Sydney has been significantly impacted by an increase in the intensity and frequency of urban heat effect in the last 30 years. Western Sydney has experienced significant population and urban growth and generated greater human activity and increasing areas of impermeable concrete surfaces. The often-cited reasons for higher temperatures in western Sydney are the high concentration of buildings and other “brown structures” and long distance to coastal sea breezes (Speer et al., 2023). Speer et al. (2023) point out that while Western Sydney is not the only area feeling the prejudices of urban heat associated with climate change, its population copes with a greater effect due to a combination of natural factors and air currents, while it is also home to a large proportion of Sydney's socio-economically disadvantaged population, living in poorer housing conditions, lesser green infrastructure elements, and lower resources to cope with critical climatic events; thus being a population more vulnerable to UHI effects.
Social disadvantage has also increased over the past few decades in Australian cities (Pawson and Herath, 2015). The economic concerns that followed the COVID-19 pandemic, including financial woes due to loss of jobs and income, high cost of living and energy crisis, etc. mean many urban residents experience poverty. The most disadvantaged areas represented by the lowest quintile of SEIFA IRSD are located mainly in the western and southwestern parts of Sydney (Figure 3). Other notable areas are The Entrance and Gosford. The northern and eastern parts of Sydney represent the highest quintile, meaning lowest disadvantage. These spatial patterns were expected based on the general character of these areas (Pawson and Herath, 2015). Some of the reasons for the incidence of higher disadvantage in the middle and outer suburbs in Sydney include inner city gentrification, public housing locations and affordable housing options in middle and outer areas, and the changing economic structure in Sydney where manufacturing jobs have moved to outer areas and high-paying service jobs remained in central areas (Pawson and Herath, 2015).
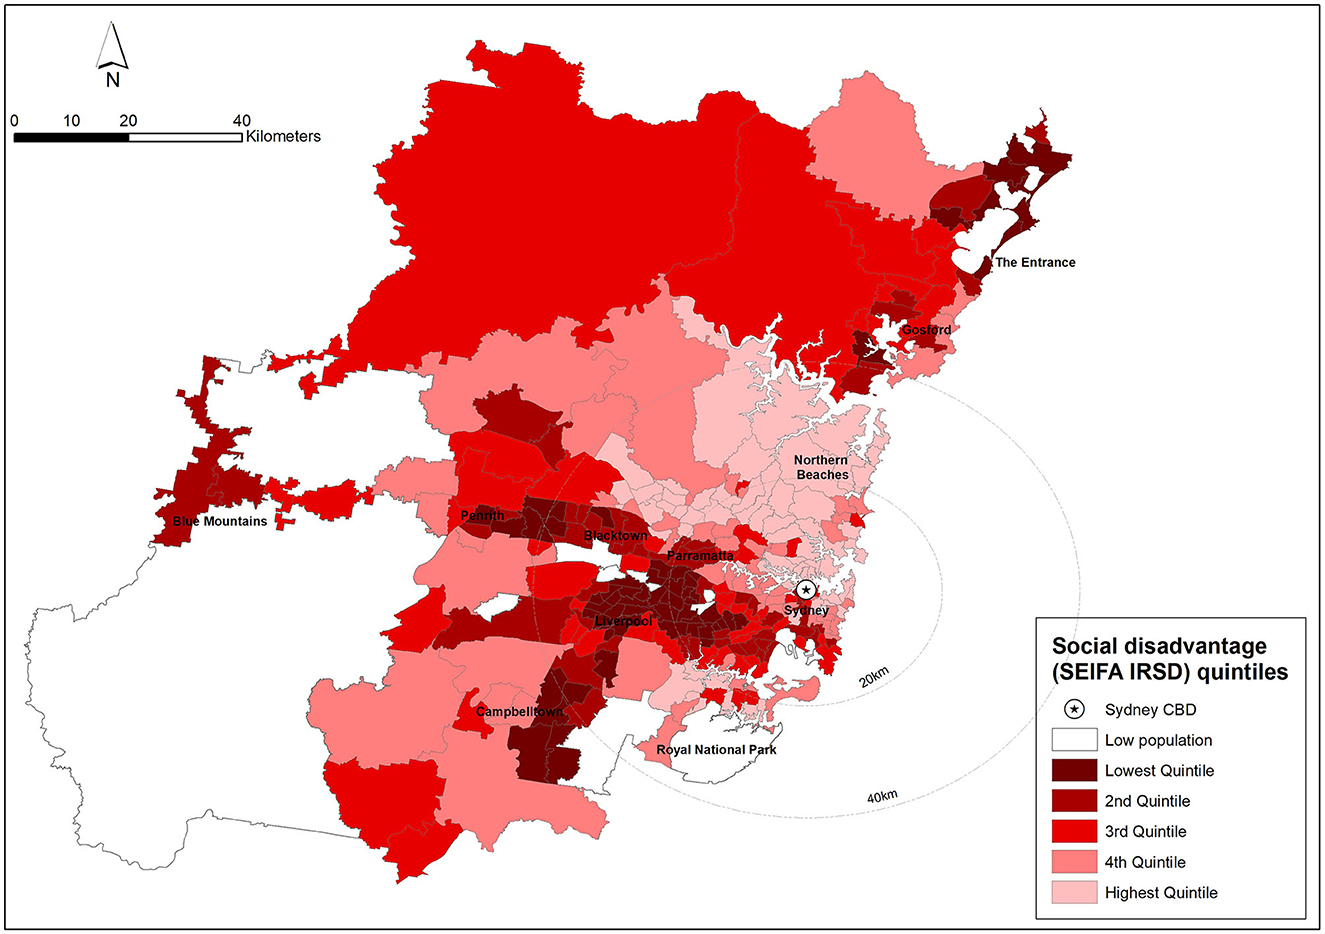
Figure 3. Social disadvantage (SEIFA IRSD) quintiles, Sydney SA2s, 2016. Source: Authors' own work.
The distribution of housing unaffordability shows many inner city SA2s have considerable affordability problems (Figure 4). There are also a few middle city areas with high unaffordability. Interestingly, Austral and Horsley Park are the only outer areas with high unaffordability which would have been caused by their proximity to the new Western Sydney Airport. This site was announced in 2014 and construction began in 2015. This suggests house prices have increased considerably relative to income in these areas. Outer areas such as Penrith (except the Penrith CBD) and Campbelltown are relatively affordable. The most plausible explanations for the contiguity of highly unaffordable housing areas are associated with the drivers of higher price premiums in inner and some middle city locations—e.g., scarcity of land, better access to employment and high-quality amenities and services (Herath and Jayasekare, 2021).
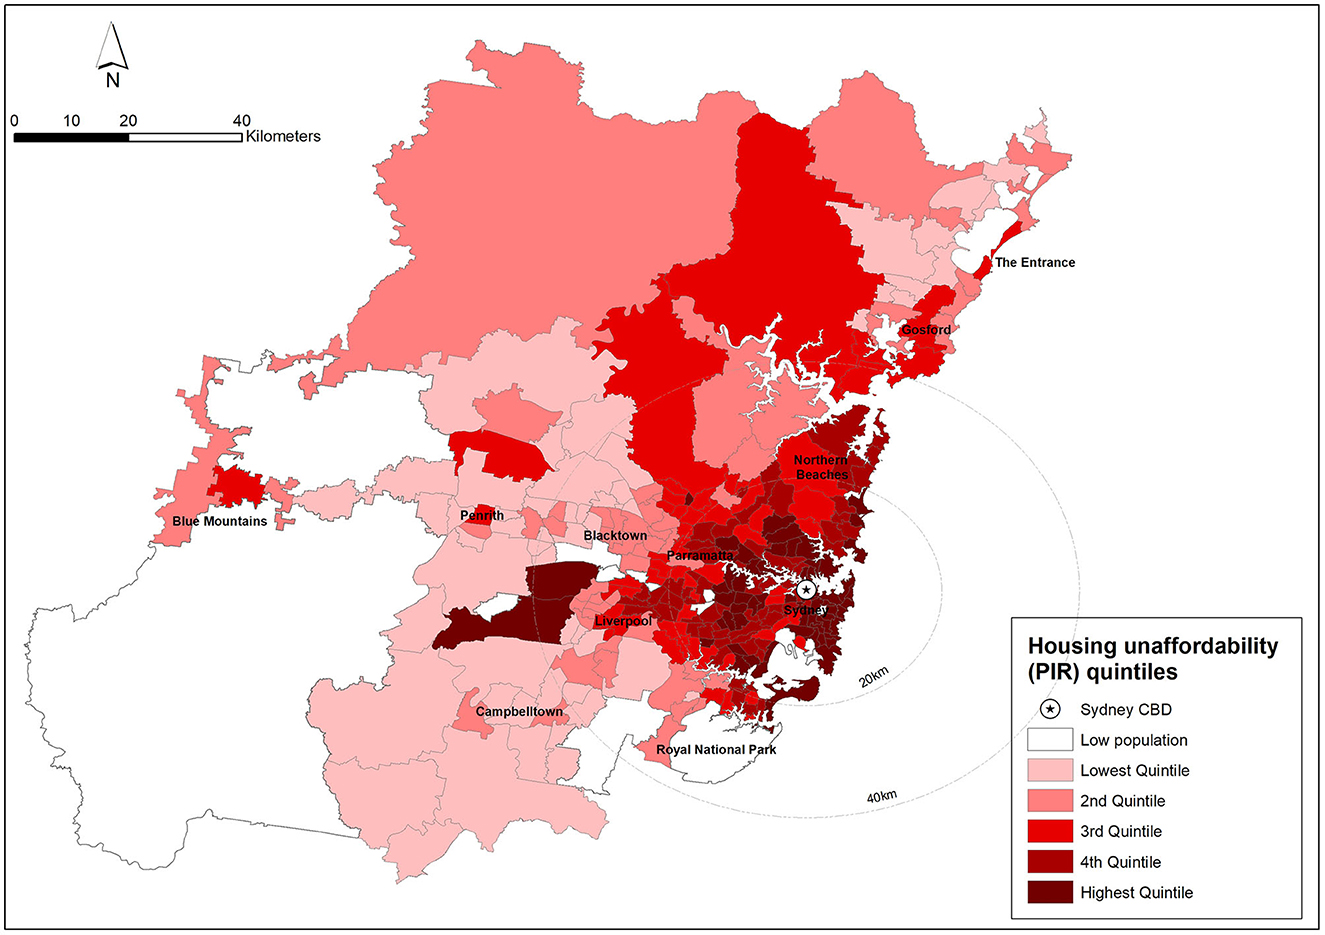
Figure 4. Housing unaffordability (PIR) quintiles, Sydney SA2s, 2016. Source: Authors' own work.
5.2 Spatial overlaps and priority areas
The observation that some areas affected by high temperatures, disadvantage and housing unaffordability tend to cluster together is noteworthy. Based on the framework for building urban climate resilience (see Figure 1), we now look at areas subject to both urban heat and the most significant social stresses in Sydney, namely urban disadvantage, and housing unaffordability. This analysis is based on the premise that if residents in areas exposed to higher temperatures also experience social disadvantage and housing unaffordability, this impacts such residents' ability to cope or adapt to climate events and makes them extremely vulnerable to climate risks.
When residents in the highest quintile SA2s of urban heat also experience the highest levels of urban disadvantage and/or housing unaffordability, such areas are identified as critical areas needing an urgent policy and planning response (see Table 2). There were 11 SA2s in the highest quintile of temperature and the lowest quintile of IRSD (measuring the highest disadvantage). In other words, the residents of these hottest SA2s also experience the highest levels of social disadvantage. The spatial patterns show these are SA2s in the west and southwest of Sydney such as Mount Druitt—Whalan, St Marys, Bidwill—Hebersham—Emerton, Lethbridge Park—Tregear, Blacktown, and Kingswood (Figure 5). Social disadvantage limits their ability to adapt to changing climatic conditions and cope if, and when, climate events occur. For instance, in the 2021 heatwave of Sydney, many residents of the lower socio-economic communities who live in the west, where it is 8–10°C hotter, couldn't afford to use air conditioning (Hsiang et al., 2017; Farid Uddin and Piracha, 2022). The link between climate events and social disadvantage can be looked at from a property value perspective which raises the question whether disadvantaged areas are more vulnerable to floods. One explanation is that land in flood-risk areas is underpriced and residents with low incomes who live in lower socioeconomic conditions are attracted to such areas. It also could be because disadvantaged areas lack more resilient infrastructure (Doorn, 2019).
Table 2. Priority areas for urban resilience.
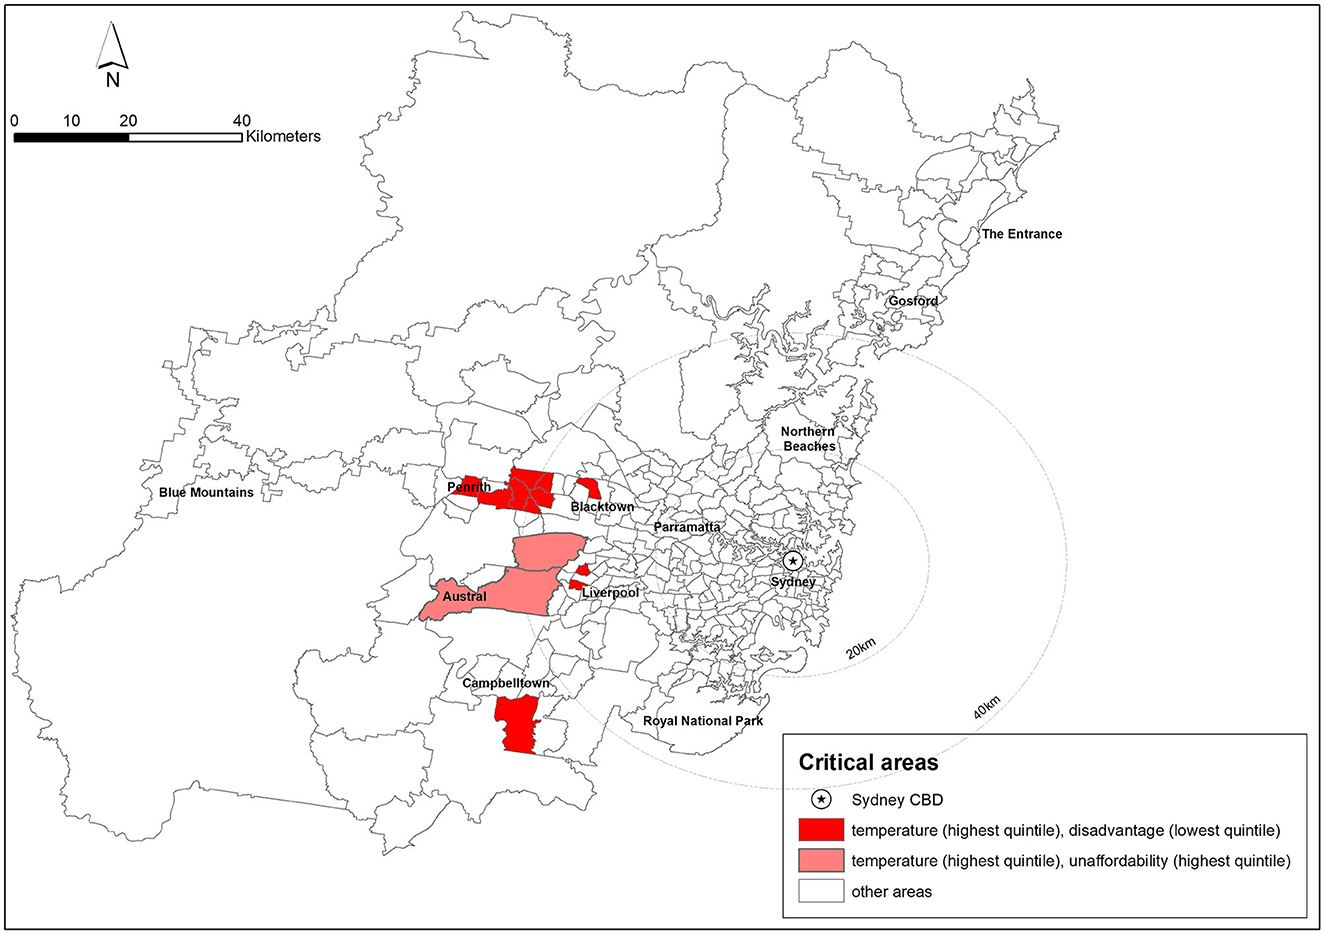
Figure 5. Critical areas based on spatial overlap. Source: Authors' own work.
Also, there were further two SA2s in the highest quintile of temperature and the highest quintile of housing unaffordability.6 The residents of these two hottest SA2s in western Sydney, Austral and Horsley Park, are faced with the highest levels of housing unaffordability. Higher housing costs mean city residents are left with insufficient funds for other necessities and less (or no) savings. A critical shortage of affordable housing also indicates such residents are unable to keep a roof over their heads. They resort to makeshift arrangements such as living with parents or other relatives, living in crowded houses, boarding houses, or in extreme cases, being homeless. These “inferior” housing arrangements affect an individual's or family's ability to manage normal household functioning, reduce dwelling cleanliness, and even cause injury and property damage. This is more likely to result in greater anxiety or stress, poorer health and child development outcomes, household conflict and forced mobility or homelessness (Brackertz et al., 2019). An individual or family in these circumstances won't be able to cope with the prospect of climate change and extreme climate events.
Since these 13 SA2s are in the extreme end of urban heat, social disadvantage and/or housing unaffordability (top 20% in each case), they are in critical need of policy and planning interventions to address the climate risks and social vulnerabilities.
Once the criteria are relaxed to include the two highest quintiles of urban heat, social disadvantage and housing unaffordability, a considerably large number of SA2s emerge as priority areas. There are 13 SA2s that overlap the two highest temperature quintiles, the two lowest IRSD quintiles (referring to the two highest quintiles of disadvantage) and the two highest quintiles of housing unaffordability. The spatial distribution of these areas is shown in Figure 6. These areas are in the west and southwest of Sydney. There are further 53 SA2s that fall within the two highest temperature quintiles and the two lowest IRSD quintiles (referring to the two highest quintiles of social disadvantage) only. This indicates a substantial number of SA2s reporting high temperatures were also ranked as disadvantaged locations. These SA2s are spread across the west, northwest and southwest of Sydney. Moreover, four additional SA2s fall within the two highest temperature quintiles as well as the two highest housing unaffordability quintiles only. These represent some middle city and western SA2s of Sydney. A notable feature of these areas is the proximity to Sydney CBD, and hence, higher land values.
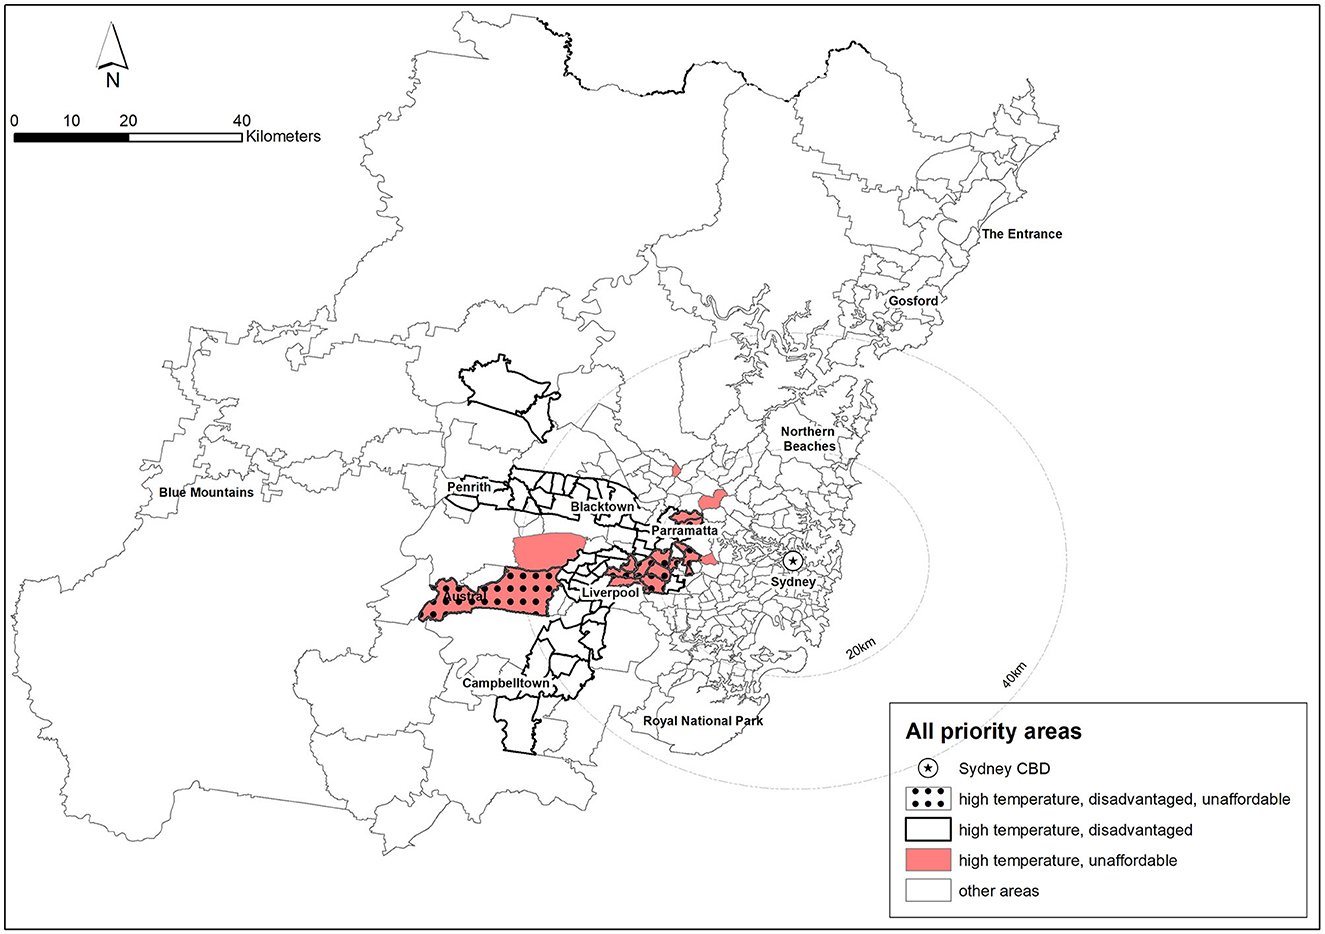
Figure 6. All priority areas based on spatial overlap. Source: Authors' own work.
5.3 Current siloed approach to planning and the way forward
Building resilience is crucial, especially in urban communities impacted by natural disasters and social stresses. In fact, planning for resilient cities has become synonymous with planning for a better and sustainable future (Kalantari, 2021). Improving housing affordability and reducing disadvantage (including poverty and inequality) will improve resilience in neighborhoods. Those who are vulnerable to social stresses often live in areas that are typically hazard-prone, unsafe, and overcrowded, with insecure tenure and limited infrastructure (Baker, 2012). These issues heighten the sensitivity of the urban poor to climate change and disaster risks. Housing with the security of tenure and with access to basic services can help reduce vulnerability and can provide a basis for home-based resilient livelihoods7 (ADB, 2022). Building resilience before climate disasters occur can help keep millions out of poverty and save the world's cities billions each year via downscaling the support programs. Evidence of the growing importance of resilience in urban planning is the globally adopted program of the 100 Resilient Cities funded and initiated by The Rockefeller Foundation (2013).
The current siloed approach to urban resilience addresses the urban heat island effect as a standalone issue. The key strategies identified to tackle urban heat include “green growth” initiatives such as providing green infrastructure, increasing tree shading, reducing hard surface areas in new developments, reducing greenhouse gas emissions from buildings, and improving energy efficiency (Hammer et al., 2011; Saaroni et al., 2018). For instance, Blacktown Council is addressing urban heat by developing and implementing a plan to transition that city to zero emissions by 2040 (Goal 1.1), sourcing funding opportunities for energy efficiency programs (Goal 1.2) and increasing tree canopy and biodiversity corridors (Goal 5.1) (Blacktown City Council, 2022).
Similarly, there are targeted policies in many cities to reduce poverty, improve employability, and address urban disadvantage, including social welfare programs. For instance, the Australian Federal Government has touted co-investment with philanthropists and the private sector to address disadvantage, emphasizing the role of place-based partnerships and community organizations (Chalmers, 2023). These policies should consider different social stresses simultaneously. For instance, policymakers have argued low incomes and unemployment in western Sydney will potentially be addressed through the Western Sydney Aerotropolis now under-construction (The Department of Planning and Environment, n.d.), however there is a risk of increasing house prices due to the arrival of new economic opportunities and better amenities and services to the area.
There are targeted solutions to improve the overall provision, suitability, and socio-economic resilience of the housing system to address housing unaffordability. The long-standing yet politically unpopular policy of providing state-funded public housing, increasing social housing provision, rental assistance, low-income housing tax credit (in the US), and private sector solutions, including innovative dwelling types, home-sharing models, and planning-based solutions such as improvements to zoning laws are examples of available instruments to this end. As a best practice example, Los Angeles (USA) has put in place initiatives that will double the pace of affordable housing production and preservation, and triple the production of new permanent supportive housing by changing regulations, adopting new financing mechanisms, and exploring adaptive re-use of publicly owned sites (City of Sydney, 2018, p. 24). However, policymakers must ensure addressing a specific problem does not lead to new problems. For instance, Greater Sydney Plan highlights that by creating multiple subcenters, residents will have better access to employment opportunities and affordable housing (Greater Sydney Commission, 2018). These strategies must however ensure the urban heat island effect from these new constructions is minimal. Another persistent challenge is, though governments have implemented a number of these policies, they have been overtaken by the growing scale of need. For instance, as of June 2021, there were 67,700 “greatest need” households on the waiting list for public housing in Australia (Australian Institute of Health and Welfare, 2022).
The above siloed approach is known to be ineffective. Serageldin identifies the silo effect in management in the separation of responsibilities among resource-management agencies and their incapability to consider mandates relative to mandates of other organizations (Serageldin, 1995a,b). In government, the silo effect adopts vertical fragmentation where responsibilities are fragmented from one tier of government to the other, or horizontal fragmentation where fragmentation occurs within one level of government among different agencies (Mitchell, 2005). Oseland (2019), specifically focusing on climate planning, emphasizes that breaking silos creates new opportunities to bridge the gap between targets and results through knowledge sharing, identification of co-benefits and anchoring of the plans beyond the departments in charge. It is crucial that state and local governments overcome silo management and embrace integrated planning on their path to urban resilience.
Rather than implementing standalone measures to mitigate climate risks, address urban disadvantage and improve housing affordability, an integrated solution that strengthens resilience through social protection programs has been proposed (UN, 2018; Yuster, 2018). This emphasizes the need to comprehend the integration between human and ecological processes, particularly within human-dominated environments, is crucial for reaching future resilience goals. Asian Development Bank (2018) highlights that social protection mechanisms must better target the urban poor and respond to increasing climate shocks and stresses. Investments should support underlying vulnerability through resilient livelihoods, regular income, promotion of savings, and skills enhancement. The urban disadvantaged should be supported to access affordable and resilient housing. Mainstreaming of climate adaptation in sectoral plans and policies—with major implications for urban policy—requires major efforts from local authorities (i.e., place-based interventions; Reckien et al., 2019).
6 Conclusion
Residents in many areas of Sydney, particularly western Sydney, are living in hot conditions because of the high concentration of buildings and other brown structures and the long distance to coastal sea breezes. Meanwhile, due to inner city gentrification, public housing locations and affordable housing options in middle and outer areas, and the changing economic structure in Sydney where manufacturing jobs have moved to outer areas, low income and other socio-economically disadvantaged residents are moving to the same western areas. One would expect housing to be affordable in these locations due to high temperatures (Galinato and Tantihkarnchana, 2018) and neighborhood effects8 (Gunn et al., 2022). However, housing is increasingly unaffordable relative to income in these areas, particularly in those SA2s located toward the Sydney CBD due to scarcity of land, better access to employment, high-quality amenities, and services. The spatial contiguity of the areas impacted by urban heat, social disadvantage and housing unaffordability is more problematic due to the need for more resources, large scale programs, and a longer time periods to design and implement programs and policies.
We need better metrics to understand the climate events, social stresses, and resilience capacities. Some of the resilience measures that have been developed in the previous urban resilience literature are not quantitatively measurable. For instance, certain indicators listed in the City Resilience Index (The Rockerfeller Foundation, n.d., p. 27) are qualitative in nature and hard to measure and compare—e.g., cohesive communities, flexible infrastructure services. In contrast, the measures developed in this paper are pragmatic, measurable, and accessible. Data for these indicators are also available in many other cities for benchmarking, for instance, PIR is available for many world cities and socio-economic disadvantage is available for numerous cities as well (e.g., Index of Multiple Deprivation in the UK). To address the drawback of using only a handful of measures in the current paper, future research will develop multiple other measures of social stresses.
In the introduction, the question was raised whether the locations subjected to disruptive climate events also experience social vulnerabilities. If residents in areas exposed to higher temperatures also experience social disadvantage and housing unaffordability, this impacts such residents' ability to cope or adapt to climate events and makes them extremely vulnerable to climate risks. We considered the spatial overlapping of urban heat, social disadvantage and housing unaffordability and identified two sets of priority areas for building resilience—critical areas and all priority areas. Areas with the most extreme values of urban heat, social disadvantage, and housing unaffordability (the highest 20%) were included as critical areas, and those with high values of urban heat, social disadvantage, and housing unaffordability (the highest 40%) were included as all priority areas. In Sydney, 13 SA2s (or 4% of total SA2s analyzed) are critical areas with extreme levels of temperature and either the highest level of disadvantage (11 SA2s) or the highest level of housing unaffordability (2 SA2s). The extended list with relaxed criteria shows 70 SA2s (or 23% of total SA2s analyzed) are priority areas. This is an alarming statistic as almost a quarter of SA2s show substantial social vulnerabilities if climate events to intensify. The remaining 77% of SA2s have relatively improved social structures making them better able to bounce back from potential climate events.
Based on the resilience framework presented by Ostadtaghizadeh et al. (2015) and elaborated by Ribeiro and Pena Jardim Gonçalves (2019), the issue of resilience should be emphasized more on the strength of the system being built in the five dimensions natural, economic, social, physical and institutional—see Section 2.2. This framework highlights the importance of strategic and leadership structure (institutional) due to the role of local authorities as a main stakeholder in the resilience process. This is consistent with the pivotal role suggested in the present paper for local, city and state governments in identifying the spatial dynamics of climate events and social stresses, and addressing them through integrated solutions and policies. For instance, understanding the link between the five dimensions is key to overcoming climate change and social problems such as disadvantage and housing unaffordability. Such a system can reduce the impact of climate events by focusing on inherent resilience of people and communities (social), implementing effective governance mechanisms (institutional), and creating sustainable economic opportunities in local neighborhoods (economic). Therefore, an effective leadership to guide government capacities for resilience in cities becomes essential.
A limitation of using SEIFA for classifying 'socio-economic disadvantage' is that it is essentially compositional, and as such is vulnerable to the ecological fallacy (Darcy and Gwyther, 2011; Pawson and Herath, 2015). In other words, socio-economic disadvantage classified at the SA2 level doesn't mean all the individuals in such areas are disadvantaged. Despite this criticism, SEIFA is still considered to be the most meaningful metric of disadvantage currently available in Australia.
There was once an understanding that cities are places of consumption and production, resulting in the replacement of the natural landscape. There is now an increasing awareness that cities could and should be part of the solution to mitigate climate impacts and enhance overall sustainability (Swart et al., 2023). Our framework for building urban climate resilience incorporates facets of urban resilience, social stresses that amplify crises, and solutions that strengthen individuals and communities with coping abilities to withstand climate events. The multi-faceted nature of urban resilience suggests a siloed approach is ineffective and an integrated approach is needed. For instance, policies addressing urban disadvantage and housing unaffordability should also consider resilience—e.g., affordable housing should also be resilient housing. Furthermore, the findings diverge from aggregate city-level analyses by highlighting the small-area differences of climate impacts and vulnerability. The spatiality of the natural and social impacts indicates the need for context-based approaches and place-based policies to address climate risks and social vulnerabilities. This is especially important as climate change will only amplify the frequency and intensity of extreme weather events.
Data availability statement
The original contributions presented in the study are included in the article/supplementary material, further inquiries can be directed to the corresponding author.
Author contributions
SH and EC contributed to conception and design of the study. SH organized the database, performed the statistical analysis, and wrote the first draft of the manuscript. EC and EM wrote sections of the manuscript. All authors contributed to manuscript revision, read, and approved the submitted version.
Conflict of interest
The authors declare that the research was conducted in the absence of any commercial or financial relationships that could be construed as a potential conflict of interest.
Publisher's note
All claims expressed in this article are solely those of the authors and do not necessarily represent those of their affiliated organizations, or those of the publisher, the editors and the reviewers. Any product that may be evaluated in this article, or claim that may be made by its manufacturer, is not guaranteed or endorsed by the publisher.
Footnotes
1. ^Infrastructure is a visible and tangible investment compared to other investments, and during elections, political parties and politicians frequently commit to building new infrastructure. The resilience discourse is skewed towards infrastructure (compared to social and housing resilience).
2. ^Small areas are defined here as geographical units that carry inherent socially, geographically, economically, or physically identifiable qualities—e.g., Statistical Area Level 2 (SA2) in Australia which has an average of about 10,000 people.
3. ^Place-based approaches target the specific circumstances of a place and use the best available resources to gain local knowledge and insight into planning (Victorian Government, 2020).
4. ^We opted to use detached houses as units/apartments are only prevalent in city centers and near transit-oriented developments (TODs).
5. ^Other indices are the Index of Relative Socio-Economic Advantage and Disadvantage (IRSAD), Index of Education and Occupation (IEO), and Index of Economic Resources (IER).
6. ^There were no SA2s intersecting all three indicators simultaneously—i.e., the highest quintile of temperature, the lowest quintile of IRSD (representing the highest disadvantage) and the highest quintile of housing unaffordability.
7. ^Home-based livelihoods refer to the increasing number of enterprises set up at homes predominantly by low-income women in developing countries.
8. ^In urban economics, neighborhood effects refer to the processes by which various neighborhood conditions influence the wellbeing of residents collectively or individually (Roosa and White, 2014).
References
Aarhaug, J., and Gundersen, F. (2017). Infrastructure investments to promote sustainable regions. Transport. Res. Proc. 26, 187–195. doi: 10.1016/j.trpro.2017.07.019
ADB (2022). Building Resilience of the Urban Poor: Recommendations for Systemic Change. Mandaluyong: Asian Development Bank.
Asian Development Bank (2018). Strengthening Resilience Through Social Protection Programs: Guidance Note. Mandaluyong: Asian Development Bank.
Australian Bureau of Statistics (2016). 2901.0—Census of Population and Housing: Census Dictionary, 2016. ACT. Belconnen, ACT.
Australian Institute of Health Welfare (2021). Housing Affordability. Available online at: https://www.aihw.gov.au/reports/australias-welfare/housing-affordability (accessed March 23, 2021).
Australian Institute of Health Welfare (2022). Housing Assistance in Australia. Available online at: https://www.aihw.gov.au/reports/housing-assistance/housing-assistance-in-australia/contents/households-and-waiting-lists (accessed March 23, 2021).
Australian Institute of Health Welfare (2023). Housing Stress. Available online at: https://www.aihw.gov.au/reports/children-youth/housing-stress (accessed June 16, 2023).
Baker, J. L. (2012). Climate Change, Disaster Risk, and the Urban Poor: Cities Building Resilience for a Changing World. Washington, DC: World Bank.
Blacktown City Council (2022). Delivery Program 2022–2026 and Operational Plan 2022/23. Sydney, NSW: Blacktown City Council.
Boschetti, F., Gaffier, C., Moglia, M., Walke, I., and Price, J. (2017). Citizens' perception of the resilience of Australian cities. Sustain. Sci. 12, 345–364. doi: 10.1007/s11625-017-0429-1
Brackertz, N., Davison, J., Borrowman, L., and Roggenbuck, C. (2019). Overcrowding and Severe Overcrowding: an Analysis of Literature, Data, Policies and Programs. Melbourne, VIC: Australian Housing and Urban Research Institute Limited.
Buchin, O., Hoelscher, M. T., Meier, F., Nehls, T., and Ziegler, F. (2016). Evaluation of the health-risk reduction potential of countermeasures to urban heat islands. Energy Build. 114, 27–37. doi: 10.1016/j.enbuild.2015.06.038
Burdett, R. (2022). The Future of Cities. London School of Economics and Political Science. Available online at: https://www.lse.ac.uk/Research/covid/cities (accessed May 3, 2023).
Byrne, J. (2017). Planners Know Depressingly Little About a City's Impacts on Our Mental Health. The Conversation. Available online at: https://theconversation.com/planners-know-depressingly-little-about-a-citys-impacts-on-our-mental-health-81098
Cadenasso, M. L., and Pickett, S. T. A. (2012). “Three tides: the development and state of the art of urban ecological science,” in Resilience in Ecology and Urban Design: Linking Theory and Practice for Sustainable Cities, eds. S. Pickett, M. Cadenasso and B. McGrath (Dordrecht: Springer Netherlands), 29–46.
Chalmers, J. (2023). Budget Empowers Local Leaders to Tackle Disadvantage. Available online at: https://ministers.treasury.gov.au/ministers/jim-chalmers-2022/media-releases/budget-empowers-local-leaders-tackle-disadvantage (accessed June 8, 2023).
Chandler, D. (2014). Resilience: the Governance of Complexity, Critical Issues in Global Politics; 7. Abingdon, Oxon: Routledge.
City of Sydney (2018). Resilient Sydney: A Strategy for City Resilience 2018. Sydney, NSW: City of Sydney.
Climate Council (2022). One in 25 Australian Homes Uninsurable by 2030: Climate Council Launches Cutting Edge Digital Climate-Risk Map (Media Release). Available online at: https://www.climatecouncil.org.au/resources/australian-homes-uninsurable-2030-climate-risk-map/
Coaffee, J., Therrien, M. C., Chelleri, L., Henstra, D., Aldrich, D. P., Mitchell, C. L., et al. (2018). Urban resilience implementation: a policy challenge and research agenda for the 21st century. J. Conting. Crisis Manag. 26, 403–410. doi: 10.1111/1468-5973.12233
Darcy, M., and Gwyther, G. (2011). Recasting Research on 'Neighbourhood effects': A Collaborative, Participatory, Trans-National Approach (Dordrecht: Springer Netherlands), 249–266.
Department of Planning Industry Environment. (2021). Resilience Outcomes for the Planning System. State of New South Wales. Available online at: https://www.planning.nsw.gov.au/sites/default/files/2023-03/resilience-outcomes-for-the-planning-system.pdf
Doorn, N. (2019). How can resilient infrastructures contribute to social justice? Preface to the special issue of sustainable and resilient infrastructure on resilience infrastructures and social justice. Sustain. Resilient Infrastruct. 4, 99–102. doi: 10.1080/23789689.2019.1574515
EEA (2020). Urban Adaptation in Europe: How Cities and Towns Respond to Climate Change. Copenhagen; Denmark: European Environment Agency.
Farid Uddin, K., and Piracha, A. (2022). “Sustainable and resilient community in the times of crisis: the greater Sydney case,” in Community Empowerment, Sustainable Cities, and Transformative Economies, eds. T. Chaiechi and J. Wood (Singapore: Springer Nature Singapore), 475–493.
Fedele, G., Donatti, C. I., Harvey, C. A., Hannah, L., and Hole, D. G. (2019). Transformative adaptation to climate change for sustainable social-ecological systems. Environ. Sci. Pol. 101, 116–125. doi: 10.1016/j.envsci.2019.07.001
Galinato, G. I., and Tantihkarnchana, P. (2018). The amenity value of climate change across different regions in the United States. Appl. Econ. 50, 4024–4039. doi: 10.1080/00036846.2018.1441507
Gartland, L. (2008). Heat Islands: Understanding and Mitigating Heat in Urban Areas. London: Earthscan.
Gasparrini, A., Masselot, P., Scortichini, M., Schneider, R., Mistry, M. N., Sera, F., et al. (2022). Small-area assessment of temperature-related mortality risks in England and Wales: a case time series analysis. Lancet Planetary Health 6, e557–e564. doi: 10.1016/S2542-5196(22)00138-3
Greater Sydney Commission (2018). Greater Sydney Region Plan: A Metropolis of Three Cities—Connecting people. Sydney, NSW: Greater Sydney Commission.
Gunderson, L. H., and Holling, C. S. (2002). Panarchy: Understanding Transformations in Human and Natural Systems. Washington, DC: Island Press.
Gunn, L. D., Saghapour, T., Giles-Corti, B., and Turrell, G. (2022). Exploring inequities in housing affordability through an analysis of walkability and house prices by neighbourhood socioeconomic disadvantage. Cities Health 6, 616–634. doi: 10.1080/23748834.2022.2072058
Gupta, S., Liu, E. X., and Mulas-Granados, C. (2015). Politics and Public Investment. Finance and Development. Available online at: https://www.imf.org/external/pubs/ft/fandd/2015/12/pdf/gupta.pdf (accessed December, 2015).
Hallegatte, S., Rentschler, J., and Rozenberg, J. (2019). Lifelines: The Resilient Infrastructure Opportunity. Sustainable Infrastructure. Washington, DC: World Bank.
Hallegatte, S., Vogt-Schilb, A., Rozenberg, J., Bangalore, M., and Beaudet, C. (2020). From poverty to disaster and back: a review of the literature. Econ. Disast. Clim. Change 4, 223–247. doi: 10.1007/s41885-020-00060-5
Hammer, S., Kamal-Chaoui, L., Robert, A., and Plouin, M. (2011). Cities and Green Growth: A Conceptual Framework. OECD Regional Development Working Papers 2011/08, OECD Publishing. doi: 10.1787/5kg0tflmzx34
Hauer, M. E., Evans, J. M., and Mishra, D. R. (2016). Millions projected to be at risk from sea-level rise in the continental United States. Nat. Clim. Change 6, 691–695. doi: 10.1038/nclimate2961
Herath, S., and Jayasekare, A. S. (2021). City proximity, travel modes and house prices: the three cities in Sydney. J. Housing Built Environ. 36, 407–431. doi: 10.1007/s10901-020-09805-w
Hsiang, S., Kopp, R., Jina, A., Rising, J., Delgado, M., Mohan, S., et al. (2017). Estimating economic damage from climate change in the United States. Science 356, 1362–1369. doi: 10.1126/science.aal4369
Infrastructure Australia (2021). Infrastructure Australia Charts a Pathway to Resilience as the National Cost of Natural Disasters Hits $39bn by 2050. Infrastructure Australia. Available online at: https://www.infrastructureaustralia.gov.au/listing/media-release/infrastructure-australia-charts-pathway-resilience-national-cost-natural-disasters-hits-39bn-2050 (accessed December 24, 2022).
Kalantari, Z. (2021). Enlivening our cities: towards urban sustainability and resilience. Ambio 50, 1629–1633. doi: 10.1007/s13280-021-01518-w
Krausmann, E., Girgin, S., and Necci, A. (2019). Natural hazard impacts on industry and critical infrastructure: Natech risk drivers and risk management performance indicators. Int. J. Disast. Risk Reduct. 40, 101163. doi: 10.1016/j.ijdrr.2019.101163
Leal Filho, W., Icaza, L. E., Neht, A., Klavins, M., and Morgan, E. A. (2018). Coping with the impacts of urban heat islands. A literature based study on understanding urban heat vulnerability and the need for resilience in cities in a global climate change context. J. Clean. Product. 171, 1140–1149. doi: 10.1016/j.jclepro.2017.10.086
Loughnan, M. E., Tapper, N. J., Phan, T., Lynch, K., and McInnes, J. A. (2013). A Spatial Vulnerability Analysis of Urban Populations during Extreme Heat Events in Australian Capital Cities. Gold Coast, QLD: National Climate Change Adaptation Research Facility.
Lyle, K., and Kriesberg, J. (2022). A Strategy for Tackling Housing, Climate Crises Simultaneously. Common Wealth Beacon. Available online at: https://commonwealthbeacon.org/opinion/a-strategy-for-tackling-housing-climate-crises-simultaneously.
Mallinson, G. (2019). Australian housing crisis and caravan parks: the social cost of housing marginality. Int. J. Sustainabil. Econ. Soc. Cult. Context 15, 1–10. doi: 10.18848/2325-1115/CGP/v15i01/1-10
McArthur, J. (2017). Here's What to Look Out for When Politicians Promise to Spend Big on Infrastructure. The Conversation. Available online at: https://theconversation.com/heres-what-to-look-out-for-when-politicians-promise-to-spend-big-on-infrastructure-78193
Meerow, S., Newell, J. P., and Stults, M. (2016). Defining urban resilience: a review. Landscape Urban Plan. 147, 38–49. doi: 10.1016/j.landurbplan.2015.11.011
Mitchell, B. (2005). Integrated water resource management, institutional arrangements, and land-use planning. Environ. Plan. A 37, 1335–1352. doi: 10.1068/a37224
Newman, P., Beatley, T., and Boyer, H. (2017). Resilient Cities: Overcoming Fossil Fuel Dependence, 2nd Edn. Washington, DC: Island Press.
NSW Government (2023). Housing Resilience. https://www.planning.nsw.gov.au/Research-and-Demography/Housing-Evidence-Centre/Housing-resilience (accessed March 23, 2023).
OECD (2021). Building resilience: New strategies for strengthening infrastructure resilience and maintenance, OECD Public Governance Policy Papers, No. 05. Paris: OECD Publishing.
Oseland, S. E. (2019). Breaking silos: can cities break down institutional barriers in climate planning? J. Environ. Pol. Plan. 21, 345–357. doi: 10.1080/1523908X.2019.1623657
Ostadtaghizadeh, A., Ardalan, A., Paton, D., Jabbari, H., and Khankeh, H. R. (2015). Community disaster resilience: a systematic review on assessment models and tools. PLoS Curr. 7:210. doi: 10.1371/currents.dis.f224ef8efbdfcf1d508dd0de4d8210ed
Paolini, R., and Santamouris, M. (2023). Urban Climate Change and Heat Islands: Characterization, Impacts, and Mitigation. Amsterdam: Elsevier.
Parliament of Australia (2016). Housing Affordability in Australia. Available online at: https://www.aph.gov.au/about_parliament/parliamentary_departments/parliamentary_library/pubs/briefingbook45p/housingaffordability (accessed March 23, 2023).
Pawson, H., and Herath, S. (2015). Dissecting and tracking socio-spatial disadvantage in urban Australia. Cities 44, 73–85. doi: 10.1016/j.cities.2015.02.001
Piracha, A., and Chaudhary, M. T. (2022). Urban air pollution, urban heat island and human health: a review of the literature. Sustainability 14:9234. doi: 10.3390/su14159234
Randolph, B., and Holloway, D. (2005). The suburbanisation of disadvantage in Sydney: new problems, new policies. Opolis 1, 49–65. Retrieved from: https://escholarship.org/uc/item/84c145ms
Reckien, D., Salvia, M., Pietrapertosa, F., Simoes, S. G., Olazabal, M., De Gregorio Hurtado, S., et al. (2019). Dedicated versus mainstreaming approaches in local climate plans in Europe. Renew. Sustain. Energy Rev. 112, 948–959. doi: 10.1016/j.rser.2019.05.014
Ribeiro, P. J. G., and Pena Jardim Gonçalves, L. A. (2019). Urban resilience: a conceptual framework. Sustain. Cit. Soc. 50:101625. doi: 10.1016/j.scs.2019.101625
Rizwan, A. M., Dennis, L. Y. C., and Liu, C. (2008). A review on the generation, determination and mitigation of Urban Heat Island. J. Environ. Sci. 20, 120–128. doi: 10.1016/S1001-0742(08)60019-4
Roosa, M. W., and White, R. M. B. (2014). “Neighborhood effects,” in Encyclopedia of Quality of Life and Well-Being Research, ed. A. C. Michalos (Dordrecht: Springer Netherlands), 4328–4331.
Saaroni, H., Amorim, J. H., Hiemstra, J. A., and Pearlmutter, D. (2018). Urban Green Infrastructure as a tool for urban heat mitigation: survey of research methodologies and findings across different climatic regions. Urban Clim. 24, 94–110. doi: 10.1016/j.uclim.2018.02.001
Sabrin, S., Karimi, M., Fahad, M. G. R., and Nazari, R. (2020). Quantifying environmental and social vulnerability: role of urban Heat Island and air quality, a case study of Camden, NJ. Urban Clim. 34:100699. doi: 10.1016/j.uclim.2020.100699
Serageldin, I. (1995a). Water resources management: a new policy for a sustainable future. Water Int. 20, 15–21. doi: 10.1080/02508069508686440
Serageldin, I. (1995b). Water resources management: a new policy for a sustainable future. Int. J. Water Resour. Dev. 11, 221–232. doi: 10.1080/07900629550042191
Speer, M., Gupta, A., Wang, J., Hartigan, J., and Leslie, L. M. (2023). Why Western Sydney Is Feeling the Heat From Climate Change More Than the Rest of the City. The Conversation. Available online at: https://theconversation.com/why-western-sydney-is-feeling-the-heat-from-climate-change-more-than-the-rest-of-the-city-201477
Swart, R., Timmermans, W., Boon, E., Van Ginkel, M., Goosen, H., Van Veldhoven, F., et al. (2023). Can managing climate risks be a catalyst for broader transformative change? Soc. Sci. 12, 158. doi: 10.3390/socsci12030158
The Department of Planning and Environment (n.d.). Western Sydney Aerotropolis Explained. Available online at: https://www.planning.nsw.gov.au/plans-for-your-area/priority-growth-areas-and-precincts/western-sydney-aerotropolis/western-sydney-aerotropolis-explained (accessed June 16 2023).
The Rockerfeller Foundation (n.d.). City Resilience Index: Understanding and Measuring City Resilience.
The Urban Reform Institue (2022). Demographia International Housing Affordability: 2022 Edition. Available online at: https://urbanreforminstitute.org/wp-content/uploads/2022/03/Demographia-International-Housing-Affordability-2022-Edition.pdf
The World Bank (2022). Global Program for Resilient Housing. The World Bank. Available online at: https://www.worldbank.org/en/topic/disasterriskmanagement/brief/global-program-for-resilient-housing?cid=ECR_YT_Worldbank_EN_EXT (accessed December 24, 2022).
Thompson, A. (2020). The Sydney Suburbs That Hit 50C Last Summer. Sydney, NSW: The Sydney Morning Herald.
Timmermans, W. J., Kustas, W. P., and Andreu, A. (2015). Utility of an automated thermal-based approach for monitoring evapotranspiration. Acta Geophys. 63, 1571–1608. doi: 10.1515/acgeo-2015-0016
Tyler, S., and Moench, M. (2012). A framework for urban climate resilience. Clim. Dev. 4, 311–326. doi: 10.1080/17565529.2012.745389
UN (2018). Ending Poverty for Inclusive, Resilient and Sustainable Societies. UN. Available online at: https://www.un.org/en/desa/ending-poverty-inclusive-resilient-and-sustainable-societies
UNEP (2023). Cities and Climate Change. United Nations Environment Programme. Available online at: https://www.unep.org/explore-topics/resource-efficiency/what-we-do/cities/cities-and-climate-change.
UN-Habitat (2020). World Cities Report 2020: The Value of Sustainable Urbanization. Nairobi: United Nations Human Settlements Programme (UN-Habitat).
United Nations (n.d.). Generating Power. Available online at: https://www.un.org/en/climatechange/climate-solutions/cities-pollution (accessed June 16, 2023).
Vaughan, E. (2018). Resilience Measurement Practical Guidance Note Series 3: Resilience Capacity Measurement. Portland, OR: Mercy Corps.
Victorian Government (2020). A Framework for Place-Based Approaches. Available online at: https://www.vic.gov.au/framework-place-based-approaches/print-all (accessed October 8, 2023).
Wolf, T., and McGregor, G. (2013). The development of a heat wave vulnerability index for London, United Kingdom. Weather Clim. Extremes 1, 59–68. doi: 10.1016/j.wace.2013.07.004
World Bank (2019). Building Urban Resilience: An Evaluation of the World Bank Group's Evolving Experience (2007–17). Washington, DC: Independent Evaluation Group.
World Bank Group (2016). Investing in Urban Resilience: Protecting and Promoting Development in a Changing World. Washington, DC: World Bank Group.
Yuster, A. (2018). Integrated Social Protection Systems to Build Resilience of Poor People. UNICEF. Available online at: https://www.unicef.org/morocco/media/1076/file/Integrated%20social%20protection%20systems%20to%20build%20resilience%20of%20poor%20people.pdf
Keywords: urban resilience, urban heat, urban disadvantage, housing affordability, Sydney, spatial analysis, place-based policy
Citation: Herath S, Cilliers EJ and Mussi E (2024) A triple whammy: how urban heat, housing unaffordability and disadvantage affect urban spatial resilience. Front. Sustain. Cities 6:1244187. doi: 10.3389/frsc.2024.1244187
Received: 22 June 2023; Accepted: 03 January 2024;
Published: 19 January 2024.
Edited by:
Tathagata Chatterji, Xavier University, IndiaReviewed by:
Gabriel Hoh Teck Ling, University of Technology Malaysia, MalaysiaAbdillah Abdillah, Universitas Padjadjaran, Indonesia
Copyright © 2024 Herath, Cilliers and Mussi. This is an open-access article distributed under the terms of the Creative Commons Attribution License (CC BY). The use, distribution or reproduction in other forums is permitted, provided the original author(s) and the copyright owner(s) are credited and that the original publication in this journal is cited, in accordance with accepted academic practice. No use, distribution or reproduction is permitted which does not comply with these terms.
*Correspondence: Shanaka Herath, c2hhbmFrYS5oZXJhdGhAdXRzLmVkdS5hdQ==