 Simon Schneider
 Edit Paráda
 David Sengl1
 José Baptista
 Paulo Moura Oliveira
- 1Climate-Fit Buildings and Districts Research Group, Department of Mechanical Engineering, University of Applied Sciences Technikum, Vienna, Austria
- 2Department of Engineering, School of Science and Technology, University of Trás-os-Montes and Alto Douro (UTAD), INESC-TEC, Vila Real, Portugal
Despite the ubiquitous term “climate neutral cities”, there is a distinct lack of quantifiable and meaningful municipal decarbonization goals in terms of the targeted energy balance and composition that collectively connect to national scenarios. In this paper we present a simple but useful allocation approach to derive municipal targets for energy demand reduction and renewable expansion based on national energy transition strategies in combination with local potential estimators. The allocation uses local and regional potential estimates for demand reduction and the expansion of renewables and differentiates resulting municipal needs of action accordingly. The resulting targets are visualized and opened as a decision support system (DSS) on a web-platform to facilitate the discussion on effort sharing and potential realization in the decarbonization of society. With the proposed framework, different national scenarios, and their implications for municipal needs for action can be compared and their implications made explicit.
1 Introduction
The starting point of this research is a simple question, often posed by municipal stakeholders in energy transition efforts: “If we [as municipality X] achieve certain decarbonization and energy balance targets, is that enough?” What is meant by “enough” can often vary, but typically is referring to sufficient action for nationally achieving the goals of the Paris agreement. As the scope is different (i.e., municipal and national), it cannot readily be answered for a single municipality without additional assumptions about the surrounding environment, i.e., the national energy system and the ambitions and achievements of the other municipalities (Krog, 2019). From this national perspective, not all municipalities need or are able to achieve a net zero greenhouse gas (GHG) or a completely renewable energy balance individually, but only collectively (Muñoz et al., 2023). If some—typically bigger—municipalities will not be able to cover their energy demands renewably themselves, there must be other municipalities to supply them. Municipal energy transition goals should in aggregate match or exceed national goals, and their renewable energy balances must be accordingly collectively balanced. But there is little to no framework to ensure this (Leal and Azevedo, 2016); Most research is focused on climate neutral cities—its carbon accounting is considering the interplay with the surrounding energy system predominantly in terms of individual offsetting credits, which are known to require further work (Huovila et al., 2022) and are often found to be insufficient (Reckien et al., 2018; Salvia et al., 2021).
Much research is focused on evaluating different municipal plans and on developing and applying methods to benchmark incremental progress rather than normative targets (Zhang, 2023). In fact, carbon accounting of municipalities varies widely in both scope and method, rendering resulting accounting balances mostly incompatible. Carbon accounting per capita e.g., can give a good indication for individuals but does not help municipalities in identifying climate goals that sufficiently contribute to achieving Paris 2050. The same is true for energy balances, where there are virtually no quantifiable municipal targets considering national energy transition scenarios with certain effort sharing and allocation mechanisms, with notable exceptions: (Bertoldi et al., 2018; Farghali et al., 2020). This is in stark contrast to the widely available literature on effort sharing between nations on reaching Paris 2050 (Brown et al., 2018; van den Berg et al., 2020; Vatalis et al., 2022). Instead, the public debate on if and which renewables should be expanded is often split into a local and a national discussion, with a strong presence of NIMBY sentiments (“not in my backyard”). What is lacking in public discussions on effort sharing and allocation of expansion and reduction targets is the visualization of effects and consequences of political allocation decisions. For example, if a national region does not realize their wind power potential, which many national decarbonization scenarios depend upon, due to political reasons, the remaining transition scenario components are negatively affected; The country would need to realize this renewable energy potential elsewhere or with different carriers or save more energy accordingly. The resulting differences in allocation and effort sharing should be readily available for visualization and inspection to ground this much needed discussion in quantifiable facts.
This paper aims to contribute to this by providing a theoretical structure and example implementation for Austria for the following items:
1. A flexible allocation structure for all energy carriers and energy demands based on available reference data connecting national to municipal potentials.
2. Quantitative targets for all energy balance components for each municipality in Austria, depending on these relative potentials for energy savings and installation of additional renewable energy sources.
3. A comprehensive visualization for both the municipal energy balance target composition, and a national comparisons of all municipal balance components to aid local development paths and facilitate discussion on decarbonization effort sharing.
To the knowledge of the authors, such an allocation of sectoral demand reduction potentials and renewable expansion targets for Austria has been calculated only on county level (NUTS-3) in the work of Baumann et al. (2021), but not on the level of individual municipalities, where it is most effective and needed (Pasimeni et al., 2014).
2 Methods and materials
The general method for deriving municipal energy transition targets involves several steps as outlined in Figure 1. The first three steps involve data acquisition and homogenization, then mapping of energy data to geographic attributes and finally results visualization.
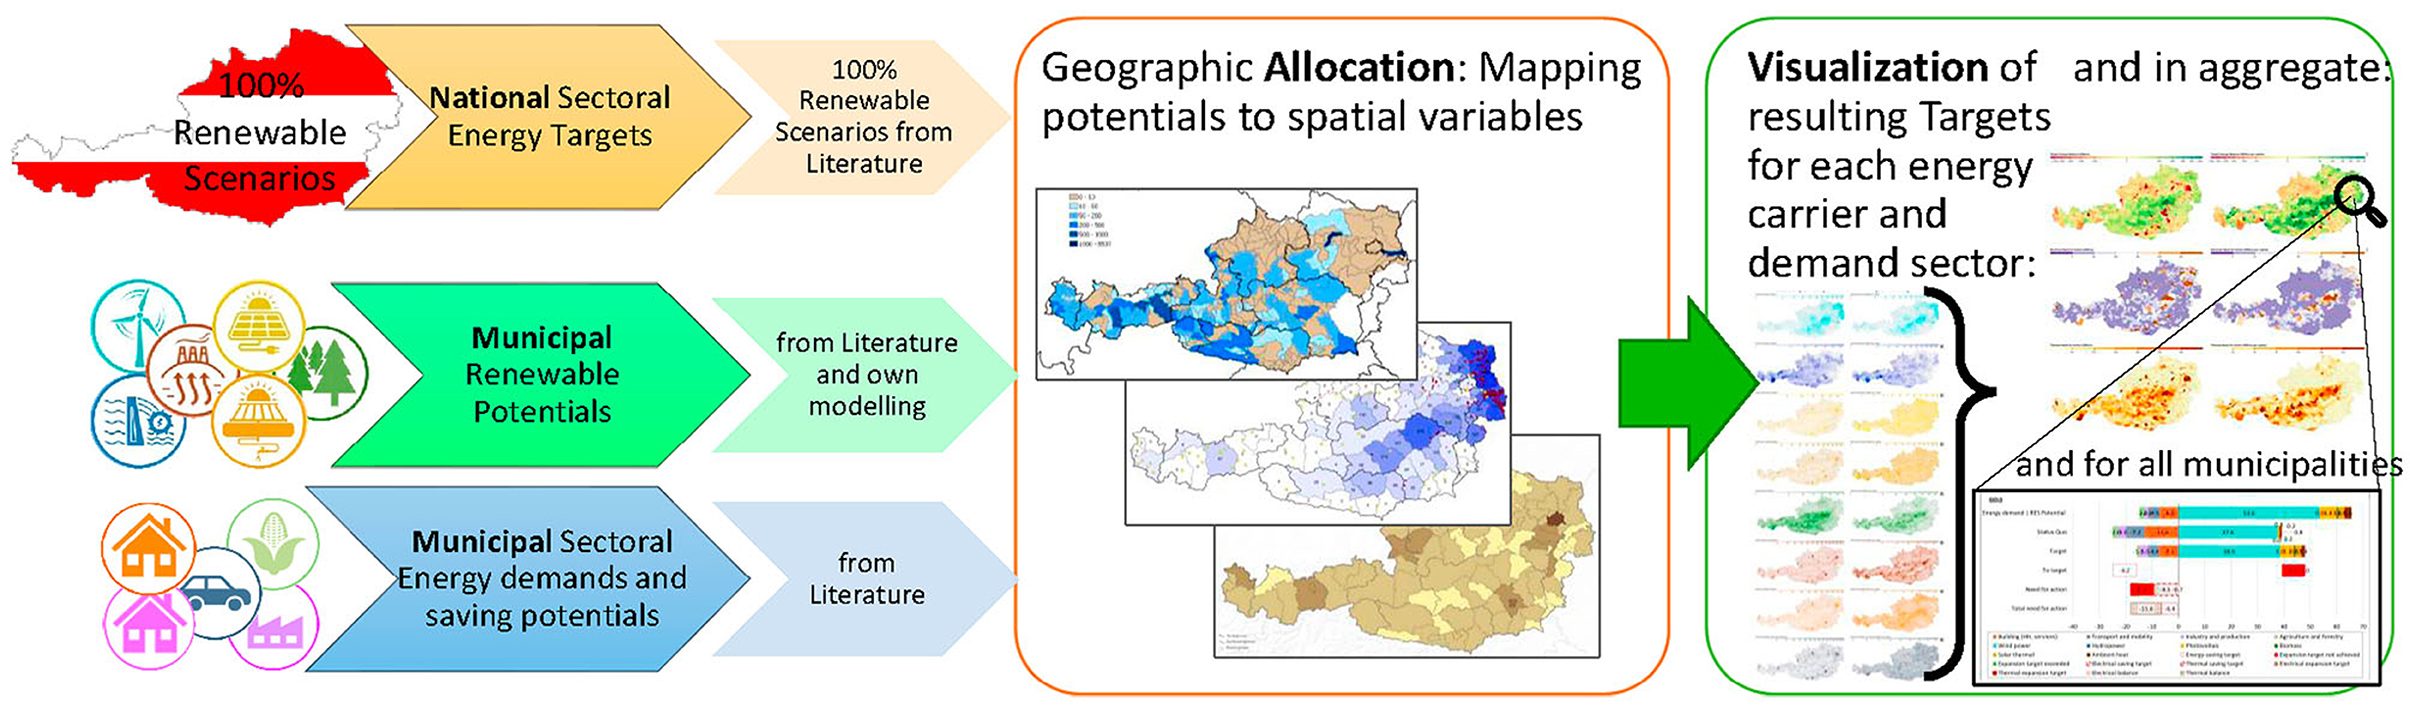
Figure 1. Method for sector-specific municipal targets.
2.1 Data acquisition and homogenization
First, a national baseline for renewable energy production and sectoral energy demand is established that should be achieved collectively by all municipalities. This is done by mapping existing energy transition scenarios for a 100% renewable energy system in Austria to a uniform balance structure. From there, any scenario can be selected for further study. If the categorization is not sufficient in scope or detail, additional supply and demand categories can be introduced by establishing the same geographical allocation associations as for the others. The selected scenario subsequently provides national renewable energy supply and demand targets and serves as a guideline for the transition to a 100% renewable country. Due to the uniformly defined data structure of the scenarios, they can also be readily exchanged for one another and compared. Second, the total national renewable potential, as well as its geographic distribution is researched from literature where available and modeled based on geographic characteristics where necessary. Third, data on sectoral energy demand is collected, and saving potentials are identified through literature review. These steps determine the underlying potential for energy saving and energy demand for any given scenario.
The determination of renewable potentials at the municipal level is carried out in one of two ways: In general, the potential for renewable energy technologies is calculated using municipal level data. This covers photovoltaics (PV), solar thermal (ST) and biomass utilization. Only in cases where the required municipal level data is missing, the potentials are estimated by distributing the potentials only quantified at county level or above according to their relative overall size. This was done for wind power, hydropower, and ambient heat. A detailed account of all allocations used is given in Section 3.2. Municipal energy balances then require the juxtaposition of these renewable energy potentials with energy consumption and future demand data by key sectors. This also requires targets for energy savings and future energy demands within each sector. The necessary consumption and demand data structure was categorized into five sectors: Household (HH), Agriculture and forestry, Industry and production, Services, Transport, and mobility.
Table 1 provides an overview of the main materials and literature sources used to obtain the results. They will be referenced in their detailed sections.
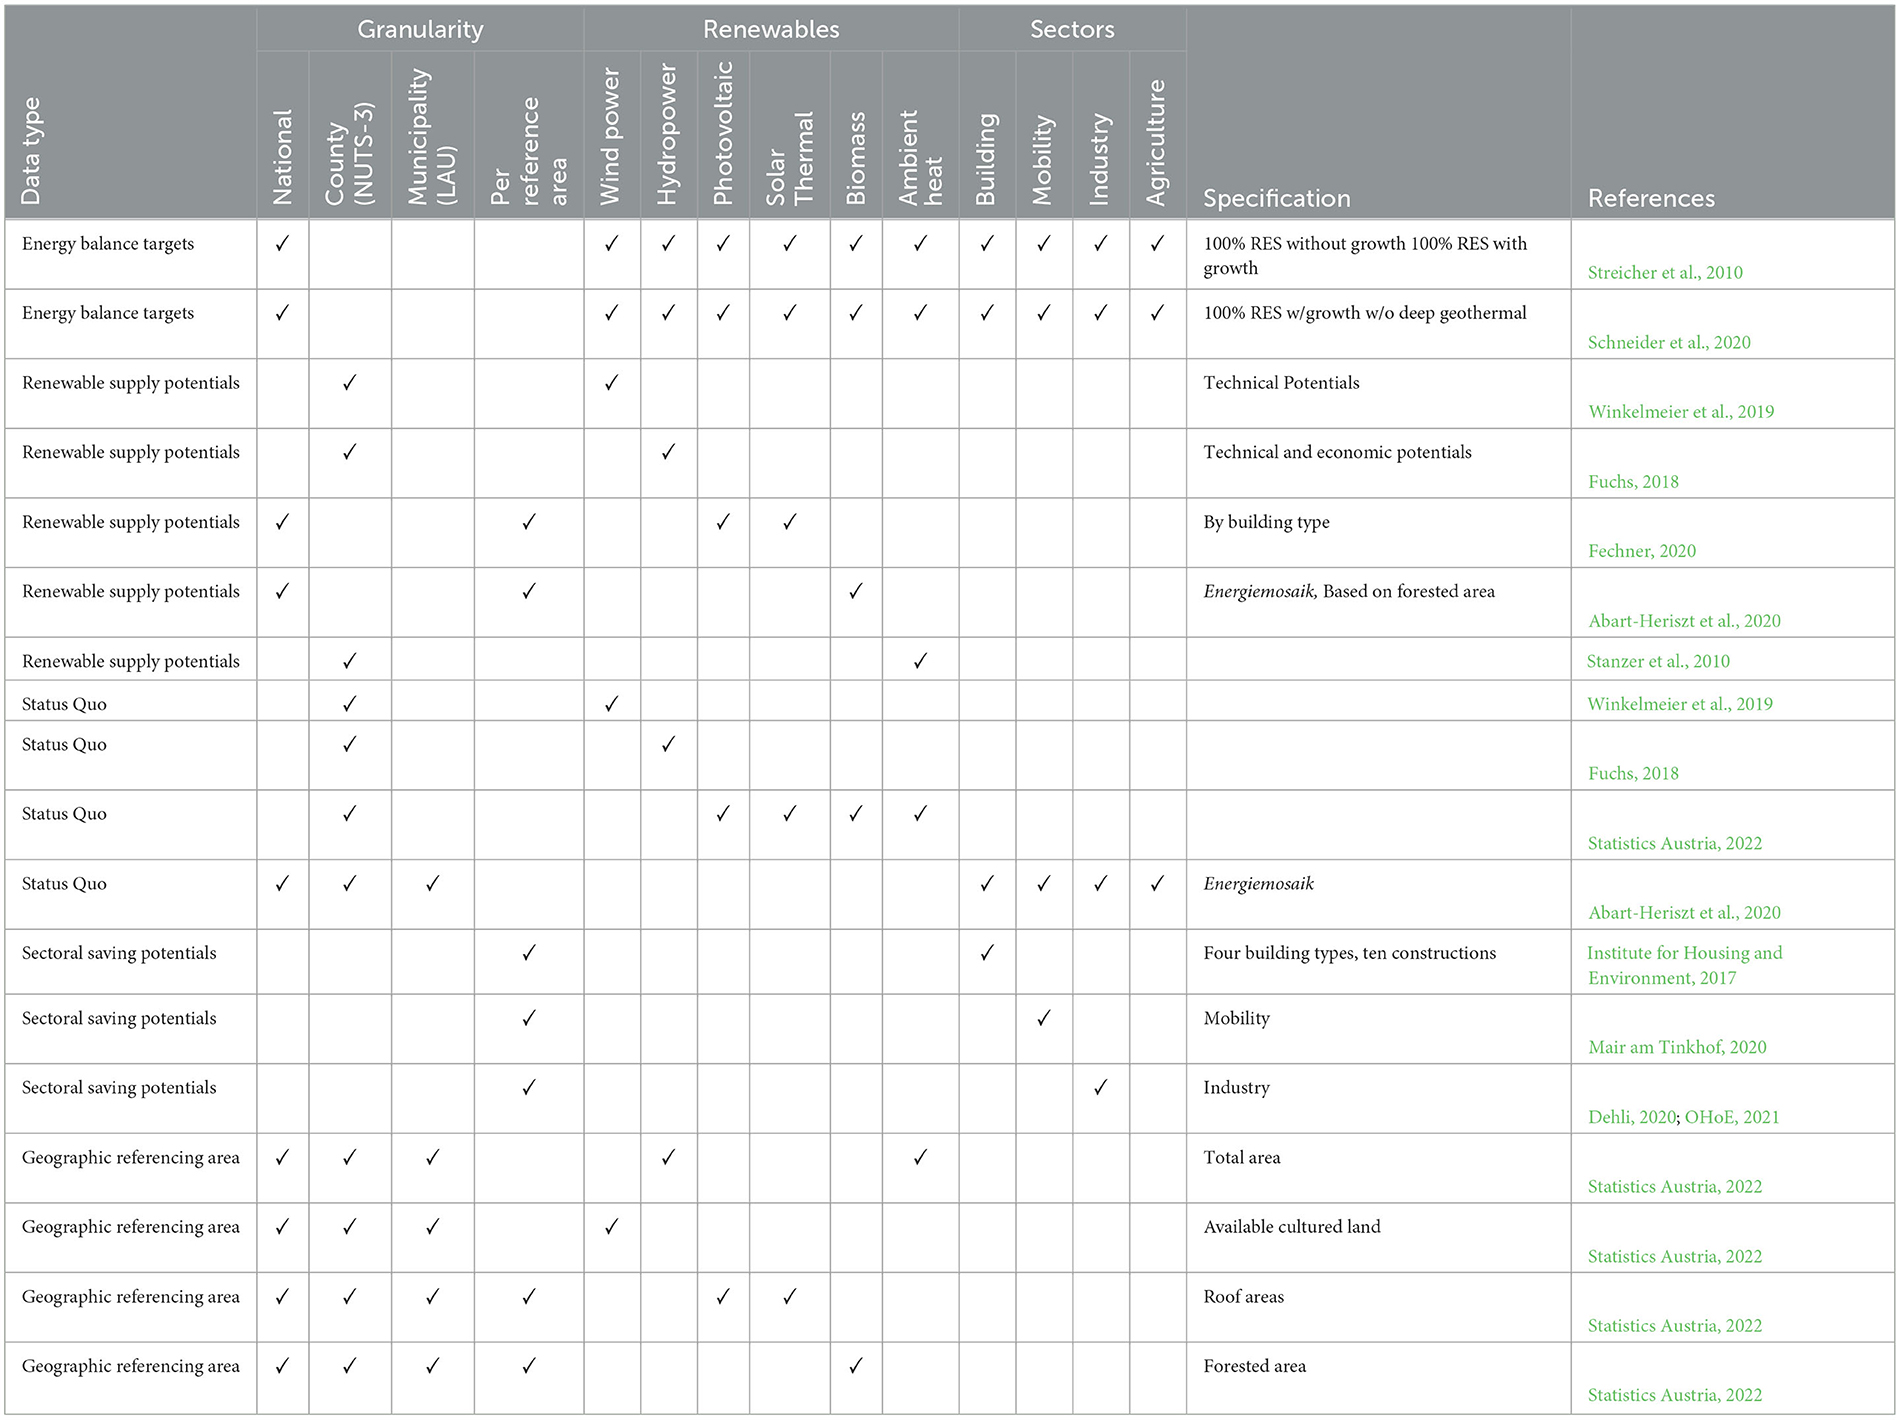
Table 1. Overview of materials and data used.
2.2 Geographic allocation of renewable energy expansion and demand saving potentials via spatial variables
The energy supplies and demands—and their respective expansion and reduction potentials—are allocated geographically to municipal level by correlating them to spatial variables in a set of allocation scenarios. For example, a national scenario requires a certain energy target Tn,BM of biomass utilization. This renewable supply is then associated with the geographic attribute of forested area An,F on a national level. To derive the municipal target for biomass utilization Tm,BM, the national target An,F is allocated according to the municipal share of the associated national variable, in this case the forested area. This ensures a balanced distribution of target contribution across different regions in respect to their relative potentials regarding renewable energy implementation, energy-saving opportunities, and other energy demands specific to each region such as industries. It also ensures that the corresponding targets of the underlying national scenario are collectively met. The main design parameters of these allocation scenarios are the choices of spatial variables and associated allocation functions. They must be transparent, easy to understand and readily changeable to ensure that allocations are comprehensible and can be discussed and compared. Table 2 introduces the three main resulting energy balance quantities: The current Status-Quo S, the technically achievable potential P, and the resulting annual Target T. Each of these quantities are available for all levels of geographic aggregation g, all renewable energy supply carriers e, as well as all sectoral demands D. These designations are consistently used throughout this paper. The geographical indices and the nomenclature of the energy supply carriers e and sectoral energy demands D is also summarized in Table 2 and specified in the corresponding sections.
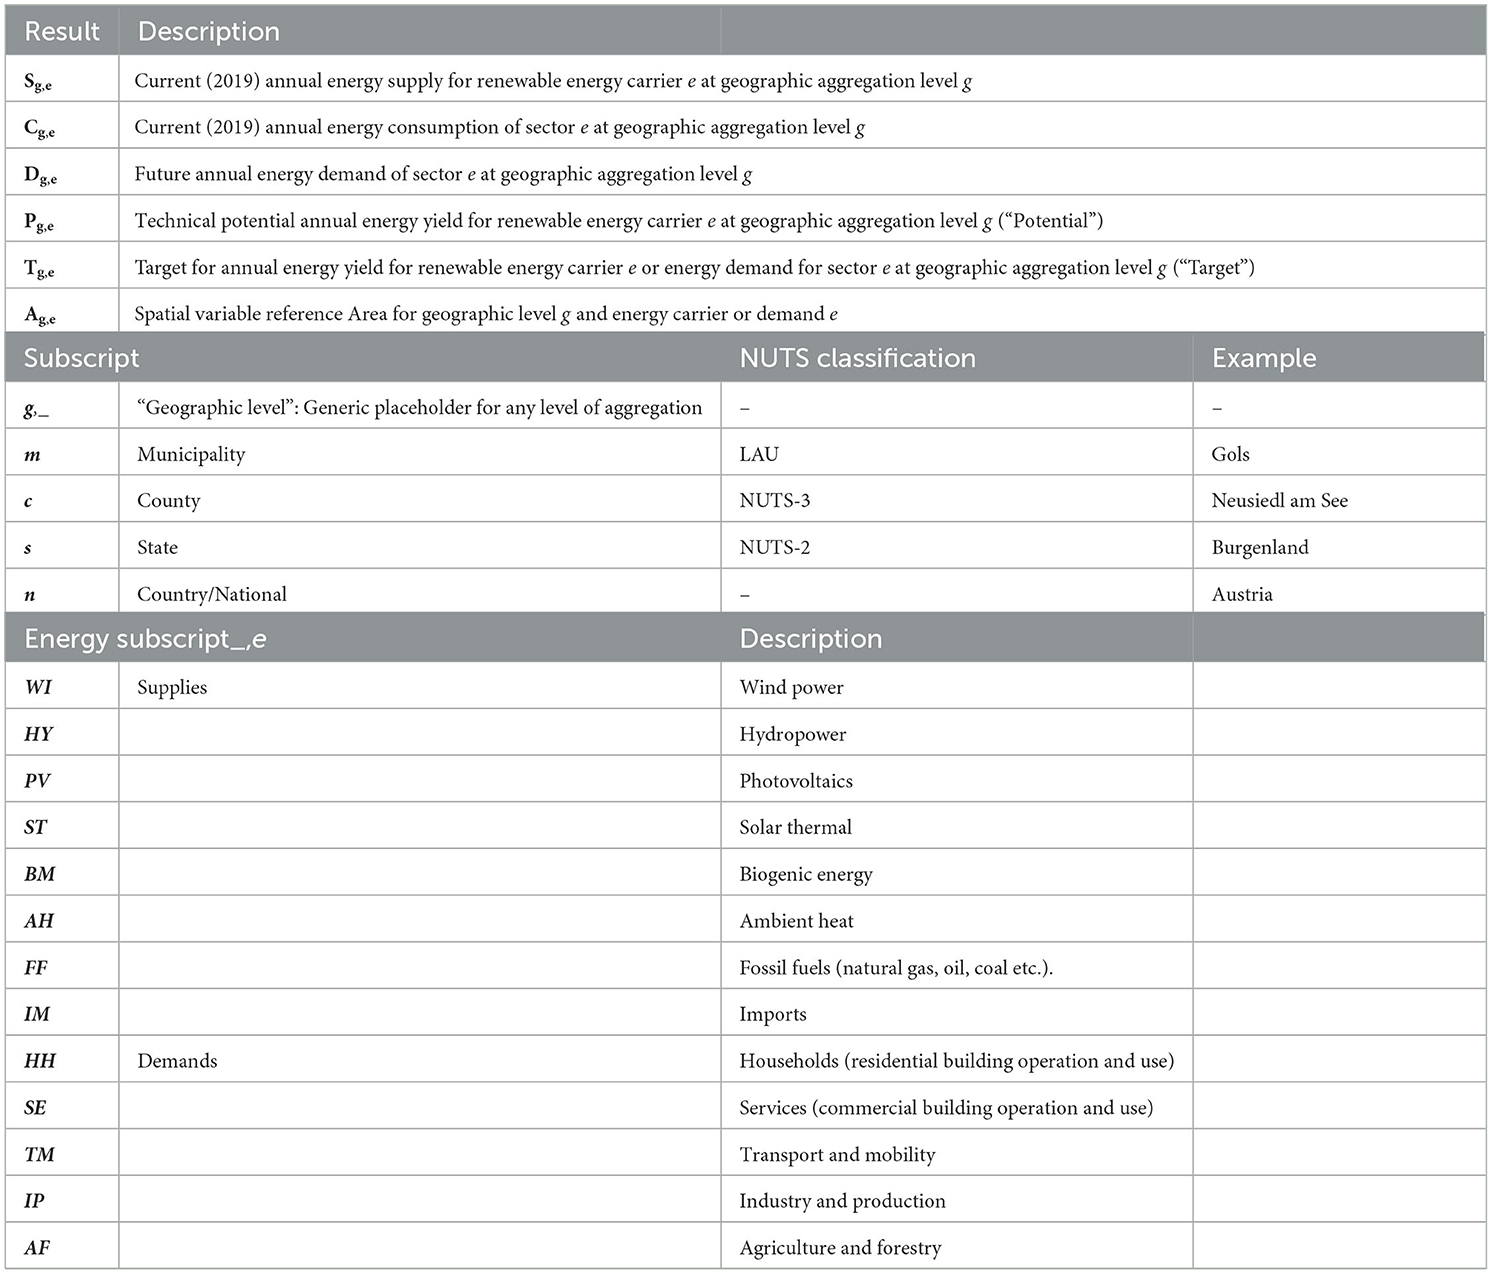
Table 2. Designation of resulting key energy quantities and indices.
The allocation employs the principle of equal effort, wherein the municipal target for any component of the energy balance (renewable supplies and demands) is equal in share to its potential. The municipal potential is determined through two distinct methods (Equations 1, 2).
When municipality-specific data is accessible, the potentials of renewable energy generation are calculated according to specific energy intensities, which link them to the designated reference area (Equation 3):
In cases where such data are not available, area ratios between the municipality and county level are used to derive the potential from the county level (Equation 4):
The future sectoral energy demands are calculated using a sector-specific reduction factor (that can be linked to a reference area, Equation 5):
2.3 Results visualization
Finally, the results of the geographic allocation including the municipally distributed targets are visualized through interactive balance charts and maps on the web as a decision support system (DSS). This allows a comprehensive and visually appealing representation of the allocated potentials and targets, providing stakeholders and decision-makers with a clear understanding of the spatial distribution and progress toward achieving climate-neutral objectives. By leveraging the power of data visualization, the approach enhances transparency, facilitates communication, and fosters informed decision-making in the pursuit of a sustainable and climate-neutral future. The visualizations are published under open source policy and is available under https://observablehq.com/@editp/allocation-of-national-decarbonization-targets-to-municipal-level-in-austria.
3 Results
This section presents three intermediary results required to estimate the resulting energy balance targets on municipal level: National sectoral targets, renewable supply potentials and energy consumption and saving potentials on municipal level.
3.1 National sectoral targets
The following literature was identified to include future renewable energy scenarios for Austria. The method presented in this paper is exemplified by these national scenarios, but not limited to it: With the scenario and energy balance structure defined in Section 2, it can be used to represent any given distribution of energy carriers and demands. The literature review yielded several sources that described a (nearly) hundred percent renewable energy supply of Austria, as shown in Figure 2. For demonstration purposes of this paper, the latest 100% scenario of Schneider et al. (2020) was selected, which in turn is based on Streicher et al. (2010). The original study by Streicher et al. (2010) analyzed the “Energy self-sufficiency for Austria 2050” and aimed to investigate the feasibility of achieving a 100% energy supply in Austria by the year 2050 through self-generated renewable energies. Two main scenarios were investigated: One without additional societal growth and consumption rates of 2008, and Second with an average growth rate of 0.8% p.a., resulting in a 40% increase by 2050 compared to 2008. Other studies, such as Krutzler et al. (2017) and Veigl (2017) were not considered as examples, as their scenarios featured non-renewable fossil-fuel components of 10 and 6%, respectively, due to their analysis being focused on energy savings and cost-optimal decarbonization rather than 100% renewable supply. Schneider et al. (2020) aimed to represent a scenario of 100% renewables with growth with the notable omission of deep geothermal exploitation from Streicher et al. (2010), instead substitution with additional wind and PV and recent mobility assumptions from Krutzler et al. (2017), as elaborated in Schneider et al. (2020). Figure 2 illustrates these future scenarios and their respective target balances. The required sectoral energy demand is shown on the left. On the right are the targets for the different energy utilizations.
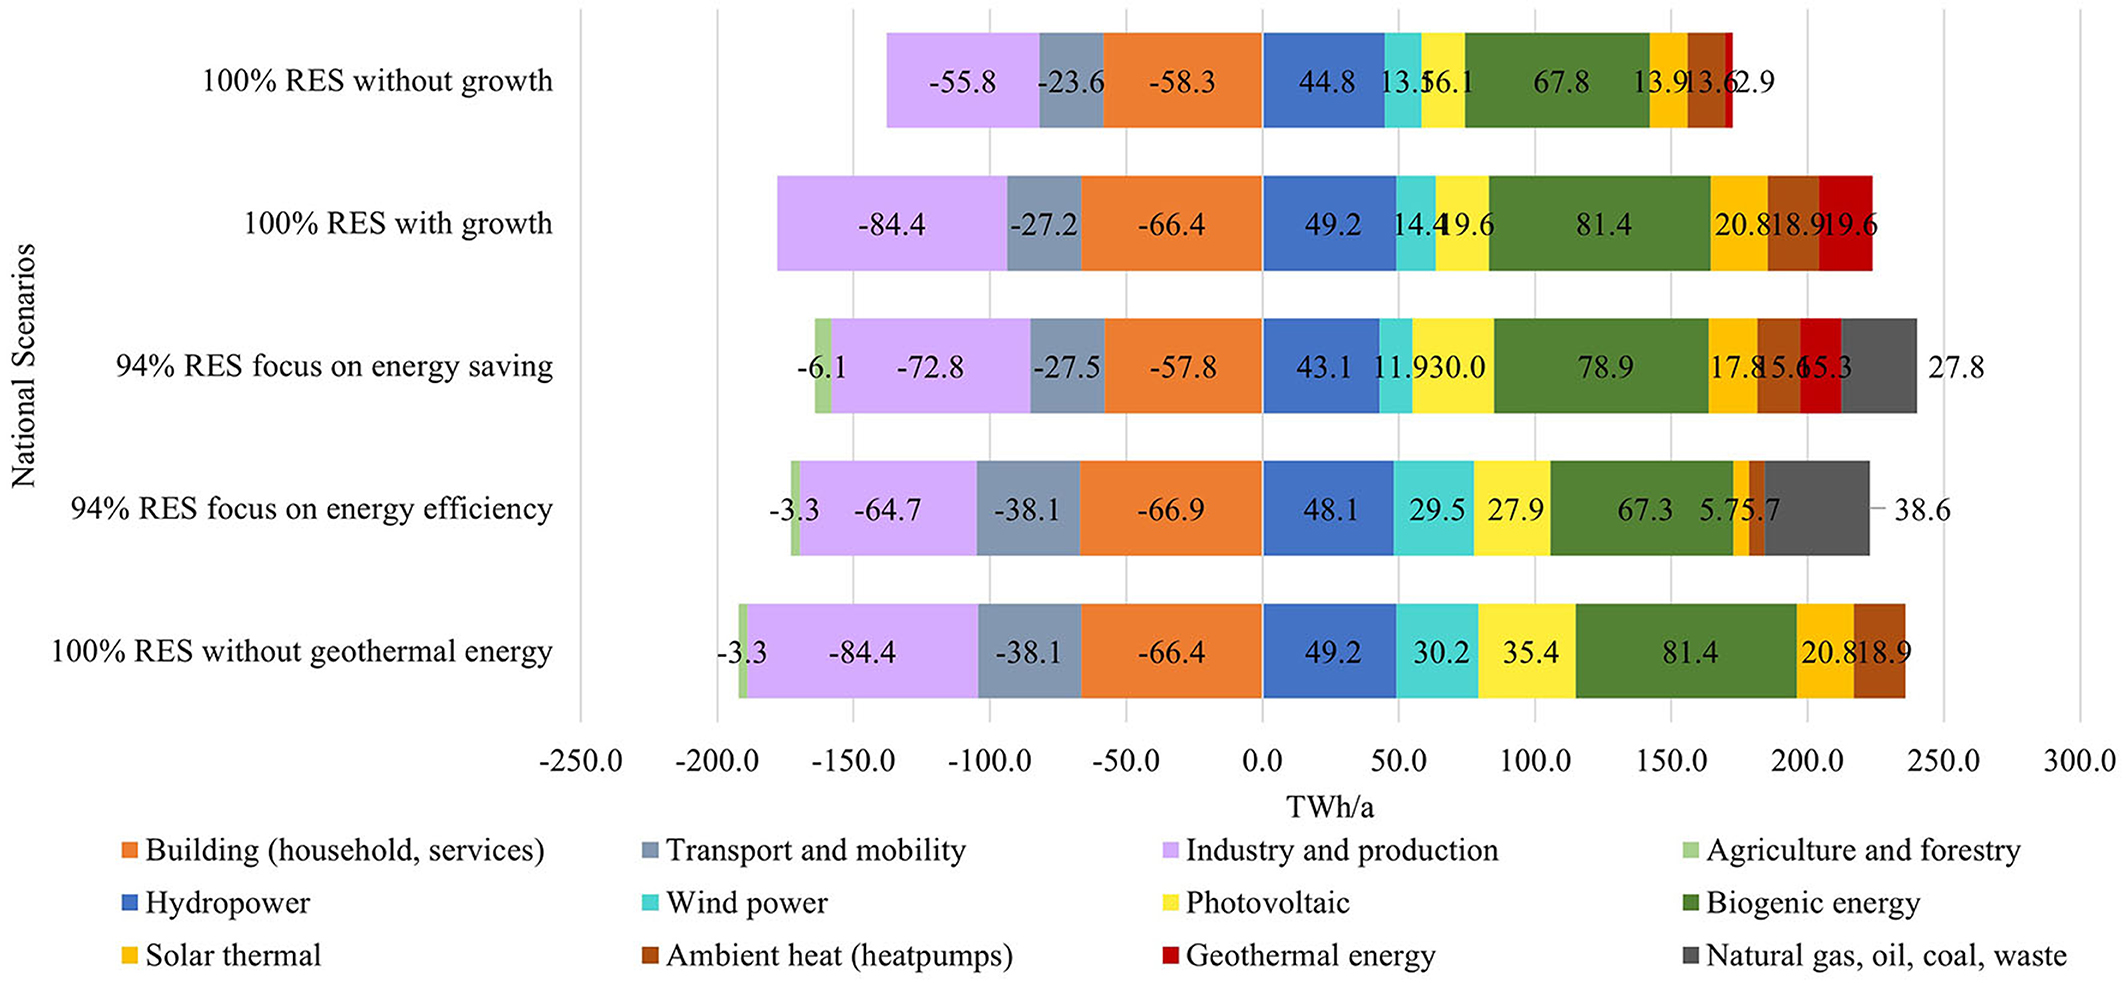
Figure 2. The targets for 2050 according to the studies in TWh per annum. Left: energy demand, right: energy generation from renewable and fossil energy technologies.
3.2 Renewable supply potentials
Table 3 summarizes the potentials of renewable energies from photovoltaic and solar thermal systems. Due to their competition for space, the maximum expansion potentials are separately listed in two distinct scenarios, one with electric and one with thermal expansion priority, respectively. For now, a simple contravariance was assumed, meaning that PV and ST are considered exclusively. There is of course possibility for additional scenarios with different distributions and combination of systems.
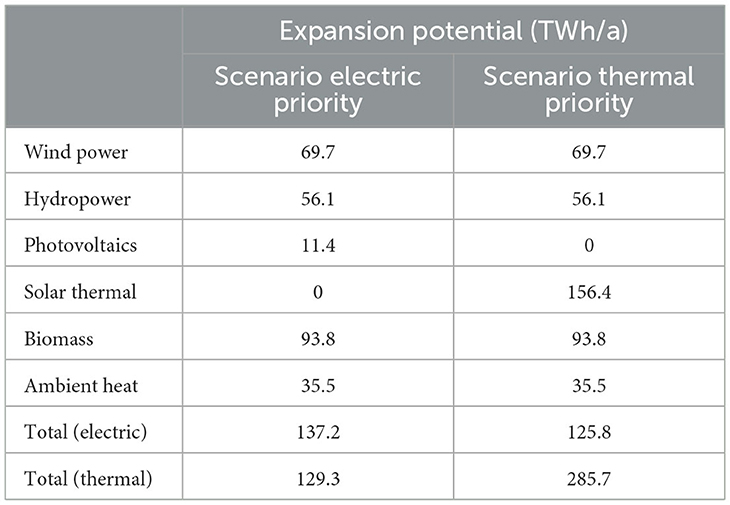
Table 3. National expansion potentials for renewable energy technologies in TWh per annum.
3.2.1 Wind power
The wind power potential is derived from the study Winkelmeier et al. (2019), in which the technical wind power potential was assessed at county level (NUTS-3), which requires downscaling to municipal level. This was done pro rata for the available agricultural areas on municipal and county level, respectively. The potential assessment itself was considering these main aspects: Based on planned land use (area reserved for settlements and infrastructure), protected areas (national parks, nature reserves, and Natura 2000), unsuitable terrain conditions and land cover, available wind resources and finally technology and costs of installations. Depending on the wind conditions and achievable yield, locations in Austria were classified into three quality classes: A, B, and C. According to the study, Austria is assumed to have a wind power potential of 32,939 MW, which is divided down to the county level. The wind power potential for quality class A is also separately available at the county level and amounts to 10,209 MW. The potentials for quality classes B (8,214 MW) and C (14,516 MW) are available only as national aggregates. Therefore, the total potential has been separated into quality class A and quality classes B + C in aggregated and calculated on county level. For municipal level, a specific wind potential in MW/m2 is calculated using the agricultural area as spatial variable. The municipal potential (Equation 6) calculated by multiplying the specific wind power potential of the county with the municipal agricultural areas, where the different quality classes refer to different full-load hours tf. Table 4 summarizes the information on the quality classes and the expected annual potential. On the basis of the calculations, the annual generation potential of wind power plants in Austria is 69.7 TWh.
To determine the remaining potential at the municipality level after existing installations, it was assumed that 3,018 MW of currently installed wind power capacity are located exclusively in quality class A sites. This means that the entire potential of quality class B + C is remaining as untapped potential and only roughly two thirds of the quality class A potential remain unclaimed. With this remaining potential, a specific remaining wind power potential is calculated for each county based on the county's agricultural area, following a similar approach as for the total potential. The remaining wind power potential is then scaled up for each municipality based on its agricultural area.
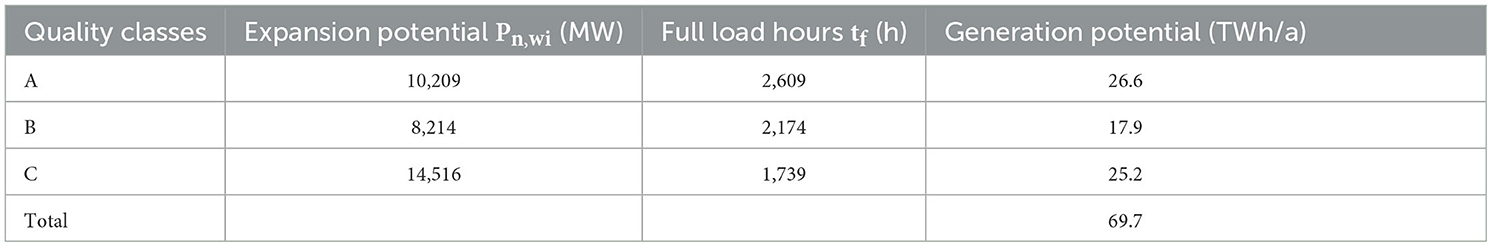
Table 4. Annual potential for wind power generation in Austria based on Winkelmeier et al. (2019, p. 20).
3.2.2 Hydropower
Data on the technically economic hydropower potential were obtained from Fuchs (2018, p. 12), which defines the potential as the technical-economic hydropower potential that can be reasonably realized under the given technical and economic conditions. For the assessment of the potential, sub-areas were classified with reference to their suitability for hydropower utilization. The study gives a value for Austria's hydropower potential of 56.1 TWh. This data on hydropower potential is available at county level. Municipal potentials were derived by Equation (7), using the total areas of municipalities and counties for allocation.
The determination of the remaining potential was obtained by subtracting the installed power plant capacity from the total technical-economic potential, resulting in a remaining potential of 16,000 GWh (Fuchs, 2018, p. 35). The estimation of the municipal potentials is analogously scaled to the total potential by the share of municipal to county land area.
3.2.3 Photovoltaics
The PV potential was estimated using a study Fechner (2020) with a focus on identifying suitable areas for PV systems within various space use categories such as buildings, including commercial and industrial areas, transportation and military areas, as well as agricultural and forestry areas. The objective of the study was to determine the potential of these areas for generating energy through photovoltaic systems and to evaluate the feasibility of implementing this potential by 2030. It analyzed various aspects, ranging from theoretical/physical considerations to technical, economic, ecological, and social factors, to identify the barriers that need to be overcome during the implementation of the PV potential. These barriers could include technological limitations, economic constraints, environmental considerations, and social acceptance. Table 5 shows the potential of PV from the physical-theoretical to the economic/social potential based on the study (Fechner, 2020). However, for this paper, the assessment of the potential is limited to the building sector only.
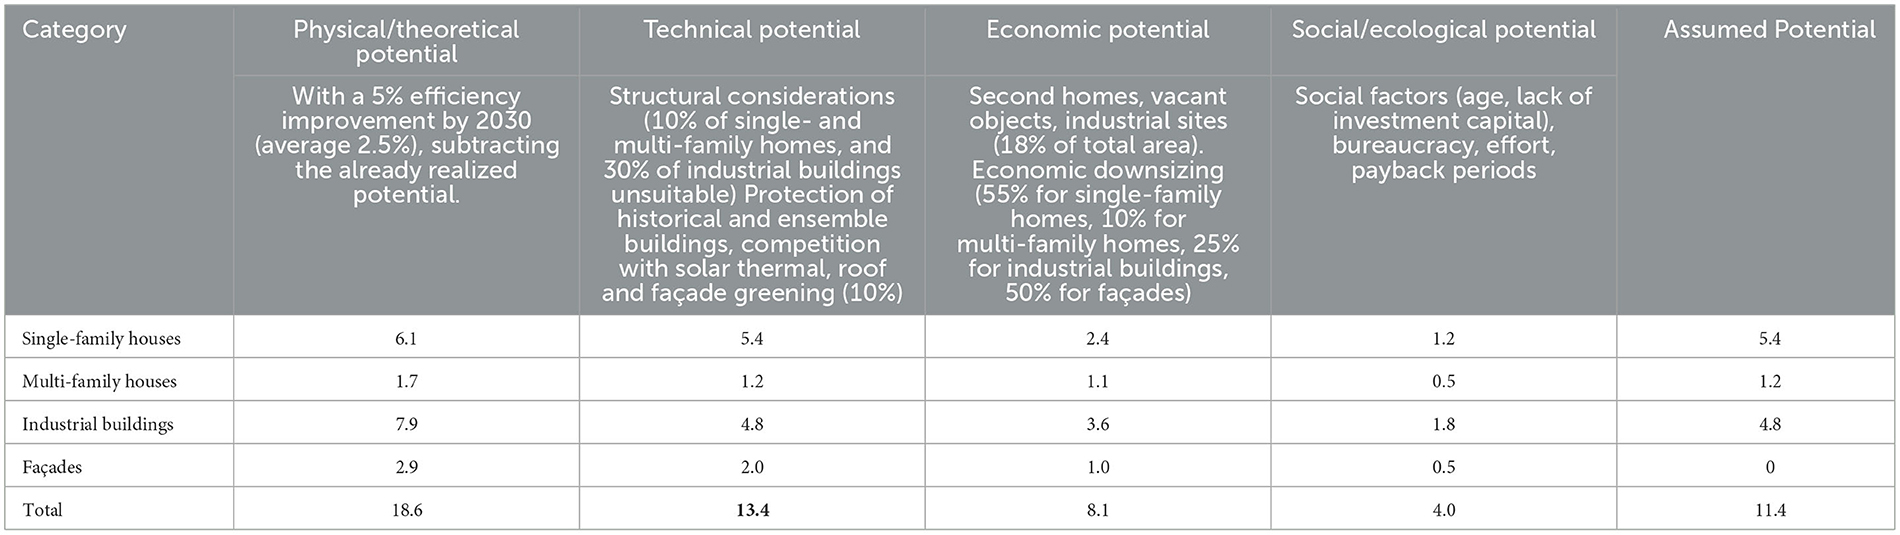
Table 5. Potential of photovoltaics: from physical/theoretical to economic/social potentials (data in TWh) based on Fechner (2020, p. 26).
This results in an estimated PV potential of 3.5 TWh/a when excluding façade utilization. However, to meet the national energy and climate targets, specified in the Renewable Expansion Act [Nationalrat, 2022, §4 (4)] to an annual PV generation of 11 TWh/a, additional technically feasible potential must be utilized. Excluding façade areas, the resulting annual 11.4 TWh/a would be sufficient to cover the national target. The municipal allocation of this target was carried out according to the share of roof areas in each category, which were obtained from the Austrian national building stock register count in 2011 (Statistics Austria, 2022) by approximating the roof area to the gross floor areas over the number of floors in each category. Equations (8) and (9) show how the total potential is determined using specific PV yield values and roof area.
To estimate the overall potential at the municipal level, three different scenarios are provided: (i) The potential based on the original study (Fechner, 2020), (ii) the potential with increased specific yields (kWh/m2roof), (iii) specific utilization of pitched roofs [single-family houses (SFH)], flat roofs [multi-family houses (MFH)], and industrial roofs, as well as specific PV yield in kWh/m2PV. Potential (i) on municipality level is calculated via the determined roof area. The survey results from the consideration of east-west oriented roofs, which were not used for occupancy in the potential study. To compensate for the resulting inadequate specific yield values, a surcharge factor of 1.67 (due to five instead of three orientations) and a discount factor of 0.93 (due to the reduced solar irradiation for east and west orientations compared to the south-facing modules) were considered in scenario (ii). The municipal potential is determined using the determined roof area and specified yields as well as percentages for PV occupancy for steep, flat, and industrial building roofs (Equation 10). Default values for specific yield values is 170 kWh/m2PV, as well as 35% for steep, 55% for flat and 70% for industrial building roofs, leading to scenario (iii), which was used for demonstration purposes.
Table 6 summarizes the collected roof area, specific yield values, and the sum of the options for the total PV potential in Austria.
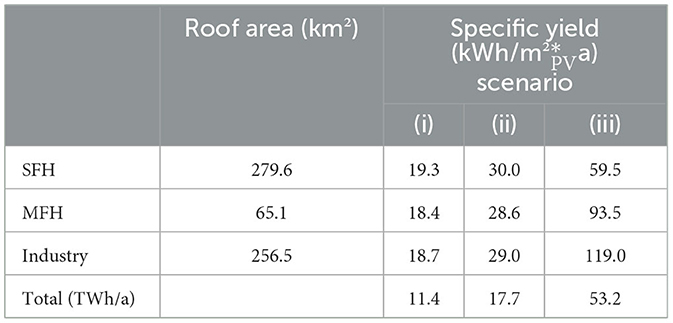
Table 6. The collected roof area, specific yield values, and the total PV potential in Austria.
The estimation of the remaining potential involved leveraging data on subsidized installations at the municipality level, obtained from Statistics Austria (2022). This data provided information on the exploited installed capacity of subsidized projects within each municipality. The total installed capacity of these projects amounted to 1.78 GWp. To contextualize this information, it was compared to the total installed capacity in Austria, which was reported to be 2.5 GWp (Wien Energie GmbH, 2021). The ratio of the sum of subsidized installations to the total installed capacity, was used to allocate the proportion of the total capacity attributable to each municipality. This allows for an assessment of the distribution of installed capacity among municipalities and facilitates the estimation of the remaining potential for further development in those areas.
3.2.4 Solar thermal
For the ST potential the same roof areas were used as in the PV case, but there is competition for space between the two technologies. It is assumed that the heat and domestic hot water demand in industrial buildings is the highest, which is why ST installations are mainly expected on industrial roofs. When specifying the utilization rates of these roof areas, the PV potential is correspondingly reduced (Equation 11).
The total ST potential for Austria amounts to 156.4 TWh of thermal energy per year. The current energy production of ST systems in Austria was obtained through statistical data (Statistics Austria, 2022). As the available data was at the states level, the energy production quantities were scaled down to the municipality level based on the ratio of municipality roof area to state roof area.
3.2.5 Biomass
The biomass potential was estimated based on forested Areas. According to Abart-Heriszt et al. (2020), Austria has a total forest area of 4.88 million hectares. The average annual growth is around 8.9 solid cubic meters (scm) per hectare (Federal Ministry of Agriculture Forestry, Regions and Water Management, 2019, p. 8). Solid cubic meters are converted to stere (st) with a factor from literature of ~1.8 st/scm. With an average calorific value of 1,500 kWh/st, the maximum potential, assuming the utilization of the entire annual growth, amounts to 93.85 TWh/a:
The current biomass utilization is estimated based on the forest area of each municipality. For the maximum potential, 100% of the annual growth is allocated, while for the current utilization, it is assumed that 90% of the annual growth is harvested and only 30% of that harvested biomass is used for combustion (Equation 12):
3.2.6 Ambient heat
According to this study (Stanzer et al., 2010, p. 131), the geothermal heat potential in Austria is estimated to be 35,506 GWh per annum and available at county level. This potential correlates with the heat demand, which was derived as follows: (i) The number of buildings for each type, that the study uses (i.e., four building types and six construction periods, resulting in 24 distinct types) was determined on a county level, (ii) determination of the residential or usable areas for all building types per county, (iii) for each building type, a heating energy indicator from literature is assigned according to the construction periods and building types, (iv) the indicator for the heat demand for domestic hot water was assumed to be 3,600 kWh per household. In addition, a minimum efficiency requirement was introduced that ruled out heat pump systems for space heating for building types constructed before 1981. Finally, the municipal potentials are allocated from county level based on the total municipal and county areas (Equation 13).
The data on current energy production from near-surface geothermal energy was obtained from Statistics Austria (2022) at the county level (NUTS-3). The energy production at the municipality level was scaled based on the ratio of municipality area to county land area. This approach allowed for a more detailed analysis of near-surface geothermal energy production, considering the specific characteristics and sizes of municipalities within each region. By scaling down the regional data to the municipality level, a more accurate picture of near-surface geothermal energy generation across Austria was achieved. The remaining potential for the municipalities, as well as the overall remaining potential for the country, is determined by calculating the difference between the total potential and the already developed potential.
3.3 Energy consumption, saving potentials and future demands
The final energy consumption status quo from Abart-Heriszt et al. (2020) for Austria in 2019 and its sectoral distribution was used. In the following sections, the sectors are presented individually, outlining their components, and how they were integrated to fit into the structure of the future scenarios. These consumption data are available on municipal level, further differentiated in subgroups with one or two dimensions, which can be found in the Appendix.
The energy saving potential of municipalities is estimated from so-called reduction factors that are an estimate for the attainable energy demand savings of any given sector and current energy consumption. The energy saving potential is based on municipal data, but the calculation of the Reduction factor depends on the sector. It should be noted that the projected energy demand represents only one possible scenario, which may vary depending on changes in the reduction factors.
Table 7 complies the initial current final energy consumption for the year 2019 and the future final energy demand based on calculations involving reduction factors applied to the current energy consumption values.
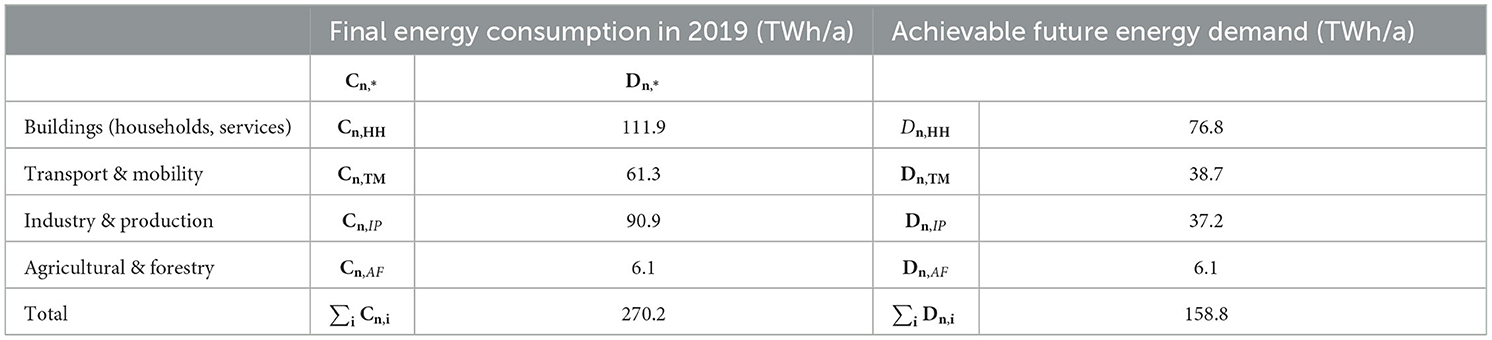
Table 7. Austrian final energy consumption in 2019 and the achievable future energy demand per sector.
3.3.1 Building (household and services)
In the case of buildings, a reduction factor represents energy savings for energy efficiency measures such as renovation and optimization of heating and hot water systems. This was operationalized using two parameters readily available in municipal statistical data: the year of construction and a rough building type (single-family houses and multi-family or multi-storey houses from TABULA) for each built area. The TABULA (Typology Approach for Building Stock Energy Assessment) Webtool features a set of energy performance indicators (energy costs, CO2 emissions, heat demand, primary energy demand) and provides online calculations of exemplary buildings, showcasing their energy characteristics and the potential energy savings through the implementation of renovation measures. The package of measures includes the modernization of the thermal envelope and the heating supply system (Institute for Housing and Environment, 2017). The national building typology in TABULA is defined by a “Building Type Matrix,” with four main building typologies defined: single-family houses, terraced houses, multi-family houses, and apartment blocks.
The rows of the matrix correspond to different construction year classes, which align with the years available in Energiemosaik. This alignment allows for a seamless combination of data between TABULA and Energiemosaik, facilitating comprehensive analyses and assessments of the building sector's energy characteristics.
To obtain the reduction factor, the following approach was employed: Data on energy consumption before and after renovation for each of the four building size classes [SFH, terraced houses (TH), MFH, and apartment blocks (AB)] was collected. The difference between the energy consumption before and after the renovation was then determined and referred to as the energy-saving potential, and the corresponding fraction as the Reduction factor.
Subsequently, the four building size classes were mapped onto the two available categories for energy consumption from Energiemosaik (Abart-Heriszt et al., 2020): “single-family houses and terraced houses” and “multi-family houses and apartment blocks” by using the average reduction for each category. The projected energy demand of municipalities in the household sector is then determined by multiplying the individual reduction factors with the respective final energy consumption. Table 8 displays the reduction rates for consumption sourced from the TABULA website, alongside the corresponding calculated relative reduction factors. Additionally, it provides the net floor areas for the buildings based on data extracted from Energiemosaik.
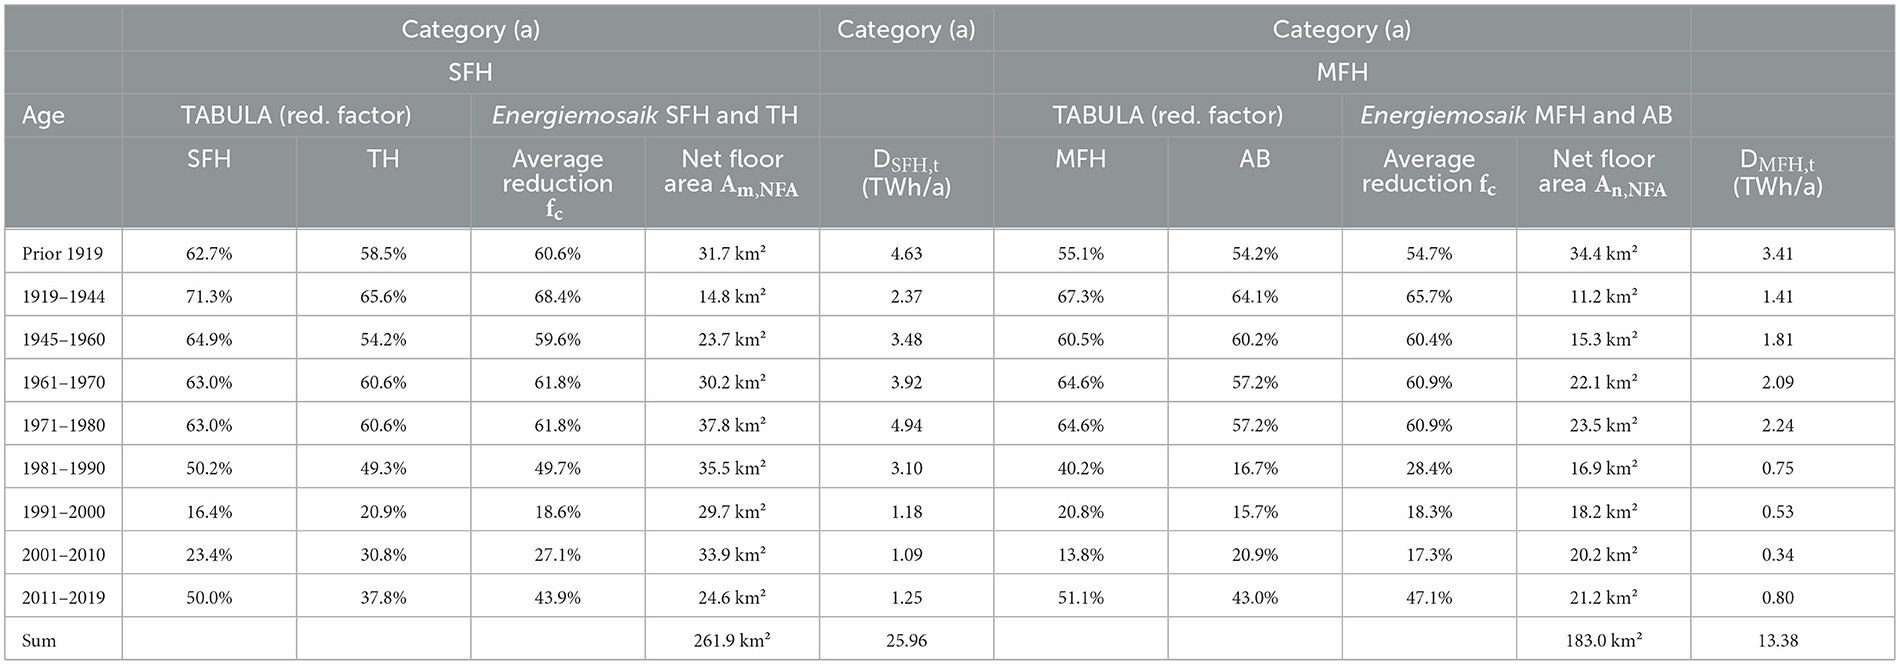
Table 8. Reduction factors and living spaces of household buildings.
The Equation (14) represents the total energy demand for the household sector. It is calculated by sum the energy demand for each building category (a) across all construction periods (t).
In the case of sectoral services, the focus is primarily on renovating the buildings themselves, while the optimization of processes related to the specific services is not considered. To determine the reduction factor for this sector, the average value of the housing category was calculated and used as the reduction factor for services (Equation 15).
The end energy consumption of the sector services is then multiplied by reduction factors. The results obtained in this way lead to the future final energy demand (Equation 16).
3.3.2 Transport and mobility
To estimate the energy saving potential of daily mobility, the spreadsheet tool described in Mair am Tinkhof (2020) was used. The tool provides calculation of various indicators related to everyday mobility in settlements and neighborhoods, considering planned mobility concepts and local conditions and offers diverse options for influencing the calculation of everyday mobility. To develop a comprehensive methodology with a broad applicability, it was decided that in future scenarios all passenger cars will be electric vehicles charged with green electricity. Based on these assumptions, the current and future GHG emissions and the primary energy demands were calculated. The ratio between the two was used as reduction factor ftm for the transport and mobility sector. The energy consumption data from Energiemosaik is multiplied by the ftm to calculate the energy demand of the transport and mobility sector in the future (Equation 17). This gives an estimate of the achievable energy demand reduction in the sector based on the assumed improvements in energy efficiency and the transition to electric vehicles charged with green electricity.
3.3.3 Industry and production
In the industry and production sector, energy savings were assumed to be obtained through process optimization and automation, as well as the use of energy-efficient equipment and lighting. Technological improvements and automation offer a straightforward and effective path to enhancing energy efficiency. According to Dehli (2020), meaningful opportunities for increasing energy efficiency include:
• Enhanced insulation in technical facilities.
• Utilization of both central and decentralized combined heat and power systems.
• Implementation of energy management systems.
• Deployment of energy-efficient components, such as pumps, fans, refrigeration systems, electric motors, air technology, devices, and lighting techniques.
An overview of end energy consumption in different application areas within the industrial sector is also provided in Dehli (2020): It clearly illustrates that the most significant application areas are process heat, space heating, and domestic hot water, which together account for over 70% of the total end energy consumption. Mechanical energy comes second, constituting 23% of the overall consumption. The underlying data for this analysis again is sourced from Energiemosaik (Abart-Heriszt et al., 2020). By weighting the shares of application areas and their corresponding saving potentials, an overall fip is derived. To obtain the projected energy demand of the sector, the end energy consumptions from Energiemosaik data are multiplied by this fip (Equation 18).
3.3.4 Agricultural and forestry
A reduction factor for the agriculture and forestry sector was not considered as it constitutes only a minor share of 2.3% in the total end energy demand and does not significantly impact the overall analysis. This can be addressed in future research by defining the desired allocation function and spatial variable as necessary.
3.4 Target allocation
As part of the result visualization, several figures were created, that can be accessed via a spreadsheet tool and the DSS website. The website also presents heatmaps showing the results in a clear and comprehensive manner. The heatmaps cover renewable energy sources, energy consumption, energy-saving potentials, and the future energy demand of the sector. Additionally, the website features a heatmap for the energy balances of all Austrian municipalities. The diagrams are interactively generated, and this interaction allow users to easily visualize and compare the results.
3.4.1 Map of energy supply expansion and demand reduction targets
The following Figure 3 visually depicts the expansion targets for renewable energies across municipalities left in GWh per annum and right in MWh per capita per annum. Intensity of color indicates the magnitude of required expansion for each municipality. Darker shades indicate a higher obligation for the municipality to augment their renewable energy capacity, suggesting the presence of greater potential. This is aimed to discern the distribution of expansion goals, guiding municipalities toward targeted efforts in harnessing their specific renewable energy potential and fostering sustainable energy development. It can be seen that installation targets of wind power is higher toward the eastern and central parts of the country, whereas the mountainous west generally has lower potential and subsequent targets, with notable exceptions. There is no notable change in distribution between absolute and relative targets per capita. The distribution of expansion targets across municipalities shows that about 11% of the expansion target is distributed among 1,260 municipalities, each having a target of <10 GWh, or roughly two modern wind turbines. But 30% of the expansion target is achieved by only sixty municipalities, which hold goals exceeding 100 GWh based on their high wind potential. The hydropower expansion targets mainly highlight the remaining potentials of the western region. The illustration of the distribution of hydropower expansion targets among municipalities shows that 11% of municipalities lack significant hydropower potential, and another 37% of municipalities only account for 6% of the national target. In contrast, 30% of the expansion target is achieved by only sixty-six municipalities with goals exceeding 100 GWh/a each. The Photovoltaic and Solar Thermal heatmaps highlight the need for action in larger cities and urban areas.
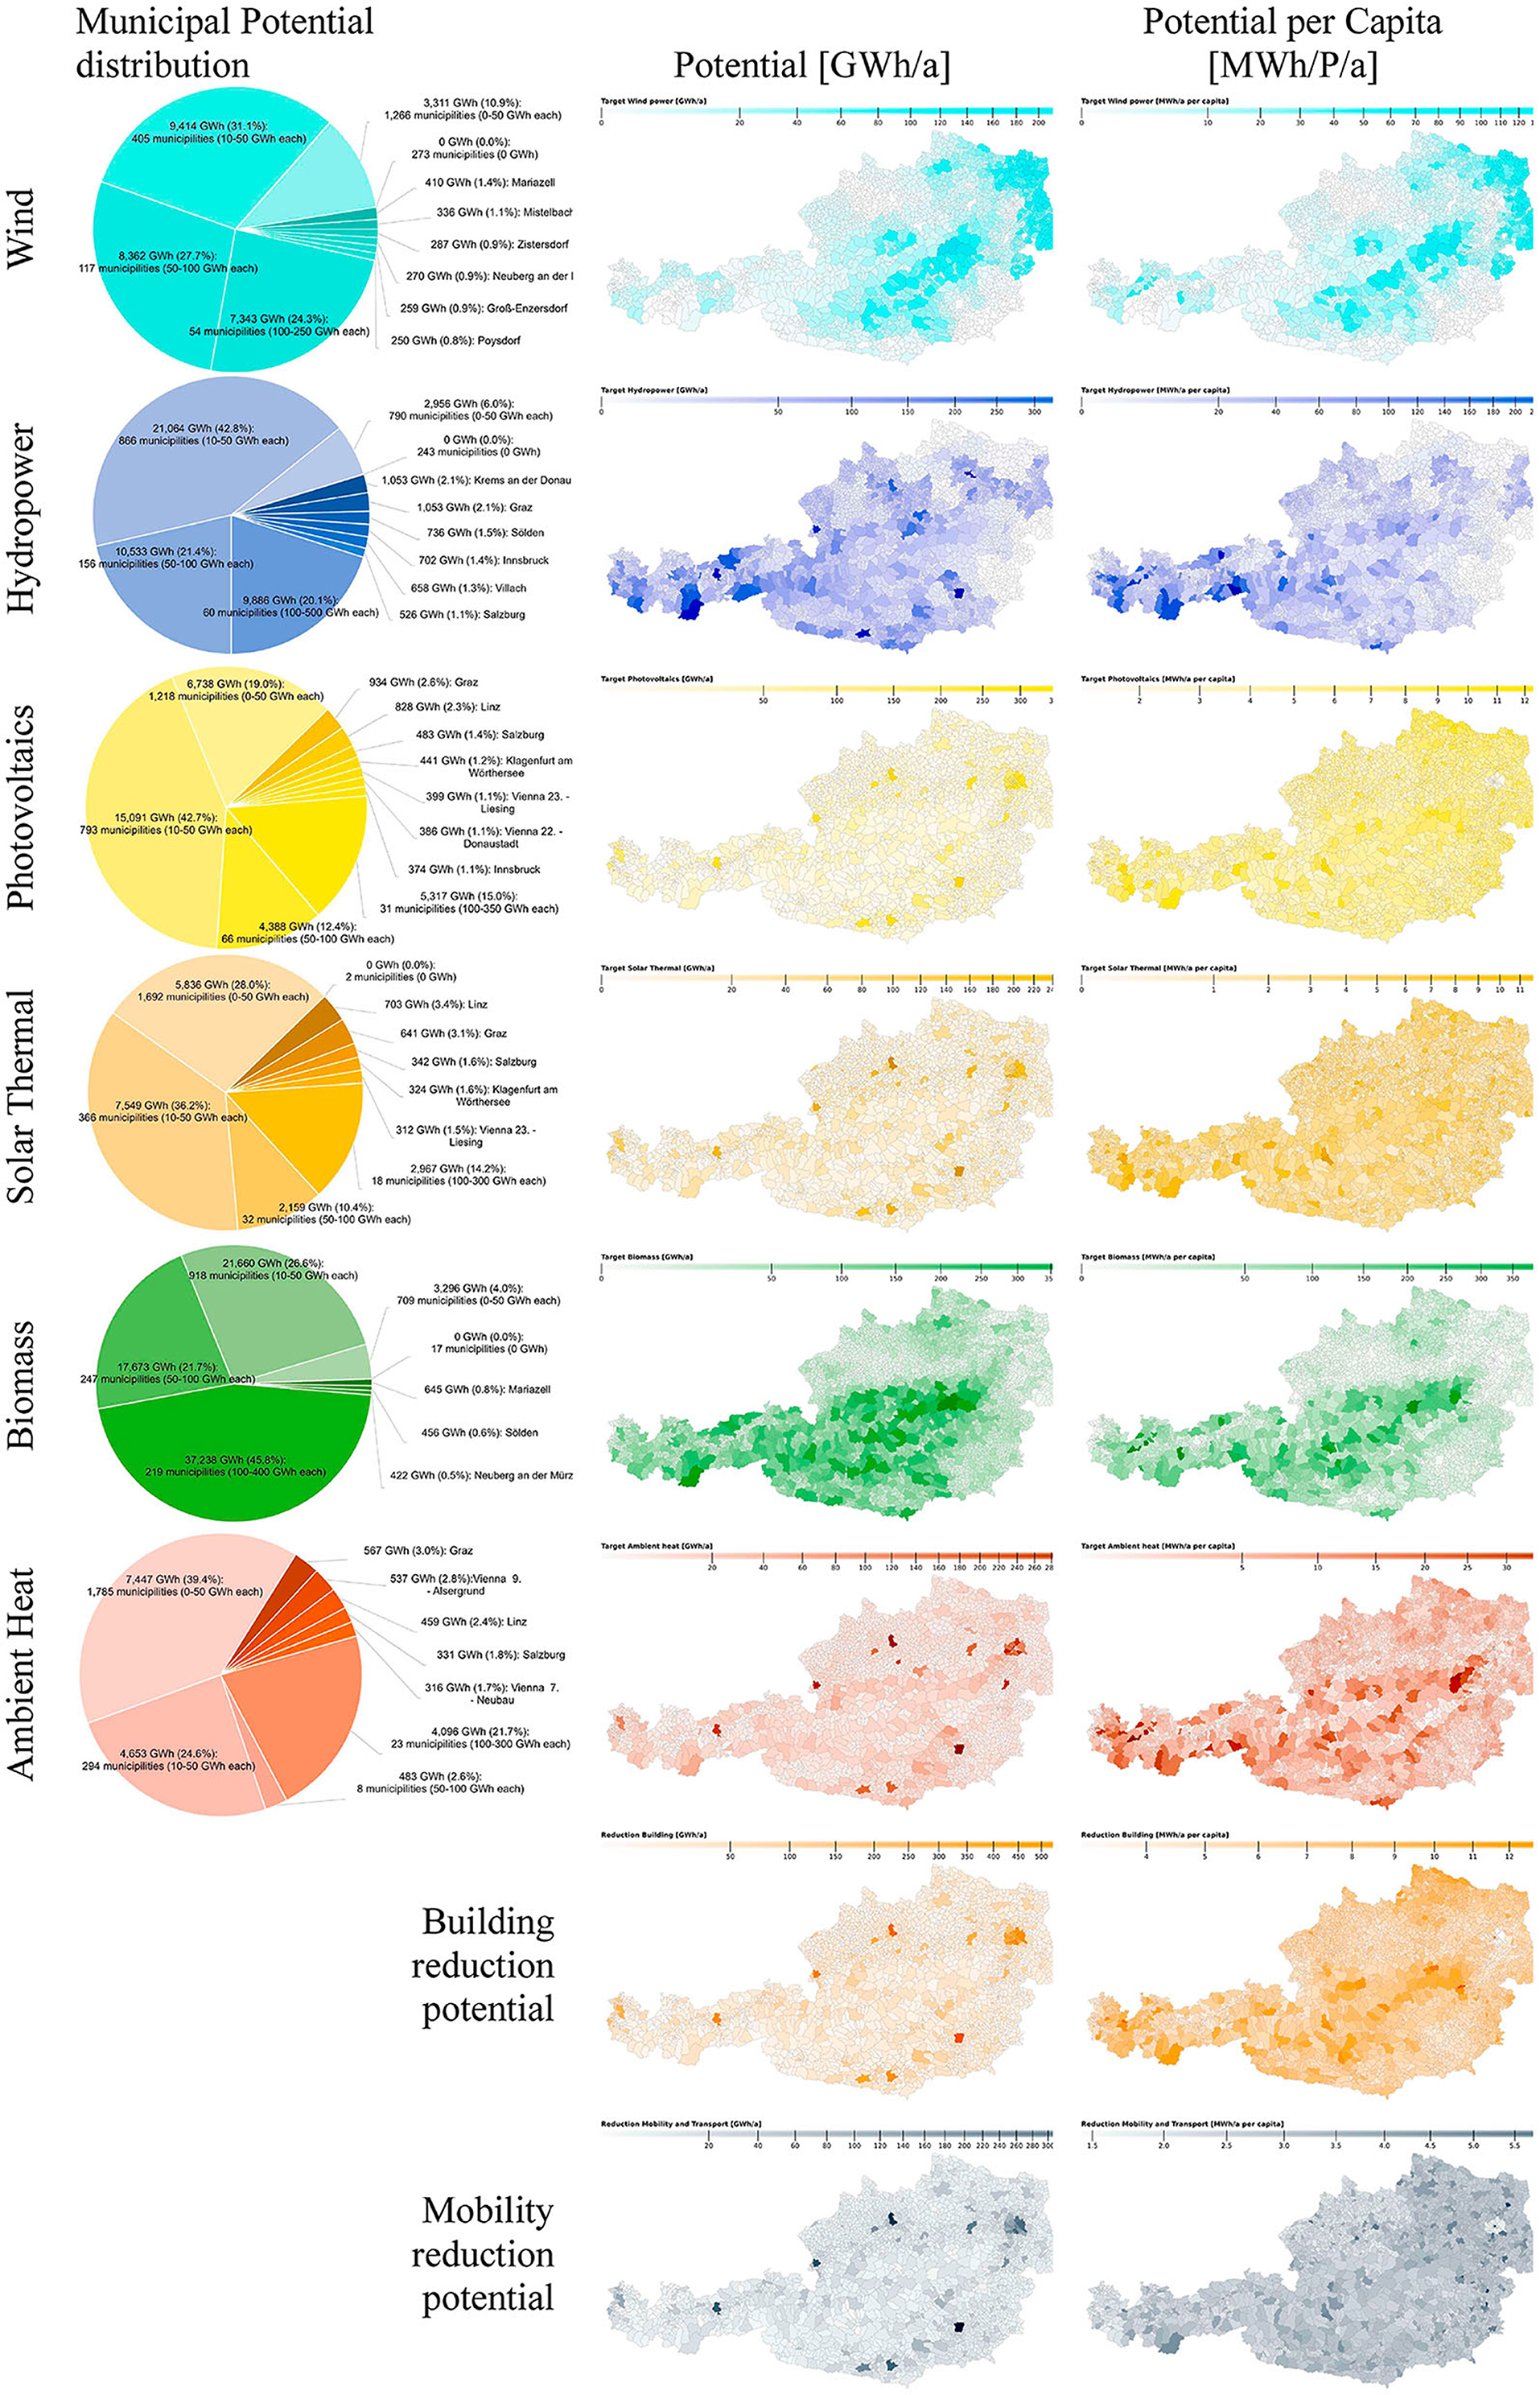
Figure 3. Renewable Expansion target distribution (left), RES expansion and reduction targets per energy carrier and sector in GWh/a (center) and in MWh/a per capita (right).
Note that in this context, the PV and Solar thermal potential is not solely dependent on solar radiation; rather, it relies on available roof areas for photovoltaic installations and industrial rooftops for solar thermal installations. Evidently, the municipalities with the greatest potentials are primarily urban centers such as Linz, Salzburg, and districts within Vienna, which is consistent with their larger built environments and roof areas. A comparison with the heatmap per capita shows a different perspective, where the obligations of urban areas is in fact much smaller when looking at the per capita targets than for rural settlements. The expansion target for biomass can be located in the forested middle of the country and extends to the southern and western regions. The distribution per capita shows a slight deviation, due to the varying population density of these rural and mountainous regions. Note that the potential refers to biomass use of wood only, which means that the potential depends on the size of the municipality's forest area. As such, seventeen municipalities have no biomass potential, and another 711 municipalities have such a low potential that their cumulative contribution would be only 4% of the target. However, due to the mostly large forest areas in middle, south, and west of Austria, about half of the expansion target could be reached by 222 municipalities. In the case of ambient heat, the larger cities are again highlighted due to the assumption of predominant use for space heating and cooling. The specific per capita breakdown on the right again contrasts the high absolute targets with low relatives.
Finally, the reduction targets for energy consumption for buildings and mobility sectors are shown with color intensity corresponding to the magnitude of required energy savings for each municipality. In both building and mobility sectors, larger municipalities can be seen to have a greater potential for energy savings due to higher building and traffic density. The reduction potentials per capita unsurprisingly show the opposite trend.
The aggregate of the different renewable expansion targets and sectoral reduction targets are presented as an integrated energy balance target for all Austrian municipalities in Figure 4 in GWh per annum and in MWh per Capita per annum. The colors represent the following: Municipalities marked in red have negative energy balance targets, indicating either a limited potential for renewable energy sources, high energy consumption with minimal saving potential or a combination of both. Naturally, their contribution to the national target will be lower. On the other hand, green-shaded municipalities have positive energy balance targets, indicating higher potential and subsequent targets for renewable energy expansion than their achievable energy demand requiring significant expansion to help offset the deficits of the red-marked regions. Yellow-colored municipalities fall somewhere in between, indicating a more balanced position with regards to their renewable energy potential and consumption levels. This visually informative representation assists in identifying and addressing disparities, promoting a more equitable distribution of efforts to achieve sustainable energy objectives across all municipalities.
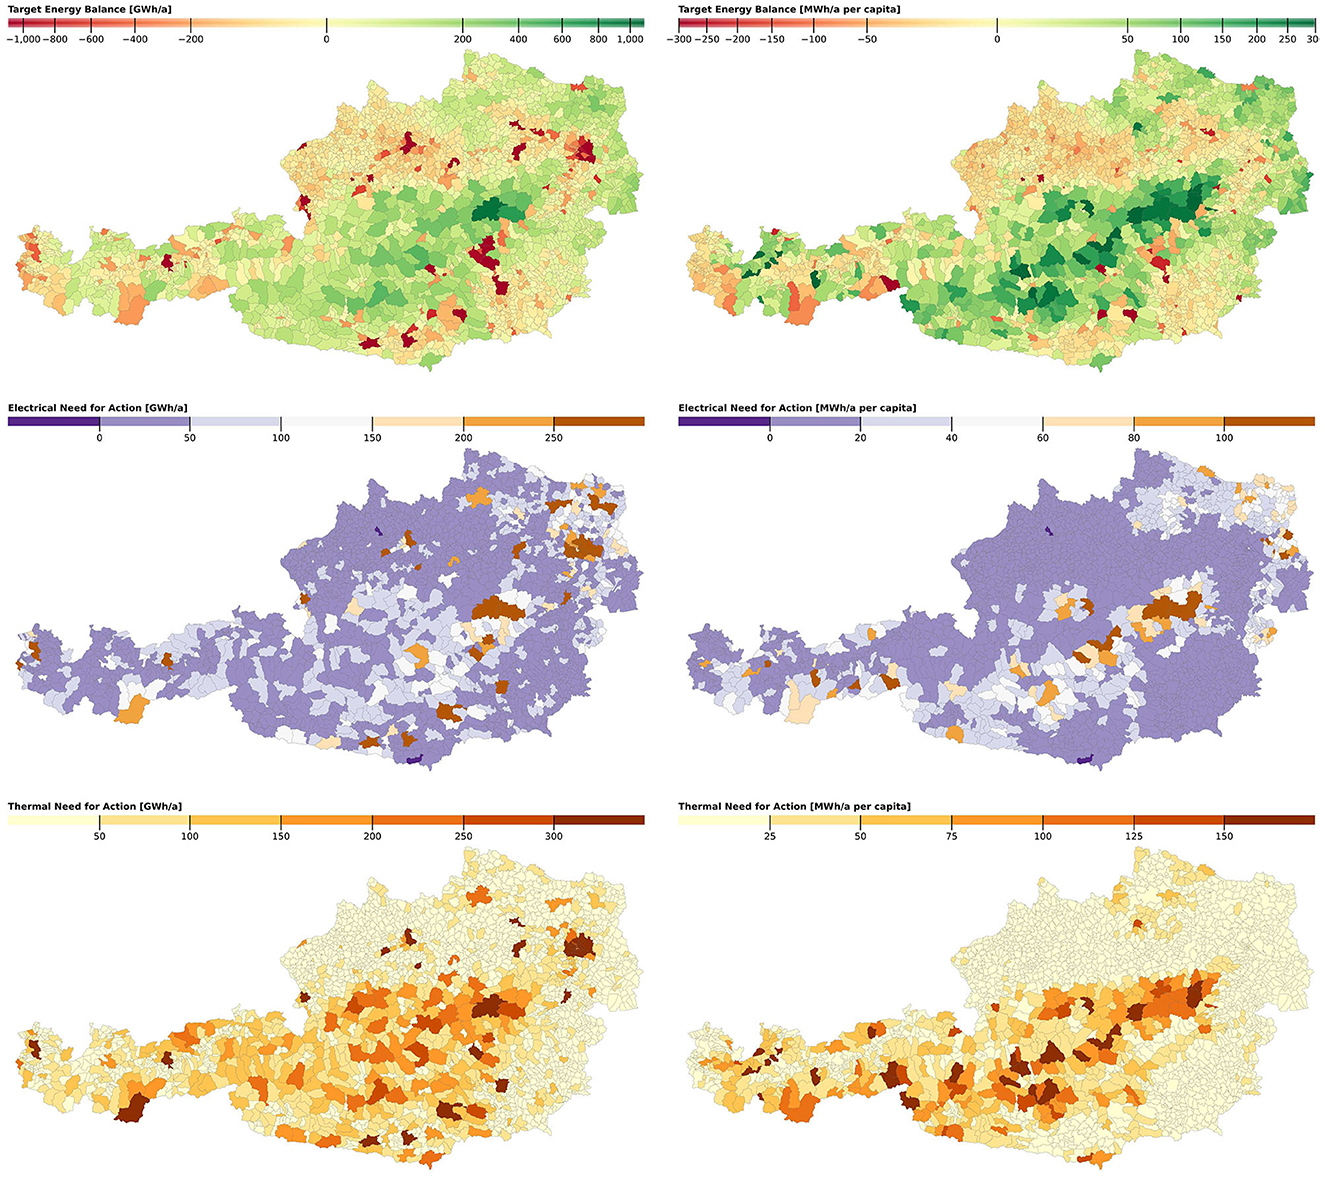
Figure 4. Municipal energy balance target (top), electrical (center), and thermal need for action (bottom) in GWh/a (left) and MWh/a per capita (right).
Next, Figure 4 show the distribution of municipalities based on the size of their absolute target balance. They illustrate that many municipalities in fact have a target balance in the range between −200 and 200 GWh/a, as well as the quantified difference between negatively balanced urban areas and positively balanced hinterland. The balance target provides an important quantitative threshold—how to reach it is a different story, which should take into consideration local contexts and political decisions. Therefore, apart from the detailed targets presented before, it is also useful to group the results into concrete needs for action: Figure 4 also depict these needs as electrical and thermal actions, respectively, represented on the left in GWh per annum and on the right in MWh per capita per annum. Values below zero indicate that the municipality has already sufficiently exploited its potential for renewable energies and/or exhibits low energy consumption. Conversely, higher positive values indicate the additional energy capacity required for the municipality to meet its targets. Crucially, this can be used to quantify other forms of renewable expansion or savings than what the initial allocation yielded. For example, a municipality could opt to realize their electrical need for action resulting from a high wind potential with increased PV installation and additional demand reductions beyond the initially targeted thresholds instead.
3.4.2 Energy balances and needs for action on county level (NUTS-3)
The results can also be aggregated on an intermediary level of geographic granularity. This section presents the resulting renewable exploitation and sectoral saving targets aggregated by federal states. Figure 5 shows the resulting energy balances on the level of Austrian federal states (NUTS-3) from left to right: Demand Status-Quo (2019), Demand Targets, RES Expansion targets and Status-Quo (2019). The excess RES potential not required for expansion is depicted in green, the “reduction gap” between current energy demand and target levels in red on top of the demand target column, and the “expansion gap” between current RES and target levels in gray in top of the RES Status Quo column. According to the allocation approach, a federal state is expected to contribute more to the overall target if it has a greater potential from a particular renewable energy source. For instance, the third state from the left—“Burgenland”, a western state with high wind potential—is projected to generate significantly more energy from wind power, the alpine eastern Tyrol more energy from hydropower, and the forested state of Styria in the south more energy from biomass. This allocation strategy aims to capitalize on the specific strengths and resources of each region, optimizing the use of renewable energy sources according to their availability.
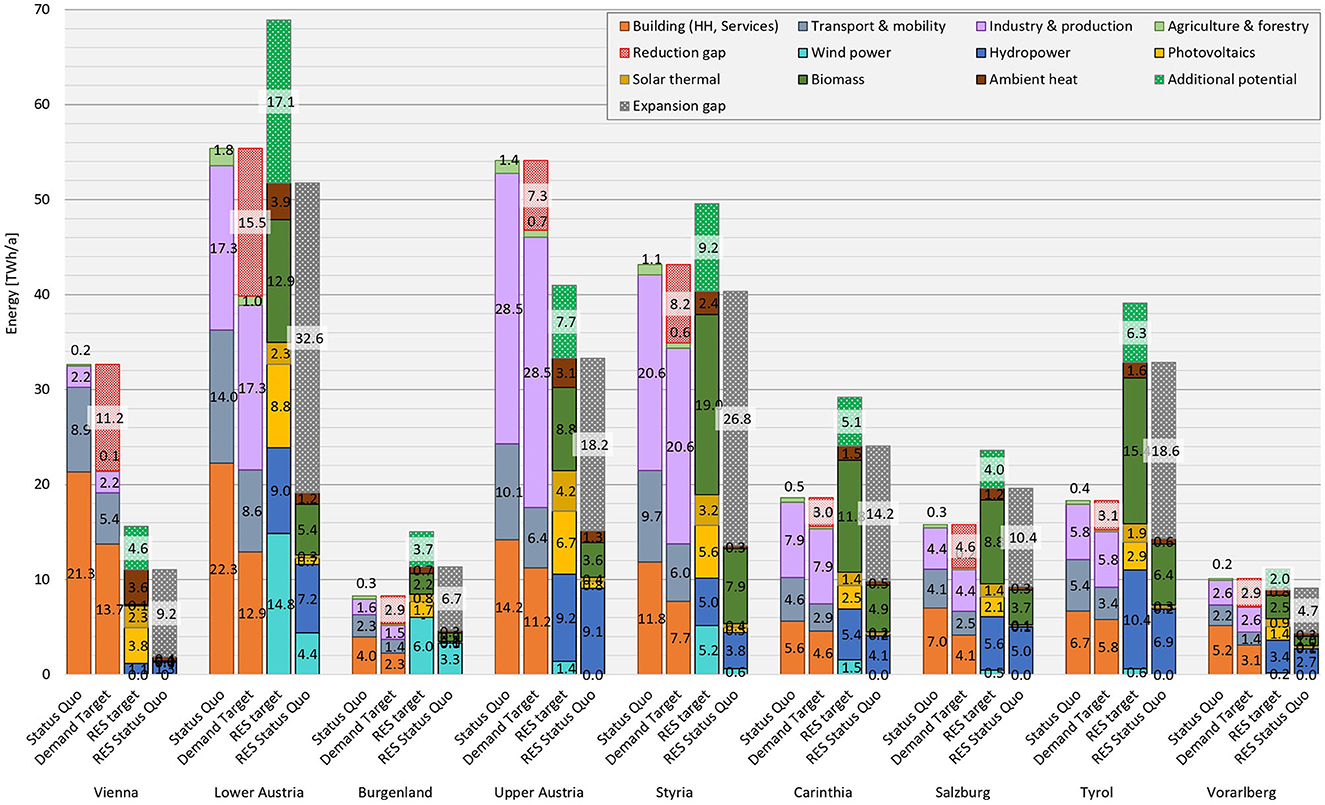
Figure 5. Resulting energy balances on the level of Austrian federal states (NUTS-3) from left to right: Demand Status-Quo (2019), Demand Targets, RES Expansion targets, and Status-Quo (2019).
The figure illustrates current energy consumption and corresponding energy demand targets for individual federal states. The approach is characterized by a clear allocation strategy. It considers the particularities of each federal state, such as varying proportions of buildings in need of renovation, and higher energy consumption in the transport and mobility sector. Consequently, the targets are adjusted to address these specific circumstances. This customized allocation method recognizes the heterogeneity of energy consumption patterns and building stocks across different regions of Austria. By setting tailored targets for each federal state based on their unique characteristics, the energy efficiency measures can be more precisely targeted to address the specific requirements and challenges of each area. The allocation of targets in this manner ensures an equitable and balanced contribution from all parts of the country toward achieving the overarching national objectives in energy efficiency and sustainability.
The figure also presents a comparison between the target final energy demand and the expansion target for renewable energies across different federal states. The graph highlights the varying degrees of individual agency or discretion that each federal state possesses. Notably, states like Lower Austria and Styria exhibit significant untapped potential for renewable energy expansion. Conversely, federal states such as Vienna or Upper Austria, which possess renewable energy expansion potentials lower than their current end energy consumption, should complement expansion efforts with energy efficiency measures, including building renovations and energy-saving initiatives.
3.4.3 Municipal energy balances and needs for action
The following presents the resulting energy balance component targets for three example municipalities of decreasing size: Steyr (38 thousand inhabitants, motor industry), Hollabrunn (twelve thousand inhabitants), and Gols (four thousand inhabitants, high wind power installation). The left side of the balance figure show energy demand and consumption, the right-side renewable energy sources.
• The first bar on the left represents achievable energy demand through energy-saving measures, while the right side shows the technically possible total potential of renewable energies.
• The second bar illustrates the current state, indicating the end energy consumption from 2019 and the already developed potential of renewable energies (up to 2020).
• The third bar outlines future targets as derived from the allocation mechanism.
• The “to target” section represents the differences between the current state and the targets. Here, both consumption and expansion aspects are separately shown.
• The “need for action” section further breaks down these differences, separating them into electrical and thermal energy needs.
• The last bar illustrates the total need for action, adding thermal and electric energy.
Figure 6 illustrates the results in a comparison. The first and largest municipality of Steyr exemplifies a pronounced industrial sector, which in this allocation scenario has no saving targets (16.9 kWh/Person/a). The focus of the need for action is split into one third energy savings (−8.3 kWh/Pers/a) and two thirds on renewable expansion of 16.2 kWh/Pers/a. The diagram shows that PV, ST, and ambient heat are the largest untapped potentials.
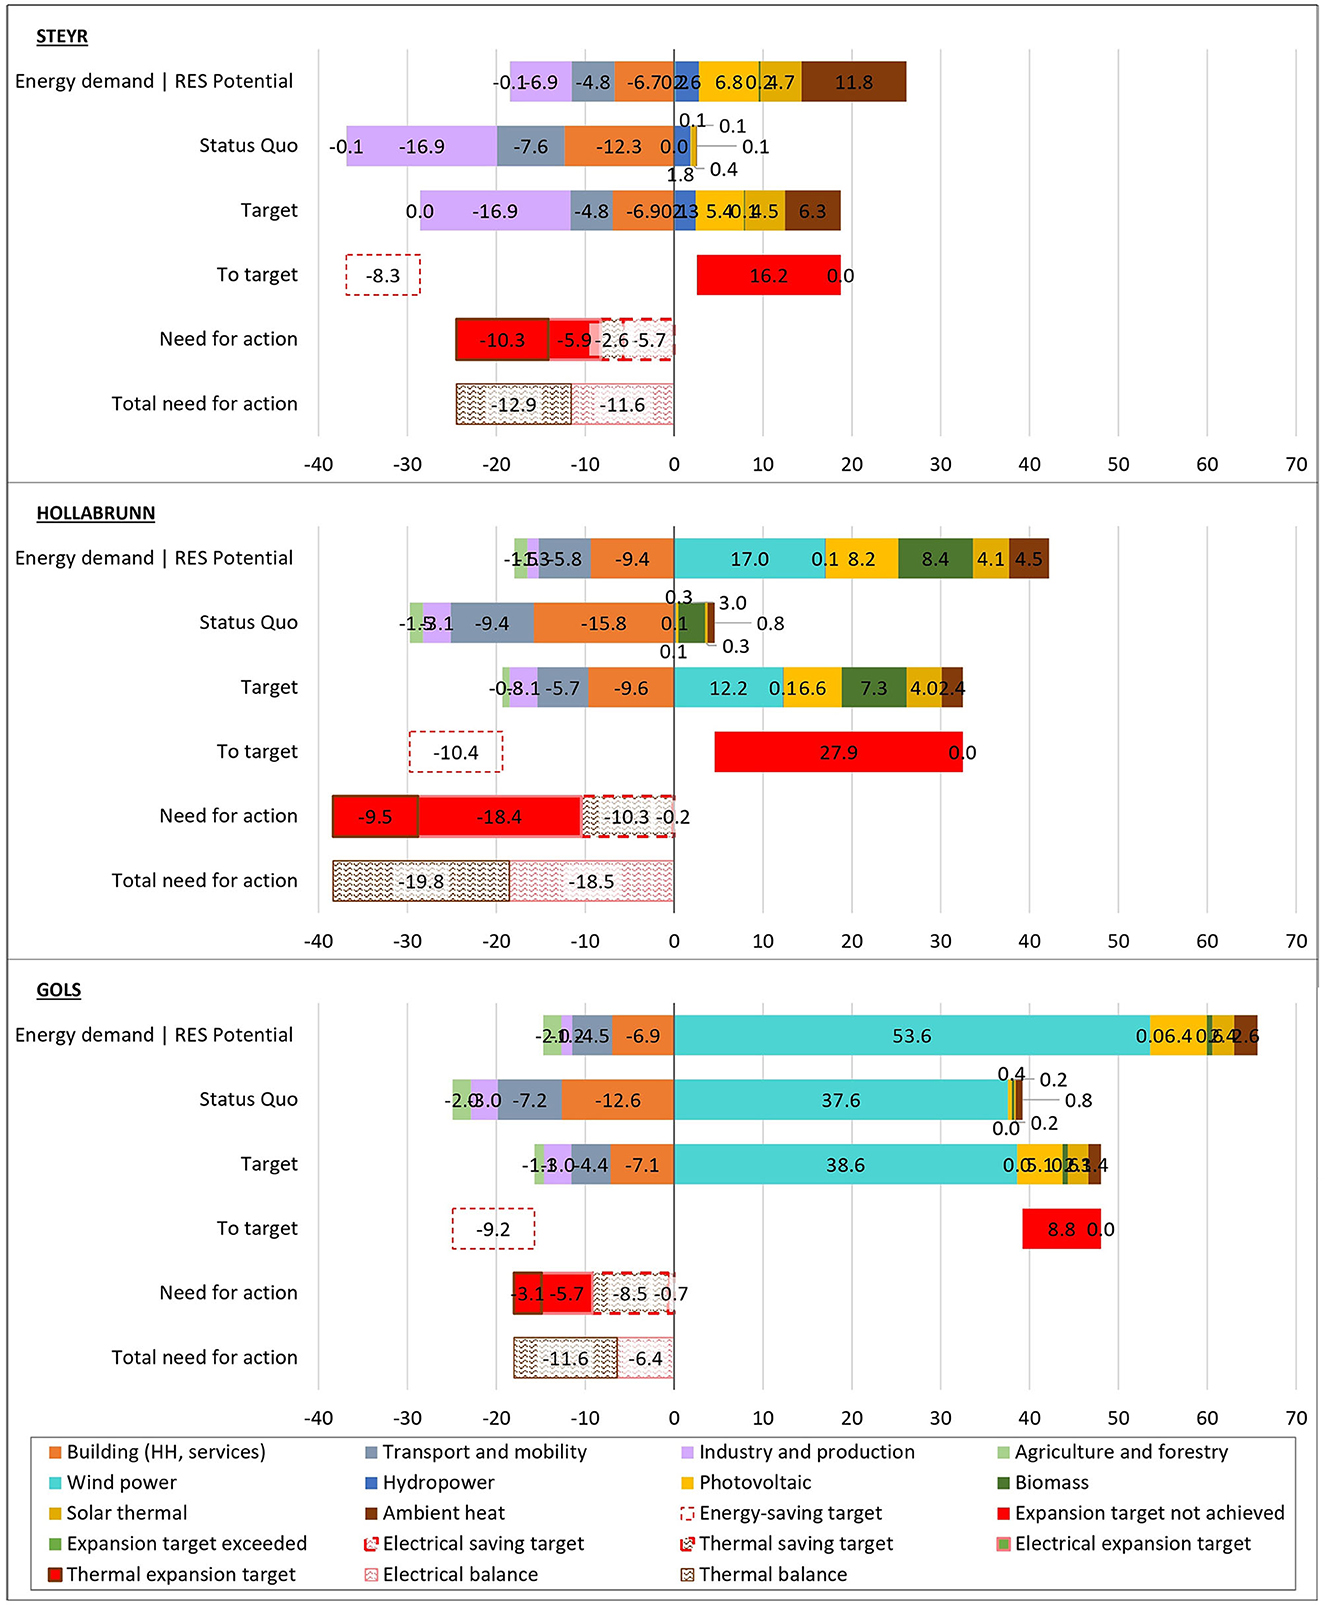
Figure 6. Municipal results comparison of three municipalities: Steyr, Hollabrunn, and Gols. Left: energy consumption, right: local renewable energy generation in kWh/Pers/a.
In contrast, the central bar chart shows the smaller municipality of Hollabrunn. Here, the industrial sector is insignificant, and the need for action is instead constituted predominantly by the need for expansion of renewables. The bottom bars show the nominal energy balance of the smallest municipality, which is already significantly positive due to the extensive development of wind power by 2019, as depicted in the first two bars of the Status Quo. Nevertheless, the potential-dependent allocation process still indicates a further need for action in Gols, both in terms of renewable expansion and energy savings of −9.2 and 8.8 kWh/Pers/a respectively.
4 Discussion
4.1 Regional imbalances in renewable energy supply potential
The results show local and regional imbalances in the potential for renewable energy supply. Unsurprisingly, urban areas act as “energy sponges”: Despite ambitious efficiency measures and the use of limited roof space for PV, they will not have sufficient onsite renewables to supply their future energy demand. Rural areas, especially those with high wind potential and low industrial demand, will easily be able to cover their local energy demand, often exceeding it by far, becoming potential regional suppliers of renewable energy. This highlights the importance of coordinating the effort sharing between regional energy systems in becoming renewably powered. Analyzing local energy systems in terms of their renewable self-sufficiency is an important step but it is potentially setting the wrong incentives to municipalities and ending an important conversation prematurely: How is the effort-sharing of the energy transition allocated between regions and municipalities? One solution would be to determination of legally binding energy targets to federally developed energy spatial plans, that are negotiated between municipal and regional authorities. A roadmap of milestones in achieving these renewable energy targets on municipal level could then be incorporated in the negotiation of the so-called “Finanzausgleich” (german: “financial equalization”), the Austrian financial instrument determining tax allocation and transfer payments between federal, state, and municipal authorities.
4.2 Different data sources
It is possible to include other sources to model different baselines, scenarios, and target allocations. The biggest challenge still lies in the required homogenization and structuring of the data. Often, when data structures do not entirely match, additional assumptions have to be introduced to bridge this gap. For example, in the building sector future demand calculation, projections were available for four types of buildings, but consumption data only for two distinct types, which necessitated merging two of the former four types together to match the latter two by using an area-weighted average.
The less data sources are directly connectable via structure, the more additional supplementary data is generally required to glue the datasets together, generally resulting in some data and details being lost or rendered unassignable. Future research would greatly profit from deciding and adhering to uniform data structures when reporting similar findings such as scenarios and renewable and savings potentials.
4.3 Other ways of achieving 100% renewable energy supply
The differentiation of energy targets into detailed potentials and targets for each renewable energy carrier and demand sector facilitates important discussions. Which results should be realized to which degree? By aggregating the targets into a supply target, a reduction target, an electrical and thermal target as well as an overall balance target, municipalities can take an informed decision, which potentials they want to commit to politically. If e.g., the realization of wind is politically infeasible, the framework shows how much energy would need to be saved or renewably produced by other means. This should further the typical discussions arising in municipalities around NIMBY (not in my backyard), by quantifying the alternatives, which might be costlier.
4.4 Different scenarios
The presented work was only operationalized for a specific scenario and the results reflect that. Different scenarios can be used as baseline for national targets, which can simply be accomplished by changing the data in Figure 2. Apart from that, it is also possible to construct different allocation scenarios, meaning different ways of allocating the national targets (and potentials) to higher geographic resolution. This can be done by either introducing different referencing area base datasets or using a different allocation formula, or any combination of both. The main limiting factor to the complexity of the allocation mechanism apart is the availability of data with appropriate format and structure.
4.5 Accuracy and uncertainty of the model
Given the many assumptions in connecting the different datasets, the resulting uncertainty of the municipal potentials and targets is naturally high. The key to increasing result reliability lies in the compatibility of the required datasets for renewable and saving potentials and their reference to geographic attributes and allocation parameters.
Another uncertainty lies in the use of building footprints to estimate energy demands for buildings in general, which does not take into consideration, which buildings are actually in use, and with which frequency and intensity. Also, the used typology is rather generic and does not account for the diversity and extremes of the building sector at large.
4.6 Result usability
Working with three municipalities for testing showed the results to be generally well received. One caveat is that the resulting municipal energy balance visualizations were difficult to comprehend, even for some experts on the field. Especially the inclusion of aggregate “Municipal action required” for all renewable potential targets, saving targets and for thermal and electric balance targets in addition to all three main results, i.e., Current Status-Quo (S), Renewable and Savings Potentials (P), the resulting Targets for each (T) was overwhelming. It might be sensible to further reduce the main results and drop the aggregates, as they always required additional briefing.
The nationwide availability of these data offers a holistic view of energy efficiency and the potential of renewable energies in Austria. This is crucial for developing and implementing well-informed energy policy measures at both national and local levels. The heatmaps thus serve as valuable tools for analyzing the status and development opportunities in the energy sector in Austria and for driving a sustainable energy transition forward. The data obtained can also be visualized in several different ways: Using reference areas to specify the quantities can be interesting.
5 Conclusion
Consistently localizing energy and emission targets from national to municipal level is an important challenge in tackling the accountability problem of climate neutrality ambitions. In addition to individual bottom-up target formulation and disconnected climate accounting, models and visualizations for effort sharing of the required renewable expansion and energy savings are required. The key model property is consistency of the individual municipal with national goals and targets.
The approach presented here is simple yet comprehensive. It can deliver municipal targets for energy demand reduction and renewable expansion based on national decarbonization strategies and local potential estimators. It uses an allocation of local and regional potential estimates for demand reduction and the expansion of renewables and scales these KPIs according to specified reference areas to the desired national targets.
Crucially, both the national target scenarios and the allocation strategies using reference areas can be specified freely. Thus, the model offers versatility to take different modeling and scenario assumptions into account. The results are spatially differentiated on municipal level and functionally divided into typical energy demand sectors and renewable energy carriers. They can provide a detailed look into possible municipal effects of national climate targets: 100% Renewable supply is not necessarily required for municipalities with large industry sectors or little renewable potential. Municipalities with high renewable potentials on the other hand might need to overachieve a renewable energy balance by up to a hundred percent, meaning they must provide twice as much renewable energy than they demand themselves. The results can be used to analyse and discuss different municipal potentials and needs of action both in terms of general balance targets and in detailed sub-targets of sectoral expansion and saving.
The resulting target maps and energy balances are also visualized and interactively explorable online (https://observablehq.com/@editp/allocation-of-national-decarbonization-targets-to-municipal-level-in-austria). This facilitates dissemination, discussion and analysis on effort sharing and potential realization in the decarbonization of society: With the proposed framework, different national scenarios, and their implications for municipal needs for action can be compared and their implications made explicit. The resulting targets provide quantifiable and meaningful municipal decarbonization goals. Nevertheless, it must be stated that the presented approach is hampered by insufficient and patchy data availability, both for potential estimates and for suitable scaling options in terms of reference areas. The latter can only provide a coarse estimate of applicability and can only give a first indication of more detailed local methods.
Data availability statement
The datasets presented in this study can be found in online repositories. The names of the repository/repositories and accession number(s) can be found below: https://observablehq.com/@editp/allocation-of-national-decarbonization-targets-to-municipal-level-in-austria.
Author contributions
SS: Conceptualization, Methodology, Writing – original draft, Writing – review & editing. EP: Writing – original draft. DS: Writing – review & editing. JB: Supervision, Writing – review & editing. PO: Writing – review & editing.
Funding
The author(s) declare financial support was received for the research, authorship, and/or publication of this article. The presented research was partly funded by the Austrian Research Promotion Agency (FFG) research project LOW TECH inno-lab with the funding #889480 (online https://nachhaltigwirtschaften.at/de/sdz/projekte/low-tech-innovation-lab.php).
Conflict of interest
The authors declare that the research was conducted in the absence of any commercial or financial relationships that could be construed as a potential conflict of interest.
Publisher's note
All claims expressed in this article are solely those of the authors and do not necessarily represent those of their affiliated organizations, or those of the publisher, the editors and the reviewers. Any product that may be evaluated in this article, or claim that may be made by its manufacturer, is not guaranteed or endorsed by the publisher.
Supplementary material
The Supplementary Material for this article can be found online at: https://www.frontiersin.org/articles/10.3389/frsc.2023.1294361/full#supplementary-material
References
Abart-Heriszt, L., Erker, S., Reichel, S., Schöndorfer, H., Weinke, E., and Lang, S. (2020). Austria-Wide Modeling and Web-Based Visualization of Energy Consumption and CO2 Emissions at the Municipal Level. Vienna: Salzburg. Available online at: https://nachhaltigwirtschaften.at/resources/sdz_pdf/berichte/schriftenreihe-2020-43-energiemosaik-austria.pdf (accessed April 23, 2022).
Baumann, M., Dolna-Gruber, C., Goritschnig, W., and Pauritsch, G. (2021). Klima- und Energiestrategien der Länder Energie, Treibhausgasemissionen und die Kongruenz von Länder- und Bundeszielen. Vienna: Austrian Energy Agency, 156.
Bertoldi, P., Kona, A., Rivas, S., and Dallemand, J. (2018). Towards a global comprehensive and transparent framework for cities and local governments enabling an effective contribution to the Paris climate agreement. Curr. Opin. Environ. Sustain. 30, 67–74. doi: 10.1016/j.cosust.2018.03.009
Brown, T., Schlachtberger, D., Kies, A., Schramm, S., and Greiner, M. (2018). Synergies of sector coupling and transmission reinforcement in a cost-optimised, highly renewable European energy system. Energy 160, 720–739. doi: 10.1016/j.energy.2018.06.222
Dehli, M. (2020). Energy Efficiency in Industry, Services and Commerce: Energy Optimization Concepts for Companies. Wiesbaden: Springer Fachmedien Wiesbaden.
Farghali, M., Osman, A. I., Mohamed, I. M. A., Chen, Z., Chen, L., Ihara, I., et al. (2020). Smart energy cities in a 100% renewable energy context. Renew. Sustain. Energy Rev. 129, 109922. doi: 10.1016/j.rser.2020.109922
Fechner, H. (2020). Determination of the Area Potential for Photovoltaic Expansion in Austria: Which Area Categories are of Particular Importance for Expansion in Order to be Able to Realize the Green Electricity Target. Vienna. Available online at: https://oesterreichsenergie.at/fileadmin/user_upload/Oesterreichs_Energie/Publikationsdatenbank/Studien/2020/PV-Studie_2020.pdf (accessed March 29 2022).
Federal Ministry of Agriculture Forestry, Regions and Water Management. (2019). Austrian National Forest Inventory. Vienna. Available online at: https://www.klimaaktiv.at/dam/jcr:bd47bbf5-a5dd-467d-8720-fea3b39424da/Waldinventur_September_final.pdf (accessed December 21 2022).
Fuchs, M. (2018). Hydropower Potential Study Austria Update 2018. Vienna. Available online at: https://oesterreichsenergie.at/fileadmin/user_upload/Oesterreichs_Energie/Publikationsdatenbank/Studien/2018/WasserkraftpotenzialOesterreich2018.pdf (accessed December 21, 2022).
Huovila, A., Silikavirta, H., Rozado, C. A., Rokman, J., Tuominen, P., Paiho, S., et al. (2022). Carbon-neutral cities: critical review of theory and practice. J. Clean. Prod. 341, 130912. doi: 10.1016/j.jclepro.2022.130912
Institute for Housing and Environment (2017). TABULA - Typology Approach for Building Stock Energy Assessment, TABULA WebTool. Available online at: https://webtool.building-typology.eu/#bm (accessed May 8, 2022).
Krog, L. (2019). How municipalities act under the new paradigm for energy planning. Sustain. Cities Soc. 47, 101511. doi: 10.1016/j.scs.2019.101511
Krutzler, T., Wiesenberger, H., Heller, C., Gössl, M., Stranner, G., Storch, A., et al. (2017). Energy and Greenhouse Gas Scenarios in the Perspective of 2030 and 2050. Vienna: Umweltbundesamt GmbH. Available online at: https://www.umweltbundesamt.at/fileadmin/site/publikationen/rep0628.pdf (accessed March 20, 2022).
Leal, V. M. S., and Azevedo, I. (2016). Setting targets for local energy planning: critical assessment and a new approach. Sustain. Cities Soc. 26, 421–428. doi: 10.1016/j.scs.2016.04.010
Mair am Tinkhof, O. (2020). MobilitätsTool'. klimaaktiv. Available online at: https://www.klimaaktiv.at/dam/jcr:175f8331-3df5-436c-b212-dd7b05b95ec2/Mobilit%C3%A4tstool_03-2020.xlsx (accessed February 19, 2023).
Muñoz, I., Hernandez, P., Perez-Iribarren, E., Garcia-Gusano, S., and Arrizabalaga, E. (2023). How can cities effectively contribute towards decarbonisation targets? A downscaling method to assess the alignment of local energy plans with national strategies. Energy Strat. Rev. 49, 101137. doi: 10.1016/j.esr.2023.101137
Nationalrat (2022). Erneuerbaren-Ausbau-Gesetz - Bundesrecht konsolidiert. Available online at: https://www.ris.bka.gv.at/GeltendeFassung.wxe?Abfrage=BundesnormenandGesetzesnummer=20011619 (accessed January 16, 2023).
OHoE. (2021). Energy Efficiency in Industry. Available online at: https://www.ohoe.eu/wissenswertes/energieeffizienz-industrie (accessed June 5, 2022).
Pasimeni, M. R., Petrosillo, I., Aretano, R., Semeraro, T., De Macro, A., Zaccarelli, N., et al. (2014). Scales, strategies and actions for effective energy planning: a review. Energy Policy 65, 165–174. doi: 10.1016/j.enpol.2013.10.027
Reckien, D., Salvia, M., Heidrich, O., Church, J. M., Pietrapertosa, F., Gregorio-Hurtado, S., et al. (2018). How are cities planning to respond to climate change? Assessment of local climate plans from 885 cities in the EU-28. J. Clean. Prod. 191, 207–219. doi: 10.1016/j.jclepro.2018.03.220
Salvia, M., Reckien, D., Pietrapertosa, F., Eckersley, P., Spyridaki, N.-A., Krook-Riekkola, A., et al. (2021). Will climate mitigation ambitions lead to carbon neutrality? An analysis of the local-level plans of 327 cities in the EU. Renew. Sustain. Energy Rev. 135, 110253. doi: 10.1016/j.rser.2020.110253
Schneider, S., Zelger, T., and Klauda, L. (2020). Reflections on the Question of What Share of Renewable Energy Must be Provided Locally in Austria in 2050. Available online at: https://simonschaluppe.org/publication/schneider-uberlegungen-2020/schneider-uberlegungen-2020.pdf (accessed August 20, 2023).
Stanzer, G., Novak, S., Dumke, H., Plha, S., Schaffer, H., Breinesberger, J., et al. (2010). Regional Scenarios of Renewable Energy Potentials in 2012/2020. Vienna. Available online at: https://www.enfos.at/download/rest/lit-23-regio-energy-endbericht-ohne-karten.pdf (accessed December 22, 2022).
Statistics Austria (2022). STATcube - Statistical Database. Available online at: https://www.statistik.at/web_de/services/statcube/index.html (accessed May 7, 2022).
Streicher, W., Schnitzer, H., Tatzber, F., Heimrath, R., Wetz, I., Titz, M., et al. (2010). Energy self-sufficiency for Austria 2050. Vienna. Available online at: https://www.klimafonds.gv.at/wp-content/uploads/sites/16/Energieautarkie205012pt20110308Final.pdf (accessed April 4, 2023).
van den Berg, N. J., van Soest, H. L., Hof, A. F., den Elzen, M. G. J., van Vuuren, D. P., Chen, W., et al. (2020). Implications of various effort-sharing approaches for national carbon budgets and emission pathways. Clim. Change 162, 1805–1822. doi: 10.1007/s10584-019-02368-y
Vatalis, K. I., Avlogiaris, G., and Tsalis, T.?. (2022). Just transition pathways of energy decarbonization under the global environmental changes. J. Environ. Manage. 309, 114713. doi: 10.1016/j.jenvman.2022.114713
Veigl, A. (2017). Energy and Climate Future Austria - Scenario for 2030 and 2050. Vienna: WWF Österreich. Available online at: https://www.wwf.at/wp-content/uploads/2021/05/WWF-Bericht_Energie-und-Klimazukunft_Oesterreich-Szenario-fuer-2030-und-2050.pdf (accessed May 10, 2021).
Wien Energie GmbH. (2021). Installed PV Capacity in Austria. Positionen Wien Energie. Available online at: https://positionen.wienenergie.at/wissenshub/energie-dashboard/installierte-pv-leistung-in-oesterreich/ (accessed June 6, 2022).
Winkelmeier, H., Krenn, A., and Moidl, S. (2019). The Realizable Wind Potential in Austria Until 2030. Wien: Energiewerkstatt Verein. Available online at: https://www.ak-energie.at/pdf/ET2019/ET2019_007_Session2_Krenn_Energiewerkstatt.pdf (accessed December 21, 2022).
Keywords: decision support system, energy transition, renewable expansion allocation, allocation models, energy transition visualization
Citation: Schneider S, Paráda E, Sengl D, Baptista J and Oliveira PM (2024) Allocation of national renewable expansion and sectoral demand reduction targets to municipal level. Front. Sustain. Cities 5:1294361. doi: 10.3389/frsc.2023.1294361
Received: 14 September 2023; Accepted: 11 December 2023;
Published: 05 January 2024.
Edited by:
Matthias Haase, Zurich University of Applied Sciences, SwitzerlandReviewed by:
Ursula Eicker, Concordia University, CanadaMaria Magdalena Ramirez Corredores, Idaho National Laboratory (DOE), United States
Copyright © 2024 Schneider, Paráda, Sengl, Baptista and Oliveira. This is an open-access article distributed under the terms of the Creative Commons Attribution License (CC BY). The use, distribution or reproduction in other forums is permitted, provided the original author(s) and the copyright owner(s) are credited and that the original publication in this journal is cited, in accordance with accepted academic practice. No use, distribution or reproduction is permitted which does not comply with these terms.
*Correspondence: Simon Schneider, c2ltb24uc2NobmVpZGVyQHRlY2huaWt1bS13aWVuLmF0