- 1Department of Ecology, Evolution, and Marine Biology, University of California, Santa Barbara, Santa Barbara, CA, United States
- 2Warnell School of Forestry and Natural Resources, University of Georgia, Tifton, GA, United States
- 3United States Department of Agriculture (USDA) Forest Service, Southern Research Station, Athens, GA, United States
- 4Department of Entomology, College of Agricultural and Environmental Sciences, University of Georgia, Athens, GA, United States
We investigated the influence of landscape cover on urban bee community functional groups. We observed a diversity of functional groups across primarily forested and primarily urban sites, however particular species were favored by forest/urban spaces. Results point to the importance of further investigating the nuance of land use impacts on pollinator communities, and in particular demonstrates the merit of investigating landscape heterogeneity. Conservation of forest remnants in urban environments can positively impact wild bees across multiple functional groups.
Introduction
As the landscapes of the world become increasingly urbanized, including within and near biodiversity hotspots, there is a growing need to incorporate cities, residential areas, and other anthropogenic habitats into conservation plans (Elmqvist et al., 2013). Although urbanization reduces the biodiversity of many taxa, there are ample opportunities to improve habitat quality for many organisms. This is particularly true for pollinators which, as a group, can be surprisingly resilient to development, provided that adequate floral and nesting resources are available (Wenzel et al., 2020). Conserving pollinators in anthropogenic habitats is important for a number of reasons. First, pollinators move readily between land use types so diverse urban pollinator communities have the potential to benefit neighboring habitats, including crops (Blitzer et al., 2012). Second, the pollination services provided by insects and other animals in urban habitats are critical to the reproductive success of many plants, including those planted in community or backyard gardens. Finally, improving conditions for pollinators in urban areas is likely to improve the quality of life for human inhabitants and will provide opportunities for children to develop a sense of connection with nature (McKinney, 2002; Ayers and Rehan, 2021; Fukano and Soga, 2021). Research shows that urban greening reduces human aggression and crime in inner cities, reduces ADHD (attention deficit hyperactivity disorder) symptoms in communities of all sizes, promotes self-discipline and academic achievement in children, promotes health across the lifespan by boosting the human immune system, can reconnect individuals with nature and encourage community involvement in conservation activities (Ayers and Rehan, 2021 and the references therein, Kuo, 2007, 2013; Kuo et al., 2018 and the references therein).
The extent to which urban areas can serve as a refuge for pollinators is an exciting area of expanding research (e.g., Hall et al., 2016; Langellotto et al., 2018; Braman and Griffin, 2022). Bee abundance response to local vs. landscape scale variables depended upon body size and nesting habit (Bennett and Lovell, 2019). In their study, pollination services to sentinel cucumber plants decreased with increasing hardscape, a standard metric for urbanization. They also reported that large-bodied bees, Bombus and Apis species, were positively associated with increasing amounts of impervious cover, while the abundance of small-bodied soil nesting Halictus species increased as the proportion of flower area, a local variable, increased. Urban/sub-urban settings can offer conservation opportunities especially for solitary and primitively eusocial bees in Britain (Sirohi et al., 2015). These researchers found the urban core to be more diverse and abundant in solitary and primitively eusocial bees compared to the meadows and nature reserves. They also found rare bee species, collectively demonstrating that urban settings can contribute significantly to the conservation of solitary and primitively eusocial bees in Britain.
Functional diversity or functional differences among species can be defined as the range, distribution and abundance of functional features of organisms in a given ecosystem, and these features can be morphological, phenological, physiological, or behavioral (Violle et al., 2007). Studies that take into account not only the diversity of species but also their functional diversity allow for a better understanding of the urbanization impact on bee communities (Banaszak-Cibicka and Dylewski, 2021). An understanding of urban wild bee functional ecology is critical to effective biodiversity conservation efforts and maintenance of ecosystem services (Bucholz and Egerer, 2020). However, in their review of 48 pollinator/landscape studies, only five studies considered functional diversity indices. They noted consistent trait characteristics for nesting, sociality, body size, diet and phenology. They proposed more research to develop a better understanding of how urbanization affects the functional ecology of urban wild bees to facilitate conservation efforts. In another example of how understanding the functional ecology of wild bees can inform conservation efforts, a study in a tropical forest system found that bee community abundance and diversity were lower in restoration plantings than in primary forest, but higher than anthropogenic wetlands and agricultural fields suggesting that restoration plantings could enhance pollinator community recovery (Montoya-Pfeiffer et al., 2020). Proximity to primary forest fragments in that study was deemed important to supply bee populations to restored sites. Effects on functional groups varied, with more effects on larger bee species with more restricted nesting and floral requirements. Overall, bee trait responses seemed to be primarily driven by an interaction between nesting location and body size. Larger bees nesting above ground were found to predominate in the more conserved habitats but were replaced by smaller bees that nest below ground in more degraded habitats. Younger trees in the restoration plantings and other degraded areas did not possess sufficient cavities and substrates for bees. Traits such as body size, social behavior, nesting site, and diet breadth have been indicated as principal predictors of species occurrence and abundance in disturbed and restored habitats (Montoya-Pfeiffer et al., 2020 and the references therein.) While local site variables influence pollinators and their services, understanding influences of landscape variables at multiple spatial scales can inform regional urban planning to protect pollinators (Grab et al., 2019). Previous studies have found pollinator diversity to be both negatively and positively influenced by forest, agriculture, etc., but few have looked at species-specific traits which may differ from general measures of diversity.
In this work, we assess these trait responses of bee communities in urban residential areas to the landscape level factors of amount of land cover ranked agricultural, forest, developed and streams. Previously, we sampled bees in residential settings in and around Clarke Co., GA. and showed landscape scale and land cover affected bee abundance and diversity (Janvier et al., 2022). In that study, development correlated positively with bee diversity at small (<2.5 square km) scales, while agriculture often correlated positively with bee diversity at larger (>2.5 km) scales. Forest cover correlated negatively with bee diversity at smaller scales, but positively at larger scales. Also in that study, generalized linear models were constructed to model the responses of individual species abundances to landscape covers for species that occurred in at least 10% of the sites and with a total count of more than 25 individuals revealing that bees respond to a complex assortment of landscape characteristics and this is driven by species-specific relationships with the land cover variables.
In the present study, to better understand the landscape effects on bee community functions, we examined how bee functional groups responded to landscape context. We took a closer look at communities based on what was learned from Janvier et al. (2022). For the present analysis, using bees collected in 2020, we identified the bees and their relative abundance in the following functional groups: Nesting guild, sociality, diet breadth, phenology (peak season of adult activity), and size class in order to test the hypothesis that urban bee functional groups respond to land cover type.
Materials and methods
Background on sample locations and bee identification
Sites sampled by Janvier et al. (2022) included 50 residential properties in northern Georgia, USA, a region that was largely deforested for cotton production beginning in the mid 1800's. Though reforestation accelerated in the early 20th century, this trend reversed in recent decades, as more forests were lost to development, particularly the creation of residential communities (Miller, 2012). Sites included several land cover types including development, agriculture and forest. All properties were at least 1,600 meters (m) apart to avoid spatial autocorrelation, and by design, represented a continuum from older properties within the city of Athens to peripheral suburban neighborhoods established on former agricultural land or forests.
Bee sampling
Bees were trapped using a set of three colored plastic pan traps (white, yellow, and blue) filled with soapy water (Dawn dishwashing soap). Although pan traps are known to capture smaller bees more effectively than larger bees (Cane et al., 2000; Roulston et al., 2007), they are a highly standardized and efficient method allowing simultaneous and consistent sampling of a large number of sites. The traps were placed in areas with direct sunlight, at least 10 m from the nearest mature tree, and were arranged in a straight line with 1 m separation. Wire stands were used to hold the traps in place about 30 cm above the ground. Sampling took place 2 days per week. The contents from the three bowls at each sampling site were combined into a single jar and returned to the laboratory. Insects were strained from the pooled water samples and stored in ethanol until bees could be sorted, pinned and identified. They were identified by MDU using an established reference collection and a variety of printed and online resources (Mitchell, 1960, 1962; Gibbs, 2011; Gibbs et al., 2013; https://www.discoverlife.org). Voucher specimens are retained at the University of Georgia Natural History Museum.
Landscape analysis
Previously, we quantified landscape composition at 11 spatial extents (scales), ranging from ~0.20 to 2.2 km in radius (i.e., 0.20–14.98 km2). These scales were chosen as they encompass the extent of documented foraging ranges of bee species (Taki et al., 2007; Winfree et al., 2007; Watson et al., 2011). At each site the percent of the landscape occupied by each cover type for each spatial scale was calculated using the most recent USGS National Land Cover Database (NLCD) 2016 data. Land cover categories we considered included total forest cover, agriculture, and development. Further descriptions of landscape data are at: National Land Cover Database (https://www.usgs.gov/centers/eros/science/national-land-cover-database accessed 9/1/2021 date). Sites were classed into primary cover types between the most common cover types: agriculture, development, and forest.
We determined the “scale of effect” (Jackson and Fahrig, 2012) for each landscape variable and bee response variable combination. To do so we identified the spatial scales most highly correlated with each response variable (Holland and Yang, 2016). We used Pearson correlation coefficients for response variables with normal distributions and Spearman correlation coefficients for those with non-normal distributions. For each landscape cover type, the scale(s) with the highest and lowest correlation coefficients (to include negative correlations) were selected for initial analyses (Oksanen et al., 2020).
In the present study, we started by compiling a list of functional traits and developing a framework of functional group designations for all species for nesting, sociality, diet, phenology, and size. We used several sources in designating/verifying various functional groups including Mitchell (1960, 1962), Shinn (1967), Stockhammer (1967), Bouseman and LaBerge (1978), Brooks (1983), Cane (1991), Potts and Willmer (1997, 1998), Cane et al. (2007), Michener (2007), Fetridge et al. (2008), Matteson et al. (2008), Gibbs (2011), Rightmyer et al. (2011), Haider et al. (2013), Rozen and Go (2015), Lerman and Milam (2016), Wilson and Carril (2016), Ascher (2017), Langellotto et al. (2018), Danforth et al. (2019), and Fortuin and Gandhi (2021).
Nesting categories included cavity, litter, and soil dwelling bees. Cavity nesters nest in pithy stems or dead wood, and here, included soft wood nesters that require highly decayed wood. Litter dwellers are bees that tend to nest in leaf litter, wood piles, uppermost layer of soil organic matter, or perhaps existing animal burrows. Soil nesters excavate their nests underground. Sociality has two categories. Social where there is shared labor among colony members or solitary where females tend their own nests, although individual nests may be highly aggregated. Diet considered whether bees are generalists, utilizing a broad range of floral resources, or specialists that concentrate on a specific genus or perhaps family of plants for pollen. Phenology described whether a bee species occurs in early, mid, or late season, based on peak flight activity. Peak flight season—was divided into three categories: (1) early (February–April); (2) mid (May–July); or (3) late (August–November) seasons. For groups which are active across multiple seasons (i.e., Bombus spp. and other primitively eusocial groups), we selected the season for which their colony activity is at its peak. Size of bees, based on inter-tegular width from literature references, was divided into three categories according to the following criteria: (1) “small” ≤ 2 mm; (2) “medium” 2.1–3 mm; or (3) “large” ≥ 3 mm.
Statistical analysis
All analyses were done in R (R Core Team, 2022). We determined differences in relative abundance of bee functional trait groups and evaluated their response to primary land cover types, having previously demonstrated that land cover use types (agriculture, development, and forest) at particular spatial scales influence community composition (Janvier et al., 2022). Following Götzenberger et al. (2020), we utilized a “double Canonical Correspondence Analysis” (dCCA) to investigate the relationship of land cover use percentages at their most impactful scales to bee communities on differentiation in bee functional traits. Janvier et al. (2022) determined which of 15 landscape cover use scales most correlated with bee abundance and richness for these bee assemblages. The scale differed depending on the cover type. Forest cover and Developmental cover were analyzed at 14.9769 km2 around the collection site, Agriculture cover was 2.5281 km2, and Streams were 0.2025 km2 as these particular scales were what was shown to be most correlated (i.e., had the appropriate, most impactful effect on pollinator abundance and richness) for their associated land cover types in prior analyses.
We followed the method for looking at both functional traits and environmental factors on communities across sample sites laid out in Götzenberger et al. (2020). The method is a double Canonical Correspondence Analysis, which first constrains the community matrix data by the environmental data in a Canonical Correspondence Analysis. It then also constrains the data, in the same CCA ordination, with the functional trait data using the dbrda function written by Kleyer et al. (2012). The relationship between bee species as an abundance matrix was first constrained with the land cover categories agriculture, development, forest, and streams in a Canonical Correspondence Analysis (CCA) using the dudi.coa function from the ade4 package (Dray and Dufour, 2007). A permutational analysis of variance was run on the CCA to confirm significance of included land cover parameters. The resulting CCA of bee species was then doubly constrained by the species' functional traits (diet specialization, nesting habitat, peak seasonality, size, and sociality) using the code for the dbrda function provided in Kleyer et al. (2012). The resulting ordination plots bee species in ordination space, then vectorizes environmental data (landscape use and stream length) in addition to vectorizing shifting functional traits. Within that ordination, hierarchical cluster analysis identified functional response clusters of bee species responding similarly to cover use. The optimal number of meaningful clusters was determined using the hclust function (ward.D2 method) of the stats package (Murtagh and Legendre, 2014; R Core Team, 2022). Linear models were constructed with the geom_smooth function (method = “lm”) of the ggplot2 package. Model statistics were determined using the stat_poly_eq function of the ggmisc package. We used the eulerr package to generate Euler diagrams further illustrating the relationships among functional groups and land cover (Larsson, 2021).
Results
The 2,932 bees evaluated in the present study, representing 98 species from 27 genera in four families collected from residential landscapes, were dominated by soil nesting generalists (Figures 1A, B, E, F). Solitary bee species were more than twice as common as bee species displaying social behavior; however, the total number of individual bees (abundance) was greater for the social bees than the solitary bees (Figures 1C, D). Parasitic bees were collected, but in low numbers. Early, mid, and late season bees were all represented as were small, medium and large bees, with small bees being most numerous (Figures 1G–J).
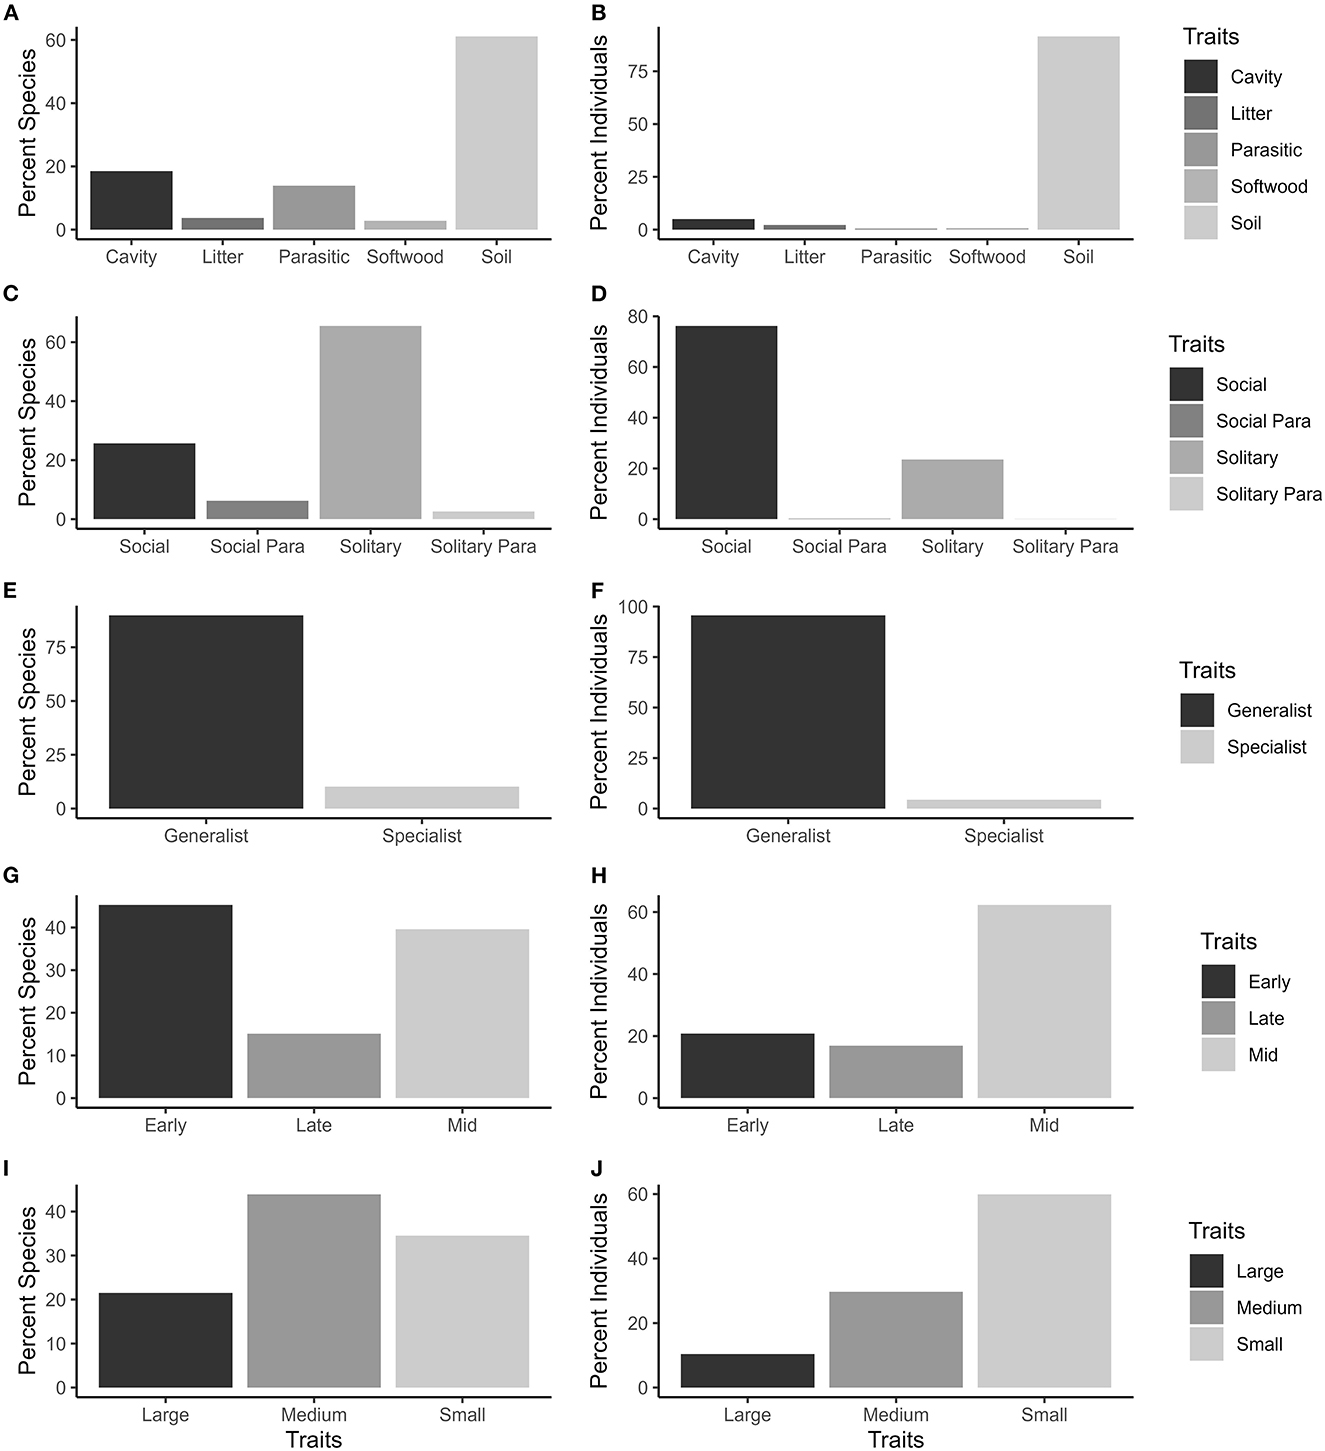
Figure 1. Percent bee species (A, C, E, G, I) and number of individuals (B, D, F, H, J) collected in pan traps from 50 residential properties in and around Clarke Co., Georgia, that represent varying functional traits. Nesting site (A, B), sociality (C, D), diet (E, F), phenology-peak season (G, H) and size (I, J) trait variations are shown for urban bees collected on residential landscapes in the southeastern United States.
Cover types significantly influenced bee community functional groups: Forest (F = 1.78, P = 0.013, df = 1, 42), development (F = 2.69, P = 0.001, df = 1, 42), agriculture (F = 1.99, P = 0.001, df = 1, 42), and stream (F = 1.36, P = 0.04, df = 1, 42) (Figure 2). Size, sociality, and diet breadth were more strongly influenced by degree of development, while nesting guilds and peak season of activity were more influenced by forest cover (Figure 2). Streams were a significant influence on community variation, particularly for bees in cluster 6, however streams appear to primarily influence bee traits not evaluated in our current data set (Figure 2). Clusters in Figure 2 and Supplementary Table 4, consist of species that are closely associated in the dCCA ordination space, which is vectorizing both land covers, and functional traits. A dendrogram (Supplementary Figure 1) further illustrates which bee species clustered together based on the relationships between bee nesting habitat, size, sociality, peak season of activity and diet and the land cover categories agriculture, development, forest and streams.
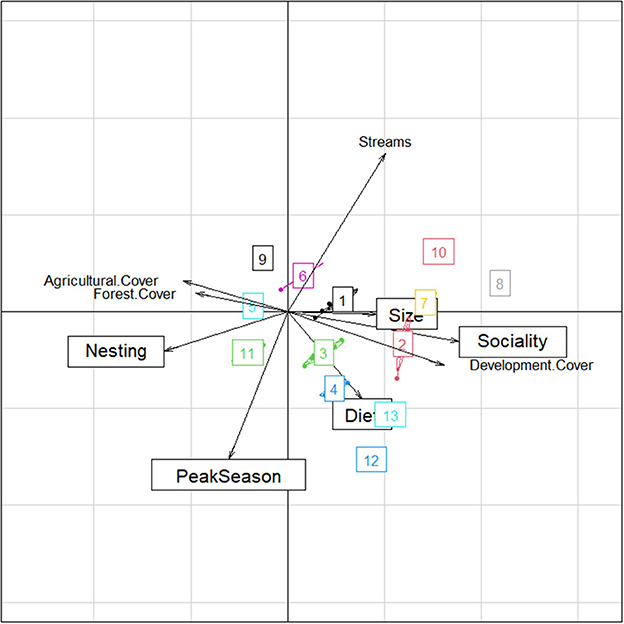
Figure 2. Site differences in the functional traits nesting site, sociality, diet, phenology-peak season and size. Visual results of Canonical Correspondence Analysis performed to evaluate differences among land cover types forest, development, and agriculture illustrating the most important variables separating bee functional traits. Numbers in boxes refer to hierarchical cluster analysis that identified functional response clusters of bee species responding similarly to cover use. See Supplementary Table 4 and Figure 1 for additional info on bees in each cluster.
Linear models (Supplementary Table 5) showed the relative abundance of specialist, cavity dwelling, parasitic and solitary bees all tended to increase with increased development cover (Figures 3A, B, D), while the relative abundance of generalist, soil dwelling, and social bees decreased (Figures 3A, B, D). As the amount of forest cover increased, linear models showed generalist, soil dwelling, and social bee relative abundances tending to increase (Figures 4A, B, D), while specialist, cavity dwelling, parasitic and solitary bee relative abundances diminished (Figures 4A, B, D). Bee size appeared consistent with little influence contributed by the amount of forest or development land cover (Figures 3C, 4C).
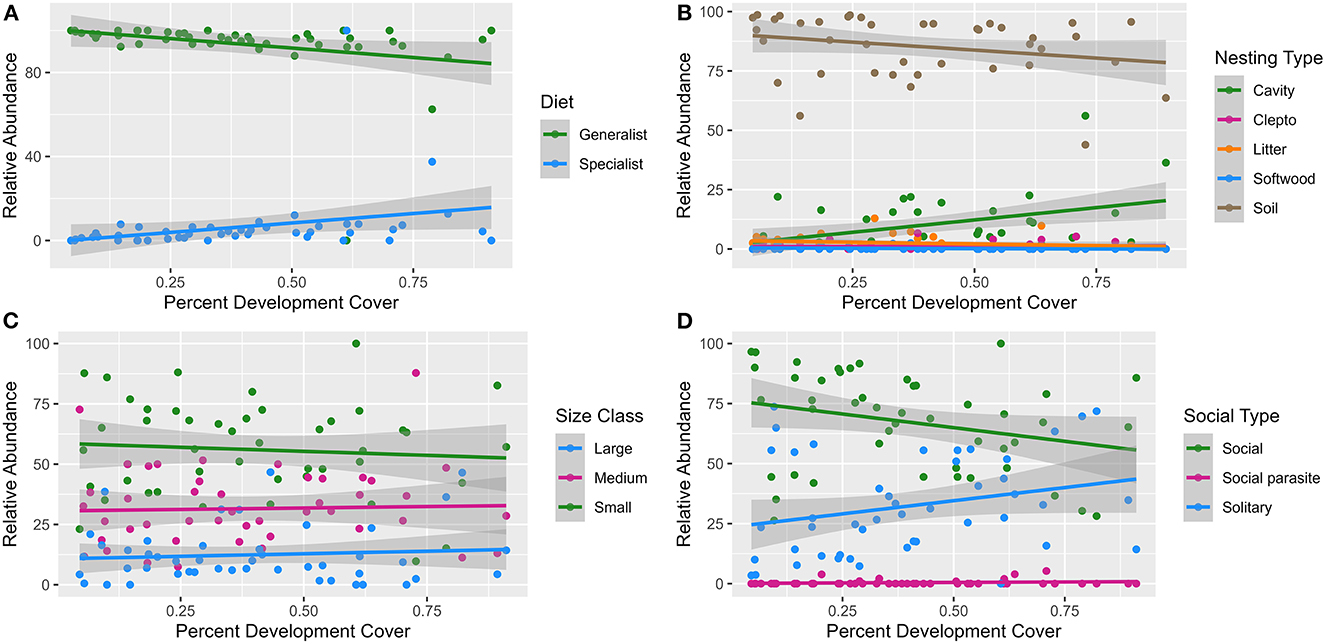
Figure 3. Linear models of the relationship between percent development land cover and bee abundance across the functional traits of diet (A), nesting (B), size (C) and sociality (D). Each model trend line is graphed with a 95% standard error (the shaded portion around each line).
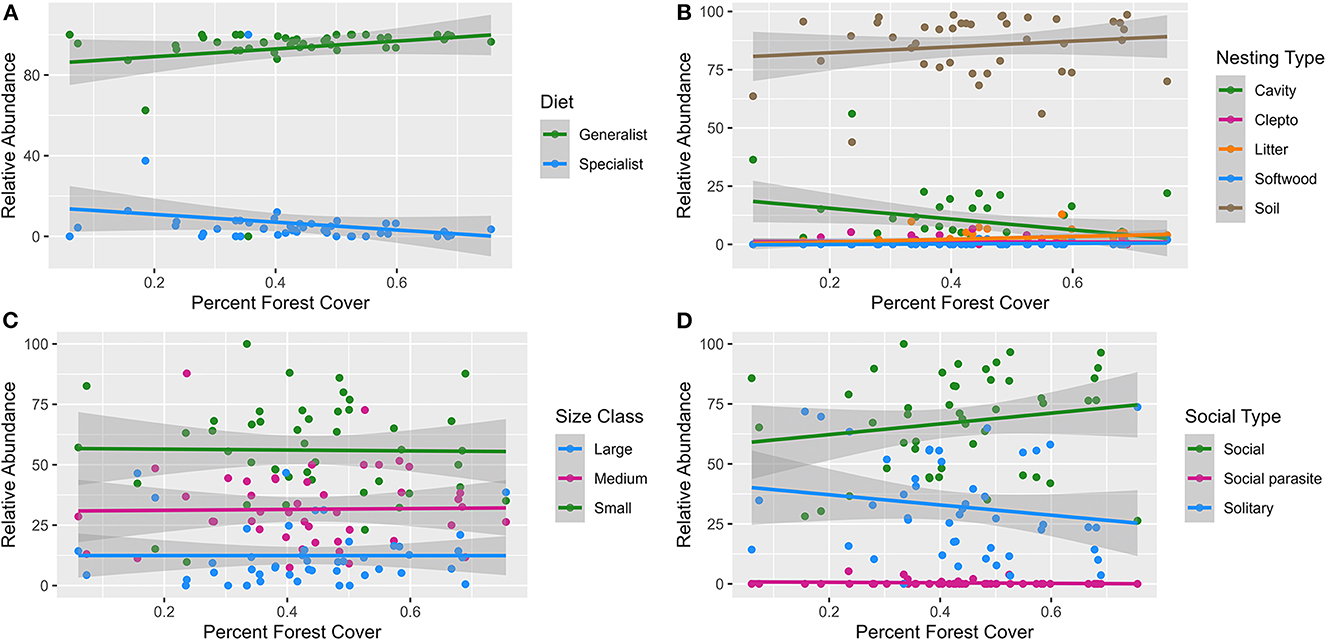
Figure 4. Linear models of the relationship between percent forest land cover and bee abundance across the functional traits of diet (A), nesting (B), size (C) and sociality (D). Each model trend line is graphed with a 95% standard error (the shaded portion around each line.
During these 2020 surveys, primarily forested sites harbored 26 uniquely encountered species, while primarily development sites had 16 uniquely encountered species, with 56 species shared among our three landcover distinctions (Figure 5). Of the 85 encountered generalist feeders, 25 species were unique to primarily forested sites, and 12 were unique to primarily development (Figure 6A; Supplementary Table 1). All three land cover types shared 17 species, with no generalist feeder species unique to primarily agriculture sites (Figure 6A). For the nine specialist feeder species encountered, one species, Lasioglossum lustrans (Cockerell), was unique to forested sites and two species, Andrena nigrae Robertson and Svastra obliqua Say, were unique to development sites (Figure 6B).
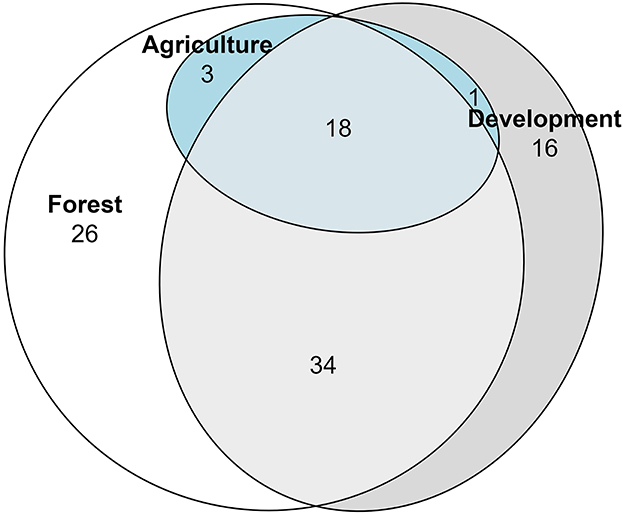
Figure 5. Euler diagram showing number of bee species unique to or in common with the land cover designations Forest, Development, or Agriculture. Bees were collected via pan traps from 50 residential properties in and around Clarke Co., Georgia.
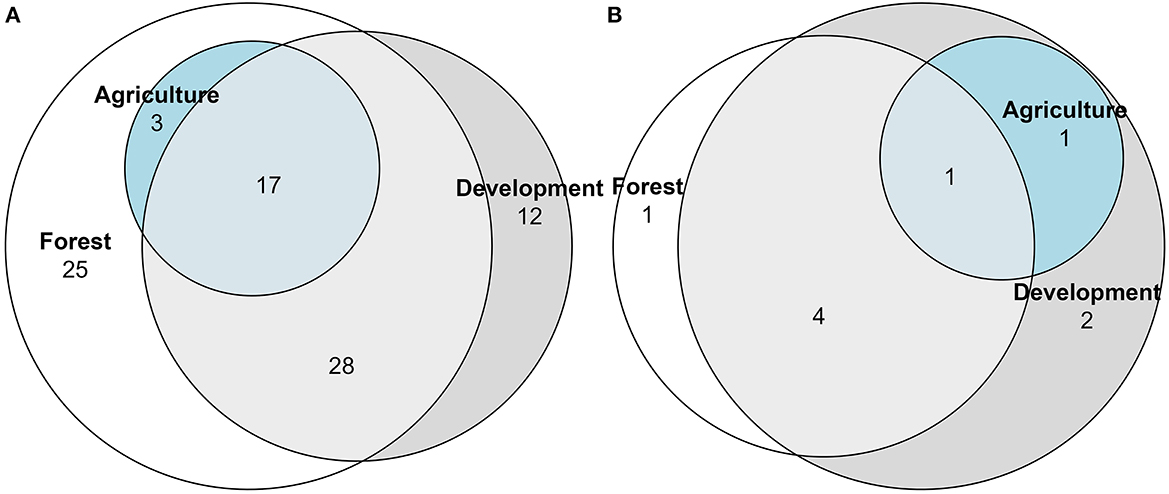
Figure 6. Euler diagram of diet functional groups showing number of generalist (A) or specialist (B) bee species unique to or in common with the land cover designations forest, development or agriculture. Bees were collected via pan traps from 50 residential properties in and around Clarke Co., Georgia.
Nesting strategies were diverse among cover types (Figure 7; Supplementary Table 2). Among the 16 cavity dwelling species, two, Heriades carinatus Cresson and Megachile sculpturalis Smith, were unique to forested sites as well as two species, Hoplitis nemophillae Neff and Osmia subfasciatta Cresson, to development sites (Figure 7A). Of the 61 soil dwelling species, 13 species were unique to forested sites, and ten were unique to development sites (Figure 7B). The litter dwellers, bumblebees (Supplementary Table 2), were present in all three cover types, with one species, Bombus bimaculatus Cresson, unique to forested sites (Figure 7C). Of the 64 solitary bee species, 17 species were unique to primarily forested sites, and 12 were unique to primarily development sites (Figure 8A; Supplementary Table 3). Of the 27 social bee species, seven were unique to primarily forested sites, with all others shared between multiple land cover types (Figure 8B).
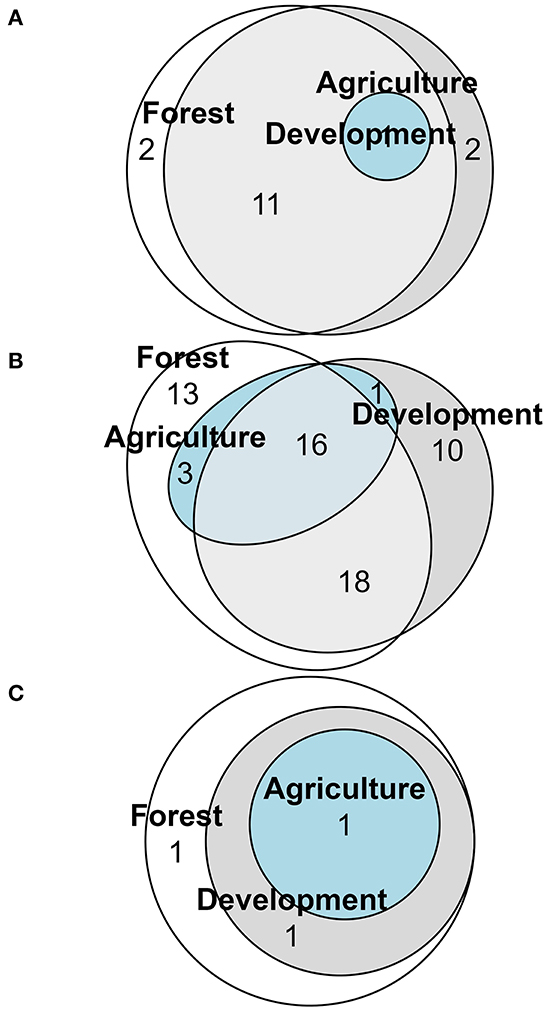
Figure 7. Euler diagram of nesting type functional groups showing number of cavity (A) soil (B) or litter (C) nesting bee species unique to or in common with the land cover designations forest, development or agriculture. Bees were collected via pan traps from 50 residential properties in and around Clarke Co., Georgia.
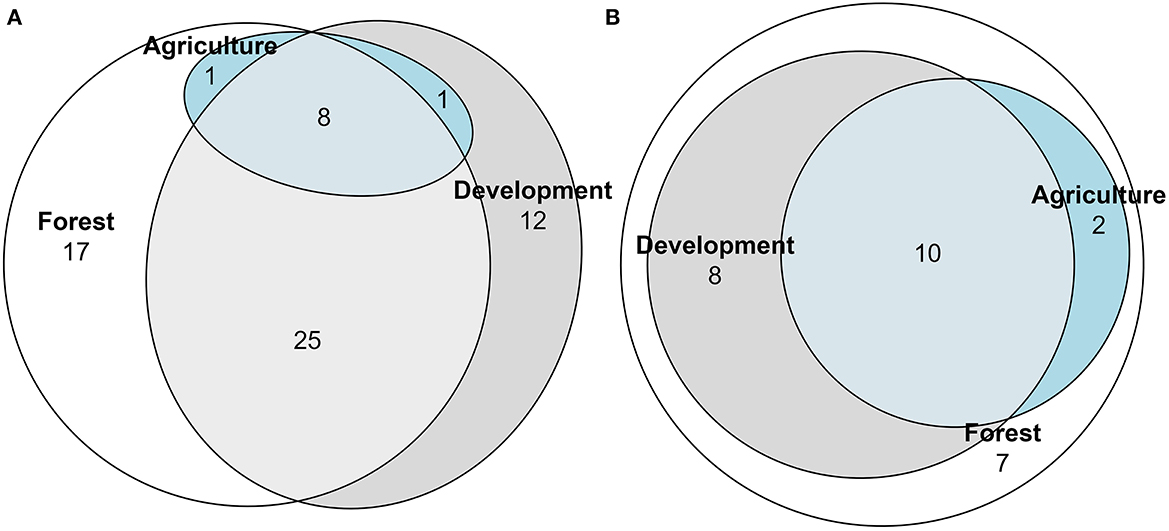
Figure 8. Euler diagram of social type functional groups showing number of solitary (A) or social (B) bee species unique to or in common with the land cover designations forest, development or agriculture. Bees were collected via pan traps from 50 residential properties in and around Clarke Co., Georgia.
Among all bees sampled, 26 species (26.5%) were unique to forest cover, but that number varied by functional group. Nesting guilds, for example, had differential responses among species to land cover with 2 (15%) cavity dwellers, 13 (26.5%) soil dwellers and 1 (33.3%) litter dweller unique to forest cover. Within the soil nesters there were sometimes similarities within genera. Three out of 4 Eucera species, for example, were encountered on landscapes characterized by primarily forest cover (Supplementary Table 2). Among the Lasioglossum, however, only 4 of 19 species were unique to forest cover, while two were unique to the development land cover sites. The exotic bees Osmia taurus Smith and Megachile sculpturalis Smith were found on sites characterized as primarily forest. Three specialist bees were unique to development, while only one specialist was unique to forested sites. Six parasitic bees were unique to forest cover sites.
Considering only those bee species that were represented on multiple sites and were represented by at least 15 individuals, 20 were generalists and two were specialists. Nine were solitary, while 13 exhibit some form of social behavior. Two were cavity dwellers, two litter dwellers and the rest are soil nesters. Among this group of bee species, those strongly favoring forested sites included Augochlorella aurata (Smith), Bombus griseocollis (De Geer), B. impatiens Cresson, Ceratina strenua Smith, Halictus ligatus/poeyi Say, Lasioglossum bruneri Crawford, Lasioglossum callidum Crawford, L. hitchensi Gibbs, L. illinoense (Robertson), L. imitatum (Smith), L. tegulare/(Robertson)/puteulanum Gibbs, L. trigeminum Gibbs, L. zephyrum (Smith), and Osmia georgica Cresson. This group included litter, cavity, and soil nesters. Calliopsis andreniformis Smith, in contrast, was more common in sites characterized by development (Supplementary Tables 1–3).
Discussion
Urban residential landscapes are characterized by numerous factors that could influence native bee abundance and diversity. These can be local (e.g., vegetation cover, floral resources, exotic plant cover, nesting resources, microclimate, green space size and habitat type.) or landscape level (e.g., landscape heterogeneity and fragmentation, surrounding land use?, impervious surfaces, urban heat island effects) (Ayers and Rehan, 2021). We examined the relationships of urban landscape -level land cover types with bee functional traits, with the aim of identifying those functional groups and the species that composed them that are vulnerable to increasing urbanization and could merit special consideration for conservation. In our study land cover types did significantly influence differentiation of urban bee community functional groups. Various studies have revealed trends in urban bees and functional traits and their response to urbanization, yet these trends are not always generalizable because of species-specific variation in response (Cariveau and Winfree, 2015; Bucholz and Egerer, 2020). While our study found a much greater abundance of generalists than specialists, consistent with numerous studies (Ayers and Rehan, 2021), the specialist bees from the 50 sites we surveyed tended to increase with increasing development cover. Although seven specialist bees were captured in our study (Supplementary Table 6), the vast majority of individuals were Ptilothrix bombiformis (Cresson) and Peponapis pruinosa (Say) the hibiscus bee and the squash bee, respectively, known to frequently visit plants typical of backyard gardens and ornamental plantings in residential landscapes in urban settings. An additional four species also specialize on plants characteristic of urban gardens and landscape settings, namely violets, false dandelions, mock orange and sunflowers.
Our study adds to a growing body of literature showcasing the complexity and multifaceted nature of considering community level responses of functional group traits. In the present study, specialist, cavity-dwelling and solitary bees tended to increase with increasing development cover, while soil-dwelling and social bees increased with increasing forest cover. In a study of bee functional groups in a Brazilian metropolis where stingless bees are an important component of the social functional group in tropical areas, however, social bees were more resilient to increasing urbanization (Graf et al., 2022). However, in that study as well as ours, above-ground bees were more resilient to increasing urbanization. Wilson and Jamieson (2019) determined that more urbanized sites supported a greater number of exotic, above-ground nesting, and solitary bees, but fewer eusocial bees. A study of bees in 55 cities across the globe explored how characteristics of cities influenced the taxonomic and functional trait profile of urban bees (Ferrari and Polidori, 2022). (Ferrari and Polidori, 2022) found that looking at the differences among cities across a wide geographical scale helped explain the previously observed variable response of some bee community traits across local urbanization gradients. They found, for example, that bigger cities host few parasitic and oligolectic species, along with more above-ground-nesting bees. Most sites in our present study were in and around Athens, Clarke County. With a 2020 population of 130,081, it is the 5th largest city in the state of Georgia and the 220th largest city in the United States. Spanning over 118 miles, Athens has a population density of 1,118 people per square mile (world population review https://worldpopulationreview.com/us-cities/athens-ga-population). As populations globally continue to rapidly develop urban cityscapes and suburban spaces like Athens, while also working toward creating more sustainable green spaces that support pollinator communities, understanding how landscape heterogeneity impacts pollinator communities is imperative to effective pollinator conservation.
Our study focused in particular on forested landcover as this area historically was primarily Oak and Pine woodlands. Thus, many native pollinators in this system likely originated in a well-forested landscape. Forest cover as part of these urban landscapes in the present study was associated with increased abundance of soil dwelling, generalist, and social bees. In our system at the urban/forest interface, softwood nesters also increased with increasing forest cover. Glenny et al. (2023) reported that the abundance of trees within the forest/grassland ecotone was positively associated with coarse woody debris (CWD), and in turn CWD had a positive association with bee richness and functional diversity early in the growing season and positive association with functional richness later in the growing season. Fortuin and Gandhi (2021) reported that nesting habitat indicators explained the majority of variation in bee communities in clearcut and managed hardwood and pine forests in the SE United States. In their study they concluded that mature hardwood forests promoted a wide diversity of functional groups and nesting guilds, and that nesting habitat by itself, without consideration for forage resources, is a strong predictor of wild bee community structure in southeastern forests, and therefore may also be a limiting factor for many groups. Research has demonstrated the importance of floral resources to mitigating the negative impacts of urbanization on pollinator communities, e.g., Birdshire et al. (2020). Our results imply that conservation of forest remnants in urban environments can also positively impact wild bees across multiple functional groups. We speculate that several aspects of urban forests could favor bees including increased availability of nesting habitat, diversity of pollen sources, including from plants that do not require bees for pollination, or even the availability of resin (e.g., Megachile sculpturalis, the giant resin bee). Future work could further address what are aspects of urban forests that most benefit wild bees and identify mechanisms to enhance engagement with municipal planners to best communicate these benefits.
Conclusion
In conclusion, it is clear from this work that landscape context strongly influences the functional composition of urban bee communities in our system. Forest cover has a particularly strong effect on bee assemblages, which is not surprising given that forests dominated our study region historically. Because forest-associated species, which may account for nearly a third of native bee diversity in the eastern US (Smith et al., 2021), are largely lost from landscapes experiencing extensive deforestation (Ulyshen et al., 2023), forest cover is an important consideration for conservation planning in mixed-use landscapes. Many other taxa are less dependent on semi-natural habitats and can persist in urban areas as long as adequate floral and nesting resources are available. Future work can help us better understand how a suite of local efforts to improve conditions for pollinators (increasing floral resources, trees, nesting sites) can promote the diversity of these critical organisms. While much work has been done examining how increasing the abundance of these resources can affect pollinator communities, there remain gaps in our understanding that inhibit implementation of conservation measures. Future studies should continue to elucidate urban effects on bee functional traits with the recognition that trends may be regionally and species specific (Cariveau and Winfree, 2015; Ayers and Rehan, 2021). To better understand successful conservation of urban bee communities, future research should focus on identifying bees that demonstrate greater adaptive response to urban perturbations and why they are able to take advantage of available resources more effectively. In doing so, urban planning with a bee conservation mindset can make better informed decisions that promote the inclusion of bee friendly green spaces within the urban matrix (Hernandez et al., 2009). In particular the relationship between hardwood forest cover and pollinator diversity is poorly understood. For example, future research questions could include: can bees benefit from wind-pollinated oaks that are significant features of remnant forest in urban areas in our region? What is the total greenspace area needed to support wild bees and is this completely dependent on bee mobility or other factors as well?
Efforts to better communicate green space benefits for ecosystem and human health to those who can influence implementation including city planners, landscape designers and developers, home owners associations as well as the general public are needed to move the conservation needle more rapidly in the right direction. Our work addressed the need to investigate landscape effects on bee community ecology. Our results confirm the importance of inclusion of forest cover in urban planning whether they are remnant or restored. This forest cover impacts a wide array of bee functional diversity in these landscapes making it integral to effective conservation in planning urban greenspaces.
Data availability statement
The raw data supporting the conclusions of this article will be made available by the authors, without undue reservation.
Author contributions
SB and MU conceived the presented idea. CB developed the theory, performed the computations, and verified the analytical methods. EM encouraged the focus of investigating functional groups. ME-V, CT, and AJ contributed to data collection, processing, and analysis. All authors discussed the results and contributed to the writing. All authors contributed to the article and approved the submitted version.
Funding
This project is based on research that was partially supported by the Georgia Agricultural Experiment Station with funding from the Hatch Act (Accession Number 224057) through the USDA National Institute for Food and Agriculture.
Acknowledgments
We appreciate C. C. Fortuin for invaluable assistance with functional group designations. We also appreciate review of an earlier draft by Conor Fair and assistance with Figure 1.
Conflict of interest
The authors declare that the research was conducted in the absence of any commercial or financial relationships that could be construed as a potential conflict of interest.
Publisher's note
All claims expressed in this article are solely those of the authors and do not necessarily represent those of their affiliated organizations, or those of the publisher, the editors and the reviewers. Any product that may be evaluated in this article, or claim that may be made by its manufacturer, is not guaranteed or endorsed by the publisher.
Supplementary material
The Supplementary Material for this article can be found online at: https://www.frontiersin.org/articles/10.3389/frsc.2023.1192588/full#supplementary-material
References
Ascher, J. S. (2017). Discover Life Species Guides. Available online at: http://www.discoverlife.org/ (accessed May 12, 2007).
Ayers, A. C., and Rehan, S. M. (2021). Supporting bees in cities: how bees are influenced by local and landscape features. Insects (2021) 12, 128. doi: 10.3390/insects12020128
Banaszak-Cibicka, W., and Dylewski, Ł. (2021). Species and functional diversity — A better understanding of the impact of urbanization on bee communities. Sci. Total Environ. 774, 145729. doi: 10.1016/j.scitotenv.2021.145729
Bennett, A. B., and Lovell, S. (2019). Landscape and local site variables differentially influence pollinators and pollination services in urban agricultural sites. PLoS ONE 14, e0212034. doi: 10.1371/journal.pone.0212034
Birdshire, K. R., Carper, A. L., and Briles, C. E. (2020). Bee community response to local and landscape factors along an urban-rural gradient. Urban Ecosyst. 23, 689–702. doi: 10.1007/s11252-020-00956-w
Blitzer, E. J., Dormann, C. F., Holzschuh, A., Klein, A.-M., Rand, T. A., and Tscharntke, T. (2012). Spillover of functionally important organisms between managed and natural habitats. Agric. Ecosyst. Environ. 146, 34–43. doi: 10.1016/j.agee.2011.09.005
Bouseman, J. K., and LaBerge, W. E. (1978). A revision of the bees in the genus Andrena of the western hemisphere. Part IX. Subgenus Melandrena. Trans. Am. Entomol. Soc. 104, 275–389.
Braman, S. K., and Griffin, B. (2022). Opportunities for and impediments to pollinator conservation in urban settings: a review. J. Integ. Pest Manage. 13, 1–15. doi: 10.1093/jipm/pmac004
Brooks, R. W. (1983). Systematics and bionomics of Anthophora: The bomboides group and species groups of the New World (Hymenoptera: Apoidea, Anthophoridae). Univ. Calif. Publ. Entomol. 98, 1–86. Available online at: https://digitalcommons.usu.edu/bee_lab_bo/231
Bucholz, S., and Egerer, M. H. (2020). Functional ecology of wild bees in cities: towards a better understanding of trait-urbanization relationships. Biodivers. Conserv. 29, 2779–2891. doi: 10.1007/s10531-020-02003-8
Cane, J., Minckley, R. L., and Kervin, L. J. (2000). Sampling bees (Hymenoptera: Apiformes) for pollinator community studies: pitfalls of pan-trapping. J. Kansas Entomol. Soc. 73, 225–231. doi: 10.2307/25085973
Cane, J. H. (1991). Soils of ground-nesting bees (Hmenoptera: Apoidea): texture, moisture, cell depth and climate. J. Kansas Entomol. Soc. 64, 406–413.
Cane, J. H., Griswold, T., and Parker, F. D. (2007). Substrates and materials used for nesting by North American Osmia bees (Hymenoptera: Apiformes: Megachilidae). Ann. Entomol. Soc. Am. 100, 350–358. doi: 10.1603/0013-8746(2007)100[350:SAMUFN]2.0.CO;2
Cariveau, D., and Winfree, R. (2015). Causes of variation in wild bee responses to anthropogenic drivers. Curr. Opin. Insect Sci. 10, 104–109. doi: 10.1016/j.cois.2015.05.004
Danforth, B. N., Minckley, R. L., and Neff, J. L. (2019). The Solitary Bees: Biology, Evolution, Conservation. Princeton, NJ: Princeton University Press.
Dray, S., and Dufour, A. (2007). The ade4 package: implementing the duality diagram for ecologists. J. Stat. Softw. 22, 1–20. doi: 10.18637/jss.v022.i04
Elmqvist, T., Fragkias, M., Goodness, J., Güneralp, B., Marcotullio, P. J., McDonald, R. I., et al. (2013). Urbanization, Biodiversity and Ecosystem Services: Challenges and Opportunities: A Global Assessment. Springer Nature. p. 755.
Ferrari, A., and Polidori, C. (2022). How city traits affect taxonomic and functional diversity of urban wild bee communities: insights from a worldwide analysis. Apidologie 53, 46. doi: 10.1007/s13592-022-00950-5
Fetridge, E. D., Ascher, J. S., and Langellotto, G. A. (2008). The bee fauna of residential gardens in a suburb of New York city (Hymenoptera: Apoidea). Ann. Entomol. Soc. Am. 101, 1067–1077. doi: 10.1603/0013-8746-101.6.1067
Fortuin, C. C., and Gandhi, J. K. J. (2021). Functional traits and nesting habitats distinguish the structure of bee communities in clearcut and managed hardwood and pine forests in southeastern USA. For. Ecol. Manage. 496, 1–10. doi: 10.1016/j.foreco.2021.119351
Fukano, Y., and Soga, M. (2021). Why do so many modern people hate insects? The urbanization–disgust hypothesis. Sci. Total Environ. 777, 146229. doi: 10.1016/j.scitotenv.2021.146229
Gibbs, J. (2011). Revision of the metallic Lasioglossum (Dialictus) of eastern North America (Hymenoptera: Halictidae: Halictini). Zootaxa 3073, 1–216. doi: 10.11646/zootaxa.3073.1.1
Gibbs, J., Packer, L., Dumesh, S., and Danforth, B. N. (2013). Revision and reclassification of Lasioglossum (Evylaeus), L.(Hemihalictus) and L. (Sphecodogastra) in eastern North America (Hymenoptera: Apoidea: Halictidae). Zootaxa. 3672, 1–117. doi: 10.11646/zootaxa.3672.1.1
Glenny, W., Runyon, J. B., and Burkle, L. A. (2023). Habitat characteristics structuring bee communities in a forest-shrubland ecotone. For. Ecol. Manage. 534, 120883. doi: 10.1016/j.foreco.2023.120883
Götzenberger, L., de Bello, F., Dias, A. T., Moretti, M., Berg, M., and Carmona, C. P. (2020). Trait-Based Ecology Tools in R. doi: 10.20350/digitalCSIC/12663
Grab, H. M. G., Branstetter, Amon, N., Urban-Mead, K. R., Park, M. G., Gibbs, J., et al. (2019). Agriculturally dominated landscapes reduce bee phylogenetic diversity and pollination services. Science 363, 282–284. doi: 10.1126/science.aat6016
Graf, L. V., Schneiberg, I., and Gonçalves, R. B. (2022). Bee functional groups respond to vegetation cover and landscape diversity in a Brazilian metropolis. Landsc. Ecol. 37, 1075–1089. doi: 10.1007/s10980-022-01430-y
Haider, M., Dorn, S., Sedivy, C., and Müller, A. (2013). Phylogeny and floral hosts of a predominantly pollen generalist group of mason bees (Megachilidae: Osmiini). Biol. J. Linn. Soc. 111, 78–91. doi: 10.1111/bij.12186
Hall, G. R., Camilo, D. M. R., Tonietto, K., Ollerton, J., Ahrn,é, K., Arduser, M., et al. (2016). The city as a refuge for insect pollinators. Conserv. Biol. 31, 24–29. doi: 10.1111/cobi.12840
Hernandez, J. L., Frankie, G. W., and Thorp, R. W. (2009). Ecology of urban bees: a review of current knowledge and directions for future study. Cities Environ. 2, 3. doi: 10.15365/cate.2132009
Holland, J., and Yang, S. (2016). Multi-scale studies and the ecological neighborhood. Curr. Landscape Ecol. Rep. 1, 135–145. doi: 10.1007/s40823-016-0015-8
Jackson, H. B., and Fahrig, L. (2012). What size is a biologically relevant landscape? Landsc. Ecol. 27, 929–941. doi: 10.1007/s10980-012-9757-9
Janvier, A. J., Ulyshen, M. D., Braman, C. A., Traylor, C., Edelkind-Vealey, M., and Braman, S. K. (2022). Scale-dependent effects of landscape context on urban bee diversity. J. Insect Conserv. 26, 697–709. doi: 10.1007/s10841-022-00402-6
Kleyer, M., Dray, S., Bello, F., Lep,š, J., Pakeman, R., Strauss, B., et al. (2012). Assessing species and community functional responses to environmental gradients: which multivariate methods? J. Veg. Sci. 23, 805–821. doi: 10.1111/j.1654-1103.2012.01402.x
Kuo, F. (2007). “Conservation crossroads: a view from the side of the road,” in How Can Conservation Help? Using Land Conservation to Address Other Economic and Social Issues, editor B. S. Gentry, Forestry & Environmental Studies Publications Series, Vol. 36. Available online at: https://elischolar.library.yale.edu/fes-pubs/36
Kuo, F. (2013). Nature-deficit disorder: evidence, dosage, and treatment. J. Policy Res. Tour. Leisure Events 5, 172–186. doi: 10.1080/19407963.2013.793520
Kuo, M., Browning, M. H. E. M., and Penner, M. L. (2018). Do lessons in nature boost subsequent classroom engagement? Refueling Students in Flight. Front. Psychol. 8, 2253. doi: 10.3389/fpsyg.2017.02253
Langellotto, G. A., Melathopolous, A., Messer, I., Anderson, A., McClintock, N., and Costner, L. (2018). Garden pollinators and the potential for ecosystem service flow to urban and peri-urban agriculture. Sustainability 10, 2047. doi: 10.3390/su10062047
Larsson, J. (2021). _eulerr: Area-Proportional Euler and Venn Diagrams with Ellipses_. R package version 6.1.1. Available online at: https://CRAN.R-project.org/package=eulerr
Lerman, S. B., and Milam, J. (2016). Bee fauna and floral abundance within lawn-dominated suburban yards in Springfield, Ma. Ann. Entomol. Soc. Am. 109, 713–723. doi: 10.1093/aesa/saw043
Matteson, K. C., Ascher, J. S., and Langellotto, G. A. (2008). Bee richness and abundance in New York City urban gardens. Ann. Entomol. Soc. Am. 101, 140–150. doi: 10.1603/0013-8746(2008)101[140:BRAAIN]2.0.CO;2
McKinney, M. L. (2002). Urbanization, Biodiversity, and Conservation: The impacts of urbanization on native species are poorly studied, but educating a highly urbanized human population about these impacts can greatly improve species conservation in all ecosystems. Bioscience. 52, 883–890. doi: 10.1641/0006-3568(2002)052[0883:UBAC]2.0.CO;2
Michener, C. D. (2007). Bees of the world, Second ed. Baltimore, MD: Johns Hopkins University Press. doi: 10.56021/9780801885730
Miller, M. D. (2012). The impacts of Atlanta's urban sprawl on forest cover and fragmentation. Appl. Geograp. 34, 171–179. doi: 10.1016/j.apgeog.2011.11.010
Mitchell, T. B. (1960). Bees of the Eastern United States Volume I, North Carolina Agricultural Experiment Station Technical Bulletin No. 141.
Mitchell, T. B. (1962). Bees of the Eastern United States, Volume 2, North Carolina Agricultural Experiment Station Technical Bulletin No. 141.
Montoya-Pfeiffer, P. M., Rodrigues, R. R., and Alves Dos Santos, I. (2020). Bee pollinator functional responses and functional effects in restored tropical forests. Ecol. Appl. 30, e02054. doi: 10.1002/eap.2054
Murtagh, F., and Legendre, P. (2014). Ward's Hierarchical Agglomerative Clustering Method: Which Algorithms Implement Ward's Criterion?. J Classif 31, 274–295. doi: 10.1007/s00357-014-9161-z
Oksanen, J., Guillaume Blanchet, F., Friendly, M., Kindt, R., Legendre, P., Dan McGlinn Minchin, P. R., et al. (2020). vegan:Community Ecology Package. R package version 2.5–7.
Potts, S., and Willmer, P. (1997). Abiotic and biotic factors influencing nest-site selection by Halictus rubicundus, a ground-nesting Halictine bee. Ecol. Entomol. 22, 319–328. doi: 10.1046/j.1365-2311.1997.00071.x
Potts, S. G., and Willmer, P. (1998). Compact housing in built-up areas: Spatial patterning of nests in aggregations of a ground-nesting bee. Ecol. Entomol. 23, 427–432. doi: 10.1046/j.1365-2311.1998.00160.x
R Core Team (2022). R: A Language and Environment for Statistical Computing. Vienna, Austria: R Foundation for Statistical Computing. Available online at: https://www.R-project.org/
Rightmyer, M., Deyrup, M., Ascher, J., and Griswold, T. (2011). Osmia species (Hymenoptera, Megachilidae) from the southeastern United States with modified facial hairs: taxonomy, host plants, and conservation status. Zookeys 148, 257–278. doi: 10.3897/zookeys.148.1497
Roulston, T. H., Smith, S. A., and Brewster, A. L. (2007). A comparison of pan trap and intensive net sampling techniques for documenting bee (Hymenopea: Apiformes) fauna. J. Kansas Entomol. Soc. 80, 179–181. doi: 10.2317/0022-8567(2007)80[179:ACOPTA]2.0.CO;2
Rozen, J. G., and Go, H. H. (2015). Descriptions of the egg and mature larva of the bee Chelostoma prochelostoma philadelphi with additional notes on nesting biology (Hymenoptera: Megachilidae: Megachilinae: Osmiini). Am. Museum Novitates 1–8, 8. doi: 10.1206/3844.1
Shinn, A. (1967). A revision of the bee genus Calliopsis and the biology and ecology of C. andreniformis (Hymenoptera, Andrenidae). Univ. Kansas Sci. Bull. 46, 753–936. doi: 10.5962/bhl.part.20081
Sirohi, M. H., Jackson, J., Edwards, M., and Ollerton, J. (2015). Diversity and abundance of solitary and primitively eusocial bees in an urban centre: a case study from Northampton. J. Insect Conserv. 19, 487–500. doi: 10.1007/s10841-015-9769-2
Smith, C., Harrison, T., Gardner, J., and Winfree, R. (2021). Forest-associated bee species persist amidst forest loss and regrowth in eastern North America. Biol. Conserv. 260, 109202. doi: 10.1016/j.biocon.2021.109202
Stockhammer, K. A. (1967). Notes on the biology of the blue sweat bee, Lasioglossum coeruleum (Apoidea:Halictidae). J. Kansas Entomol. Soc. 40, 177–189.
Taki, H., Kevan, P. G., and Ascher, J. S. (2007). Landscape effects of forest loss in a pollination system. Landsc. Ecol. 22, 1575–1587. doi: 10.1007/s10980-007-9153-z
Ulyshen, M., Urban-Mead, K. R., Dorey, J. B., and Rivers, J. W. (2023). Forests are critically important to global pollinator diversity and enhance pollination in adjacent crops. Biol. Rev. 91, 796–812. doi: 10.1111/brv.12947
Violle, C., Navas, M.-L., Vile, D., Kazakou, E., Fortunel, C., Hummel, I., et al. (2007). Let the concept of trait be functional! Oikos 116, 882–892. doi: 10.1111/j.0030-1299.2007.15559.x
Watson, J. C., Wolf, A. T., and Ascher, J. S. (2011). Forested landscapes promote richness and abundance of native bees (Hymenoptera: Apoidea: Anthophila) in Wisconsin apple orchards. Environ. Entomol. 40, 621–632. doi: 10.1603/EN10231
Wenzel, A., Grass, I., Belavadi, V. V., and Tscharntke, T. (2020). How urbanization is driving pollinator diversity and pollination – a systematic review. Biol. Conserv. 241, 108321. doi: 10.1016/j.biocon.2019.108321
Wilson, C. J., and Jamieson, M. A. (2019). The effects of urbanization on bee communities depends on floral resource availability and bee functional traits. PLoS ONE 14, e0225852. doi: 10.1371/journal.pone.0225852
Wilson, J. S., and Carril, O. M. (2016). The Bees in Your Backyard: A Guide to North America's Bees. Princeton, NJ: Princeton University Press.
Keywords: pollinators, bees, functional groups, forest, urban, land cover types, diversity
Citation: Braman CA, McCarty E, Ulyshen MD, Janvier AJ, Traylor C, Edelkind-Vealey M and Braman SK (2023) Urban bee functional groups response to landscape context in the Southeastern US. Front. Sustain. Cities 5:1192588. doi: 10.3389/frsc.2023.1192588
Received: 23 March 2023; Accepted: 17 April 2023;
Published: 05 May 2023.
Edited by:
Léo Correia da Rocha-Filho, Federal University of Uberlandia, BrazilReviewed by:
Hanna Honchar, Institute for Evolutionary Ecology NAS of Ukraine, UkraineCaleb J. Wilson, Michigan State University, United States
Copyright © 2023 Braman, McCarty, Ulyshen, Janvier, Traylor, Edelkind-Vealey and Braman. This is an open-access article distributed under the terms of the Creative Commons Attribution License (CC BY). The use, distribution or reproduction in other forums is permitted, provided the original author(s) and the copyright owner(s) are credited and that the original publication in this journal is cited, in accordance with accepted academic practice. No use, distribution or reproduction is permitted which does not comply with these terms.
*Correspondence: S. Kristine Braman, a2JyYW1hbkB1Z2EuZWR1
 Charles A. Braman
 Elizabeth McCarty2
 Michael D. Ulyshen
 S. Kristine Braman