 Julian Scott Yeomans
 Mariia Kozlova
95% of researchers rate our articles as excellent or good
Learn more about the work of our research integrity team to safeguard the quality of each article we publish.
Find out more
ORIGINAL RESEARCH article
Front. Sustain. Cities , 03 March 2023
Sec. Urban Resource Management
Volume 5 - 2023 | https://doi.org/10.3389/frsc.2023.1129316
This article is part of the Research Topic Towards Resilient Cities: Integrated Urban Planning for Sustainable Environments View all 8 articles
Urban planning often involves decision-making under highly uncertain circumstances. System dynamics and multi-agent modeling frameworks are commonly employed to model the social phenomena in this type of urban planning. However, because the outputs from these approaches are regularly characterized as a function of time, the majority of studies in this modeling domain lack appropriate sensitivity analysis. Consequently, important insights into model behavior are frequently overlooked. Monte Carlo simulation has been used to incorporate uncertain features in urban planning with the outputs displayed as probability distributions. Recently simulation decomposition (SimDec) has been used to enhance the visualization of the cause-effect relationships of multi-variable combinations of inputs on the corresponding simulated outputs. SimDec maps each output value of a Monte Carlo simulation on to the multivariable groups of inputs or scenarios from which it originated. By visually projecting the subdivided scenarios onto the overall output, SimDec can reveal previously unidentified influences between the various combinations of inputs on to the outputs. SimDec can be generalized to any Monte Carlo method with insignificant computational overhead and is, therefore, extendable to any simulated urban planning analysis. This study demonstrates the efficacy of adapting SimDec for the sensitivity analysis of urban dynamics modeling on a paradigmatic simplified version of Forrester's Urban Dynamics- URBAN1 model. SimDec reveals complexities in model behavior that are not, and can not be, captured by standard sensitivity analysis methods and highlights, in particular, the intricate joint effect of immigration and outmigration on system development.
Urban planning problems frequently require the need for decision-making in situations containing considerable sources of uncertainty (Barone et al., 2022; Castellarini, 2022). Public policies have often failed to achieve their intended results because of the complexity of both their environment and the actual policy-making process (Saltelli et al., 2004, 2021; Ghaffarzadegan et al., 2011; Hubbard, 2020; Razavi et al., 2021). While new urban improvement legislation is often debated and enacted with great hype and hope, the implementation of many programs frequently proves to be ineffective (Saltelli et al., 2004; Ghaffarzadegan et al., 2011) with the actual results often falling disappointingly short of prior expectations (Saltelli et al., 2008). Orderly processes in creating human judgment and intuition lead people to wrong decisions when faced with complex and highly interacting systems (Ghaffarzadegan et al., 2011). Public sentiment trends toward increasing frustration with the planning process as repeated attacks on the deficiencies inherent within social programs inevitably leads to ever-worsening symptoms (Forrester, 1969, 1971; Saltelli et al., 2008; Ghaffarzadegan et al., 2011; Zhu et al., 2022). Because the dynamic behavior within complex social systems is not well understood, it is often observed that government programs cause the polar opposite of their desired results (Haag et al., 2022; Zhu et al., 2022). Until a much better public understanding of social systems is attained, any attempts to develop corrective programs that counteract social predicaments will continue to be disappointing (Forrester, 1971; Razavi et al., 2021; Saltelli et al., 2021). Fundamental conditions frequently underlie the reasons why policy-makers continue to misjudge the behavior of social systems and the field of system dynamics can be used to determine how such contrary circumstances can be circumvented (Saltelli et al., 2008, 2010; Kim et al., 2022).
Urban Dynamics remains a classic instance of system dynamics successfully applied to an important public policy problem (Ghaffarzadegan et al., 2011; Barone et al., 2022; Castellarini, 2022). Many social phenomena in this category of urban planning are modeled within system dynamics and/or multi-agent modeling frameworks (Saltelli et al., 2008; Razavi et al., 2021; Kim et al., 2022). These approaches are commonly characterized by outputs in the form of a function of time. However, because standard sensitivity analysis techniques require the outputs to be scalar for the significance measures to be calculated, the majority of studies in this modeling domain lack sensitivity analysis and, consequently, important insights into model behavior (Saltelli et al., 2021; Haag et al., 2022; Kim et al., 2022; Kozlova and Yeomans, 2022). Monte Carlo simulation methods have been used in a wide array of urban planning settings to incorporate the simultaneous impacts and complex interactions of uncertain features including the time dimension (Ghaffarzadegan et al., 2011; Barone et al., 2022). Simulation-generated outputs are commonly displayed as probability distributions rather than scalar point estimates (Deviatkin et al., 2021). Furthermore, a small version of a systems dynamics model can help to build and communicate insights regarding the deeply complex relationships within urban systems, while preserving many of the central lessons that a more disaggregated model would contribute (Ghaffarzadegan et al., 2011).
Recently an exploratory data analysis approach referred to as Simulation Decomposition (SimDec) has been introduced that extends Monte Carlo analysis by enhancing the explanatory power of the cause-effect relationships between multi-variable combinations of inputs on the corresponding simulated outputs (Kozlova and Yeomans, 2019, 2022). SimDec partitions sub-distributions of the Monte Carlo outputs by pre-classifying selected input variables into user-defined states, grouping combinations of these states into scenarios, and then collecting simulated outputs attributable to each multi-variable input scenario. Since it is a straightforward task to visually project the contribution of the subdivided scenarios onto the overall output, SimDec can reveal previously unidentified connections between these multi-variable combinations of inputs on the outputs. SimDec is generalizable to any Monte Carlo model with negligible additional computational overhead and, hence, can be readily used for decision-making in situations containing considerable sources of uncertainty, such as multi-dimensional urban planning systems situations possessing considerable stochastic uncertainty (Kozlova and Yeomans, 2019). Consequently, this research study illustrates how the SimDec exploratory analytical approach can be easily incorporated and extended into the sensitivity assessment process of urban planning systems analysis.
SimDec, in essence, is an extension of Monte Carlo simulation that maps user-specified, multi-variable combinations of input variables onto resulting distributions of output variables (Kozlova and Yeomans, 2020). This visual analytics approach enables the consequences of combinations of different initial states to become visualizable to decision-makers in a straightforward manner (Kozlova and Yeomans, 2021). As the initial states represent different risks or different measures, SimDec readily produces actionable insights that support decision-making. It is these visual analytics proficiencies that contribute substantial benefits to SimDec's practical decision-support capabilities in “real world” circumstances. While SimDec has never been employed in urban systems dynamics analysis, the approach has previously been applied to several environmental systems including CO2-emission analysis (Deviatkin et al., 2021), carbon capture and storage investment incentives (Kozlova and Yeomans, 2019), water pollution from agricultural fertilizer run-off (Raul et al., 2022), aviation electrification projections (Kozlova et al., 2022), domino-like cascading effects in systemic risk planning (Kozlova and Yeomans, 2022), and renewable energy investment strategies (Kozlova and Yeomans, 2020). An open access prototype of SimDec software is accessible via Kozlova and Yeomans (2020) (or https://github.com/gnopik/simdec_excel).
Monte Carlo simulation is a well-established technique for assessing the risk in such dynamic systems (Lehar, 2005; Huang et al., 2009; Teply and Klinger, 2015) and has been comprehensively used for assessing impacts in urban dynamics (for example, see: Barone et al., 2022; Castellarini, 2022). Ghaffarzadegan et al. (2011) have strongly advocated for the use of intuitive system dynamics models for policy-making in urban planning and have used the URBAN1 simulation model of Forrester (1969, 1971) extensively for this task. Given the fact that SimDec analysis provides a relatively straightforward extension to Monte Carlo methods, the complexity of any underlying models is not an impediment to its adoption. In fact, the more non-linear and/or complex the underlying models are, the more comprehensive the contributed SimDec insights have tended to be (Kozlova and Yeomans, 2022). Consequently, the chief goal of this particular study is to demonstrate the efficacy of adapting SimDec into the sensitivity analysis of urban system dynamics modeling, via URBAN1, as a means to advance the overall planning process.
The SimDec algorithm is an innovative, visual analytics approach that extends a Monte Carlo simulation analysis by exposing hidden interactions and relationships inherent within the underlying system (Kozlova and Yeomans, 2020). To achieve this visualization, SimDec decomposes a simulated output distribution by clustering selected input variables into states, constructing a collectively exhaustive list of the multi-variable combinations of these states, and then projecting the resulting partitions of these input states onto the output distribution (Kozlova and Yeomans, 2019, 2022; Deviatkin et al., 2021). As a consequence of the algorithm, one can observe the overall output distribution, as in the classical Monte Carlo simulation, together with the simultaneous projections of the various partitions onto this distribution (Kozlova and Yeomans, 2021, 2022). SimDec eliminates the need for multiple simulation runs by noting the input variable values that generate each output of interest during a single simulation run and by then creating the partitions according to the user-designed states of input variables. Consequently, the additional overhead requirements of the algorithm are computationally insignificant (Kozlova and Yeomans, 2021). The states are displayed by employing different color gradations during the visual analytics stage. In particular, the most influential variable partitions are allocated different base color schemes, while all supplementary states are color-coded according to different gradations of this basic color to facilitate the consistency of overriding human perception and to preserve visual acuity (Kozlova and Yeomans, 2020, 2022). By visually displaying segmented multivariable groups as partitions of the output variable, SimDec can intuitively expose various interactions and non-linearities previously concealed within the model variables, which frequently leads to the detection of unforeseen relationships (Kozlova and Yeomans, 2020, 2022).
The algorithmic steps of SimDec are as follows (detailed explanations can be found in: Deviatkin et al., 2021; Kozlova et al., 2022), and the flowchart of these steps is presented in Kozlova and Yeomans (2019):
Step 1: For the decomposition analysis, identify a subset of key variables from all of the input variables in the model.
Step 2: Establish relevant partitions for each key variable identified in Step 1 (e.g., pessimistic, most-likely, optimistic; low, medium, high).
Step 3: Specify appropriate numerical values that designate the boundaries of each partition. For each variable, the resulting boundary ranges of the partitions must be mutually exclusive and collectively exhaustive.
Step 4: Determine every possible combination of partitions for the key input variables. Each combination of variable partitions corresponds to a multivariable state (For example, one such 2-variable state combination of partitions could be: X1 pessimistic and X2 high).
Step 5: While the simulation runs, record the values of the input and output variables for each iteration. Then map the inputs of each iteration to a corresponding state based on the partition combinations enumerated in Step 4.
Step 6: Construct a probability distribution chart for each output measured and color-code the figure based upon the identified states created by the partition combinations.
A seminal work in system dynamics applied to public policy is Forrester's Urban Dynamics (1969). The initial urban dynamics studies focused on many of the problems that plagued (and continue to plague) American inner cities, including joblessness, low social mobility, poor schools, and traffic congestion (Forrester, 1969, 1971). The goal of these studies was to understand the root causes of urban decay, to evaluate existing policy responses, and to generate discussion regarding what form more successful policies needed to take. At its core, urban dynamics captures the interactions between the housing, business, and population sectors of an urban system. The field of urban dynamics represents a successful application of classical system dynamics to an area of important public policy.
At its inception, urban dynamics represented a highly controversial approach and generated considerable public debate. Forrester (1971) argued that the use of computerized system models to inform social policy should supercede the more normal anecdotal observations arising in public debates, both for generating insight into the root causes of problems and for understanding the likely effects of any proposed solutions. Even small computational models could be used to help build and communicate insights regarding the complex nature of systems, while preserving many of the central lessons that more disaggregated models can bring. Therefore, the system dynamics community needs to do more to help policymakers incorporate the use of system dynamics models into the overall policy-making process.
Given the complexity of many policy environments, experimentation is essential for the design of effective policies. Ghaffarzadegan et al. (2011) have advocated for the use of relatively simple, intuitive urban dynamics models for policy-making. Ghaffarzadegan et al. (2011) claimed that intuitively represented computational models are of fundamental importance for policymakers, because they create a veritable playground in which decision-makers can experiment with different policy trials without incurring actual economic and social consequences. They also propose that an “exhaustive experimentation” be performed by policymakers. An understanding of the main feedback structure of a system, as provided by a small system dynamics model, is essential to effective policy design. Simulation models provide learning environments where modelers, policymakers, and others can experiment and learn about the impacts of different policies without incurring any significant social and economic costs. By detecting potentially counterintuitive behaviors of strategies to the policymakers, simulation models can foster consensus surrounding difficult policy options. Even when different goals and value systems persist, the outputs from simulations can help to identify the specific variables and outcomes that are the source of divergence.
The URBAN1 simulation model is a simplified version of Forrester (1969, 1971) adapted by Alfeld and Graham (1976). The major strength of the URBAN1 model is its ability to concisely capture how the feedback structure of an urban system can endogenously generate stagnation and then decay. In addition to providing insight into the causes of urban decay, the URBAN1 model can also help policymakers design policies to improve decaying cities or prevent stagnation in urban areas that are still growing. To solve the problem of urban stagnation and decay, Forrester (1969, 1971) recommended policies that increase business structures and reduce the stock of available housing, thereby balancing any change to overall attractiveness. In the URBAN1 model, such policies can be tested by adding a zoning system to the model that reserves land for business structures as needed to support the population. Only by examining such a policy in light of the full set of relationships between housing, population, and business structures can policymakers hope to have success (Saltelli et al., 2020).
The fundamental insight of urban dynamics, preserved in URBAN1, is that the total attractiveness of an urban region must be considered relative to the attractiveness of all surrounding regions (Forrester, 1971). The original, “full” model was considerably disaggregated and contained at least nine major stock variables (Alfeld and Graham, 1976). Specifically, housing and business structures were disaggregated by age, and the population was disaggregated into managerial-professional, labor, and underemployed groups. Much of the analysis and some of the key insights from the original model depended upon this high level of disaggregation. Nevertheless, the URBAN1 version captures the most essential lessons for policymakers, and at a level of detail that is more conducive to developing insight and building intuition regarding the complex nature of urban systems. Its behavior accurately reflects the experience of many real-world cities. A second key insight is that the urban decay phases emanate from natural asymmetries in the dynamics of business structures and housing. Housing in URBAN1 is assumed to last longer, and to be easier to construct, in an already built-up city characterized by high population densities and existing essential urban infrastructure. If the differences between housing and business structures are eliminated, urban decay is not a consequence in URBAN1 (although unemployment still rises). This insight, suggesting urban renewal policies that shift the bias away from non-job-generating sectors (e.g., housing) to job-generating sectors, is straightforwardly observable in URBAN1, but essentially impossible to detect in the full model.
This paper employs the publicly available URBAN1 simulation model, taken from Ghaffarzadegan et al. (2011). The mechanics of the model and its visualization in the standard system dynamics stock-and-flow framework can be found in their article or its online version can be accessed via the link https://insightmaker.com/insight/7uuxZvbJRGoutDJEpTZyaL/Urban-Dynamics. However, even this simplified version contains 20 scalar input variables, with an additional eight variables represented as functions of the other inputs (e.g., ‘Effect of land availability on New Construction’), and it is further possible to fine-tune the parameters. The technical details of the model inputs are presented in Table 1. The initial values of input variables correspond to those in Ghaffarzadegan et al. (2011). These values do not represent any specific geographic area, but constitute a generic hypothetical urban system designed for the purpose of studying urban decay.

Table 1. The technical details of input parameters of the URBAN1 system dynamics model.
Such richness in the mix of input parameters creates endless combinatorial possibilities for examining different trials and/or scenarios. Faced with so many possibilities, the natural questions to address in order to better inform policy-making are: (i) Which input variables are most influential; (ii) Which policy scenarios need to be considered; and, (iii) Which combinations of which factors can change the situation for better or worse? The subsequent section will show how SimDec can be employed in conjunction with the URBAN1 simulation model to examine these types of questions.
As a means to extend the scope of an urban planning process, this section demonstrates the efficacy of employing SimDec when conducting a sensitivity analysis on the URBAN1 system dynamics simulation model. Faced with some of the underlying complexity of URBAN1, in order to appropriately scope this study, all base case input values correspond to those taken directly from Ghaffarzadegan et al. (2011). Normally the six main outcomes for the model are: (i) Population, (ii) Housing-capacity, (iii) Jobs, (iv) Land-fraction-occupied, (v) Households-to-housing ratio, and (vi) Labor-force-to-job ratio. The first three are so-called stock variables (or integrals) of the corresponding flows over time. The last three are ratios reflecting the state of the system—ratios exceeding the value of one represent a deficit, while values lower than one indicate unused abundance. All six variables are time-dependent and are usually displayed graphically as functions of time to illustrate the dynamics of the system. For the purposes of sensitivity analysis, however, the outcomes need to be scalar (Saltelli et al., 2004; Razavi et al., 2021). Therefore, in order to both focus on the final state of the system and to avoid potential ambiguity due to possible oscillations, the actual outputs used in this study correspond to the average variable values over the last four periods of the model (years 97–100). In order to highlight the contributions that the SimDec approach brings to sensitivity analysis, for brevity, only the Population and Labor-force-to-job ratio outcomes are analyzed.
The URBAN1 model is initially run without any policy interventions and simply checked to display its behavioral characteristics under different assumptions. For this illustration, variation in the following three input variables is considered: (i) Initial-Business-Structures, (ii) Initial-Population, and (iii) Initial-Housing. For each of the variables, Table 2 provides the underlying parameter values, their corresponding distributional assumptions, and the numerical partitioning of the input distributions into user-specified states.

Table 2. Input parameters configuration for the base case sensitivity analysis.
The URBAN1 model is simulated 10,000 times and the resulting distribution of Population at the end of the timespan is presented in Figure 1. Ten thousand iterations are deemed more than sufficient to both capture the strength of the effects even numerically (Marzban and Lahmer, 2016) and, for the purposes of visualization, to provide a smooth and detailed histogram well suited for the purposes of visually examining the behavior of the effects (Kozlova and Yeomans, 2021). This initial simulation experiment could be viewed as a general study of the dynamics of urban populations in different cities. A “classic” Monte Carlo simulation would produce an output distribution possessing the overall shape as shown in Figure 1, but displayed using only a single color. However, in a SimDec analysis, the overall distribution is further broken down, or decomposed, into non-overlapping scenarios of input variable combinations that are stacked on top of each other in the figure. The visualized interpretation of the SimDec breakdown into attributes of the entire output dataset can be clarified using the histogram's legend. The legend assigns color-shaded gradations to specific state combinations of the input variables, while also identifying each combination by assigning corresponding scenario indices to them. Specifically, with three variables each partitioned into two states, there are eight possible combinations of the input variable states in total. Each of these eight combinations is considered a scenario and designated as Sc1, Sc2, …, Sc8, respectively. For example, the sixth scenario, Sc6, corresponds to instances in which the simulated input values of Initial-Housing variable fall into the high partition range, the values of the Initial-Population variable are generated in their low partition range, and the value of Initial-Business-Structures is in the high partition range. Furthermore, to convey additional analytical information, the (i) minimum, (ii) mean, and (iii) maximum values of the output are computed for each scenario. Clearly, the minimum and maximum values correspond to the extreme edges of each scenario's colored distribution on the horizontal axis within the histogram and provide a numerically convenient, ancillary interpretation to the figure.
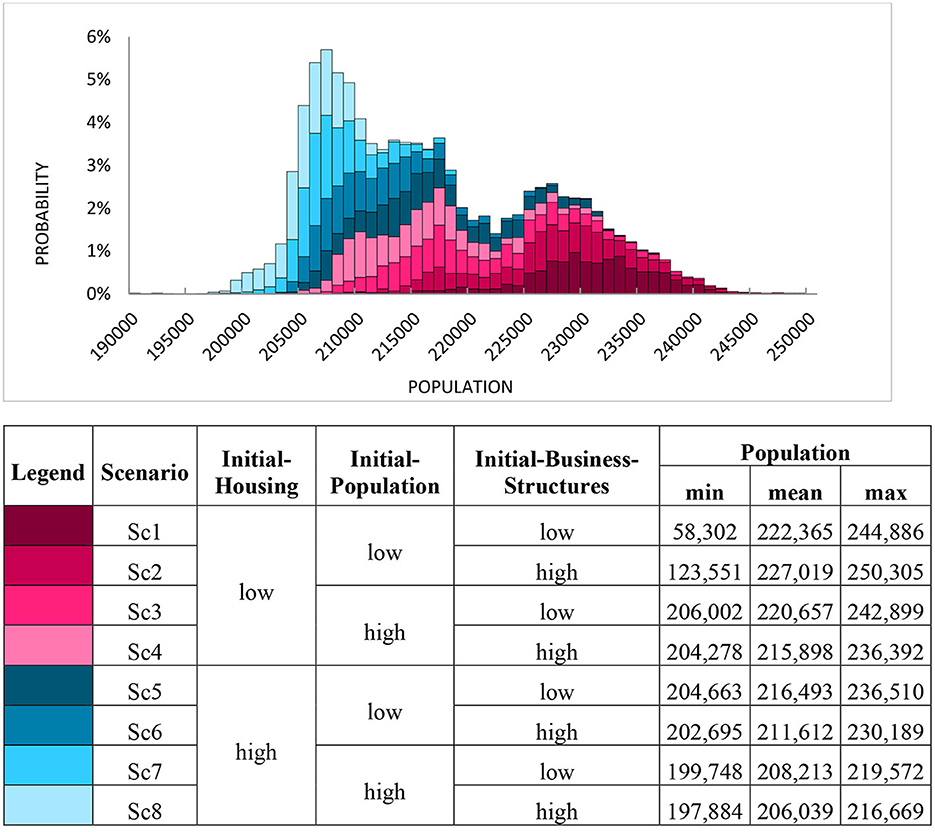
Figure 1. Simulation decomposition of population (average of years 97–100) by initial-housing, initial-population, and initial-business-structures. For illustrative convenience, the figure displays only 99% of data, because the remaining 1% of a tail belonging to Sc1 and Sc2 have very low minimum values. For details on input parameters refer to Table 2.
A general pattern that emerges from the visual decomposition of Figure 1 is that lower initial states—especially low Housing values-lead to a much more aggressive growth in the Population. However, those same lower states (Sc1 and Sc2) can actually lead to a decay of the system with very low probabilities of occurrence (namely, the 1% tail omitted from the graph). Conversely, the higher initial states of the system generally lead to a lower, but more stable, total population.
Following on from the Population decomposition, it would be similarly interesting to evaluate the state of the urban system assessed on an employment basis. Figure 2 provides a decomposition of the Labor-Force-to-Jobs ratio at the end of the timespan (average of years 97–100) using the same input factors as above. Ratio values higher than one (the major part of the histogram of Figure 2 to the right from 1 on the X-axis) represent situations in which the labor force exceeds the number of available jobs (i.e., unemployment). The entire portion of histogram displayed (showing 98% of the data) shows values exceeding one, thereby indicating that all scenarios lead to some degree of unemployment. Furthermore, the maximum values of each respective scenario are all equally high (1.20). This finding implies that no matter what initial parameters the system starts from, the rules of dynamics dictate that, in the worst case, the system can end with same bad unemployment outcome. Moreover, only certain low-state scenarios (Sc1–Sc3) can actually produce any employment ratios lower than 1. These low-state outliers are analogous to the ones in Figure 1 in which the system deteriorates into a condition of relative decline.
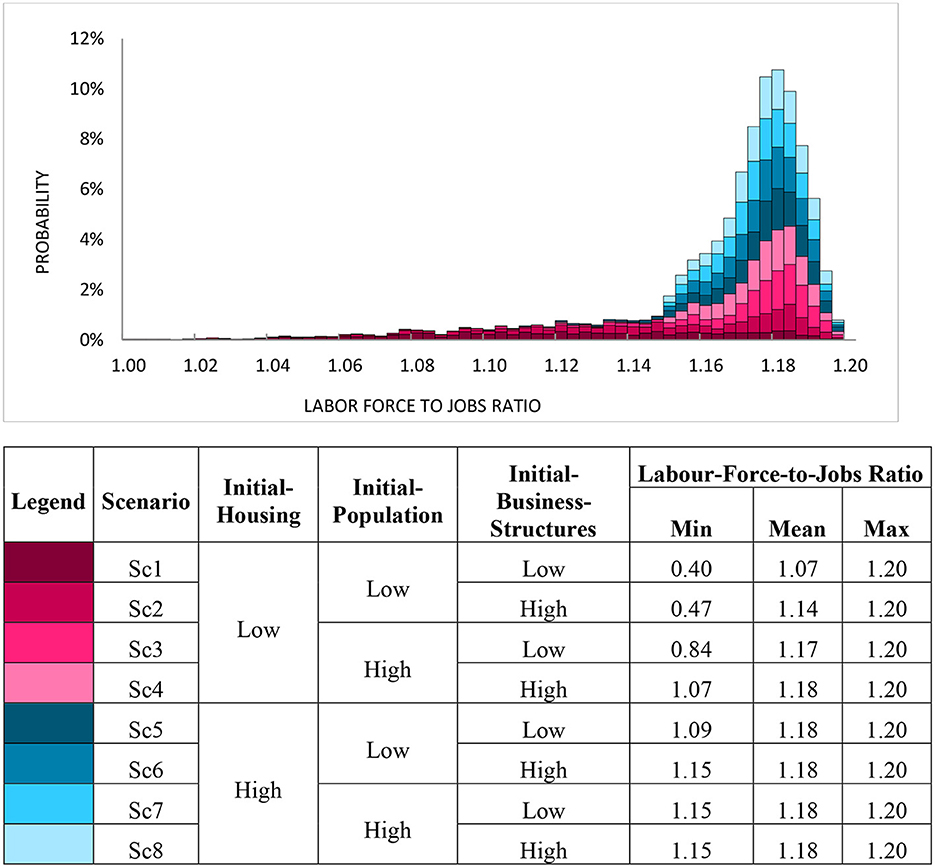
Figure 2. Simulation decomposition of labor-force-to-jobs ratio (average of years 97–100) by initial-housing, initial-population and initial-business-structures. For illustrative convenience only 98% of data is presented, because 2% of tail belonging to Sc1, Sc2, and Sc3 have low minimum values. For details on input parameters refer to Table 2.
In general, Figure 1 is indicative of a situation where the model outcome (in this case Population) depends significantly on the combination of input factors (or scenarios). This condition is visualizable in SimDec when the scenarios appear shifted against each other with relatively distinct vertical color delineations along the horizontal axis. Figure 2 portrays an alternative visualization in which the outcome (in this case the Labor-Force-to-Jobs Ratio) does not significantly depend on the specific scenarios (in essence, the colored scenarios are stacked relatively proportionately one on top of the other).
Because all social systems are faced with inherent uncertainty, understanding how this uncertainty can actually impact the system is of critical importance prior to the introduction of any policies. While in this subsequent analysis the input assumptions on the initial size of the system are fixed, the systems risks will be evaluated with respect to variation in the flows of people. Table 3 provides the underlying input parameter values for the rates of (i) Immigration and (ii) Outmigration, plus their corresponding distributional assumptions and state partitionings.

Table 3. Input parameters configuration for the uncertainty effects estimation.
As in the initial case, the URBAN1 model is simulated 10,000 times and the resulting distribution of Population is shown in Figure 3. The distribution of the resulting Population tends to possess numerous distinct centers of gravity. Due to the nature of the very large distributional spike on the left, most of the remaining histogram data appears to have been compressed along the X-axis. To counteract the relative visual appearance of this distortion, two additional separate sub-sections have been added that actually display 31 and 43% of the overall graph data, respectively. These supplementary figures illustrate the very high degree of non-linearity contained within the system model. One cluster clearly occurs around 0 (implying a total collapse of the Population system) and three larger peak accumulations occur within the range of 150,000 and 250,000 people.
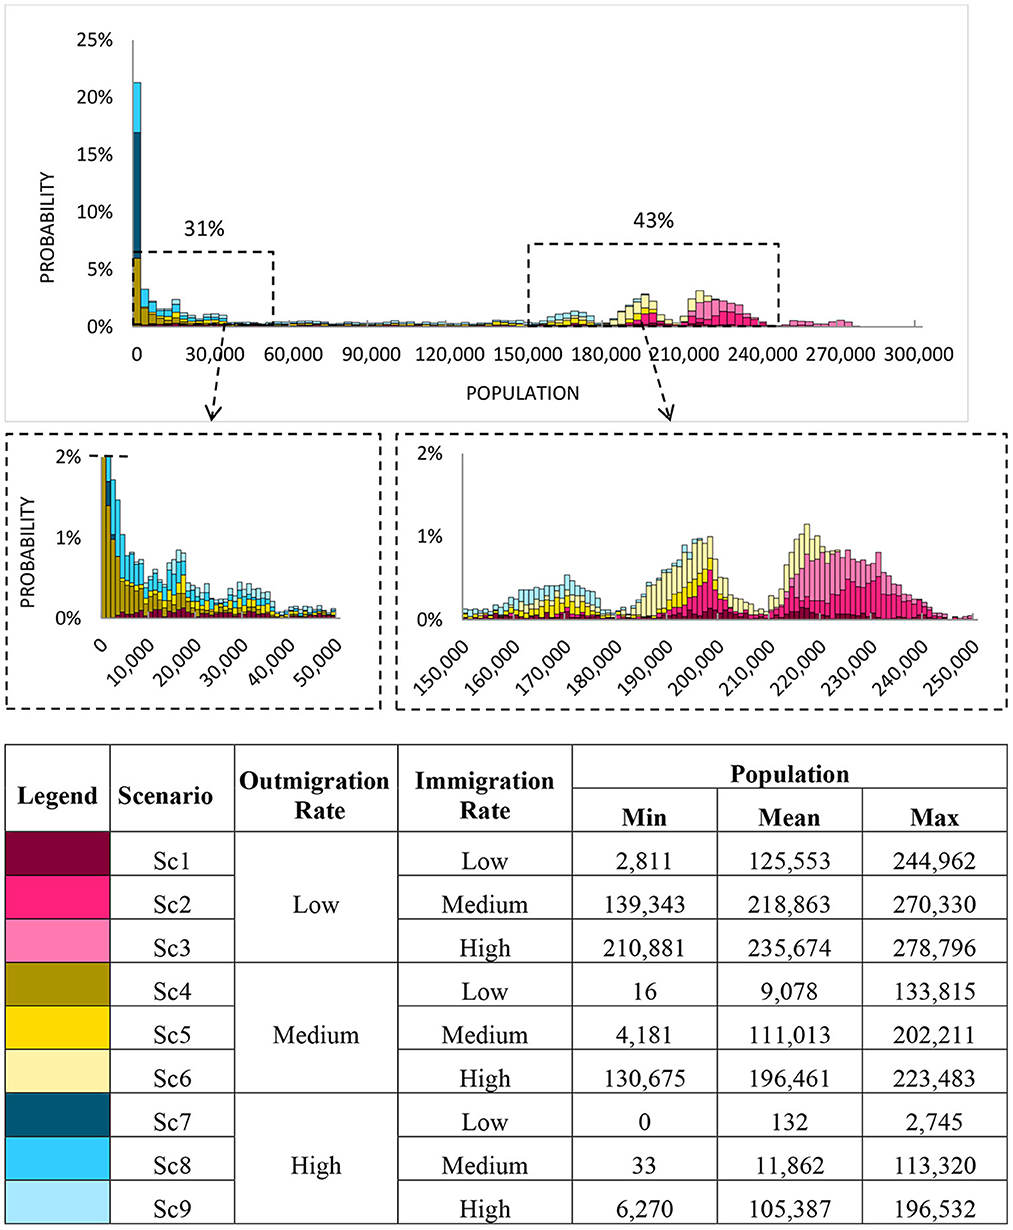
Figure 3. Simulation decomposition of population (average of years 97–100) by outmigration and immigration rates. For details on input parameters refer to Table 3.
To better interpret the causes of this non-linear complexity, the model is re-simulated and decomposed twice more: each time holding one variable at its base case value while simulating values of the other variable over its distributional range. The pair of single-variable decompositions for these two additional simulation runs are presented in Figures 4, 5.
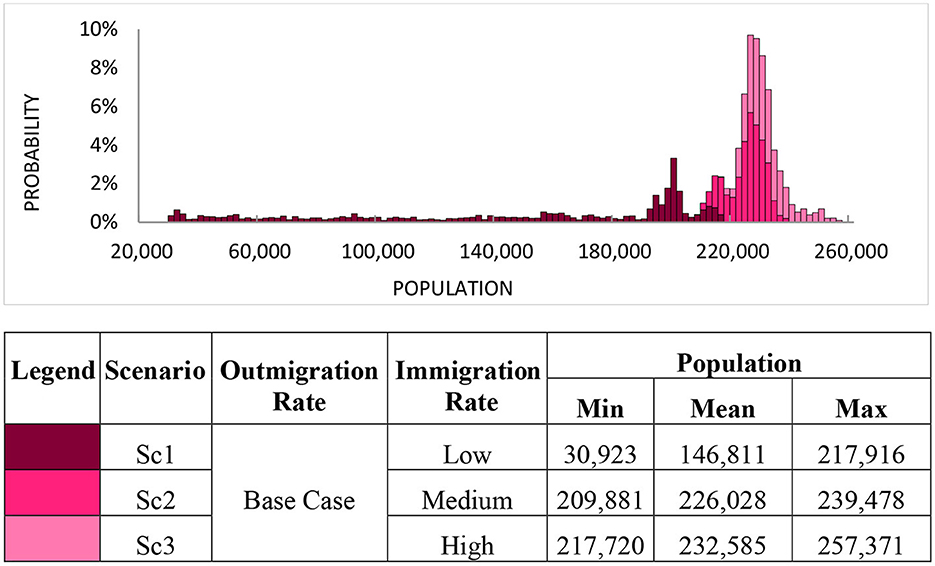
Figure 4. Simulation decomposition of population (average of years 97–100) by immigration rates when outmigration rate is fixed.
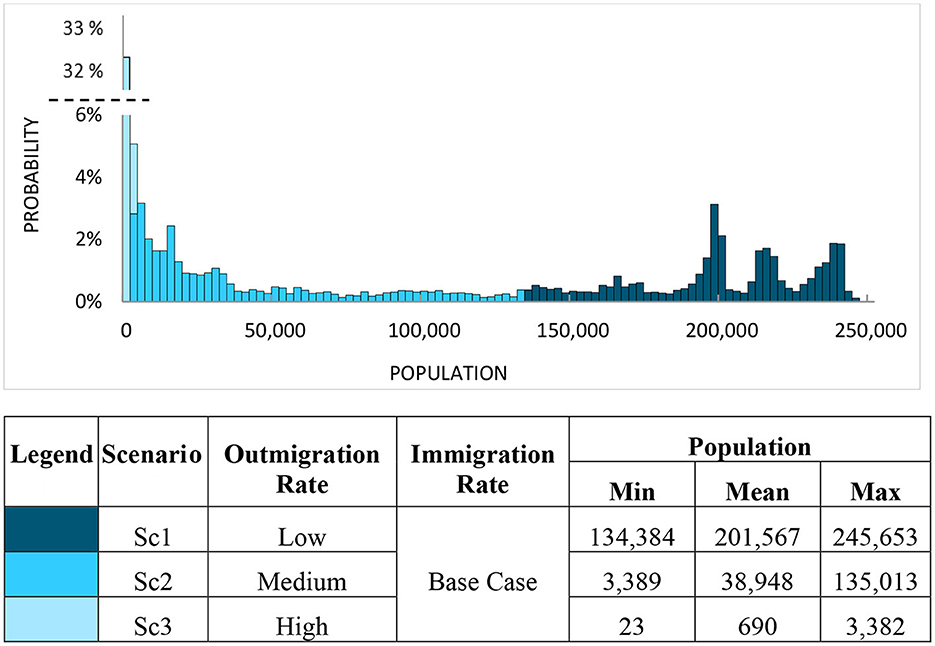
Figure 5. Simulation decomposition of population (average of years 97–100) by outmigration rates when immigration rate is fixed.
The individual effect of these two inputs leads to a range of outcome values that is comparable in scale (essentially all Population values fall between the range of 0 and 260,000 people). However, in Figure 5, it can be observed that the distribution is divided into three distinctly-separated scenarios possessing almost vertical delineation thresholds along the horizontal axis. Consequently, the visualization from Figures 4, 5 indicates that Outmigration impacts the Population distribution more significantly than Immigration. This observation is actually attributable to the fact that within the URBAN1 model dynamics, the Immigration rate is a consequence of several feedback loops, housing availability, and job availability. This particular linkage to other model components leads to the less pronounced effect of the Immigration rate on Population. Both Figures 4, 5 possess a complex distributional shape that is representative of the functional interlinking dynamics within the system. Thus, the rather complicated interaction of these two inputs shown in Figure 3 should not be considered a surprise. Together, Figures 3–5 constitute a solid basis for studying and understanding the uncertainty dynamics inherent in this complex urban system.
This section has demonstrated how a SimDec can be used to effectively conduct a comprehensive sensitivity analysis of an urban systems dynamics model. SimDec has been used to explore the underlying behavior of the model and can be used to develop the inherent design of the model. It can be used to expose the effects of multi-agent interventions in the model and to comprehensively garner a fundamental understanding of the impacts of uncertainty on the overall process. Conversely, the more common type of time-series graphical analysis using a single or limited number of scenarios could only ever present a crude simplification of the model's behavior range and would, therefore, lead to very poorly-informed, falsely over-confident decisions (Pianosi et al., 2016; Saltelli et al., 2020). While the SimDec approach has only been used to analyze the system impacts of a smaller subset of input variables and output measures of the URBAN1 model in this section, in order to conduct a complete and exhaustive sensitivity analysis, all parameters would need to be incorporated into the analysis. Such an exhaustive study would simply involve an extension of the SimDec analysis approach demonstrated here, by incorporating more of the input and output variables of the model.
In this paper, urban policymakers are encouraged to incorporate the systematic SimDec approach to conduct detailed sensitivity analyses of the most critical system variables, while simultaneously examining the whole spectrum of model impacts. It has been described how computational system modeling can prove crucial for effective urban policy formulation as this approach frequently provides a broader understanding of the likely impacts of proposed solutions and can contribute a wider gamut of insights into the underlying root causes of many potential issues.
It has been shown how the innovative SimDec analytical approach can be extended into the analysis of urban planning and can be effectively used to visually conduct a sensitivity analysis of an urban systems model. SimDec can be used to balance the interplay of the uncertain and the actionable in the sensitivity analysis of urban planning. The case example facilitated a visual analytical representation of urban sensitivity analysis. SimDec helped by systematically examining planned policy outcomes while conveniently visually displaying the enabling/constraining factors that need to be accounted for in effective urban policy design. Specifically, the sequence of SimDec visualizations demonstrated that Outmigration affects the Population more than Immigration, due to the resulting interplay of numerous feedback loops, housing availability, and job availability. The complicated interactions revealed between these two input variables contributes a significant component to comprehending the fundamental aspects of the system dynamics in this complex urban model.
The underlying nature of these factors becomes readily apparent when revealed in the visual analysis performed with SimDec. Urban planners could subsequently establish final policy conclusions by exploring the interlinked dynamics within the key variables used in the systems analysis. Consequently, based upon the outcomes illustrated by the example, one could strongly advocate for the usage of SimDec in the sensitivity analysis of urban systems, in general, due to: (i) its exceptional capacity to reveal concealed interdependencies when evaluating complex computer models; (ii) its facility for communicating numerous potentially unseen perceptions to policy-makers; (iii) its overall superior visualizable analytic proficiencies, and; (iv) its significantly lower computational complexities.
The original contributions presented in the study are included in the article/supplementary material, further inquiries can be directed to the corresponding author.
MK designed the original study, performed the data collection, and data analysis. JY drafted the article. All authors revised the manuscript and have read and approved the submitted version.
This research was supported in part by grant OGP0155871 from the Natural Sciences and Engineering Research Council and by funding from Business Finland, grant # 6713/31/2021.
The authors declare that the research was conducted in the absence of any commercial or financial relationships that could be construed as a potential conflict of interest.
All claims expressed in this article are solely those of the authors and do not necessarily represent those of their affiliated organizations, or those of the publisher, the editors and the reviewers. Any product that may be evaluated in this article, or claim that may be made by its manufacturer, is not guaranteed or endorsed by the publisher.
The authors would like to express their appreciation to the Editor and two reviewers for their numerous, helpful comments and suggestions.
Alfeld, L., and Graham, A. (1976). Introduction to Urban Dynamics. Productivity Press, Portland, OR.
Barone, G., Buonomano, A., Forzano, C., Giuzio Giovanni, F., and Palombo, A. (2022). Supporting the sustainable energy transition in the canary islands: simulation and optimization of multiple energy system layouts and economic scenarios. Front. Sust. Cities 3, 685525. doi: 10.3389/frsc.2021.685525
Castellarini, F. (2022). Urban agriculture in Latin America: a green culture beyond growing and feeding. Front. Sust. Cities 3, 792616. doi: 10.3389/frsc.2021.792616
Deviatkin, I., Kozlova, M., and Yeomans, J. S. (2021). Simulation decomposition for environmental sustainability: enhanced decision-making in carbon footprint analysis. Socioecon. Plann. Sci. 75, 1–10. doi: 10.1016/j.seps.2020.100837
Forrester, J. W. (1971). Counterintuitive behavior of social systems. Technol. Rev. 73, 52–68. doi: 10.1007/BF00148991
Ghaffarzadegan, N., Lyneis, J., and Richardson, G. P. (2011). How small system dynamics models can help the public policy process. Sys. Dynam. Rev. 27, 22–44. doi: 10.1002/sdr.442
Haag, F., Minarro, S., and Chennu, A. (2022). Which predictive uncertainty to resolve? Value of information sensitivity analysis for environmental decision models. Environ. Modell. Software 158, 105552. doi: 10.1016/j.envsoft.2022.105552
Huang, X., Zhou, H., and Zhu, H. (2009). A framework for assessing the systemic risk of major financial institutions. J. Bank. Finance 33, 2036–2049. doi: 10.1016/j.jbankfin.2009.05.017
Hubbard, D. W. (2020). The Failure of Risk Management: Why It's Broken and How to Fix It. West Sussex, England: John Wiley and Sons.
Kim, A., Mutel, C., and Froemelt, A. (2022). Robust high-dimensional screening. Environ. Modell. Software 148, 105270. doi: 10.1016/j.envsoft.2021.105270
Kozlova, M., Nykänen, T., and Yeomans, J. S. (2022). Technical advances in aviation electrification: enhancing strategic randd investment analysis through simulation decomposition. Sustainability 14, 414. doi: 10.3390/su14010414
Kozlova, M., and Yeomans, J. S. (2019). Multi-variable simulation decomposition in environmental planning: an application to carbon capture and storage. J. Environ. Inform. Lett. 1, 20–26. doi: 10.3808/jeil.201900003
Kozlova, M., and Yeomans, J. S. (2020). Monte Carlo enhancement via simulation decomposition: a “must-have” inclusion for many disciplines. INFORMS Transact. Edu. 13. doi: 10.1287/ited.2019.0240
Kozlova, M., and Yeomans, J. S. (2021). Visual analytics in environmental decision-making: a comparison of overlay charts versus simulation decomposition. J. Environ. Inform. Lett. 4, 93–100. doi: 10.3808/jeil.202000047
Kozlova, M., and Yeomans, J. S. (2022). Extending simulation decomposition analysis into systemic risk planning for domino-like cascading effects in environmental systems. J. Environ. Inform. Lett. 7, 64–68. doi: 10.3808/jeil.202200079
Lehar, A. (2005). Measuring systemic risk: a risk management approach. J. Bank. Fin. 29, 2577–2603. doi: 10.1016/j.jbankfin.2004.09.007
Marzban, S., and Lahmer, T. (2016). Conceptual implementation of the variance-based sensitivity analysis for the calculation of the first-order effects. J. Stat. Theory Pract. 10, 589–611. doi: 10.1080/15598608.2016.1207578
Pianosi, F., Beven, K., Freer, J., Hall, J. W., Rougier, J., Stephenson, D. B., et al. (2016). Sensitivity analysis of environmental models: a systematic review with practical workflow. Environ. Model. Software 79, 214–232. doi: 10.1016/j.envsoft.2016.02.008
Raul, V., Liu, Y. C., Leifsson, L., and Kaleita, A. (2022). Effects of weather on iowa nitrogen export estimated by simulation-based decomposition. Sustainability, 14, 1060. doi: 10.3390/su14031060
Razavi, S., Jakeman, A., Saltelli, A., Prieur, C., Iooss, B., Borgonovo, E., et al. (2021). The future of sensitivity analysis: an essential discipline. Environ. Model. Software 137, 104954. doi: 10.1016/j.envsoft.2020.104954
Saltelli, A., Annoni, P., Azzini, I., Campolongo, F., Ratto, M., and Tarantola, S. (2010). Variance based sensitivity analysis of model output. design and estimator for the total sensitivity index. Comp.Physics Commun. 181, 259–270. doi: 10.1016/j.cpc.2009.09.018
Saltelli, A., Bammer, G., Bruno, I., Charters, E., Di Fiore, M., Didier, E., et al. (2020). Five ways to ensure that models serve society: a manifesto. Nature 582, 482–484. doi: 10.1038/d41586-020-01812-9
Saltelli, A., Jakeman, A., Razavi, S., and Wu, Q. (2021). Sensitivity analysis: a discipline coming of age. Environ. Model. Software 146, 105226. doi: 10.1016/j.envsoft.2021.105226
Saltelli, A., Ratto, M., Andres, T., Campolongo, F., Cariboni, J., Gatelli, D., et al. (2008). Global Sensitivity Analysis: The Primer. West Sussex, England: John Wiley and Sons.
Saltelli, A., Tarantola, S., Campolongo, F., and Ratto, M. (2004). Sensitivity Analysis in Practice: A Guide to Assessing Scientific Models. West Sussex, England: John Wiley and Sons.
Teply, P., and Klinger, T. (2015). “Monte Carlo simulations: a case study of systemic risk modelling,” in The Second International Conference on Electrical, Electronics, Computer Engineering and their Applications (EECEA2015) (p. 43).
Keywords: simulation decomposition, Monte Carlo simulation, system dynamics, multi-agent modeling, urban planning under uncertainty, decision-making under uncertainty
Citation: Yeomans JS and Kozlova M (2023) Extending system dynamics modeling using simulation decomposition to improve the urban planning process. Front. Sustain. Cities 5:1129316. doi: 10.3389/frsc.2023.1129316
Received: 21 December 2022; Accepted: 15 February 2023;
Published: 03 March 2023.
Edited by:
Zoe Li, McMaster University, CanadaCopyright © 2023 Yeomans and Kozlova. This is an open-access article distributed under the terms of the Creative Commons Attribution License (CC BY). The use, distribution or reproduction in other forums is permitted, provided the original author(s) and the copyright owner(s) are credited and that the original publication in this journal is cited, in accordance with accepted academic practice. No use, distribution or reproduction is permitted which does not comply with these terms.
*Correspondence: Julian Scott Yeomans, c3llb21hbnNAeW9ya3UuY2E=
Disclaimer: All claims expressed in this article are solely those of the authors and do not necessarily represent those of their affiliated organizations, or those of the publisher, the editors and the reviewers. Any product that may be evaluated in this article or claim that may be made by its manufacturer is not guaranteed or endorsed by the publisher.
Research integrity at Frontiers
Learn more about the work of our research integrity team to safeguard the quality of each article we publish.