 Elizabeth R. Nachman
 Daniel A. Rodriguez
95% of researchers rate our articles as excellent or good
Learn more about the work of our research integrity team to safeguard the quality of each article we publish.
Find out more
ORIGINAL RESEARCH article
Front. Sustain. Cities , 14 July 2023
Sec. Urban Transportation Systems and Mobility
Volume 5 - 2023 | https://doi.org/10.3389/frsc.2023.1098473
Introduction: This study provides an evaluation of the impacts of classroom-based adult bicycle education on bicycling activity, confidence and competency self-perceptions while bicycling, knowledge of the bicycling rules of the road, and mode choice in a sample of residents of the San Francisco Bay Area in the US.
Methods: Changes were measured with self-administered surveys completed before and six weeks after the course intervention. Self-reported data were validated using objective data collected using the Ride Report app. We used multivariable regression analyses to examine changes in self-reported data over time.
Results: Participants reported statistically significant increases in confidence while bicycling in both traffic and car-free areas, feelings of safety while bicycling in car-free areas, and knowledge of the rules of the road. While there were significant changes in the proportion of trips by foot, transit and TNC, there was no change in the count of trips made by bicycle.
Discussion: Although overall changes in bicycling activity did not change, participants with initial low confidence increased bicycling activity and feelings of safety in traffic, compared to participants overall. Classroom-based bicycle education courses can improve bicycling confidence self-perception and increase knowledge of the bicycling rules of the road.
Shifting short trips from cars to more sustainable modes of transportation has been a goal of urban transportation planners in order to reduce emissions that contribute to the climate crisis. For example, the Caltrans Active Transportation plan identifies active transportation as playing “a vital role in California's goal to reduce (greenhouse gas) emissions and (vehicle miles traveled [VMT])” and continues: “Walking and bicycling also have many positive benefits associated with personal health, economic benefits, and sustainable and equitable development” (Caltrans, 2017). However, progress toward that goal is mixed. A study by Le et al. (2019) found bicycle use in the US has been increasing by 5 to 6 percent annually, but this rate of change was higher than was measured in the American Community Survey (ACS) between 2009–2017. In the San Francisco (SF) Bay Area, Caltrans District 4 had established a target to triple bicycling by 2020 from a 2010–12 baseline of 1.5 percent (Caltrans District 4, 2018); however, as of the 2021 ACS, bicycle commute mode share was between 0 and 2 percent for Bay Area counties.
Despite the renewed policy interest in bicycling, safety remains a concern. Dill and McNeil (2016) report that 60 percent of participants in a US nationally-representative survey reported being interested in bicycling, with fear of traffic among the top barriers to bicycling among non-users, a result that mirrors earlier national findings (US Department of Transportation Bureau of Transportation Statistics, 2003), as well as local findings in Oakland and Berkeley, CA (EMC Research, 2017).
Education is included as one of several strategies to improve safety and promote bicycle use in bicycle and active transportation plans across the SF Bay Area region (SF Municipal Transportation Agency, 2013; City of Berkeley, 2017; City of Pleasanton, 2018; City of Oakland Department of Transportation, 2019; City of Alameda, 2022).
Classroom-based courses teach rules of the road, bicycling best practices, and theoretical techniques and skills, while on-bicycle courses encourage participants to practice basic and advanced bicycle handling skills with and without traffic (League of American Bicyclists, 2018). Bicycle education training has been suggested as a way to “overcome skill, knowledge and confidence related barriers to cycling” (Rissel and Watkins, 2014) and has also been touted as a solution to increase bicycling rates (Johnson and Margolis, 2013) or increase “participant frequency and duration of cycling...for leisure or commuter cycling” (Telfer et al., 2006). Compared to building infrastructure, bicycle safety training can be a more cost-efficient measure to achieve these goals (Johnson and Margolis, 2013).
However, there is a lack of robust evidence suggesting that education classes increase riding frequency and safe riding habits (Carlin et al., 1998; Karsch et al., 2012). Existing research on the effects of adult bicycle education is predominantly limited to on-bicycle interventions; a comprehensive review of these studies and their outcomes can be found in Sersli et al. (2019). In summary, those studies have found a general increase in bicycling frequency and duration (Johnson and Margolis, 2013; Kloof et al., 2014; Rissel and Watkins, 2014; Transport for London, 2016; Schneider et al., 2018), an increase in overall physical activity (Telfer et al., 2006; Johnson and Margolis, 2013; Rissel and Watkins, 2014), mixed results about change in bicycle ownership (Johnson and Margolis, 2013; Kloof et al., 2014; Transport for London, 2016), and an increase in feelings of confidence, safety, and knowledge (Telfer et al., 2006; Zander et al., 2013; Kloof et al., 2014; Rissel and Watkins, 2014; Transport for London, 2016). A study focused on a combination of classroom-based and on-bicycle instruction found no lasting increases in bicycling among participants or effect of the program on confidence (Sersli et al., 2019).
By contrast, classroom-based bicycle education studies in youth have focused on changes in knowledge. A review concluded “there is a paucity of high quality research in the area of bicycle skills training programmes” (Richmond et al., 2014) and another states “there are few published studies of bicycle skills training, and little evidence is available to demonstrate whether such training does encourage more bicycling” (Sersli et al., 2018). While a variety of research has been done on both children and adults for many different types of bicycle education around outcomes such as change in skill, riding frequency, purpose (bicycling to school or work), knowledge, confidence, rate of injury, and bicycle ownership levels, to our knowledge no research examines the effect of classroom-based (off-bicycle) bicycle safety education on changes in travel behavior in adults.
Understanding the impact of classroom educational programs is important so decision-makers can understand the effectiveness of bicycle safety education, its usefulness to increase safety and demand, and its role in a multidimensional approach to improve active transportation and mobility. It also supports common local goals of reducing VMT by increasing the understanding around the role of bicycle safety education on mode shift and VMT reduction. Specifically, we address the extant empirical gaps such as the paucity of studies of classroom-based bicycling education among adults, and the limited understanding of their impact in riding confidence, riding behavior, and mode choice.
Next, we describe the study methodology, followed by results and a discussion of the implications. We end the report discussing our main findings considering the existing literature and note implications for cities and states seeking to fund bicycle safety education programs as strategies to increase bicycle mode share as well as to complement efforts to expand bicycling infrastructure.
We used a quasi-experimental, pre-test post-test research design to examine whether an in-classroom bicycle education course increases the self-reported riding frequency of existing and new riders; their confidence, perceived safety, and knowledge; use of a bicycle; the proportion of people that use a bicycle for everyday trips; and bicycle ownership. In addition, we examined the validity of self-reported bicycle use for a subsample of participants by comparing self-reports with behavior inferred from a smartphone app.
Our design exploits the fact that the education course is implemented over time, which allows a comparison between those who have taken the course and those who have not taken the course in that same period. At any point in time, a prospective student serves as a counterfactual for students that already received the intervention. The lack of a control group is ameliorated because future participants who have not been trained act as controls. The approach is like an interrupted time series design in which time is measured in student-specific clocks, with seasonal dummy variables capturing secular trends in bicycling. This approach works well with interventions delivered at a clearly defined point in time such as this one and where short-term outcomes are expected (Bernal et al., 2017).
We partnered with two geographically distinct SF Bay Area bicycle advocacy and education non-profits, one in Alameda County and another in SF County. Both offer free bicycle education courses to anyone interested in learning to ride a bicycle or how to bicycle more safely and confidently, and offer a similar menu of adult courses, including: Adult Learn to Ride (teaching adults how to ride), Traffic Skills (TS) 101-1 (a classroom-based course designed to teach the basics of traffic skills to beginning and intermediate riders), and TS 101-2 (an on-bicycle course designed to teach bicycle handling skills to beginning and intermediate riders).
The intervention studied was TS 101-1, a two-hour classroom-based course taught by both non-profits. The course covers basic rules of the road, equipping a bicycle, helmet fit, avoiding bicycle theft, bicycling in traffic, handling intersections, and route planning. All instructors had undergone the same training to be a certified instructor. Although the intervention had been implemented in an ongoing manner prior to the start of the study, researchers began surveying participants who attended classes between October 2018 and June 2019. Over these 9 months, 31 classes were taught in English in nine cities across the SF Bay. Classes were offered on weekend afternoons and weekday evening hours, and were taught in public locations such as libraries, YMCAs, universities, and churches.
To determine the appropriate sample size to detect a 15 percent improvement in riding confidence 80 percent of the time at a 95 percent level of confidence, we relied on past survey data from one of the non-profits, using the outcome “riding confidence in traffic.” This metric was produced by former class participants self-reporting their confidence riding in traffic on a five-point Likert scale. We estimated we needed 425 participants, including a 50 percent loss to follow-up.
All our measured outcomes can be classified into three domains: bicycle activity; self-efficacy, personal safety and knowledge; and mode shift (Table 1). We use three sources of data:
1. Current survey data: Our main source of data is a self-reported survey implemented before and after the intervention. These data were collected by the research team from October 2018 to June 2019.
2. Pre-study survey data: To augment the sample, we use self-reported survey data collected both before and after the intervention but collected prior to the start of the study. These data were collected via a similar survey instrument by one of the nonprofit partners from April 2017 to October 2018. Several questions on the pre-study survey were identical or similar to questions on the current survey. When data from these surveys are included in the analysis, we include a dummy variable to adjust for any systematic differences introduced by the differing data source.
3. Ride Report data: We use Ride Report, a tested and widely-used smartphone app that measured bicycling activity (https://ride.report/).
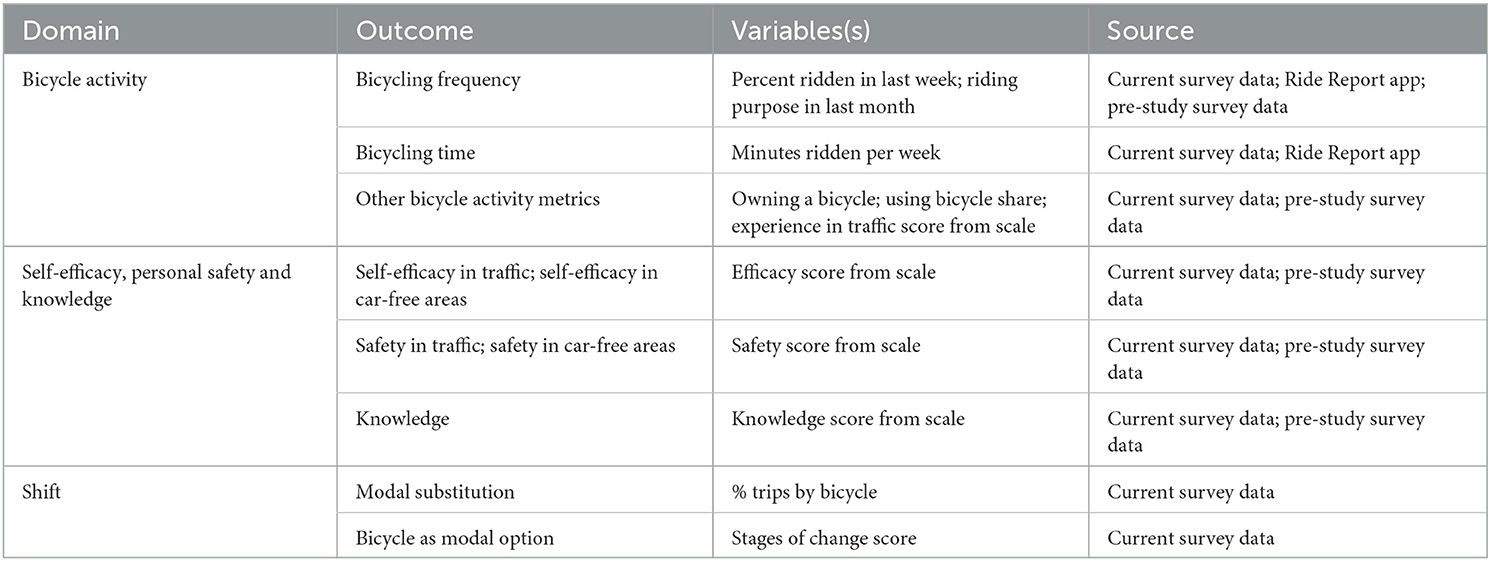
Table 1. Outcomes, variables, and data sources.
We describe each outcome and data collection instrument next.
The before and after surveys were designed and harmonized based on questions from existing surveys used by the nonprofit partners (demographics; bicycling activity), the International Physical Activity Questionnaire (bicycling duration) (Craig et al., 2003), and Barcelona's TAPAS survey (modal split) (Avila-Palencia et al., 2017). The surveys also included questions to measure whether bicycling was being considered as an option, even if not used, following the stages of change model (Gatersleben and Appleton, 2007). Questions on station-based and dockless bicycle-share were included, but questions on dockless e-scooters were not included because scooters had not debuted at the time the survey was developed. As helmets are not required for adults over age 18 in California, helmet use was not evaluated. The before and after surveys are available from the authors upon request.
Participants were recruited using existing practices by the non-profits, including email newsletters, social media posts, website information, and word of mouth. Participants who signed up for the TS 101-1 course were subsequently sent information about the study from the non-profit partner, including an invitation to take the before survey via Qualtrics. Participants were offered a $5 gift card for taking the survey. Upon arriving at the course, those who had not already taken the survey were invited in-person by a research assistant. Participants could either take the survey on their personal smartphone or a provided e-tablet. Participants then attended the bicycle education course.
Approximately 6 weeks after taking the course, participants were invited to take the after survey (also on Qualtrics) via email and text message. Participants were incentivized with another $5 gift card for taking the after survey. For ~4 weeks, follow-up emails and text messages were sent to participants who had not taken the survey.
We partnered with Knock Software, Inc., creator of the Ride Report app, to collect data on participants' riding behavior to examine agreement with self-reported measures of riding frequency. While the company has since shifted to offer a shared mobility management platform, Ride Report was initially a mobile app designed to automatically track bicycling and other transportation activity. Using machine-learning algorithms that take advantage of smartphone accelerometers and gyroscopes, Ride Report automatically detected when users traveled and identified the transportation mode, including bicycling (Porter and Schwartz, 2018). Ride Report data has also been used to crowdsource community feedback on bicycling routes (Harvey et al., 2019). Comparing bicycling data from the app with self-reported bicycling activity data allows us to examine the quality and validity of the self-reported data.
After completing the before survey, participants were invited, via a link provided by the survey team, to download the Ride Report app to their smartphone. They were offered another $5 gift card for downloading the app and consenting to share their data with the study.
For those who opted to download the app, Ride Report inferred data on participants' bicycling trips, including distance bicycled, average speed, duration, and start and end time. The Ride Report team anonymized the trip data except for a key to link the rider with the survey and shared the data with the UC Berkeley team only for those participants who consented to share their data. To protect privacy, no spatial data were provided to the research team.
For after survey data, we compared self-reported riding time for the past week with the riding time registered by Ride Report for the same week. For pre-course survey data, however, we were unable to match the time period of the Ride Report data with the self-reported data because participants were invited to download the Ride Report app only after they completed the before survey. As a result, for the pre-course data we compared average weekly bicycling time from Ride Report for the entire time period before the course with the self-reported data on riding time the week prior to the survey. All comparisons of agreement were conducted with Pearson correlation coefficients, with higher values denoting higher agreement. We use the Landis and Koch (1977) criteria to interpret agreement between self-reported and app-detected riding, with values of zero indicating no agreement, 0–0.20 indicating slight agreement, 0.21–0.40 indicating fair agreement, 0.41–0.60 indicating moderate agreement, 0.61–0.80 indication substantial agreement, and 0.81–1 indicating almost perfect agreement.
We observe individuals at two different points in time, before and after the classroom intervention. In terms of the calendar, those two time points differ across individuals. A participant may be reporting before bicycling activity for a week in the spring (before the intervention for them) while another participant may be reporting after-intervention activity for that same week. Each individual crosses over to the treated condition once they participate in the training. This case crossover design is especially helpful when individuals are treated at different times (Turner, 2013) and has been used in safety research (Redelmeier et al., 2003; Asbridge et al., 2014; Fraser and Meuleners, 2020). We use panel regression analysis to estimate the effects of the intervention on outcomes of interest. Furthermore, there may be systematic differences, such as secular trends (overall bicycling may increase in the spring) and/or personal and other attributes that may interact with the intervention to influence overall outcomes. Analytically, our approach measured associations of the outcomes (dependent variables) to participation in the intervention while controlling for other covariates.
where outcome refers to the outcome of interest for person i at time t; after i, t is the variable of interest—a dummy variable which takes value of 1 if the observation is after the course intervention, or 0 otherwise; Wi, t is a time-varying and person-varying vector of covariates measuring climatic conditions (precipitation and wind) affecting cycling (more on this below); Xi is a vector of demographic covariates (sex = 1 if male, race/ethnicity = 1 if non-white, and age at baseline entered as a continuous variable); Ti, t is a vector of dummy variables adjusting for the impact of seasonality on outcomes; and betas are estimated coefficients or vectors of estimated coefficients. For the seasonality dummy variables, each observation was assigned one of three seasons based on the week prior to when the survey was completed (spring = March through May; summer = June through October; winter is the reference category). The functional form of the equation estimated depends on the outcome and were either logistic regression for binary variables or negative binomial regression or zero-inflated negative binomial regression for counts.
In addition, as discussed previously, for observations that were collected from the pre-study survey, we include a dummy variable, a fixed effect to adjust for systematic differences associated with the two different data sources. It was outside the scope of this study to consider participants' individual travel patterns, so the availability and quality of participants' nearby street network for cycling is not addressed in the model, though it may interact with the intervention.
Atmospheric conditions may affect one's decision to ride a bicycle (Flynn et al., 2012). Due to the temperate nature of the San Francisco Bay Area, we adjusted for precipitation and wind speed. Hourly weather data from the National Oceanic and Atmospheric Administration's Local Climatological Data online map tool were collected from nine Bay Area weather stations for all dates between January 1, 2017 and July 15, 2019. We focused on precipitation and wind speed for commuting hours (9am to 7pm) to account for riders' decision to either bicycle to work/school or bicycle home. We used data from the weather station closest to each participant's reported home address, home zip code or, if these were unavailable, class location. Two continuous variables between zero and seven were calculated for each participant, one for precipitation and one for wind, counting the number of days in the week prior to the self-reported survey in which precipitation or wind exceeded a given threshold. Thresholds used were any precipitation and the 90th percentile of observed wind speed in the sample days.
It is possible that specific subgroups (e.g., older or inexperienced riders) are more or less sensitive to the intervention. Although our study was not powered to detect these possible subgroup effects, we performed additional analyses to explore these. This was achieved by including an interaction term between the variable describing the subgroup of interest and the after variable in the regression model. The subgroups tested included age, race/ethnicity, sex, baseline confidence in traffic, and baseline safety in traffic. Baseline confidence and safety were used to identify inexperienced riders, as those who reported high feelings of confidence and safety were likely to be more experienced bicycle riders.
A concern with the study is that only individuals interested in improving their skills and safety will sign up for the class. This self-selected group of individuals is likely to be different from the rest of the population. We mitigate this concern by using a subsample of participants who (1) received a traffic citation due to a bicycle moving violation and are allowed to go through the training course instead of paying a fine (this option is only possible in the city of Berkeley, as no other jurisdiction has adopted this policy), or (2) attended the class to chaperone their child for whom the class was a prerequisite of attending “Bike Camp” over the summer. These two sets of individuals attended the class because of an exogenous requirement (addressing a ticket or child training) allowing us to compare their outcomes to all others who self-selected into the class, although clearly they are interested in bicycling.
In addition, we examined the sensitivity of our results to our thresholds of the atmospheric variables, precipitation and wind. We tested the 95th percentile of precipitation for the sampled day and the 75th percentile for wind in the sampled day. We included each new variable individually, and then together in the statistical models.
Finally, we ran another model including a dummy variable summarizing which nonprofit taught the course to determine if there were systematic differences. These differences could be the result of how the course is taught, the instructor, different recruitment methods, and differing riding conditions in each geographic location.
The study was approved by the Institutional Review Board at the University of California, Berkeley.
Approximately 250 adults attended a bicycle education course during the current study recruitment period, although exact numbers are unknown due to missing attendance records. Of that number, we recruited 182 participants (~72 percent participation rate) of which 113 completed both the before and after surveys. The remaining 69 were lost to follow-up and only completed the before survey (40 percent attrition rate). As discussed, to increase our sample size, we used additional before and after data from a pre-study survey distributed by one of the nonprofit partners. Of the 201 participants in the pre-study survey, 45 participants completed both the before and after surveys (~78 percent attrition rate). As a result, the total sample of participants with before data only (no after data) was 383 and the total sample of participants with before and after data was 158. In the following summaries of participant characteristics, we stratify the results by current study and pre-study survey data.
Comparisons between the sociodemographic characteristics of both current study and pre-study participants and census data suggest that women and non-Hispanic White and Asian participants are overrepresented in our sample, whereas Black and Hispanic participants are underrepresented (Table 2). This means that members of these groups are more (or less) likely to take bicycle education than would be expected based on the population. Of the participants who took a before survey, a higher proportion are women than the total population, and nearly double the number of women currently bicycling. Older participants were less likely to be lost to attrition from the before to the after survey. Participants were mostly taught by the non-profit serving Alameda County (60 percent vs. 40 percent for San Francisco County, Table 2). Comparisons are made to county totals for simplicity even though participants may not live in the county in which they attend a bicycle education course.
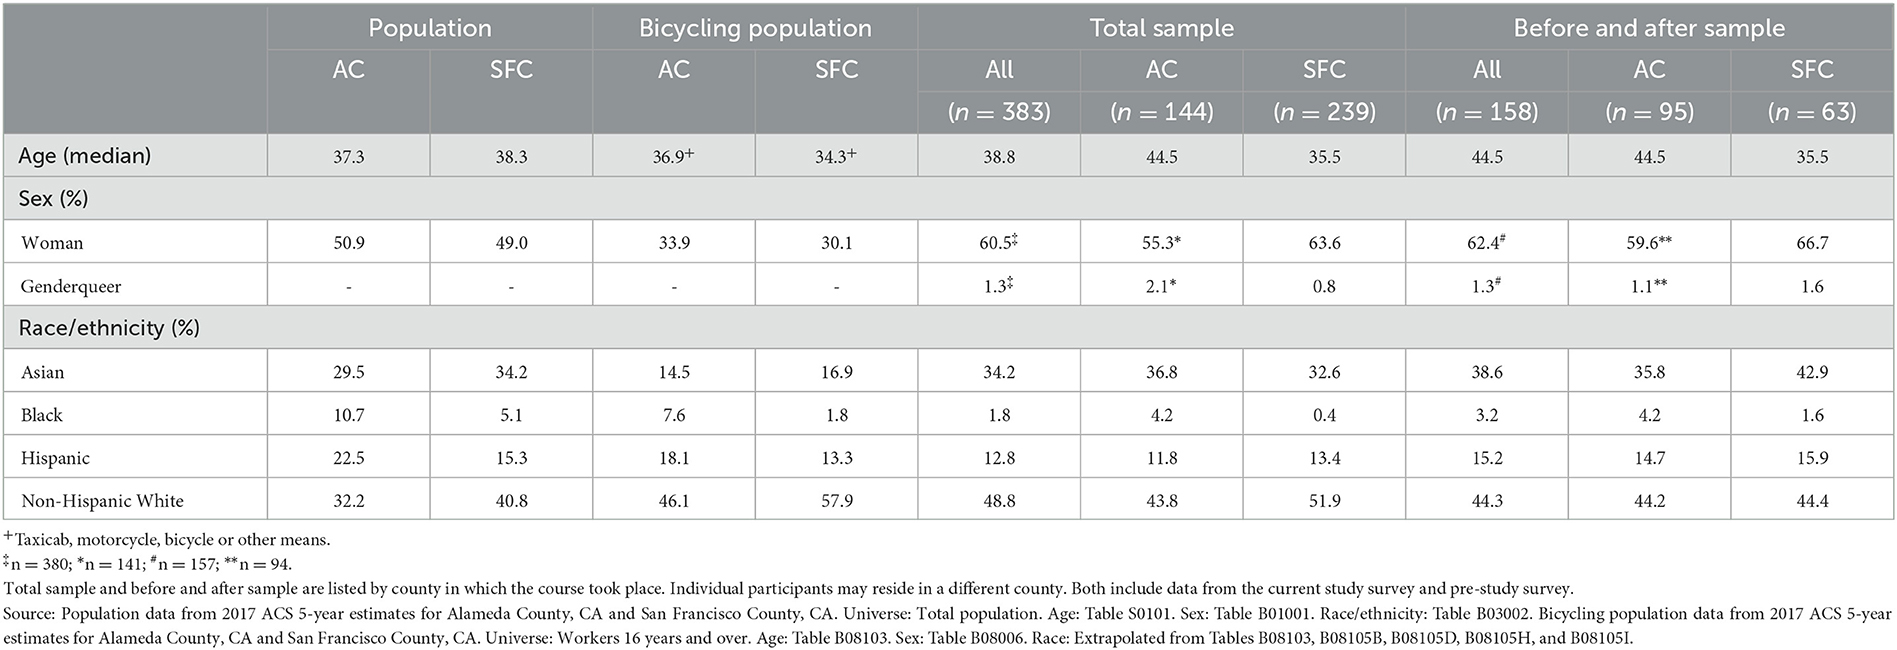
Table 2. Sociodemographic characteristics of participants (AC, Alameda County; SFC, San Francisco County).
There are some differences in select demographic characteristics and baseline behaviors between those who completed the before and after surveys and those lost to follow up. In terms of demographics, younger, white participants, those filling out the pre-study survey, and those who took the training with Bike East Bay were more likely to be lost to follow up (results not shown). There are no statistically significant differences for gender, prior bicycling experience or the self-reported percent of trips taken by bicycle between those who were lost to follow-up and those who remained in the sample. In terms of study outcomes, differences in self-efficacy, personal safety, and knowledge between current study participants who completed the before and after surveys and those lost to attrition tend to be small (Table 3). For participants in the pre-study survey, those who completed the before and after surveys have more pronounced differences in bicycling activity and bicycling self-efficacy compared to those lost to follow-up.
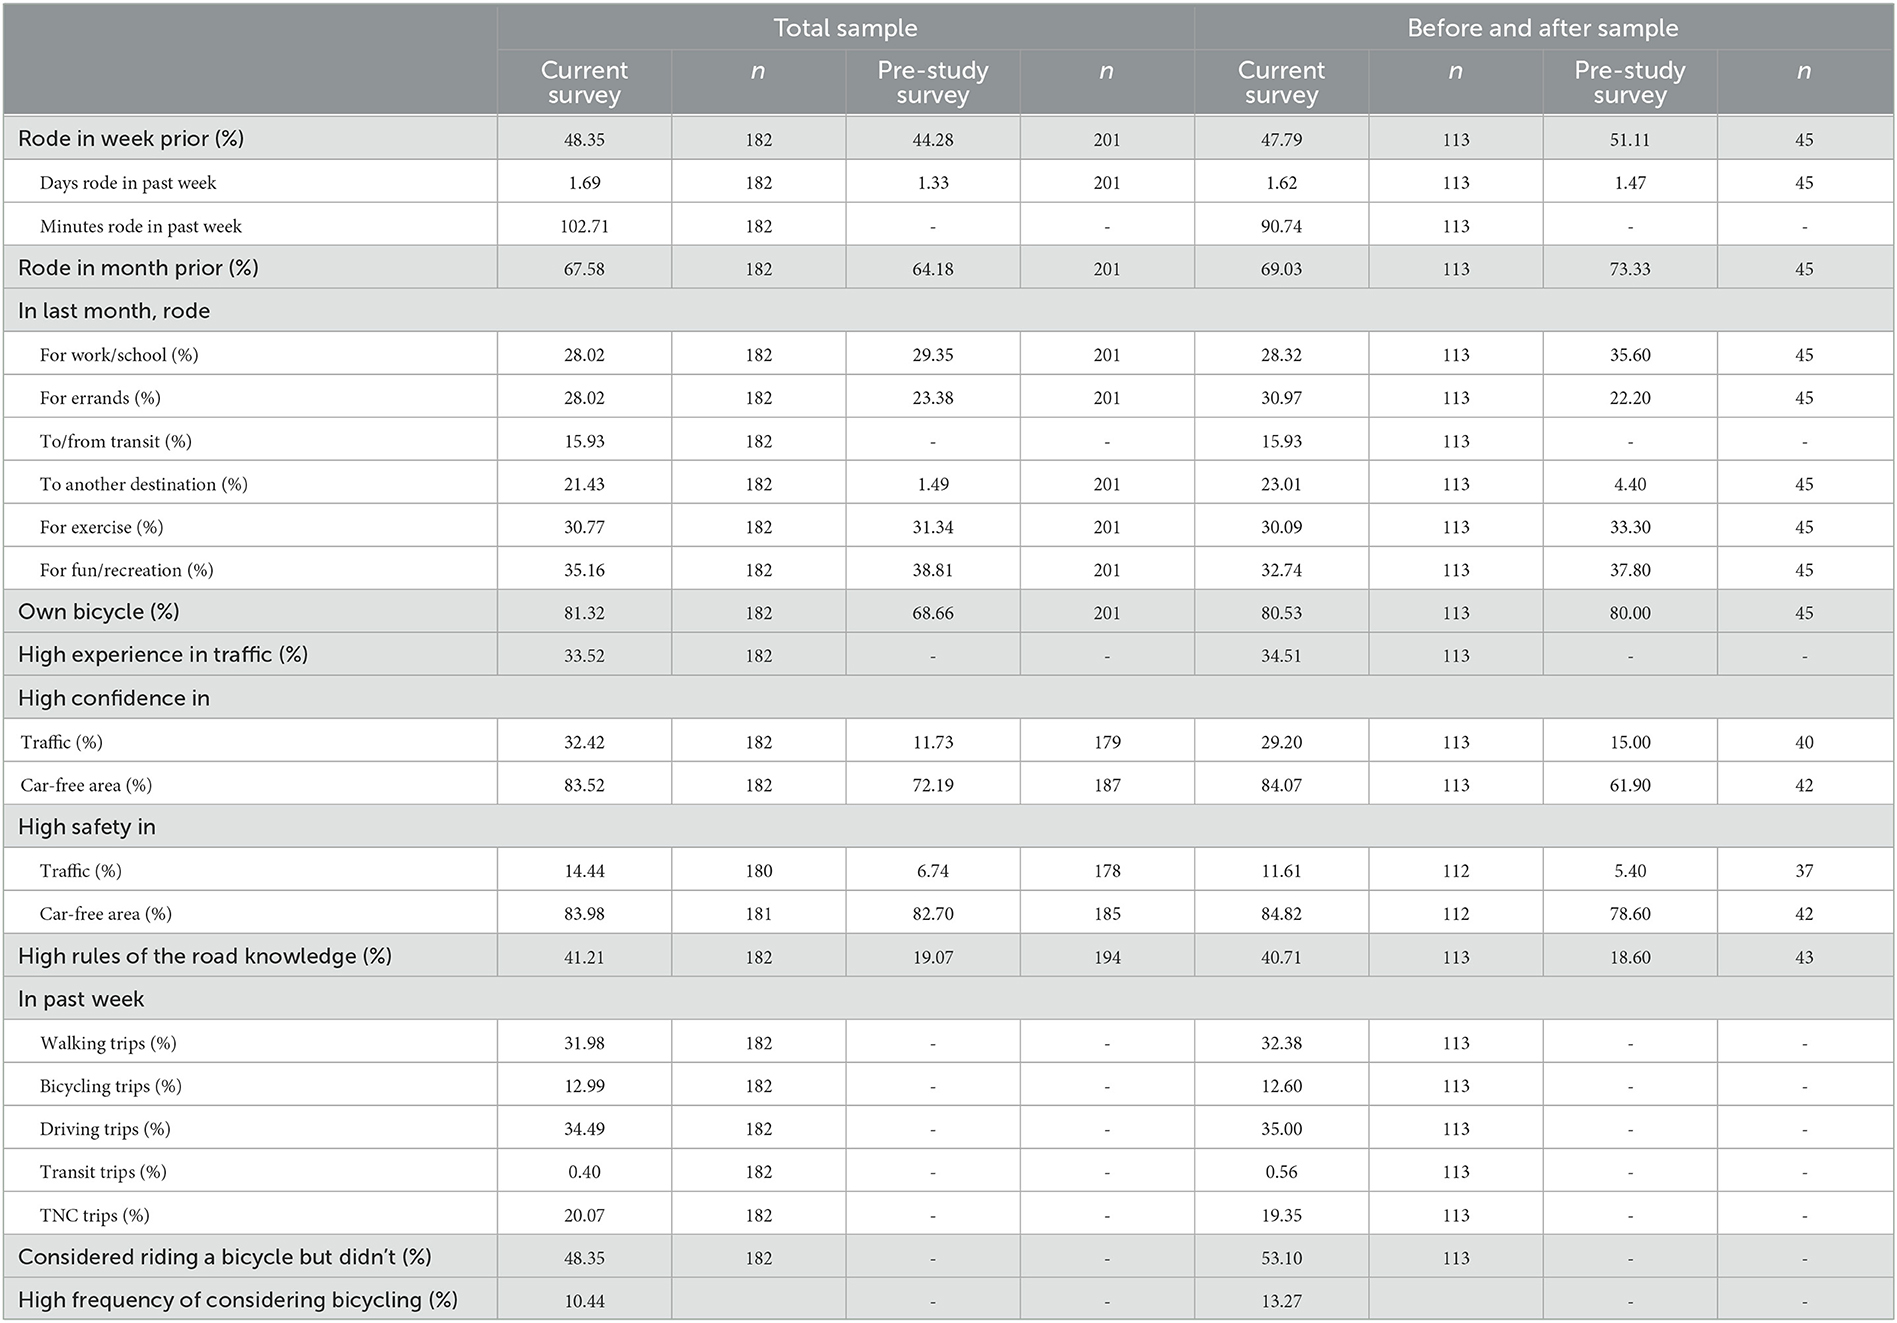
Table 3. Baseline bicycle activity; self-efficacy, personal safety and knowledge; and modal split.
Participants who completed both surveys (either current or pre-study population) were more likely to bicycle for commuting, exercise, errands (current survey only), other destinations and exercise (pre-study survey only) than those who only took the before survey. Before and after participants in the pre-study survey were more likely to own a bicycle than before-only participants in the pre-study survey.
Participants who completed both the before and after surveys (current survey only) were more likely to report high levels of experience in traffic (4 or 5 on a 5-point Likert scale, with 1 = “Inexperienced” and 5 = “Very experienced”). Participants who completed the current before and after surveys were more likely to have high feelings of confidence (4 or 5 on a 5-point Likert scale, with 1 = “Not confident” and 5 = “Very confident”) and safety (4 or 5 on a 5-point Likert scale, with 1 = “Not safe” and 5 = “Very safe”) in a car-free area than those who only took the before survey, but were less likely to feel highly confident or safe in traffic. However, participants from the pre-study survey who took both surveys were more likely to feel highly confident in traffic, less likely to feel highly safe in traffic, and less likely to feel highly confident or safe in a car-free area than those who only took the pre-study before survey. Both before and after samples were less likely to report high levels of knowledge of the bicycling rules of the road (4 or 5 on a 5-point Likert scale, with 1 = “Poor” and 5 = “Excellent”) than the respective populations who only took the before survey.
The population that responded to both surveys was more likely to travel by foot, car or transit, and was more likely to consider choosing a bicycle for their transportation mode than the total sample.
Pearson correlations were used to assess agreement between self-reported bicycling minutes and Ride Report-observed minutes. Although the sample was small (n = 14), there was almost perfect agreement between self-reported minutes on the after survey and the corresponding minutes observed on Ride Report (r = 0.9474, p < 0.00). This indicates that the self-reported data agrees highly with the objectively measured data.
For the before survey, there was moderate agreement between self-reported riding minutes the week prior to the survey and the average weekly riding minutes after the survey (but before the course) (r = 0.4564, p < 0.136; n = 12) though the results are not statistically significant. When a single outlying observation was removed, the correlation indicated substantial agreement (r = 0.7344, p < 0.01; n = 11), which suggests that observations of past bicycling behavior agree well with self-report data, even if the dates do not match exactly.
Because the courses were taught at different points in time, we compared behaviors of those who have taken the course relative to those who have not taken the course in that same period. In the next subsections we report estimated changes due to the course for our three main outcome categories: bicycling activity; self-efficacy, personal safety, and knowledge; and travel mode. We report average marginal effects, which indicate a change in the outcome (probability or count) after the course compared to before the course, while adjusting for individual characteristics, weather conditions, and season. Because our sample includes participants who were lost to follow up (and therefore only have before data), we also included a dummy variable to identify them. We also estimated all models without this subgroup (results not shown) and effect sizes and statistical significance remain very similar to those reported next.
We see little evidence of increased bicycling activity after the course (Table 4). Most differences between the before and after surveys are not statistically significant, though the sign of the coefficient is positive. Although there was no evidence of increased experience bicycling in traffic, there was an increased probability of 11 percentage points (p = 0.1) of reporting high experience in traffic in a regression model without controlling for socioeconomic characteristics or weather variables (data not shown). Looking at bicycling purpose, the probability of bicycling for fun or recreation was 13 percent higher (p < 0.05).
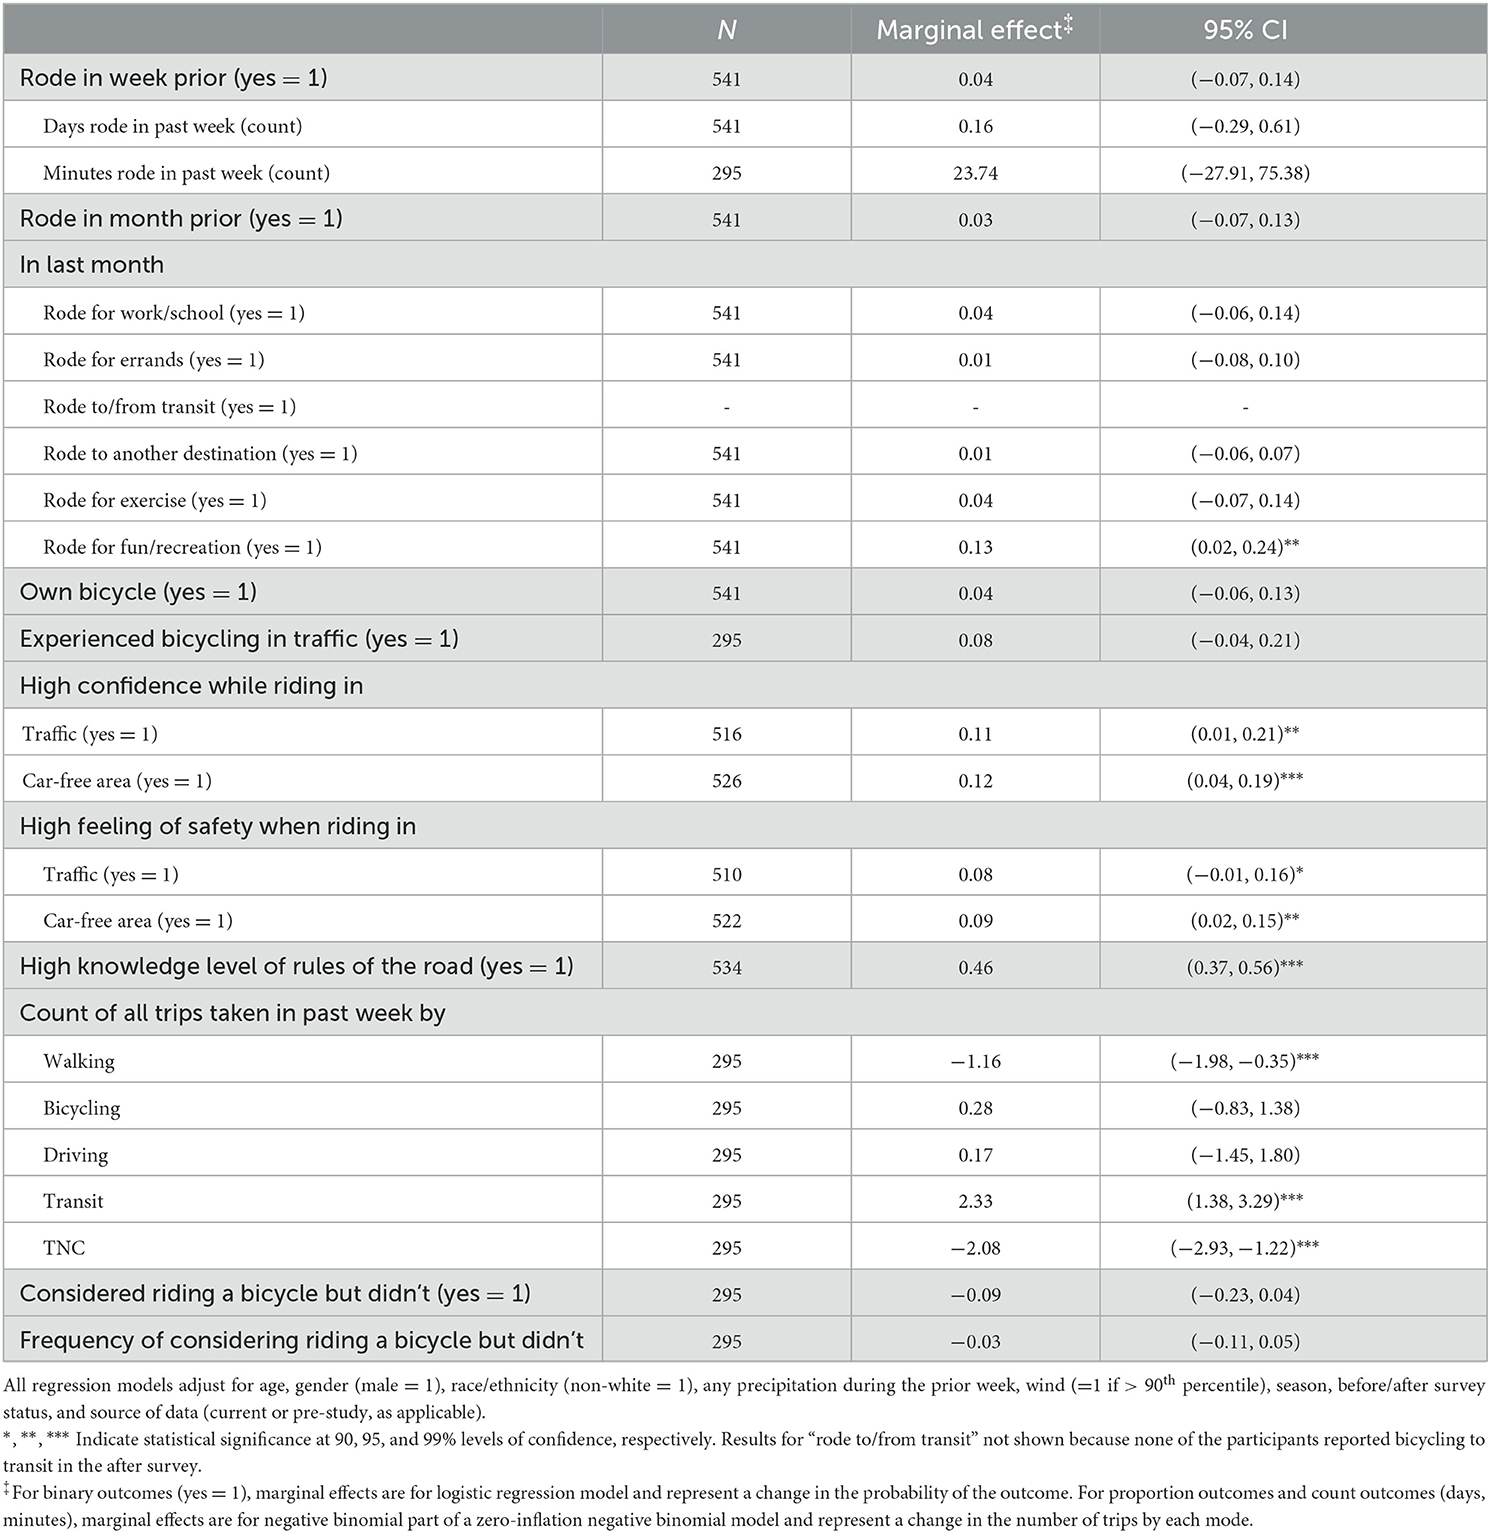
Table 4. Estimated average marginal effects of bicycle education class (95% confidence interval) by outcome.
Changes in bicycle activity can also be visualized by estimating the average marginal effect of the course. These are model-estimated values for specific participant characteristics and riding conditions (non-white, non-male, at median age taking the class in the winter, with median wind and precipitation). The effects are displayed for overall bicycling activity (Figure 1), which shows that, while not statistically significant, participants reported an increase in bicycling, bike ownership, and experience in traffic. The effects are also displayed for bicycling purpose in the past month (Figure 2) and show that participants were less likely to ride to or from transit (p < 0.01) and more likely to ride for fun (p < 0.05). While not statistically significant, participants reported an increase in bicycling on their commutes, for errands, and for exercise.
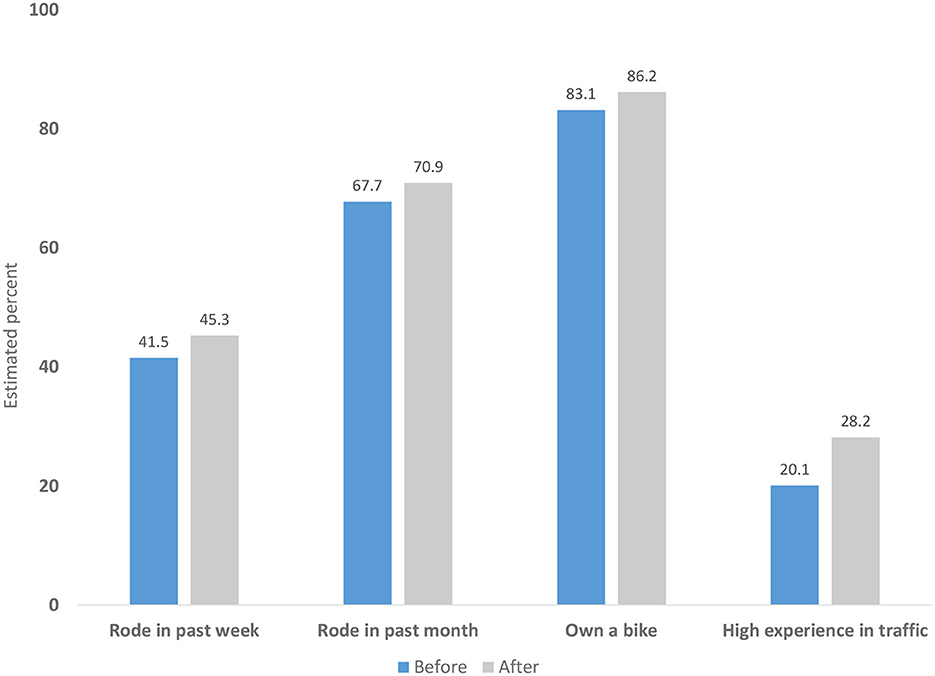
Figure 1. Estimated average marginal effects of bicycle education class on bicycling activity. Estimated for nonwhite, non-male, median age participant who took both before and after surveys taking the class in the winter during the current study and riding during periods of median wind and precipitation.
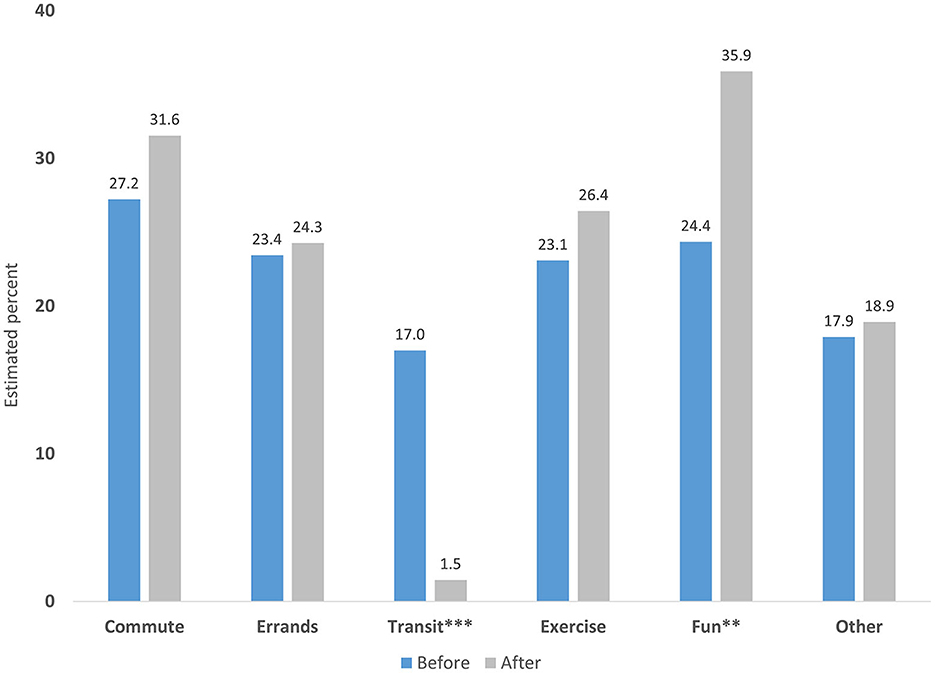
Figure 2. Estimated average marginal effects of bicycle education class on bicycling purpose in last month. ** and *** indicate statistical significance at 95% and 99% levels of confidence, respectively. Estimated for nonwhite, non-male, median age participant who took both before and after surveys taking the class in the winter during the current study and riding during periods of median wind and precipitation.
Across all measures of self-efficacy, personal safety, and knowledge, we find significant increases among participants. The probability of reporting high confidence bicycling in traffic or car-free areas increased by 11 percent (p < 0.05) and 12 percent (p < 0.01) after the course, respectively. The probability of reporting high feelings of safety in traffic or car-free areas increased by 8 percent (p < 0.1) and 9 percent (p < 0.05) after the course, respectively. The probability of reporting high knowledge of rules of the road increased by 46 percent (p < 0.01). Visualizing these changes using estimated average marginal effects before and after the intervention shows the overall effects of the intervention on personal safety, self-efficacy and knowledge (Figure 3).
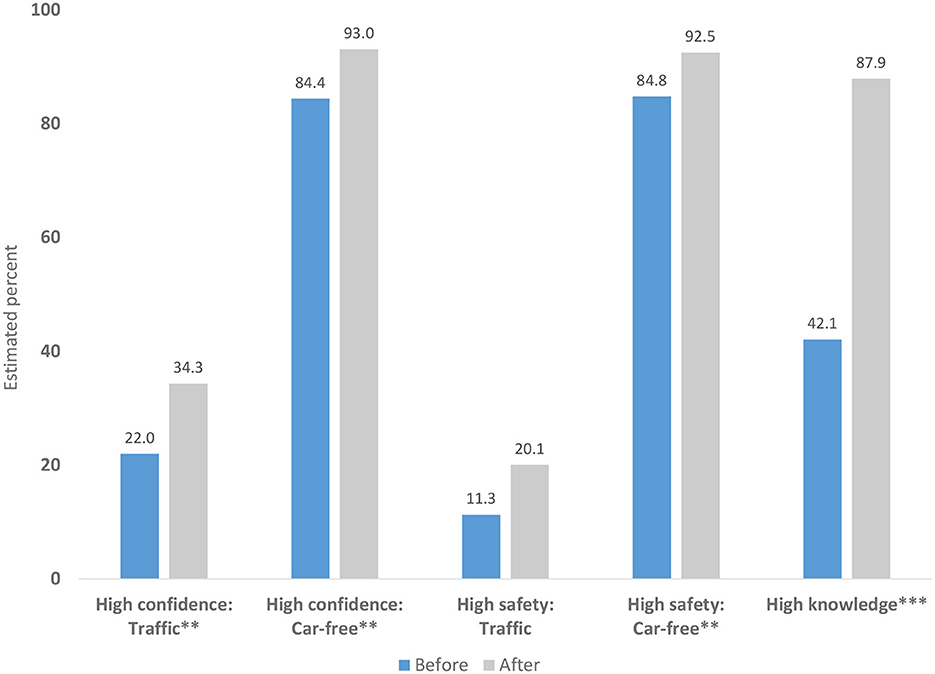
Figure 3. Estimated average marginal effects of bicycle education class on self-efficacy, personal safety, and knowledge. ** and *** indicate statistical significance at 95% and 99% levels of confidence, respectively. Estimated for nonwhite, non-male, median age participant who took both before and after surveys taking the class in the winter during the current study and riding during periods of median wind and precipitation.
The before and after surveys asked participants to list how many trips they made in the past week by foot, bicycle, car, public transportation, and rideshare service, with the goal of answering the research question: Do bicycle education classes increase bicycle mode share and/or cause mode shift toward bicycling? While there were significant changes in the proportion of trips by foot, transit and TNC, there was no change in the count of trips made by bicycle (Table 4).
To examine whether subgroups of participants benefited more or less from the course, we examined the effect modification of a subset of participant demographic characteristics (male, non-white, and age) and self-reported confidence and safety perceptions riding in traffic at baseline (before the intervention). As described in the Materials and Methods section, this involves including an interaction term between the moderating variable and the course, as well as main effect for the moderating variable.
In terms of participant demographics, older individuals benefited less from the course than younger participants for self-reported confidence in traffic and self-reported knowledge of the rules of the road. Figures 4, 5 show by age how participants self-reported confidence riding in traffic and knowledge of the rules of the road before and after the course. The effect is higher for younger individuals but begins decreasing as participant age increases. The effect of the intervention for non-males (women and genderqueer participants) was higher for minutes bicycled in the past week, outcomes related to transit use, and feelings of safety and confidence in traffic, relative to males (results not shown). Finally, non-white participants increased their minutes bicycled and were less likely to use TNCs after the intervention (results not shown).
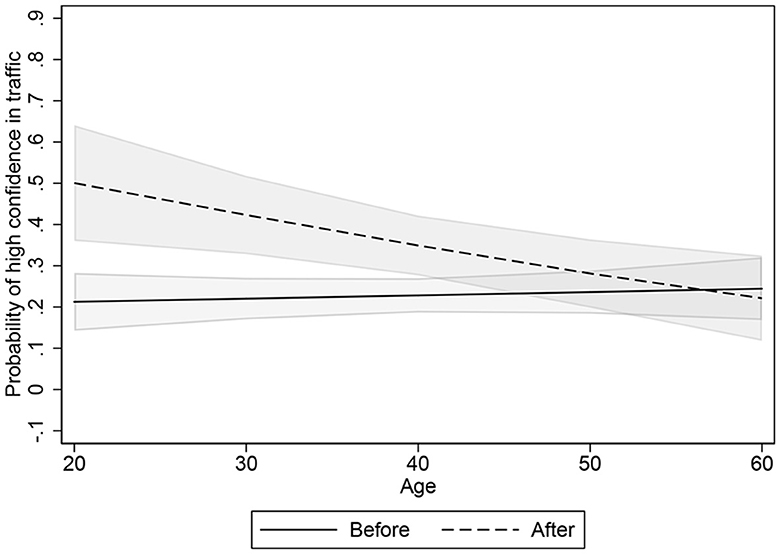
Figure 4. Self-reported high confidence in traffic by age (gray areas represent 95% confidence intervals).
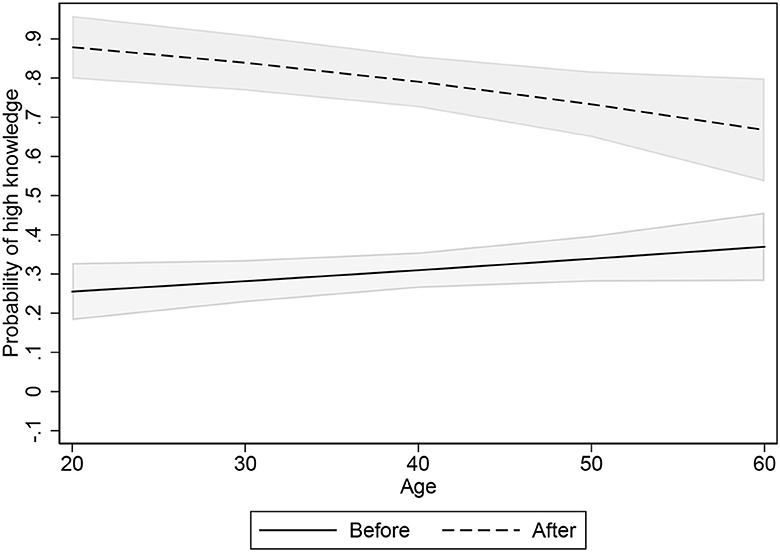
Figure 5. Self-reported high knowledge of the bicycling rules of the road by age (gray areas represent 95% confidence intervals).
In terms of confidence in traffic, we found that participants with lower confidence at baseline (pre-course) benefited more from the course than participants with higher confidence. Their change in minutes bicycled, riding for exercise, and in perceived safety riding in traffic was higher. Figures 6, 7 show how participants reported minutes bicycled and perceived safety riding in traffic before and after the course as base confidence in traffic ranges from 1 (low) to 4+ (high). This means that the educational intervention examined was most beneficial for participants with low confidence riding in traffic. Participants with low baseline safety in riding were more likely to drive after the course (results not shown).
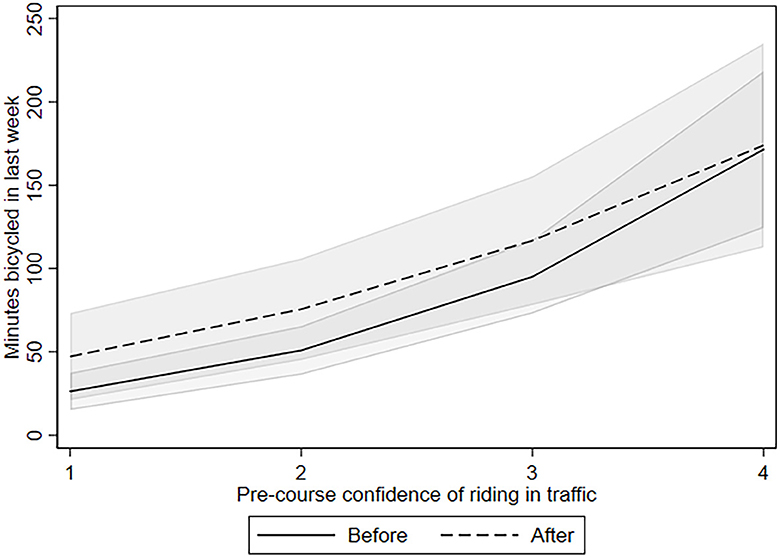
Figure 6. Self-reported minutes bicycled in past week by pre-course confidence riding in traffic (gray areas represent 95% confidence intervals).
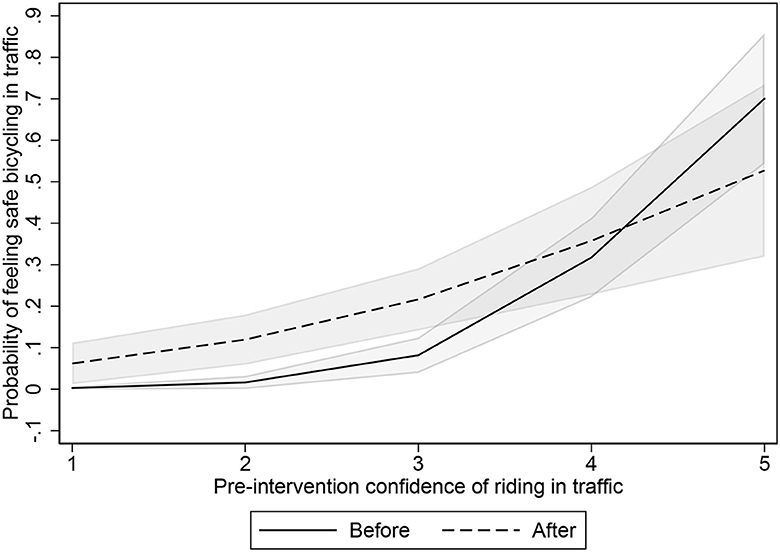
Figure 7. Self-reported feeling of safety in traffic by pre-course confidence riding in traffic (gray areas represent 95% confidence intervals).
We mitigate concerns of using a self-selected pool of participants by comparing people who received a ticket while bicycling and parents accompanying their children to a mandatory class in order attend summer camp to other participants. In no instances did inclusion of the ticket-receivers and camp parents variable change the intervention coefficient and its significance (results not shown). The variable was significant for six outcomes, however. This group is significantly more likely to have bicycled in the past week, bicycled to errands in the past month, have a high confidence bicycling in traffic, have high rules of the road knowledge, drive a car for transportation, and is less likely to walk as a mode of transport (results not shown). An analysis of the interaction between this group and after results in no difference in outcome between this group and the study population (results not shown). This suggests that this group may not be different enough from the study population to understand the effects of self-selection. Those in the class for receiving a ticket were already bicycling when they were cited, so they may not gain much from the class. Those whose children were attending “Bike Camp” may have signed up their kids because the parents are enthusiastic bicycle riders themselves.
A sensitivity analysis understanding the effects of how weather was measured involved separately changing the precipitation variable to be more stringent (from any precipitation to precipitation at the 95th percentile or above) and the wind variable to be less stringent (from wind at or above the 90th percentile to wind at or above the 75th percentile) and examining whether the estimated effects of the course changed for the outcomes. The sign of every intervention coefficient and its significance remained unchanged (results not shown). Of note, the significance and direction of the precipitation and wind coefficients changed in some models, with both improved and worse model fit resulting from the changes to these weather variables. When changing the wind variable, five of eight significance changes indicated better model fit, while three of five significance changes after changing the precipitation variable indicated worse model fit as judged by likelihood ratio information criteria. When changing both variables, the changes were again nearly evenly split, with three of five changes to coefficient significance indicating worse model fit. This suggests that more research is necessary to determine both the appropriate wind and precipitation thresholds that influence cycling behavior, and perhaps other measurements of environmental factors that may influence this behavior.
When examining whether the nonprofit that delivered the course had an impact on the estimated effects, we found no differences in the estimated effects (results not shown). This is positive and suggests that bicycle education classes can be delivered differently (for example a single staff member like in one non-profit, presumably increasing the fidelity of the intervention, or by different volunteer instructors like in the other non-profit) and this does not have an impact on the outcomes. However, we did see some geographic differences within the participant population. Individuals taught in San Francisco have a higher probability of riding to work/school, for errands, or for another destination than individuals taught in the East Bay. This may be related to the geography of San Francisco. The San Francisco participants also have a lower probability of being highly confident riding in a car-free area, perhaps because bicycling paths and trails in San Francisco are limited, and a lower probability of owning a bicycle.
This study aimed to understand the effect of a two-hour, classroom-based bicycle training course on participants' bicycle activity; self-efficacy, personal safety and knowledge; and travel mode choice.
Most notably, people who reported initially feeling low confidence bicycling in traffic did report increased bicycle activity on two metrics: minutes bicycled in the past week and bicycling for exercise. This suggests that the course encouraged people to bicycle who would not have attempted it prior to taking the class, such as women, who were more likely to report low confidence bicycling in traffic prior to taking the course.
The classroom-based bicycle education course examined in this study is the first of two courses; the second course is an on-bicycle class that lasts between 4 and 6 h. The increased confidence, feelings of safety and knowledge may encourage participants to sign up for the on-bicycle class. Based on prior results of studies of on-bicycle classes (Johnson and Margolis, 2013; Zander et al., 2013; Kloof et al., 2014; Transport for London, 2016; Schneider et al., 2018), participants who take the on-bicycle class may eventually bicycle more frequently.
Additionally, the classroom-based course is significantly less expensive for the non-profit partners to implement (a two-hour classroom-based course can be provided for ~$200; a six-hour on-bicycle course would cost ~$1,500), suggesting that even a low-cost investment in bicycle education can result in benefits.
The results for travel mode choice show no change in the proportion of trips taken by bicycle. This suggests that alone, a two-hour classroom course on bicycling safety is not sufficient to encourage mode change. Indeed, researchers struggle to identify how best to change transportation behavior. A review of research into the effects of built environment infrastructural changes, for example, on walking and bicycling behavior change found mixed results (Stappers et al., 2018).
It is also of note that the demographics of the classes differ from both the general population and the population that commutes to work by bicycle. The proportion of women that takes the classes is nearly double the bicycling population, and over ten percentage points higher than the general population. This could indicate that the marketing techniques employed by the non-profit partners are better at targeting women or are reaching more women. This could also indicate that women are interested in bicycling, but the current bicycling landscape is not supportive for them to ride. For example, research has shown that women are more likely to ride on off-road paths compared to roads with no bicycle facilities (Garrard et al., 2008). Women are also more likely to assume traditional gender roles including childcare, cooking and housework that may not be conducive to bicycling (Prati, 2018). Content in the courses that discuss specifically how to ride safely on on-road bicycle infrastructure or how to bicycle with a family may support more women riding.
Beyond gender, both Black and Hispanic class participation is lower than the general population and the bicycling population. This may be due to a variety of factors. First, though the classes are held across the Bay Area, only a few were held in neighborhoods with high proportions of Black and Hispanic residents. Although many people travel to the classes (some participants came to classes from cities in other counties, for example), it could be expected that most would be more likely to attend a class in their neighborhood. Second, when one member of the research team went to survey at a class in a predominately Black neighborhood of East Oakland, participants of color were distrustful of UC Berkeley and did not feel comfortable filling out the survey because it would require providing identifying information. Third, the current methods of recruitment for the classes rely heavily on electronic forms of communication (email, website, social media). This may exclude people without access to a computer or smartphone. Research shows that Mexican-Americans and Black people are less likely to own a computer and have Internet access compared to White families. This is not due entirely to income; income differences explain between 10 and 30 percent of the access gap (Fairlie, 2014).
Our study has important limitations to acknowledge. First, although we aimed for 225 participants total (450 with 50 percent attrition), we had 113 participants who took both surveys alongside 45 from the pre-study survey for a total of 158 participants. This decreased the power of our study to detect associations at the pre-established levels.
Second, the analysis did not account for external reasons that might cause individuals to bicycle more or less and that can be correlated with study participation, such as injuries. We also did not track if the participants took additional bicycle education courses with the non-profits or elsewhere.
Third, we did not account for the fidelity of the interventions, such as the fact that different instructors teach the classes. Thus, even though our estimates are of average effects, it may be that higher quality instruction yields different outcomes than lower quality instruction.
Fourth, we originally aimed to understand the effect of the course on bicycle-share and dockless bicycles. However, the survey was designed months before dockless bicycle-share companies began replacing their bicycles with e-scooters. As a result, the question about dockless bicycle-share were dated as the product was no longer offered in the area. Additionally, station-based bicycle-share offerings changed numerous times throughout the study period. In December 2018, Ford GoBike (now Bay Wheels, the region's sole station-based bicycle-share provider) announced hundreds of additional electric-assist bicycles in San Francisco and the expansion of e-bicycles to the East Bay. In February 2019, due to popular demand, the number of e-bicycles was increased by over 1,400 bicycles. In April 2019, Ford GoBike announced the removal of all e-bicycles due to faulty brakes. Furthermore, some bicycle-share stations were added in San Francisco during this time. It is possible that the changes to the bicycle-share system may have confounded efforts to understand participants' usage of bicycle-share. Therefore, we did not report on these results.
Fifth, as all participants currently bicycle or are interested in bicycling, we are unable to estimate the effect of the course on the population at large. One could argue that estimating a population-level effect is not even appropriate because expecting an entire population to take such a class would not be feasible or desirable. The effectiveness of the education program in question may arise because it allows people with an interest in improving skills to do so, rather than in spite of it.
The study also has several strengths. First, to our knowledge, this is the first study undertaken to evaluate solely a classroom-based bicycle education course (as opposed to an on-bicycle course), and the thirteenth study to examine the effects of bicycle education on an adult population. It is also the first study to examine the connection between bicycle education and travel mode choice. Second, the study utilized a strong before/after design which took advantage of different times of intervention delivery to address concerns around bias and temporal trends.
This study is the first to evaluate key impacts of a two-hour classroom-based bicycle education course on bicycle use; self-efficacy, personal safety, and knowledge; and travel mode choice. We found that bicycle education can have a positive influence on participants' feelings of confidence and safety while riding in traffic or in car-free areas, as well as on knowledge related to the bicycling rules of the road. Although it is possible that this increased knowledge and confidence will translate into actual safety benefits, we did not examine this outcome. This possibility should be examined in further research. While we detected changes in bicycling activity among those with initial low confidence, we did not detect overall changes in bicycling use and activity and travel mode shifts. Further research is needed to understand behavioral change related to transportation interventions. Finally, this study did not include a spatial component, i.e., understanding the bicycling context in the home communities of each participant. Future research may consider the effects of bicycle education in the context of bicycling activity in one's home community.
Due to the cost-effective nature of this type of education, planners should consider continuing to fund or increasing funding toward these efforts. Classroom-based bicycle education is a low-cost way to complement cities' Vision Zero and mode shift goals by encouraging adults to feel safer and more confident riding a bicycle. By implementing education alongside other strategies, such as bicycling infrastructure and traffic calming, cities can take a multi-pronged approach that may help shift people onto bicycles.
The raw data supporting the conclusions of this article will be made available by the authors, anonymized to preserve respondents' confidentiality.
The studies involving human participants were reviewed and approved by University of California at Berkeley's Committee for Protection of Human Subjects CPHS # 2018-08-11324. The patients/participants provided their written informed consent to participate in this study.
DR devised and directed the study. EN identified and recruited partners, processed and cleaned the data, and drafted the manuscript with input from DR. EN and DR designed the survey, collected the data, and performed the data analysis. All authors contributed to the article and approved the submitted version.
This study was made possible through funding received by the University of California Institute of Transportation Studies from the State of California via the Public Transportation Account and the Road Repair and Accountability Act of 2017 (Senate Bill 1) (Grant number: UC-ITS-2019-18). Additional funding for this project was provided by UC Berkeley Safe Transportation and Research Education Center (SafeTREC) and the Collaborative Sciences Center for Road Safety (CSCRS), a U.S. Department of Transportation-funded National University Transportation Center led by the University of North Carolina at Chapel Hill's Highway Safety Research Center. Publication made possible in part by support from the Berkeley Research Impact Initiative (BRII) sponsored by the UC Berkeley Library.
The authors would like to thank the State of California for its support of university-based research, and especially for the funding received for this project. Additionally, the authors would like to thank Robert Prinz from Bike East Bay, Christopher White and Eliana Marcus-Tyler from the San Francisco Bicycle Coalition, and Michael Schwartz from Ride Report. Prior versions of this manuscript have previously been posted on the University of California Institute of Transportation Studies website, and on the Transportation Research Board website.
The authors declare that the research was conducted in the absence of any commercial or financial relationships that could be construed as a potential conflict of interest.
All claims expressed in this article are solely those of the authors and do not necessarily represent those of their affiliated organizations, or those of the publisher, the editors and the reviewers. Any product that may be evaluated in this article, or claim that may be made by its manufacturer, is not guaranteed or endorsed by the publisher.
Asbridge, M., Mann, R., Cusimano, M. D., Tallon, J. M., Pauley, C., and Rehm, J. (2014). Cycling-related crash risk and the role of cannabis and alcohol: a case-crossover study. Prevent. Med. 66, 80–86. doi: 10.1016/j.ypmed.2014.06.006
Avila-Palencia, I., de Nazelle, A., Cole-Hunter, T., Donaire-Gonzalez, D., Jerrett, M., Rodriguez, D. A., et al. (2017). The relationship between bicycle commuting and perceived stress: a cross-sectional study. BMJ Open 7, e013542. doi: 10.1136/bmjopen-2016-013542
Bernal, J. L., Cummins, S., and Gasparrini, A. (2017). Interrupted time series regression for the evaluation of public health interventions: a tutorial. Int. J. Epidemiol. 46, 348–55. doi: 10.1093/ije/dyw098
Caltrans District 4 (2018). Caltrans District 4 Bike Plan for the San Francisco Bay Area. Available online at: https://dot.ca.gov/-/media/dot-media/district-4/documents/d4-bike-plan/caltransd4bikeplan_report_lowres-r6.pdf (accessed June 28, 2023).
Carlin, J. B., Taylor, P., and Nolan, T. (1998). School based bicycle safety education and bicycle injuries in children: a case-control study. Injury Prevent. 4, 22–27. doi: 10.1136/ip.4.1.22
City of Alameda (2022). City of Alameda Active Transportation Plan Final Draft. Available online at: https://www.activealameda.org/files/sharedassets/transport/2022_11_17-alameda-atp_final.pdf (accessed June 28, 2023).
City of Berkeley (2017). City of Berkeley Bicycle Plan. Available online at: https://berkeleyca.gov/your-government/our-work/adopted-plans/berkeley-bicycle-plan (accessed June 28, 2023).
City of Oakland Department of Transportation (2019). Let's Bike Oakland, 2019. Oakland Bike Plan. Available online at: https://cao-94612.s3.amazonaws.com/documents/LBOakland_FinalDraft_20190807_web.pdf (accessed June 28, 2023).
City of Pleasanton (2018). City of Pleasanton Bicycle & Pedestrian Master Plan. Available online at: http://www.cityofpleasantonca.gov/civicax/filebank/blobdload.aspx?BlobID=32630 (accessed June 28, 2023).
Craig, C., Marshall, A., Sjöström, M., Bauman, A., Booth, M., Ainsworth, B., et al. (2003). International physical activity questionnaire: 12-country reliability and validity. Med. Sci. Sports Exer. 35, 1381–95. doi: 10.1249/01.MSS.0000078924.61453.FB
Dill, J., and McNeil, N. (2016). Revisiting the four types of cyclists: findings from a national survey. Transp. Res. Record J. Transp. Res. Board 2587, 90–99. doi: 10.3141/2587-11
EMC Research (2017). Oakland Bike Plan Update, Web Survey of Residents of Oakland, California. Available online at: https://cao-94612.s3.amazonaws.com/documents/EMC-Research-Survey_Jan2017_190603_231248.pdf (accessed June 28, 2023).
Fairlie, R. (2014). Race and the Digital Divide, September. Available online at: a https://escholarship.org/uc/item/48h8h99w (accessed June 28, 2023).
Flynn, B. S., Dana, G. S., Sears, J., and Aultman-Hall, L. (2012). Weather factor impacts on commuting to work by bicycle. Prev. Med. 54, 122–24. doi: 10.1016/j.ypmed.2011.11.002
Fraser, M. L., and Meuleners, L. B. (2020). Risk factors for unsafe events involving a motor vehicle for group riders (cyclists): a naturalistic case-crossover study. Accid. Anal. Prev. 146, 105758. doi: 10.1016/j.aap.2020.105758
Garrard, J., Rose, G., and Lo, S. K. (2008). Promoting transportation cycling for women: the role of bicycle infrastructure. Prev. Med. 46, 55–59. doi: 10.1016/j.ypmed.2007.07.010
Gatersleben, B., and Appleton, K. M. (2007). Contemplating cycling to work: attitudes and perceptions in different stages of change. Trans. Res. A Pol. Pract. 41, 302–12. doi: 10.1016/j.tra.2006.09.002
Harvey, C., Fang, K., and Rodriguez, D. (2019). Evaluating Alternative Measures of Bicycling ‘Level of Traffic Stress' Using Crowdsourced Route Satisfaction Data. San Jose, CA: Mineta Transportation Institute.
Johnson, R., and Margolis, S. (2013). A review of the effectiveness of adult cycle training in Tower Hamlets, London. Transp. Pol. 30, 254–61. doi: 10.1016/j.tranpol.2013.09.005
Karsch, H. M., Hedlund, J. H., Tison, J., and Leaf, W. A. (2012). Review of Studies on Pedestrian and Bicyclist Safety, 1991-2007. Tech Report DOT HS 811 614. United States: National Highway Traffic Safety Administration. Available online at: https://rosap.ntl.bts.gov/view/dot/1918 (accessed June 28, 2023).
Kloof, A., Bastiaanssen, J., and Martens, K. (2014). Bicycle lessons, activity participation and empowerment. Case Stud. Transp. Pol. 2, 89–95. doi: 10.1016/j.cstp.2014.06.006
Landis, J. R., and Koch, G. G. (1977). The measurement of observer agreement for categorical data. Biometrics 33, 159–74. doi: 10.2307/2529310
Le, H. T. K., Buehler, R., and Hankey, S. (2019). Have walking and bicycling increased in the US? A 13-year longitudinal analysis of traffic counts from 13 metropolitan areas. Transp. Res. D Transp. Environ. 69, 329–45. doi: 10.1016/j.trd.2019.02.006
League of American Bicyclists (2018). Bicycling and Walking in the United States: 2018 Benchmarking Report. Newport, RI: League of American Bicyclists. p. 417.
Porter, A. K., and Schwartz, M. (2018). Ride report: mobile app user guide. Br. J. Sports Med. 52, e4–e4. doi: 10.1136/bjsports-2017-098364
Prati, G. (2018). Gender equality and women's participation in transport cycling. J. Transp. Geography 66, 369–75. doi: 10.1016/j.jtrangeo.2017.11.003
Redelmeier, D. A., Tibshirani, R. J., and Evans, L. (2003). Traffic-law enforcement and risk of death from motor-vehicle crashes: case-crossover study. Lancet 361, 2177–82. doi: 10.1016/S0140-6736(03)13770-1
Richmond, S., Zhang, Y. J., Stover, A., Howard, A., and Macarthur, C. (2014). Prevention of bicycle-related injuries in children and youth: a systematic review of bicycle skills training interventions. Injury Prev. 20, 191–95. doi: 10.1136/injuryprev-2013-040933
Rissel, C., and Watkins, G. (2014). Impact on cycling behavior and weight loss of a national cycling skills program (AustCycle) in Australia 2010–2013. J. Transp. Health 1, 134–40. doi: 10.1016/j.jth.2014.01.002
Schneider, R. J., Kusch, J., Dressel, A., and Bernstein, R. (2018). Can a twelve-week intervention reduce barriers to bicycling among overweight adults in low-income latino and black communities? Transp. Res. F Traffic Psychol. Behav. 56, 99–112. doi: 10.1016/j.trf.2018.03.023
Sersli, S., DeVries, D., Gislason, M., Scott, N., and Winters, M. (2018). Changes in Bicycling Frequency in Children and Adults after Bicycle Skills Training: A Scoping Review. Transp.Res. A Pol. Pract. 123, 170–187. doi: 10.1016/j.tra.2018.07.012
Sersli, S., Scott, N., and Winters, M. (2019). Effectiveness of a bicycle skills training intervention on increasing bicycling and confidence: a longitudinal quasi-experimental study. J. Transp. Health 14, 100577. doi: 10.1016/j.jth.2019.100577
SF Municipal Transportation Agency (2013). SFMTA Bicycle Strategy. Available online at: https://www.sfmta.com/sites/default/files/BicycleStrategyFinal-accessible_0.pdf (accessed June 28, 2023).
Stappers, N. E. H., Van Kann, D. H. H., Ettema, D., De Vries, N. K., and Kremers, S. P. J. (2018). The effect of infrastructural changes in the built environment on physical activity, active transportation and sedentary behavior – a systematic review. Health Place 53, 135–49. doi: 10.1016/j.healthplace.2018.08.002
Telfer, B., Rissel, C., Bindon, J., and Bosch, T. (2006). Encouraging cycling through a pilot cycling proficiency training program among adults in Central Sydney. J. Sci. Med. Sport 9, 151–156. doi: 10.1016/j.jsams.2005.06.001
Transport for London (2016). Adult Cycle Training Monitoring Final Report Financial Year 2014/15. London: Transport for London.
Turner, J. R. (2013). Case-crossover studies. In: Gellman, M. D., and Turner, J. R., editor. Encyclopedia of Behavioral Medicine. New York, NY: Springer New York. p. 357–358.
US Department of Transportation and Bureau of Transportation Statistics (2003). Freedom to Travel. BTS03-08. Washington, DC: US Department of Transportation and Bureau of Transportation Statistics
Keywords: bicycle education, bicycle skills training, classroom, bicycle activity, bicycle knowledge, bicycle mode choice, travel surveys, travel behavior
Citation: Nachman ER and Rodriguez DA (2023) Evaluating the effects of a classroom-based bicycle education intervention on bicycle activity, self-efficacy, personal safety, knowledge, and mode choice. Front. Sustain. Cities 5:1098473. doi: 10.3389/frsc.2023.1098473
Received: 15 November 2022; Accepted: 20 June 2023;
Published: 14 July 2023.
Edited by:
Paolo Santi, Massachusetts Institute of Technology, United StatesReviewed by:
Tim Jones, Oxford Brookes University, United KingdomCopyright © 2023 Nachman and Rodriguez. This is an open-access article distributed under the terms of the Creative Commons Attribution License (CC BY). The use, distribution or reproduction in other forums is permitted, provided the original author(s) and the copyright owner(s) are credited and that the original publication in this journal is cited, in accordance with accepted academic practice. No use, distribution or reproduction is permitted which does not comply with these terms.
*Correspondence: Daniel A. Rodriguez, ZGFucm9kQGJlcmtlbGV5LmVkdQ==
Disclaimer: All claims expressed in this article are solely those of the authors and do not necessarily represent those of their affiliated organizations, or those of the publisher, the editors and the reviewers. Any product that may be evaluated in this article or claim that may be made by its manufacturer is not guaranteed or endorsed by the publisher.
Research integrity at Frontiers
Learn more about the work of our research integrity team to safeguard the quality of each article we publish.