 Prashant Kumar Chauhan1
 Abhay Kumar Singh
95% of researchers rate our articles as excellent or good
Learn more about the work of our research integrity team to safeguard the quality of each article we publish.
Find out more
ORIGINAL RESEARCH article
Front. Sustain. Cities , 02 August 2022
Sec. Climate Change and Cities
Volume 4 - 2022 | https://doi.org/10.3389/frsc.2022.909351
Particulate matter (PM) concentrations and aerosol optical depth (AOD) are measured and correlated simultaneously using a high-volume sampler and a MICROTOPS-II Sunphotometer, respectively. The present work deals with the characteristics of particulate matter (PM1, PM2.5, and PM10) over Varanasi, from April 2019 to March 2020. Daily variation, as well as seasonal variation, reveals the dominancy of fine-mode particles over the Varanasi region in the winter season and the dominancy of coarse-mode particles in the summer season, which was further confirmed by calculating the ratio between particulate matter (PM1/PM10 and PM2.5/PM10). This ratio was discovered to be lowest in the summer and highest in the winter. Annual mean concentrations of PM1, PM2.5, and PM10 are found to be 93.91, 111.34, and 180.70 μgm−3, respectively. The seasonal variation shows relatively a higher concentration of PM1, PM2.5, and PM10 in the winter season, which may be due to stable meteorological conditions and increased biomass burning in winter. Diurnal and seasonal variations in AOD were also studied during this period. A large and small value of AOD represents the dominancy of fine particles over coarse particles. At 500 nm, maximum (1.17) and minimum (0.44) AODs were measured in December and August of 2019, respectively. There was a statistically significant correlation between PM particles (PM1, PM2.5, and PM10) and AOD. Elemental analysis shows that fluorine and carbon are the major elements that were observed in selected samples during the post-monsoon and winter season using SEM-EDX analysis.
A primary atmospheric component of air pollution, i.e., particulate matter (PM), has become a major source of concern all around the world due to its negative impacts on air quality, human health, and the earth's ecosystem (Chowdhury and Dey, 2016; Ghude et al., 2016; Seinfeld et al., 2016; Singh et al., 2016a). Air pollution is one of the leading causes of sickness. Due to severely poor air quality, several cities in India have been named among the top 20 most polluted cities in the world during the previous few decades, with eleven of them being on the Indo-Gangetic Plain (IGP) (Garaga et al., 2018). Furthermore, it is the world's fourth leading cause of premature mortality, according to the reports (Cohen et al., 2017). PM10, PM2.5, and PM1 refer to airborne particulate matter having aerodynamic diameters of ≤ 10 μm, ≤ 2.5 μm, and ≤ 1 μm, respectively, and can also be considered as coarse-mode, fine-mode, and accumulation-mode particles, respectively (Spandana et al., 2021). PM2.5 and PM1 are significantly more harmful than PM10 due to their complexity and smaller size (Miri et al., 2016, 2017; Li et al., 2017). Industry, power plants, three-wheelers, and other combustion activities are all responsible for the production of PM, which comes from both primary emission and chemical alteration of precursor gases, which results in secondary particles (Rahman et al., 2020). In the recent years, urbanization, industrialization, and anthropogenic activities have led to an increase in PM concentrations in the surrounding atmosphere. Due to the proliferation of these types of activities, major cities throughout the world have faced severe air quality concerns, since the middle of the twentieth century (Cheng et al., 2013; Elbayoumi et al., 2013). Particles produced from both natural and anthropogenic sources make up PM in the atmosphere (Kaufman et al., 2005). PM can travel a long distance from its source if the atmospheric conditions are favorable (Ancelet et al., 2015; Tiwari et al., 2018, 2019). Increased quantities of particulate matter (PM) pose a regional and global environmental threat (Delfino et al., 2005; Obaidullah et al., 2012). Particulate matter (PM) plays a significant role in disrupting the Earth's radiative budget by absorption and scattering of incoming solar radiation and outgoing long wave radiation. They also play a role in cloud formation, through which they also have an impact on cloud lifespan and the precipitation process (Wang and Penner, 2009; Seinfeld et al., 2016; Tiwari et al., 2018). Depending on the dominant activity, such as light absorption or scattering, PM can operate as both a cooling and warming agent in the atmosphere (Myhre, 2009). The scattering and absorption coefficients of a particle are determined by its physical and chemical characteristics. As a result of this coefficient, air particulates generate regional smog, discoloration, texture loss, and invisibility in a specific area (Malm and Day, 2000). PM2.5 and PM1 have a harmful impact on human health because they can enter into alveoli through the respiratory system, causing lung illnesses, heart attacks, neurological disorders, and other health problems, while PM10 affects the atmosphere's radiation balance as well as visibility (Salma et al., 2002; Pope et al., 2008). According to the research, high PM2.5 exposures can also damage brain development in new born babies and children (Egondi et al., 2018). About 1.24 million deaths happened in India out of the 5 million deaths that happen globally because of air pollution, 54% of which are attributed to ambient particulate matter (Balakrishnan et al., 2019). Due to westerly/south-westerly winds in conjunction with dry weather conditions, IGP experiences a sudden and intense dust storm during the pre-monsoon season. These dust storms carry coarse-mode particles from Southeast Asia and the Thar Desert (Tiwari and Singh, 2013; Kumar et al., 2015a; Singh et al., 2016b; Tiwari et al., 2019). Due to the increasing aggregation of coarse-mode particles, air quality and visibility have deteriorated (Smith et al., 2019; Taneja et al., 2020). Paddy residue is widely burnt in Haryana and Punjab every year during the post-monsoon season, which is a major source of air pollution (Kumar et al., 2016; Singh et al., 2016a; Ojha et al., 2020). IGP has a higher particulate matter concentration due to the low height of the atmospheric boundary layer, low wind speeds, and increased amount of wood burning during the winter time, which reduces visibility (Massie et al., 2004; Rajesh and Ramachandran, 2017; Ali et al., 2019). In 2016, an analysis of haze episodes in Delhi using applied carbon tracers revealed that the burning of agricultural waste was the dominant source of pollution (Sawlani et al., 2019). Aerosol optical depth (AOD) is a measure that is used to assess PM concentrations and to describe air quality and atmospheric conditions, and the extinction of incoming solar radiation by air particles distributed in a vertical column of the atmosphere can also be evaluated by this quantity (Kompalli et al., 2010; Dey et al., 2012; Srivastava et al., 2014). The concentrations of PM10 and PM2.5 have a significant connection with AOD (Srivastava et al., 2012a; Xin et al., 2014). Apart from this, the Moderate Resolution Imaging Spectroradiometer (MODIS) satellite data are widely utilized to investigate atmospheric processes and climate change because they have good spatial and temporal coverage (1° × 1°) (Kaufman et al., 2002). Tiwari and Singh (2013) used MODIS Terra data for 12 months above Varanasi in 2011. MODIS data are accessible on the NASA Giovanni website free of cost. The research was conducted utilizing a standard MICROTOPS-II Sunphotometer during the year 2019–2020, and it included a comparison of the ground-based measurement of AOD to those obtained by satellite using level 3 MODIS data. To observe the morphology, structure, and chemical composition of PM, some collected samples have been characterized through scanning electron microscope-energy dispersive X-ray spectrometry (SEM-EDX). Over Varanasi, only a few studies have been reported on the chemical characteristics of particulate matter and the sources of its emissions (Murari et al., 2016; Tiwari et al., 2016; Pratap et al., 2020a). Prior research has found that the PM2.5/PM10 ratio has a substantial temporal variability and a fine correlation with climatic factors such as temperature, wind speed, and relative humidity (Akinlade et al., 2015; Speranza et al., 2016; Mukherjee and Agrawal, 2017). Although few researchers have evaluated the properties of pollutants over the IGP, they have been only limited to a specific proportion of particles (either PM10 or PM2.5) through which the evolution of anthropogenic activities could have been understood (Saxena et al., 2017; Jain et al., 2019). Thus, this study analyses the variation in the concentration of PM1, PM2.5, and PM10 and its correlation with aerosol optical depth during pre-monsoon and post-monsoon season at BHU, Varanasi, situated in central Ganges Valley. Using an NOAA Hybrid Single-Particle Lagrangian Integrated Trajectory (HYSPLIT), 5-day air mass back trajectories at three different heights such as 500, 1,000, and 1,500 m have been displayed for the selected day every month to identify the regional or transboundary origin of particles (Draxler and Rolph, 2003).
During the study period (April 2019–March 2020), particulate matter monitoring is carried out on the rooftop of the Department of Physics at Banaras Hindu University (BHU), Varanasi. Varanasi (25.26° N, 82.99° E, 83 m above mean sea level) is situated in the eastern part of Uttar Pradesh, which is a semi-urban city in the central Gangetic Plain and has various sources of contaminated pollutants and suffers from high particulate loading (Ram and Sarin, 2011; Tiwari and Singh, 2013; Kumar et al., 2015b; Tiwari et al., 2018). The Indo-Gangetic Plain (IGP) runs parallel to the Himalayan range, having a stretch of 2400 km from Jammu and Kashmir in the west to the Assam in the east, and has a significant aerosol hotspot of air contaminants due to its unique geomorphology, weather patterns, and climatic susceptibility (Dey et al., 2004; Ramachandran and Kedia, 2010; Srivastava et al., 2012b; Kumar et al., 2020; Pratap et al., 2020a). During the pre-monsoon season in which hot and dry summer exists, coarse-mode aerosol prevails, and extreme rainfall occurs during monsoon whereas an excess of fine-mode aerosols in extremely cold weather during winter and post-monsoon was reported (Satheesh et al., 2006; Tiwari et al., 2018).
Meteorological conditions over Varanasi during this study period from 01 April 2019 to 31 March 2020 are shown in Figure 1. Varanasi is extremely hot in the summer and humid in the monsoon while being outstandingly cold in the winter season. During the study period, temperature (°C), relative humidity (%), and wind speed (ms−1) data are downloaded from the CPCB portal. The relative humidity, temperature, and wind speed were plotted jointly. The average relative humidity is found to be 61.58%, while the minimum and maximum relative humidities are 17.20 and 90% in May and September, respectively. The mean temperature is found to be 25.23°C while the minimum and maximum temperatures are 4.04 and 40.49°C in December and April, respectively. The average wind speed is found to be 1.34 ms−1 while the minimum and maximum wind speeds are 0.30 and 5.64 ms−1 in August, respectively.
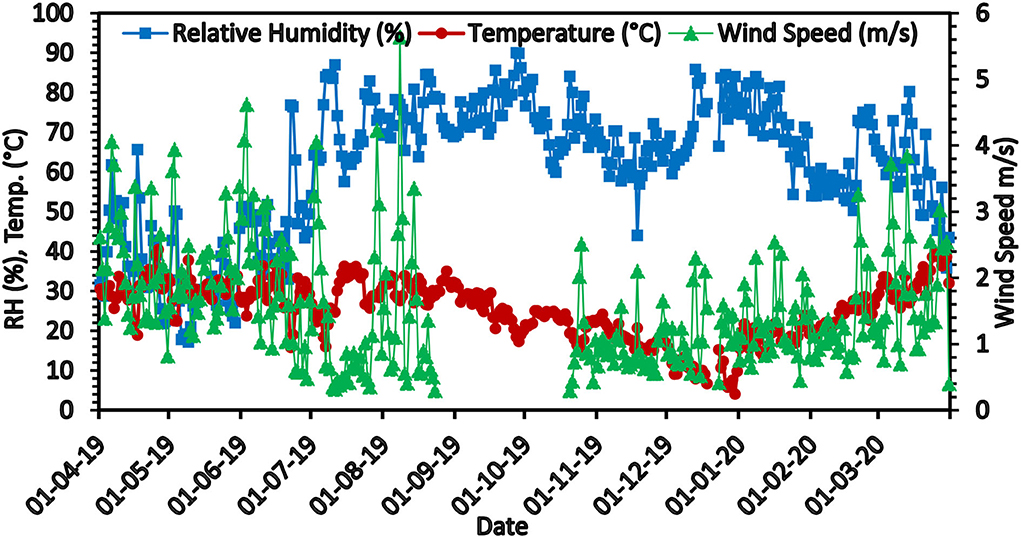
Figure 1. Meteorological parameters (temperature, relative humidity, and wind speed) during the study period.
Particulate matter samples were collected two times a week for 24 h using three Envirotech Pvt Ltd respirable dust samplers: Model no. APM 460 NL respirable dust samplers for collecting PM10, APM 550 for PM2.5 with a sampling rate of 16.7 lpm, and APM 577 with a sampling rate of 10 lpm for PM1 dust samples for further analysis of their mass concentrations and elemental analysis during the study period (Bansal et al., 2019; Sah et al., 2019). Coarse-mode particulates (PM10) are aggregated on a GF/A 8 × 10 in glass microfiber filter paper whereas fine particles (PM2.5 and PM1) are collected on a 2-μm PTFE microfiber filter paper of 46.2 mm diameter. The gravimetric method is used to calculate particulate matter concentration. For moisture removal, the filter papers were kept in desiccators for 24 h before and after sampling.
The Moderate Resolution Imaging Spectroradiometer is used to monitor the ocean, land, and atmosphere. This instrument is onboard Terra and Aqua satellites, launched in December 1999 and May 2002 (Alam et al., 2014). MODIS provides daily global dust data in 36 spectral bands from visible to thermal infrared (0.41–14.38 μm) (Sharma et al., 2012). The MODIS global gridded level 3 aerosol products is derived from the level 2 MODIS product with 10 km of spatial resolution (Remer et al., 2005). The MODIS equipment does a full scan of the earth's surface once every 1 to 2 days. At the local solar time, 10:30 in the morning and 01:30 in the afternoon, respectively, the Terra and Aqua satellites pass over the Indian Territory. The daily AOD satellite data from MODIS on-board Terra satellite level 3 AOD (mean_MOD08_D3_6_1_Deep_Blue_Aerosol_Optical_Depth_550_Land_Mean) for 1° × 1° grid from April 2019 to March 2020 over Varanasi were collected at 550 nm wavelength.
Ground-based AOD observations were made about three times a week during clear sky conditions from 10:00 to 15:00 h using a portable multi-band MICROTOPS-II (MT-II) Sunphotometer (Solar Light Company, USA). It is a five-channel handheld sunphotometer that gives instantaneous columnar AODs at five wavelengths: 380, 440, 500, 675, and 870 nm. The MT-II Sunphotometer has a 2.5° field of view. The MT includes temperature and pressure sensors associated with GPS connectivity for obtaining position and time coordinates (Morys et al., 2001). This instrument is based on the principle of measuring the intensity of incoming solar radiation at specific wavelengths and then converting it to optical depth using the Langley method. In this study, a considerable correlation of spectral and seasonal AOD with the particulate matter was observed.
A computer-controlled SEM coupled with EDX was used to characterize the morphology and elemental analysis of airborne particles. This instrument is made by Carl Zeiss Microscopy in Germany. The main filter paper was randomly sliced into a 1-mm2 sample for the investigation of elemental composition and surface morphology (Pratap et al., 2020a). To achieve more favorable secondary images and to make them electrically conductive, the samples were sputtered with gold. The EDX spectrum of airborne particulate was recorded at 15–30 KV (Murari et al., 2016). For qualitatively spectra, elements were measured at different points.
Using a high-volume sampler, the mass concentration of particulate matter was measured over Varanasi from April 2019 to March 2020. In Figure 2, the daily variation in mass concentrations of PM1, PM2.5, and PM10 is shown. Mean mass concentration from April 2019 to March 2020 was found to be 89.9±44.4 for PM1, 106.5±67.2 for PM2.5, and 180.8±71.4 μg/m3 for PM10, respectively. Most of the time mass concentrations of particulate matter were found to be exceeded the NAAQS limit (40 μg/m3 for PM2.5 and 60 μg/m3 for PM10). A similar result was reported by Kumar et al. (2020) in Varanasi. Murari et al. (2017) reported that annual mass concentrations of PM10 and PM2.5 were found to be 161.3 and 81.8 μg/m3, respectively, in 2014 over Varanasi. Jain et al. (2021) found the average concentration of PM10 and PM2.5 in Varanasi was 257.90 and 99.33 μg/m3, respectively from January 2015 to December 2016. Singh et al. (2021) recorded mean mass concentrations of daily PM10 and PM2.5 of 239 ± 128 and 123 ± 89 μg/m3, respectively, during the period from July 2014 to June 2018 over Varanasi. The seasonal behavior of PM1, PM2.5, and PM10 reported in the previous studies in IGP is also shown in Table 1. Mass concentrations of particulate matter depend on different seasons which are shown in Figure 3. As per data available, we have considered October as a post-monsoon season, November–February as the winter season, March as a transition period named as the spring season, and April–June took as the summer season (Prasad and Singh, 2009; Kumar et al., 2021). Mass concentration of PM1 for post-monsoon, winter and spring was found to be, 104.6±43.2, and 57.5±31.8 μg/m3, respectively. Mass concentration of PM1 for the summer season was not available. Mass concentration of PM2.5 during post-monsoon, winter, spring, and summer was found to be 79.0±19.6, 156.1±59.3, 82.0±31.3, and 43.5±19.7 μg/m3 respectively. Additionally, the mass concentration of PM10 during post-monsoon, winter, spring, and summer was found to be 142.5±47.9, 224.0±70.8, 127.6±30.0, and 139.6±40.2 μg/m3, respectively. It can be observed that the higher concentration of PM1, PM2.5, and PM10 was found to be in the winter season. Winter is a season of stable meteorological conditions, calm wind, cold weather, and increased biomass burning as well as increased vehicular emissions (Guttikunda and Calori, 2013; Banerjee et al., 2015). Most importantly, the atmospheric boundary layer shifted downward and particulate matter gets trapped in the lower atmosphere (Li et al., 2020).
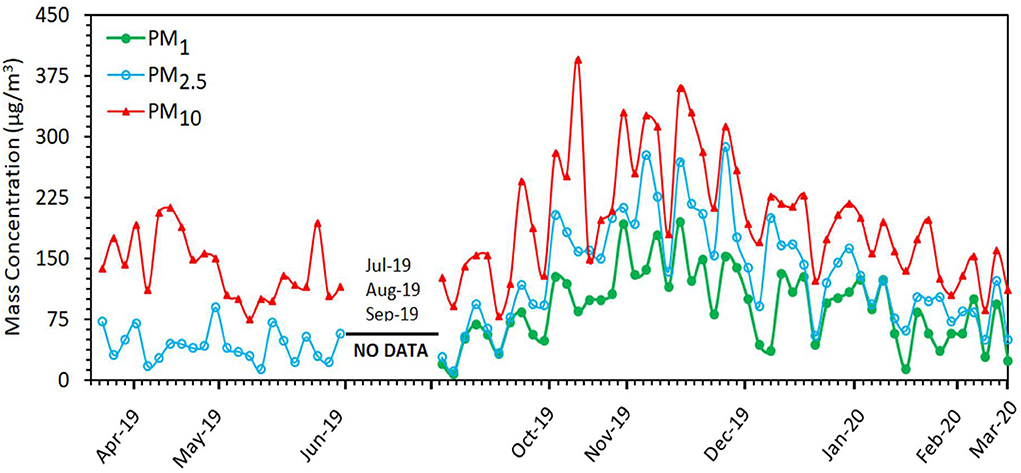
Figure 2. Daily variation in mass concentration of particulate matters (PM1, PM2.5, and PM10) from April 2019 to March 2020 over Varanasi.
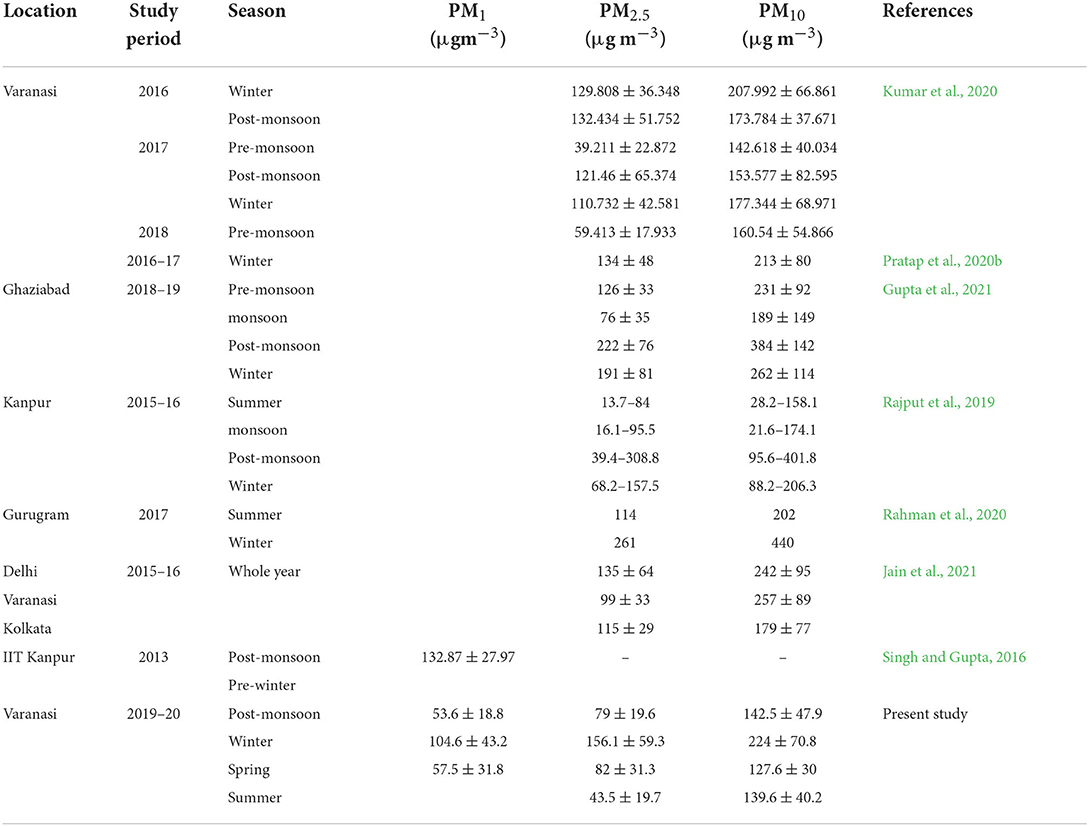
Table 1. Previous study of PM1, PM2.5, and PM10 samples at different locations in IGP.
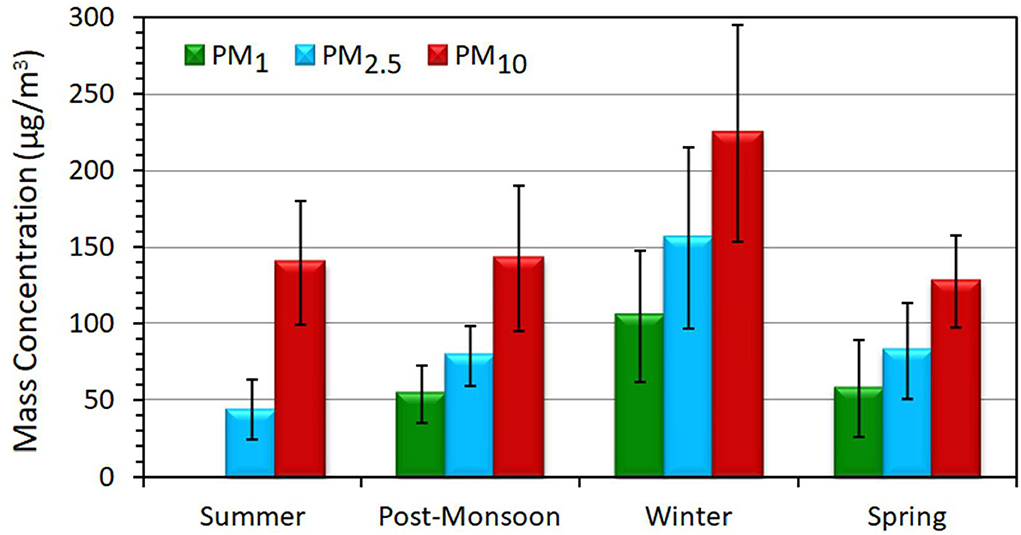
Figure 3. Seasonal variation in mass concentration of particulate matter (PM1, PM2.5, and PM10) from April 2019 to March 2020 over Varanasi.
To identify the dominant contribution of mass concentration in different months and seasons, the ratio of PM1 and PM2.5 to PM10 was calculated. The monthly variation in the ratio of particulate matter is shown in Figure 4, and the seasonal variation in the ratio of particulate matter is shown in Figure 5. From Figure 4, the ratio of PM2.5/PM10 was found to be < 0.4 in April, May, and June 2019, which suggests the dominancy of coarse-mode aerosol particles. On the other hand, this ratio was found to be >0.5 in the other months and was highest in November and December (>0.7), which suggests an increase in fine-mode aerosol particles. Similar results for the ratio PM1/PM10 were found (this ratio is not shown in April, May, and June 2019 due to data unavailability). Concentrations of particulate matter depend on the different seasons (Pratap et al., 2020a,b), which are shown in Figure 5. The ratio of PM2.5/PM10 was found to be lower (0.4) in the summer season, which suggests the dominancy of coarse-mode particles. It may be due to the dust transportation from mid-arid regions and the Thar Desert over the Indo-Gangetic Basin (Kumar et al., 2015b; Murari et al., 2015; Tiwari et al., 2019). On the other hand, ratios of PM1/PM10 and PM2.5/PM10 were found to be higher in the winter and spring seasons, which suggests the enhancement of fine-mode particles. Punjab and Haryana states are considered the largest regions of crop residue burning, which leads to fine aerosol loading during post-monsoon as well as during winter seasons. These aerosol particles have transport properties and hence get transported long distances, which may cover the whole Indo-Gangetic Plain (Kaskaoutis et al., 2014). The ratio of PM2.5/PM10 and PM1/PM10 was found to be relatively higher in the post-monsoon as compared to the summer season. It may be due to the washout of coarser particles from the atmosphere while smaller particles remain suspended in the atmosphere. It is also reported that crop residue burning is intense over the Indo-Gangetic Plain during the post-monsoon season, causing an increase in fine-mode particles (Sarkar et al., 2018).
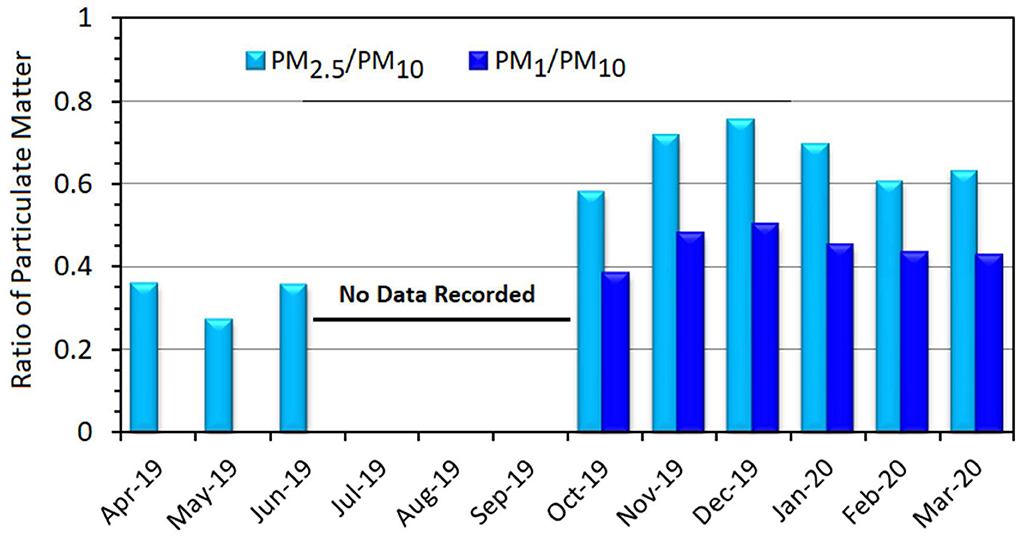
Figure 4. Daily variation in the ratio of particulate matters (PM1, PM2.5 with PM10) from April 2019 to March 2020 over Varanasi.
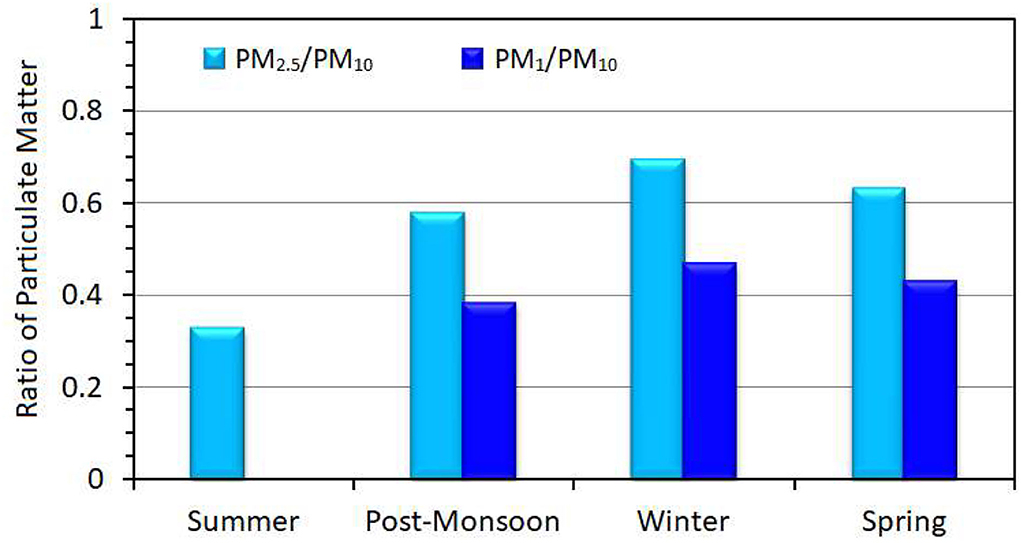
Figure 5. Seasonal variation in the ratio of particulate matters (PM1, PM2.5 with PM10) from April 2019 to March 2020 over Varanasi.
During the sampling period from April 2019 to March 2020, the monthly mean spectral fluctuation of AOD at five distinct wavelengths (380, 440, 500, 675, and 870 nm) derived from the ground-based MICROTOPS II Sunphotometer over Varanasi is shown in Figure 6. The spectral fluctuation of AOD demonstrates rather plainly that the AOD was found to be substantially greater at shorter wavelengths, which can be due to the presence of fine particles, while the AOD was observed to be comparatively lower at longer wavelengths, which can be attributed to the presence of coarse particles (Reddy et al., 2011). A seasonal variation in AOD at five distinct wavelengths was also measured by the MICROTOPS-II Sunphotometer as shown in Figure 7. AOD at all five distinct wavelengths is found to be maximum during the post-monsoon season followed by winter, while it is minimum in the monsoon except for the summer season. The reason for the low value of AOD during the monsoon season could be the washout of aerosol particles from the atmosphere during rainfall (Dey and Di Girolamo, 2010; Lodhi et al., 2013; Tiwari and Singh, 2013), and crop residue burning during the winter season could be the reason for higher AOD (Kaskaoutis et al., 2014; Sarkar et al., 2018). In the summer season, AOD has an increasing trend and found maximum at 870 nm. Generally, dust storms are formed in the summer, which can be the reason for the presence of coarse particles. The daily average of AOD over Varanasi was found to be ranged from 0.2 to 2.0. AODs from MODIS and MICROTOPS-II are measured at 550 and 500 nm, respectively (Tiwari and Singh, 2013). Using the Angstrom power law (equation 1), the MICROTOPS-II AOD at 500 nm was calculated at a wavelength of 550 nm to validate the MODIS and MICROTOPS-II Sunphotometer. Angstrom's power law is given as Ångström (1964).
where α is angstrom exponent (AE). For two different wavelengths (λ1 and λ2), AE is given by
Angstrom exponent (wavelength range 380–870 nm) is a measure of the aerosol particle size and a fraction of fine to coarse-mode aerosols (Tiwari et al., 2018). AOD loading is observed to have large seasonal fluctuations, which are obtained higher in the winter season (November–February) and lower during the monsoon season (July–September). Over Varanasi, we found that satellite and ground-measured AOD data have an excellent one-to-one correlation, as shown in Figure 8. It has been observed that the total correlation coefficient between MODIS and MICROTOPS-II AOD data is 0.59. Later, diurnal variation in MODIS and MICROTOPS-II Sunphotometer AOD data at 550 nm is observed during this study period, as shown in Figure 9.
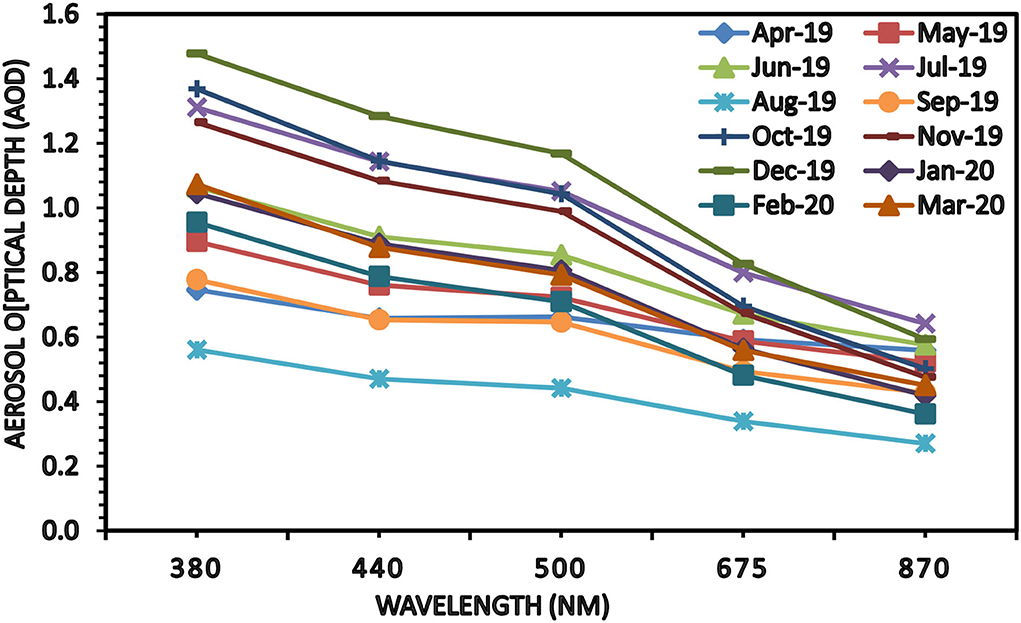
Figure 6. Spectral variation in AOD at different wavelengths 380, 440, 500, 675, and 870 nm over Varanasi during the study period (April 2019–March 2020).
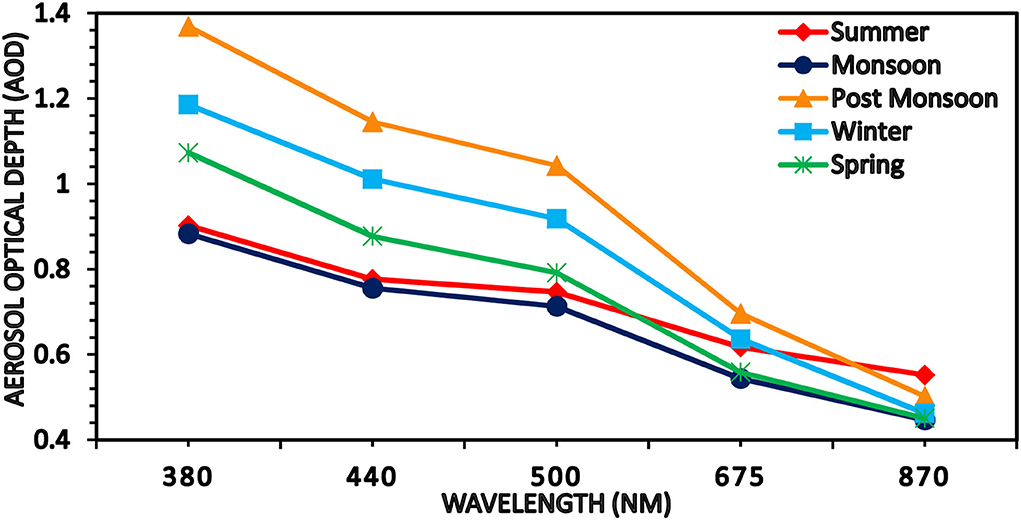
Figure 7. Seasonal variation in AOD over Varanasi using MICROTOPS-II Sunphotometer during April 2019–March 2020.
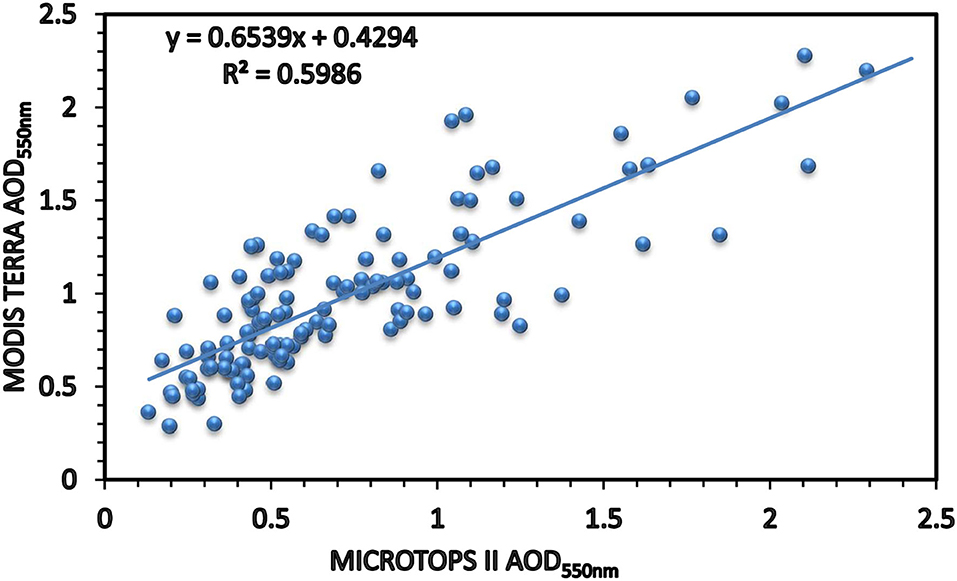
Figure 8. Validation of level 3 MODIS AOD over Varanasi using MICROTOPS-II AOD, at 550 nm, during the study period (April 2019–March 2020).
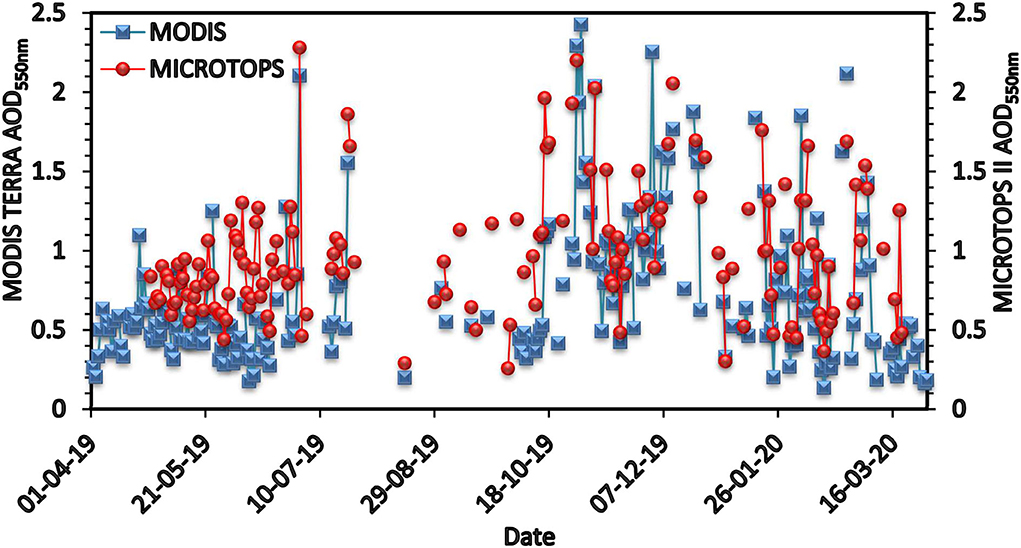
Figure 9. Comparison of MODIS AOD at 550 nm with the MICROTOPS-II at time of pass of Terra satellite over Varanasi during the study period (April 2019–March 2020).
Figure 10 depicts the relationship between MICROTOPS—II AOD (500 nm) and particulate matter (PM10, PM2.5, and PM1). AOD data were chosen for the day when PM data were available. Sometimes, AOD was not available for the day on which PM data were available. So, one-to-one corresponding data are only correlated. A total of 37 samples of PM10 and PM2.5 have been chosen, whereas 21 samples of PM1 have been chosen for this correlation. PM10 has apositive correlation with R2 = 0.42, PM2.5 has a positive correlation with R2 = 0.44, and PM1 has a positive correlation with R2 = 0.43, respectively. Concentrations of particulate matter have a significant effect on AOD since an increment in the concentration of PM leads to an enhancement of AOD, which suggests a positive relationship. Similarly, during the monsoon season, when particles are washed out of the atmosphere, the PM concentrations decreased, and hence, the AOD also decreased.
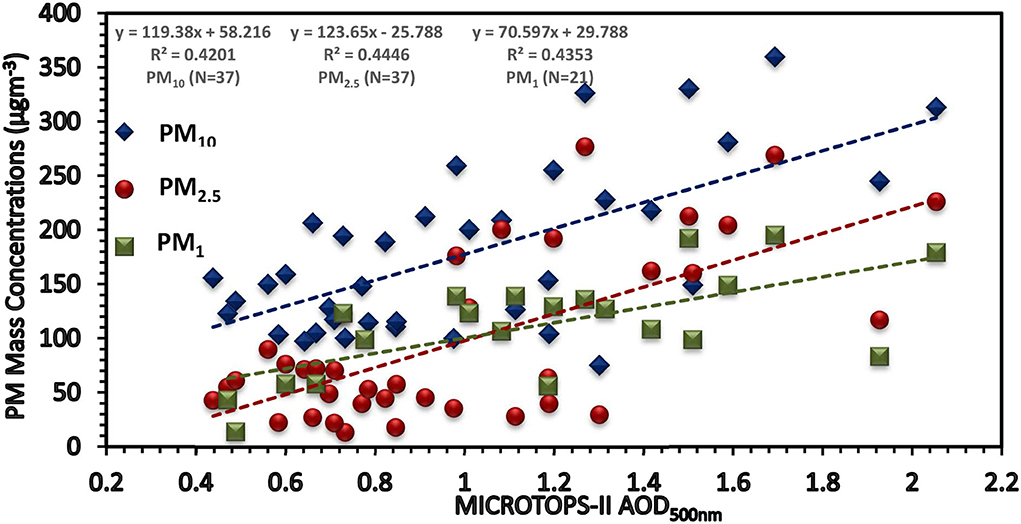
Figure 10. Correlation between MICROTOPS-II AOD (500 nm) and particulate matters (PM1, PM2.5, and PM10).
The elemental analysis of PM is also a significant factor that impacts the scattering nature of particulates. The various constituents' weight percentages of PM2.5 samples were measured throughout the investigation, which is summarized in Table 2. We have studied the chemical concentration of five PM2.5 samples. The order of these compositions is F > O > C > N > Al > K > S > Mg > Si > Cl > Na, C > F > O > S > K > Si > Cl > Al > Mg >Na, F > C > O > N > Cl > K > S > Mg > Si > Na >Al, F > C > O > N > Cl > Si > Na > K > Al > S, and F > C > O > N > Si > Cl > K > Mg > S > Na >Al in October 2019, November 2019, December 2019, January 2020, and February 2020, respectively, as shown in Figure 11. These samples are found to be rich in F, O, C, and N. The concentration of fluorine is higher in all months except November. The use of firecrackers during Diwali may contribute to carbon emissions. Carbon is the second highest contributor to PM2.5 samples during the winter season due to crop residual burning and anthropogenic activities. The lesser contributions of Mg, Si, Na, S, and Al have been found during the study period due to other anthropogenic activities (Liu et al., 2019).
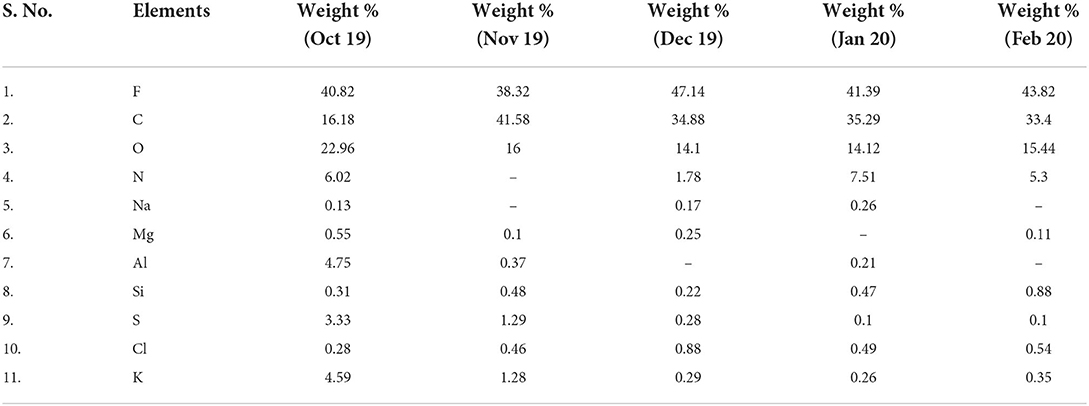
Table 2. Weight % (±standard deviation) of the elements quantified in the PM2.5 sample during the study period.
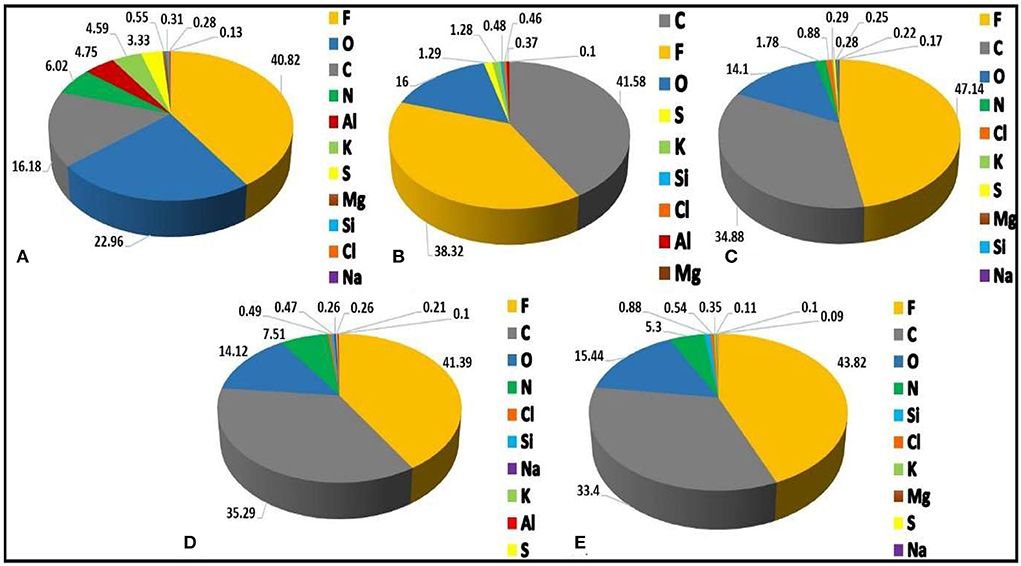
Figure 11. Percentage (%) elemental composition particulate samples for PM2.5on (A) 28 October 2019, (B) 15 November 2019, (C) 31 December 2019, (D) 12 January 2020, (E) 11 February 2020.
The National Oceanic and Atmospheric Administration (NOAA) Hybrid Single Particle Lagrangian Integrated Trajectories (HYSPLIT) model, which uses NCEP reanalysis wind data as input, computes 5 days of air mass back trajectories at three different altitudes of 500, 1,000, and 1,500 m above ground level at the receptor site (Draxler and Rolph, 2003). Back trajectories are crucial for identifying source regions, transport channels, and aerosol characteristics. About 5-day air mass back trajectory for nine selected days during the study period on 30 April 2019, 30 May 2019, 09 June 2019, 28 October 2019, 15 November 2019, 31 December 2019, 12 January 2020, 11 February 2020, and 10 March 2020 is shown in Figure 12. On the 30th of April 2019, air masses appeared to be coming from Saudi Arabia and Pakistan at high altitudes (1,500 and 1,000 m) and from Rajasthan at lower altitudes. On 30 May 2019, air masses seemed to come from high-altitude regions such as Russia, Kazakhstan, and Turkey. On 9 June 2019, an air mass at a high altitude comes from Georgia and the area around Kazakhstan. Before it gets to the sampling site at a low altitude, it goes through the Bay of Bengal. On the 28th of October 2019, the high-altitude wind comes from the Caspian Sea and Pakistan, while Uttar Pradesh is the source region for low-level wind. On 15 November 2019, all three-level winds (1,500, 1,000, and 500 m) came from Pakistan. On 31 December 2019, high-altitude wind at 1,500 m comes from Kazakhstan, 1,000 m wind comes from China, and low-level wind comes from Madhya Pradesh. On the 12th of January 2020, air masses appeared to be coming from Iraq and Saudi Arabia at high altitudes (1,500 and 1,000 m) and from Uzbekistan at lower altitudes. On 11 February 2020, the high-altitude wind seems to come from Nepal; the wind at 1,000 m comes from Rajasthan, and the low-level wind seems to come from Kazakhstan. On 10 March 2020, a low-altitude air mass arrives from Georgia, while high-altitude wind arrives from the Arabian Gulf and Syria.
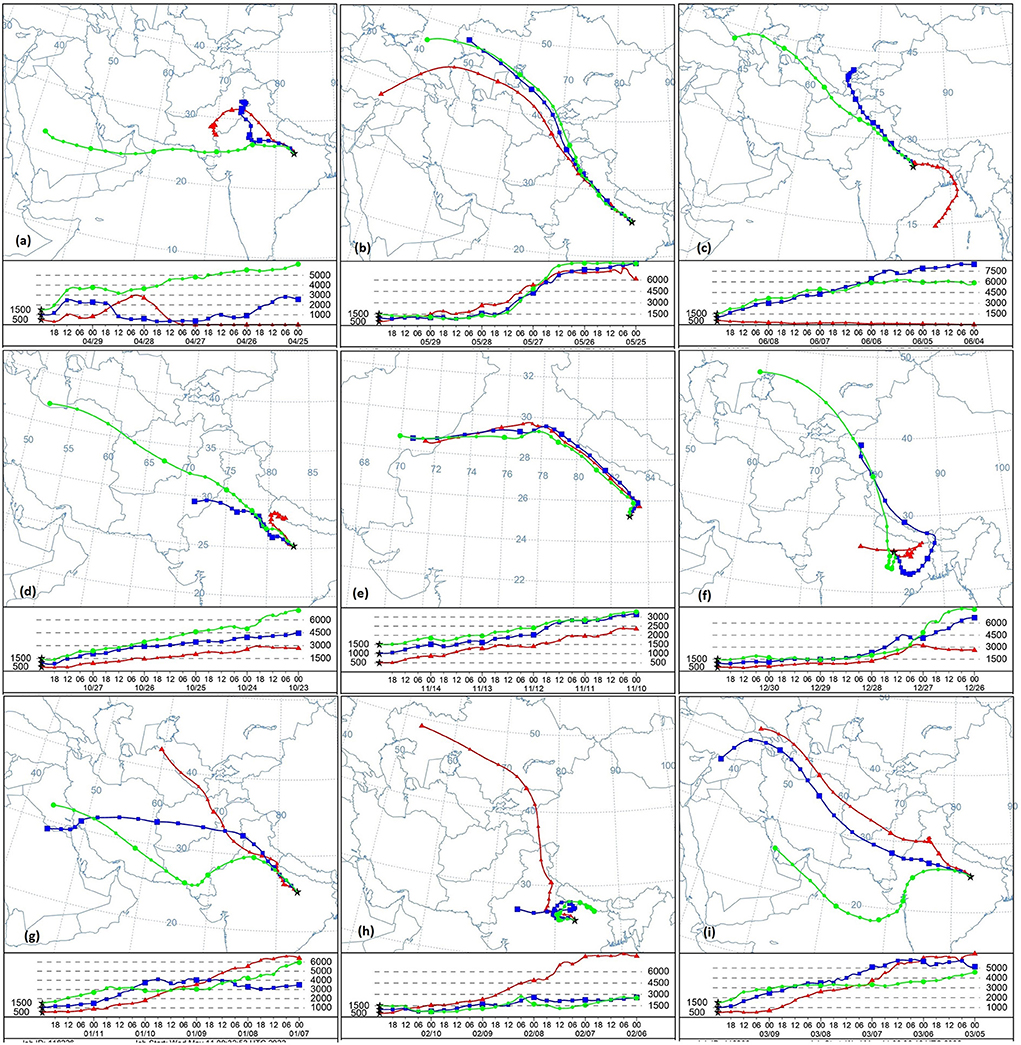
Figure 12. About 5 days back trajectories derived from HYSPLIT model for Varanasi for nine typical days having large aerosol loading on (a) 30 April 2019, (b) 30 May 2019, (c) 09 June 2019, (d) 28 October 2019, (e) 15 November 2019, (f) 31 December 2019, (g) 12 January 2020, (h) 11 February 2020, (i) 10 March 2020.
MICROTOPS-II AOD (500 nm) and particulate matters (PM1, PM2.5, and PM10) over Varanasi, from April 2019 to March 2020, were observed and analyzed daily, monthly as well as seasonally. Elemental analysis of five samples was also done through SEM-EDX analysis. The primary findings and outcomes of the study are presented here:
During the given period, mass concentrations of PM1, PM2.5, and PM10 were found to be higher as compared to the NAAQS standard limit. In addition, mass concentration was found to be higher in the winter season while lower in the summer season. By calculating the ratio of PM1 and PM2.5 to PM10, the dominancy of fine-mode particles in the winter season due to crop residue burning and vehicular emissions was found. While in the summer season, dominancy of coarse-mode particles was found due to dust storms.
Maximum AOD is obtained at a low wavelength while AOD is found to be minimum at a higher wavelength, which shows the presence of a greater concentration of fine particles than coarse particles. The seasonal variation in AOD was found to be maximum during the post-monsoon season and minimum during the monsoon season. Higher AOD at a higher wavelength shows the dominancy of coarse-mode particles during the summer season.
Aerosol optical depth produced by the MODIS Terra satellite and AOD measured by MICROTOPS II have a good correlation with R2 = 0.5986. The mean values of MODIS AOD and MICROTOPS AOD were 0.72 and 0.97, respectively. The correlation between AOD and particulate matter (PM10, PM2.5, and PM1) was found to be positive and very good.
The dominance of different elements such as F, C, O, and N occurred over five samples (Teotia and Teotia, 1994) indicates that fluorine (F) is the highest contributor to PM2.5 particles except in November, indicating the impact of continental crust and soil contamination. Because of burning biomass in the winter, the concentration of carbon was the highest in the sample in November, and it was the second highest for the other 4 months.
The analysis of the backward trajectory of the air mass reveals that there are multiple routes for the conveyance of air masses originating from various source locations on different days, which indicates the presence of a variety of aerosols over Varanasi (Singh et al., 2014). Fine particles are a major concern for human health. So, a higher concentration of PM1 particles may lead to heavy health risks in the future.
The raw data supporting the conclusions of this article will be made available by the authors, without undue reservation.
PKC: writing, original draft preparation, analysis of data, and plotting. AK: visualizing, conceptualizing, and analysis and editing. VP: conceptualizing and plotting. AKS: reviewing, supervising, and editing. All authors contributed to the article and approved the submitted version.
The work was partially supported by the Institute of Eminence (IoE) to BHU (Scheme no: 6031).
PKC is thankful to UGC, New Delhi for providing JRF.
The authors declare that the research was conducted in the absence of any commercial or financial relationships that could be construed as a potential conflict of interest.
The handling editor ST declared a past co-authorship with one of the authors AKS.
All claims expressed in this article are solely those of the authors and do not necessarily represent those of their affiliated organizations, or those of the publisher, the editors and the reviewers. Any product that may be evaluated in this article, or claim that may be made by its manufacturer, is not guaranteed or endorsed by the publisher.
Ångström, A.. (1964). The parameters of atmospheric turbidity. Tellus 16, 64–75. doi: 10.3402/tellusa.v16i1.8885
Akinlade, G. O., Olaniyi, H. B., Olise, F. S., Owoade, O. K., Almeida, S. M., Almeida-Silva, M., et al. (2015). Spatial and temporal variations of the particulate size distribution and chemical composition over Ibadan, Nigeria. Environ. Monit. Assess. 187, 1–14. doi: 10.1007/s10661-015-4755-4
Alam, K., Trautmann, T., Blaschke, T., and Subhan, F. (2014). Changes in aerosol optical properties due to dust storms in the Middle East and Southwest Asia. Remote Sens. Environ. 143, 216–227. doi: 10.1016/j.rse.2013.12.021
Ali, M. U., Liu, G., Yousaf, B., Ullah, H., Irshad, S., Ahmed, R., et al. (2019). Evaluation of floor-wise pollution status and deposition behavior of potentially toxic elements and nanoparticles in air conditioner dust during urbanistic development. J. Hazard. Mater. 365, 186–195. doi: 10.1016/j.jhazmat.2018.11.005
Ancelet, T., Davy, P. K., and Trompetter, W. J. (2015). Hourly variations in particulate matter source contributions in New Zealand's southernmost city. Air Qual. Clim. Change 49, 26–33. doi: 10.3316/informit.466648262606092
Balakrishnan, K., Dey, S., Gupta, T., Dhaliwal, R. S., Brauer, M., Cohen, A. J., et al. (2019). The impact of air pollution on deaths, disease burden, and life expectancy across the states of India: the Global Burden of Disease Study 2017. Lancet Planet. Health. 3, e26–e39. doi: 10.1016/S2542-5196(18)30261-4
Banerjee, T., Murari, V., Kumar, M., and Raju, M. P. (2015). Source apportionment of airborne particulates through receptor modeling: Indian scenario. Atmos. Res. 164, 167–187. doi: 10.1016/j.atmosres.2015.04.017
Bansal, O., Singh, A., and Singh, D. (2019). Short-term perturbation in aerosol characteristics over Northwestern India: a case study during Diwali festival. J. Earth Syst. Sci. 128, 1–13. doi: 10.1007/s12040-019-1223-5
Cheng, Z., Jiang, J., Fajardo, O., Wang, S., and Hao, J. (2013). Characteristics and health impacts of particulate matter pollution in China (2001–2011). Atmos. Environ. 65, 186–194. doi: 10.1016/j.atmosenv.2012.10.022
Chowdhury, S., and Dey, S. (2016). Cause-specific premature death from ambient PM2.5 exposure in India: estimate adjusted for baseline mortality. Environ. Int. 91, 283–290. doi: 10.1016/j.envint.2016.03.004
Cohen, A. J., Brauer, M., Burnett, R., Anderson, H. R., Frostad, J., Estep, K., et al. (2017). Estimates and 25-year trends of the global burden of disease attributable to ambient air pollution: an analysis of data from the Global Burden of Diseases Study 2015. Lancet. 389, 1907–1918. doi: 10.1016/S0140-6736(17)30505-6
Delfino, R. J., Sioutas, C., and Malik, S. (2005). Potential role of ultrafine particles in associations between airborne particle mass and cardiovascular health. Environ. Health Perspect. 113, 934–946. doi: 10.1289/ehp.7938
Dey, S., and Di Girolamo, L. (2010). A climatology of aerosol optical and microphysical properties over the Indian subcontinent from 9 years (2000–2008) of Multiangle Imaging Spectroradiometer (MISR) data. J. Geophys. Res. Atmos. 115:D15204. doi: 10.1029/2009JD013395
Dey, S., Di Girolamo, L., van Donkelaar, A., Tripathi, S. N., Gupta, T., and Mohan, M. (2012). Variability of outdoor fine particulate (PM2. 5) concentration in the Indian Subcontinent: a remote sensing approach. Remote Sens. Environ. 127, 153–161. doi: 10.1016/j.rse.2012.08.021
Dey, S., Tripathi, S. N., Singh, R. P., and Holben, B. N. (2004). Influence of dust storms on the aerosol optical properties over the Indo-Gangetic basin. J. Geophys. Res. Atmos. 109:D20211. doi: 10.1029/2004JD004924
Draxler, R. R., and Rolph, G. D. (2003). HYSPLIT (HYbrid Single-Particle Lagrangian Integrated Trajectory). Model access via NOAA ARL READY. NOAA Air Resources Laboratory, Silver Spring, MD. Available online at: http://www.arl.NOAA.gov/ready/hysplit4.HTML
Egondi, T., Ettarh, R., Kyobutungi, C., Ng, N., and Rocklöv, J. (2018). Exposure to outdoor particles (PM2. 5) and associated child morbidity and mortality in socially deprived neighborhoods of Nairobi, Kenya. Atmosphere 9:351. doi: 10.3390/atmos9090351
Elbayoumi, M., Ramli, N. A., Yusof, N. F. F. M., and Al Madhoun, W. (2013). Spatial and seasonal variation of particulate matter (PM10 and PM2. 5) in Middle Eastern classrooms. Atmos. Environ. 80, 389–397. doi: 10.1016/j.atmosenv.2013.07.067
Garaga, R., Sahu, S. K., and Kota, S. H. (2018). A review of air quality modeling studies in India: local and regional scale. Curr. Pollut. Rep. 4, 59–73. doi: 10.1007/s40726-018-0081-0
Ghude, S. D., Chate, D. M., Jena, C., Beig, G., Kumar, R., Barth, M. C., et al. (2016). Premature mortality in India due to PM2. 5 and ozone exposure. Geophys. Res. Lett. 43, 4650–4658. doi: 10.1002/2016GL068949
Gupta, L., Dev, R., Zaidi, K., Sunder Raman, R., Habib, G., and Ghosh, B. (2021). Assessment of PM10 and PM2.5 over Ghaziabad, an industrial city in the Indo-Gangetic Plain: spatio-temporal variability and associated health effects. Environ. Monitor. Assess. 193, 1–21. doi: 10.1007/s10661-021-09411-5
Guttikunda, S. K., and Calori, G. (2013). A GIS-based emissions inventory at 1 km × 1 km spatial resolution for air pollution analysis in Delhi, India. Atmos. Environ. 67, 101–111. doi: 10.1016/j.atmosenv.2012.10.040
Jain, S., Sharma, S. K., Srivastava, M. K., Chaterjee, A., Singh, R. K., Saxena, M., et al. (2019). Source apportionment of PM10 over three tropical urban atmospheres at Indo-Gangetic Plain of India: an approach using different receptor models. Arch. Environ. Contam. Toxicol. 76, 114–128. doi: 10.1007/s00244-018-0572-4
Jain, S., Sharma, S. K., Srivastava, M. K., Chatterjee, A., Vijayan, N., Tripathy, S. S., et al. (2021). Chemical characterization, source apportionment, and transportpathways of PM2. 5 and PM10 over Indo Gangetic Plain of India. Urban Clim. 36:100805. doi: 10.1016/j.uclim.2021.100805
Kaskaoutis, D. G., Kumar, S., Sharma, D., Singh, R. P., Kharol, S. K., Sharma, M., et al. (2014). Effects of crop residue burning on aerosol properties, plume characteristics, and long-range transport over northern India. J. Geophys. Res. Atmos. 119, 5424–5444. doi: 10.1002/2013JD021357
Kaufman, Y. J., Boucher, O., Tanré, D., Chin, M., Remer, L. A., and Takemura, T. (2005). Aerosol anthropogenic component estimated from satellite data. Geophys. Res. Lett. 32:L17804. doi: 10.1029/2005GL023125
Kaufman, Y. J., Tanré, D., and Boucher, O. (2002). A satellite view of aerosols in the climate system. Nature 419, 215–223. doi: 10.1038/nature01091
Kompalli, S. K., Babu, S. S., and Moorthi, K. K. (2010). Inter-comparison of aerosol optical depth from the multi-wavelength solar radiometer with other radiometric measurements. Indian J. Radio Spa. Phys. 39, 364–371.
Kumar, A., Kumar, S., Pratap, V., and Singh, A. K. (2021). Performance of water vapor retrieval from MODIS and ECMWF and their validation with ground-based GPS measurements over Varanasi. J. Earth Syst. Sci. 130, 1–11. doi: 10.1007/s12040-020-01529-3
Kumar, M., Singh, R. K., Murari, V., Singh, A. K., Singh, R. S., and Banerjee, T. (2016). Fireworks induced particle pollution: a Spatio-temporal analysis. Atmos. Res. 180, 78–91. doi: 10.1016/j.atmosres.2016.05.014
Kumar, M., Tiwari, S., Murari, V., Singh, A. K., and Banerjee, T. (2015a). Wintertime characteristics of aerosols at middle Indo-Gangetic Plain: impacts of regional meteorology and long-range transport. Atmos. Environ. 104, 162–175. doi: 10.1016/j.atmosenv.2015.01.014
Kumar, P., Pratap, V., Kumar, A., Choudhary, A., Prasad, R., Shukla, A., et al. (2020). Assessment of atmospheric aerosols over Varanasi: physical, optical and chemical properties and meteorological implications. J. Atmos. Solar Terrestrial Phys. 209:105424. doi: 10.1016/j.jastp.2020.105424
Kumar, S., Kumar, S., Kaskaoutis, D. G., Singh, R. P., Singh, R. K., Mishra, A. K., et al. (2015b). Meteorological, atmospheric and climatic perturbations during major dust storms over Indo-Gangetic Basin. Aeolian Res. 17, 15–31. doi: 10.1016/j.aeolia.2015.01.006
Li, C., Hu, Y., Zhang, F., Chen, J., Ma, Z., Ye, X., Yang, X., Wang, L., Tang, X., Zhang, R., and Mu, M. (2017). Multi-pollutant emissions from the burning of major agricultural residues in China and the related health-economic effects. Atmos. Chem. Phys. 17, 4957–4988. doi: 10.5194/acp-17-4957-2017
Li, Q., Wu, B., Liu, J., Zhang, H., Cai, X., and Song, Y. (2020). Characteristics of the atmospheric boundary layer and its relation with PM2. 5 during haze episodes in winter in the North China Plain. Atmos. Environ. 223:117265. doi: 10.1016/j.atmosenv.2020.117265
Liu, K., Wang, F., Li, J., Tiwari, S., and Chen, B. (2019). Assessment of trends and emission sources of heavy metals from the soil sediments near the Bohai Bay. Environ. Sci. Pollut. Res. 26, 29095–29109. doi: 10.1007/s11356-019-06130-w
Lodhi, N. K., Beegum, S. N., Singh, S., and Kumar, K. (2013). Aerosol climatology at Delhi in the western Indo-Gangetic Plain: microphysics, long-term trends, and source strengths. J. Geophys. Res. Atmos. 118, 1361–1375. doi: 10.1002/jgrd.50165
Malm, W. C., and Day, D. E. (2000). Optical properties of aerosols at Grand Canyon national park. Atmos. Environ. 34, 3373–3391. doi: 10.1016/S1352-2310(00)00108-4
Massie, S. T., Torres, O., and Smith, S. J. (2004). Total Ozone Mapping Spectrometer (TOMS) observations of increases in Asian aerosol in winter from 1979 to 2000. J. Geophys. Res. Atmos. 109:D18211. doi: 10.1029/2004JD004620
Miri, M., Derakhshan, Z., Allahabadi, A., Ahmadi, E., Conti, G. O., Ferrante, M., et al. (2016). Mortality and morbidity due to exposure to outdoor air pollution in Mashhad metropolis, Iran. The AirQ model approach. Environ. Res. 151, 451–457. doi: 10.1016/j.envres.2016.07.039
Miri, M., Ebrahimi Aval, H., Ehrampoush, M. H., Mohammadi, A., Toolabi, A., Nikonahad, A., et al. (2017). Human health impact assessment of exposure to particulate matter: an AirQ software modeling. Environ. Sci. Pollut. Res. 24, 16513–16519. doi: 10.1007/s11356-017-9189-9
Morys, M., Mims, F. M. III., Hagerup, S., Anderson, S. E., Baker, A., Kia, J., et al. (2001). Design, calibration, and performance of MICROTOPS II handheld ozone monitor and Sun photometer. J. Geophys. Res. Atmos. 106, 14573–14582. doi: 10.1029/2001JD900103
Mukherjee, A., and Agrawal, M. (2017). World air particulate matter: sources, distribution and health effects. Environ. Chem. Lett. 15, 283–309. doi: 10.1007/s10311-017-0611-9
Murari, V., Kumar, M., Barman, S. C., and Banerjee, T. (2015). Temporal variability of MODIS aerosol optical depth and chemical characterization of airborne particulates in Varanasi, India. Environ. Sci. Pollut. Res. 22, 1329–1343. doi: 10.1007/s11356-014-3418-2
Murari, V., Kumar, M., Mhawish, A., Barman, S. C., and Banerjee, T. (2017). Airborne particulate in Varanasi over middle Indo-Gangetic Plain: variation in particulate types and meteorological influences. Environ. Monitor. Assess. 189, 1–15. doi: 10.1007/s10661-017-5859-9
Murari, V., Kumar, M., Singh, N., and Banerjee, T. (2016). Particulate morphology and elemental characteristics: variability at middle Indo-Gangetic Plain. J. Atmos. Chem. 73, 165–179. doi: 10.1007/s10874-015-9321-5
Myhre, G.. (2009). Consistency between satellite-derived and modeled estimates of the direct aerosol effect. Science 325, 187–190. doi: 10.1126/science.1174461
Obaidullah, M., Dyakov, I. V., Peeters, L., Bram, S., and De Ruyck, J. (2012). Measurements of particle concentrations and size distributions in three parking garages. Int. J. Energy Environ. 6, 508–515.
Ojha, N., Sharma, A., Kumar, M., Girach, I., Ansari, T. U., Sharma, S. K., et al. (2020). On the widespread enhancement in fine particulate matter across the Indo-Gangetic Plain towards winter. Sci. Re 10, 1–9. doi: 10.1038/s41598-020-62710-8
Pope, I. I. I. C. A., Renlund, D. G., Kfoury, A. G., May, H. T., and Horne, B. D. (2008). Relation of heart failure hospitalization to exposure to fine particulate air pollution. Am. J. Card. 102, 1230–1234. doi: 10.1016/j.amjcard.2008.06.044
Prasad, A. K., and Singh, R. P. (2009). Validation of MODIS Terra, AIRS, NCEP/DOE AMIP-II Reanalysis-2, and AERONET Sun photometer derived integrated precipitable water vapor using ground-based GPS receivers over India. J. Geophys. Res. Atmos. 114:D05107. doi: 10.1029/2008JD011230
Pratap, V., Kumar, A., Kumar, P., and Singh, A. K. (2020b). “Pre-monsoon study of aerosol parameters and particulate matters over Varanasi for 2017,” in 2020 URSI Regional Conference on Radio Science (URSI-RCRS) (Varanasi: IEEE), 1–2.
Pratap, V., Kumar, A., Tiwari, S., Kumar, P., Tripathi, A. K., and Singh, A. K. (2020a). Chemical characteristics of particulate matter and their emission sources over Varanasi during the winter season. J. Atmos. Chem. 77, 83–99. doi: 10.1007/s10874-020-09405-6
Rahman, M. H., Sharma, V. P., Kundu, S., and Datta, A. (2020). Seasonal variation of potential source locations of atmospheric particulates over the Indo-Gangetic Plain of India. Open J. Air Pollut. 9:1. doi: 10.4236/ojap.2020.91001
Rajesh, T. A., and Ramachandran, S. (2017). Characteristics and source apportionment of black carbon aerosols over an urban site. Environ. Sci. Pollut. Res. 24, 8411–8424. doi: 10.1007/s11356-017-8453-3
Rajput, P., Izhar, S., and Gupta, T. (2019). Deposition modeling of ambient aerosols in human respiratory system: health implication of fine particles penetration into the pulmonary region. Atmos. Pollut. Res. 10, 334–343. doi: 10.1016/j.apr.2018.08.013
Ram, K., and Sarin, M. M. (2011). Day-night variability of EC, OC, WSOC and inorganic ions in the urban environment of Indo-Gangetic Plain: implications to secondary aerosol formation. Atmos. Environ. 45, 460–468. doi: 10.1016/j.atmosenv.2010.09.055
Ramachandran, S., and Kedia, S. (2010). Black carbon aerosols over an urban region: radiative forcing and climate impact. J. Geophys. Res. Atmos. 115:D10202. doi: 10.1029/2009JD013560
Reddy, B. S. K., Kumar, K. R., Balakrishnaiah, G., Gopal, K. R., Reddy, R. R., Reddy, L. S. S., et al. (2011). Aerosol climatology over an urban site, Tirupati (India)derived from columnar and surface measurements: first-time results obtained from a 30-day campaign. J. Atmos. Solar Terrestrial Phys. 73, 1727–1738. doi: 10.1016/j.jastp.2011.03.015
Remer, L. A., Kaufman, Y. J., Tanré, D., Mattoo, S., Chu, D. A., Martins, J. V., et al. (2005). The MODIS aerosol algorithm, products, and validation. J. Atmos. Sci. 62, 947–973. doi: 10.1175/JAS3385.1
Sah, D., Verma, P. K., Kandikonda, M. K., and Lakhani, A. (2019). Pollution characteristics, human health risk through multiple exposure pathways, and source apportionment of heavy metals in PM10 at Indo-Gangetic site. Urban Clim. 27, 149–162. doi: 10.1016/j.uclim.2018.11.010
Salma, I., Balásházy, I., Hofmann, W., and Záray, G. (2002). Effect of physical exertion on the deposition of urban aerosols in the human respiratory system. J. Aerosol Sci. 33, 983–997. doi: 10.1016/S0021-8502(02)00051-4
Sarkar, S., Singh, R. P., and Chauhan, A. (2018). Crop residue burning in northern India: an increasing threat to Greater India. J. Geophys. Res. Atmos. 123, 6920–6934. doi: 10.1029/2018JD028428
Satheesh, S. K., Krishna Moorthy, K., Kaufman, Y. J., and Takemura, T. (2006). Aerosol optical depth, physical properties, and radiative forcing over the Arabian Sea. Meteorol. Atmos. Phys. 91, 45–62. doi: 10.1007/s00703-004-0097-4
Sawlani, R., Agnihotri, R., Sharma, C., Patra, P. K., Dimri, A. P., Ram, K., et al. (2019). The severe Delhi SMOG of 2016: a case of delayed crop residue burning, coincident firecracker emissions, and atypical meteorology. Atmos. Pollut. Res. 10, 868–879. doi: 10.1016/j.apr.2018.12.015
Saxena, M., Sharma, A., Sen, A., Saxena, P., Mandal, T. K., Sharma, S. K., et al. (2017). Water-soluble inorganic species of PM10 and PM2. 5 at an urban site of Delhi, India: seasonal variability and sources. Atmos. Res. 184, 112–125. doi: 10.1016/j.atmosres.2016.10.005
Seinfeld, J. H., Bretherton, C., Carslaw, K. S., Coe, H., DeMott, P. J., Dunlea, E. J., et al. (2016). Improving our fundamental understanding of the role of aerosol-cloud interactions in the climate system. Proc. Natl. Acad. Sci. U.S.A. 113, 5781–5790. doi: 10.1073/pnas.1514043113
Sharma, D., Singh, D., and Kaskaoutis, D. G. (2012). Impact of two intense dust storms on aerosol characteristics and radiative forcing over Patiala, Northwestern India. Adv. Meteorol. 2012:956814. doi: 10.1155/2012/956814
Singh, A., Rastogi, N., Patel, A., Satish, R. V., and Singh, D. (2016a). Size-segregated characteristics of carbonaceous aerosols over the Northwestern Indo-Gangetic Plain: year-round temporal behavior. Aerosol. Air Qual. Res. 16, 1615–1624. doi: 10.4209/aaqr.2016.01.0023
Singh, A., Srivastava, A. K., Varaprasad, V., Kumar, S., Pathak, V., and Shukla, A. K. (2021). Assessment of near-surface air pollutants at an urban station over the central Indo-Gangetic Basin: role of pollution transport pathways. Meteorol. Atmos. Phys. 133, 1127–1142. doi: 10.1007/s00703-021-00798-x
Singh, A., Tiwari, S., Sharma, D., Singh, D., Tiwari, S., Srivastava, A. K., et al. (2016b). Characterization and radiative impact of dust aerosols over the northwestern part of India: a case study during a severe dust storm. Meteorol. Atmos. Phys. 128, 779–792. doi: 10.1007/s00703-016-0445-1
Singh, A. K., Srivastava, M. K., Singh, M., Srivastava, A. K., Kumar, S., Tiwari, S., et al. (2014). Characterization of atmospheric aerosol by SEM-EDX and Ion-chromatography techniques for eastern Indo-Gangetic plain location, Varanasi, India. Int. J. Adv. Earth Sci. 3, 41–51.
Singh, D. K., and Gupta, T. (2016). Role of transition metals with water soluble organic carbon in the formation of secondary organic aerosol and metallo-organics in PM1 sampled during post monsoon and pre-winter time. J. Aerosol. Sci. 94, 56–69. doi: 10.1016/j.jaerosci.2016.01.002
Smith, C. L., Moores, J. E., Lemmon, M., Guzewich, S. D., Moore, C. A., Ellison, D., et al. (2019). Visibility and line-of-sight extinction estimate in Gale crater during the 2018/MY34 global dust storm. Geophys. Res. Lett. 46, 9414–9421. doi: 10.1029/2019GL083788
Spandana, B., Rao, S. S., Upadhya, A. R., Kulkarni, P., and Sreekanth, V. (2021). PM2. 5/PM10 ratio characteristics over urban sites of India. Adv. Space Res. 67, 3134–3146. doi: 10.1016/j.asr.2021.02.008
Speranza, A., Caggiano, R., Margiotta, S., Summa, V., and Trippetta, S. (2016). A clustering approach based on a triangular diagram to study the seasonal variability of simultaneous measurements of PM10, PM2. 5, and PM1 mass concentration ratios. Arab. J. Geosci. 9, 1–8. doi: 10.1007/s12517-015-2158-z
Srivastava, A. K., Singh, S., Tiwari, S., Kanawade, V. P., and Bisht, D. S. (2012a). Variation between near-surface and columnar aerosol characteristics during the winter and summer at Delhi in the Indo-Gangetic Basin. J. Atmos. Sol. Terr. Phys. 77, 57–66. doi: 10.1016/j.jastp.2011.11.009
Srivastava, A. K., Soni, V. K., Singh, S., Kanawade, V. P., Singh, N., Tiwari, S., et al. (2014). An early South Asian dust storm during March 2012 and its impacts on Indian Himalayan foothills: a case study. Sci. Total Environ. 493, 526–534. doi: 10.1016/j.scitotenv.2014.06.024
Srivastava, A. K., Tripathi, S. N., Dey, S., Kanawade, V. P., and Tiwari, S. (2012b). Inferring aerosol types over the Indo-Gangetic Basin from ground-based sunphotometer measurements. Atmos. Res. 109, 64–75. doi: 10.1016/j.atmosres.2012.02.010
Taneja, K., Ahmad, S., Ahmad, K., and Attri, S. D. (2020). Impact assessment of a severe dust storm on atmospheric aerosols over an urban site in India. Curr. Sci. 118:737. doi: 10.18520/cs/v118/i5/737-749
Teotia, S. P. S., and Teotia, M. (1994). Dental caries: a disorder of high fluoride and low dietary calcium interactions (30 years of personal research). Fluoride 27, 59–59.
Tiwari, S., Kaskaoutis, D., Soni, V. K., Dev Attri, S., and Singh, A. K. (2018). Aerosol columnar characteristics and their heterogeneous nature over Varanasi, in the central Ganges valley. Environ. Sci. Pollut. Res. 25, 24726–24745. doi: 10.1007/s11356-018-2502-4
Tiwari, S., Kumar, A., Pratap, V., and Singh, A. K. (2019). Assessment of two intense dust storm characteristics over Indo–Gangetic basin and their radiative impacts: a case study. Atmos. Res. 228, 23–40. doi: 10.1016/j.atmosres.2019.05.011
Tiwari, S., Mishra, A. K., and Singh, A. K. (2016). Aerosol climatology over the Bay of Bengal and the Arabian Sea inferred from space-borne radiometers and lidar observations. Aerosol Air Qual. Res. 16, 2855–2868. doi: 10.4209/aaqr.2015.06.0406
Tiwari, S., and Singh, A. K. (2013). Variability of aerosol parameters derived from ground and satellite measurements over Varanasi located in the Indo-Gangetic Basin. Aerosol Air Qual Res. 13, 627–638. doi: 10.4209/aaqr.2012.06.0162
Wang, M., and Penner, J. E. (2009). Aerosol indirect forcing in a global model with particle nucleation. Atmos. Chem. Phys. 9, 239–260. doi: 10.5194/acp-9-239-2009
Keywords: particulate matter, aerosols, AOD, Indo-Gangetic Basin, MICROTOPS II Sunphotometer
Citation: Chauhan PK, Kumar A, Pratap V and Singh AK (2022) Seasonal characteristics of PM1, PM2.5, and PM10 over Varanasi during 2019–2020. Front. Sustain. Cities 4:909351. doi: 10.3389/frsc.2022.909351
Received: 31 March 2022; Accepted: 06 July 2022;
Published: 02 August 2022.
Edited by:
Shani Tiwari, Council of Scientific and Industrial Research (CSIR), IndiaReviewed by:
Vishnu Murari, Indian Institute of Technology Kanpur, IndiaCopyright © 2022 Chauhan, Kumar, Pratap and Singh. This is an open-access article distributed under the terms of the Creative Commons Attribution License (CC BY). The use, distribution or reproduction in other forums is permitted, provided the original author(s) and the copyright owner(s) are credited and that the original publication in this journal is cited, in accordance with accepted academic practice. No use, distribution or reproduction is permitted which does not comply with these terms.
*Correspondence: Abhay Kumar Singh, c2luZ2hha0BiaHUuYWMuaW4=
Disclaimer: All claims expressed in this article are solely those of the authors and do not necessarily represent those of their affiliated organizations, or those of the publisher, the editors and the reviewers. Any product that may be evaluated in this article or claim that may be made by its manufacturer is not guaranteed or endorsed by the publisher.
Research integrity at Frontiers
Learn more about the work of our research integrity team to safeguard the quality of each article we publish.