 Lili Zhang
 Di Su
Di Su- School of Maritime Economics and Management, Dalian Maritime University, Dalian, China
Promoting the sustainable development of cities and unifying ecological, economic, and social benefits are of great significance to the long-term development of the country. Taking the macro level as the starting point, this paper constructs a hierarchical identification model of urban personality advantage characteristics from the perspective of sustainable development. To identify, classify and compare the sustainable urban development models, SPSS was used to analyze the weights of the dominant characteristics of various cities in China. First, according to the identification model, the individual advantages of each city are identified hierarchically; Secondly, all feature weights are clustered, and finally, the sustainable development patterns of different cities are discussed according to the clustering results, and relevant countermeasures are proposed. The comparison shows that each city has its advantages and disadvantages in sustainable development, and these cities have not been able to implement the concept and policies of sustainable development well. Given these problems, this paper recommends grasping the main force, gradually solving and improving the weaker links in sustainable development, and reducing the imbalance in development. In the context of sustainable development strategies, the development of Chinese cities in a virtuous circle is of great significance.
Introduction
With the increasing urbanization of the world, sustainability is an essential direction for urban development in the world today. The first and most critical stage in promoting sustainable urban development is identifying models for sustainable urban development. The so-called urban sustainable development model is an economic growth model that focuses on long-term development, which measures the status of urban development based on the concept of sustainable development. It is of great theoretical and practical significance to promote the process of sustainable development, encourage sustained and rapid economic growth, achieve comprehensive, coordinated, and sustainable development, and achieve inclusive urban growth.
The strengths and weaknesses of a city are determined by differences in urban characteristics and challenges. The existing urban sustainable development model analysis uses a uniform index weight. It does not examine the model from the perspective of respecting the advantages of individual cities, which inevitably ignores the differences in the advantages and disadvantages of each city, resulting in exclusion between cities. This study studies the sustainable development model of cities from the perspective of individual advantages, based on the guiding ideology most conducive to identifying exemplary behaviors of urban development. The Indicator System for Urban Sustainable Development was established as a means and tool to measure and evaluate the status of sustainable urban development models. In this paper, a clustering algorithm based on individual advantage recognition is used to create an index system for urban sustainable development. The data of 102 prefecture-level cities and 4 municipalities directly under the central government are collected, taking the sustainable development of Chinese cities as the research object. Gain a thorough understanding of China's existing urban sustainability model. Therefore, based on the identification of advantages and disadvantages of the urban sustainable development model. On the one hand, it can identify the advantages and disadvantages of each city, cultivate advantages, and avoid shortcomings, on the other hand, it is conducive to each city to understand the current situation of its sustainable development model, and according to the suggestions given in this article, find the direction of future efforts, and achieve rapid improvement of the level of sustainability.
Literature review
The evaluation of sustainable urban models based on advantage recognition mainly solves two problems: one is how to express the macro values of social groups for a particular characteristic; On the other hand, based on conforming to the macro values of social groups, how to identify the advantages that reflect the most outstanding value of cities, and based on identifying unique advantage gifts, how to analyze and coordinate the development model of urban agglomerations.
As an essential space for sustainable evaluation, urban indicators are based on the dimensions of economy, people's livelihood, resources, consumption, and governance. Due to the wide range of sizes, the indicator system is too complex. The selection of urban sustainable development indicators among the many complex indicators mainly depends on the understanding of the value of the indicators and the mastery of the characteristics of the city. There are two commonly used indicators for evaluating sustainable urban development: single and composite.
Over the past few decades, sustainability metrics have been at the forefront of many political, academic, scientific, and community debates. Beginning with agenda 21's call for sustainable development, the United Nations Commission on Sustainable Development (CSD) published a list of 140 indicators covering the social, economic, environmental, and institutional dimensions of sustainable development (Commission on Sustainable Development, 2001). Sustainability evaluation mainly relies on a single indicator and a comprehensive indicator system. In terms of a single index, traditional indices such as ecological footprint (EF) (Ahmed et al., 2021), ecological sustainability index (ESI), welfare index (WI), environmental vulnerability index (EVI), environmentally adjusted gross domestic product (EDP), sustainable economic welfare index (ISEW), human development index (HDI), urban development index (CDI) (Molinaro et al., 2020), green GDP, national happiness index and other classic indices (Wang and Chen, 2019; Yang et al., 2020) have been widely used. Although the standardization of a single indicator is conducive to comparison and research, it is less flexible and does not reflect the performance of urban development. Therefore, the researchers constructed a composite indicator system to assess sustainable development. The composite index, which is different from a single indicator, that is, the construction of an indicator system, is one of the most used methods for evaluating sustainable urban development. Cappai et al. (2019) established indicators from environmental and socio-economic related components and developed practical sustainability assessment tools. Lowery et al. (2020) considers sustainable development in rural areas and the impact of natural resources on sustainable development, especially in the forestry and fisheries industries, and establishes an assessment index system for sustainable cities. At the same time, scholars at home and abroad have also conducted relevant research on how to evaluate and promote the sustainable development of cities in specific fields. Gunnarsdóttir et al. (2020), Llorca et al. (2020), and Karjalainen and Juhola (2021) explore the sustainable development of cities from the perspective of transport systems, energy sustainability, and land use, respectively.
In short, the evaluation indicators of sustainable cities are diverse, covering all aspects of urban development, such as economic, environmental, social, sustainable infrastructure and policy systems, etc. Still, the comprehensive indicator system easily masks specific sustainable development issues in the evaluation, and the comparability between the indicator systems is weak. Based on satisfying the principle of constructing an indicator system, this paper fully considers the development connotation of sustainable cities. It comprehensively weighs the interrelationship between various indicators, including whether they are duplicated, poor correlation, and whether the indicators are suitable for all cities in China. Therefore, the indicator system constructed in this paper can provide a guiding idea for sustainable research involving many cities.
Indicators and methods of urban sustainable development evaluation
Indicator system
Although the evaluation index system for sustainable cities is gradually developing, how the indicator system can scientifically evaluate different types of cities, how to improve the flexibility and stability of the indicator system still need to be studied.
Based on evaluating a wide range of regions across the country, a set of scientific, fair, and in line with the concept of sustainable urban development is established from five dimensions: economic development, social and people's livelihood, resources, environment, and policies. The economy is the premise of the inclusive development of a city, and it is also a necessary premise of urban development. Considering the degree of urban economic development, industrial structure, and urban openness to the outside world, to make urban development more inclusive, this paper selects indicators such as per capita GDP (yuan), the proportion of tertiary industry (%), and science and technology expenditure (10,000 yuan); The comprehensive content of urban development involves the basic life of urban residents, education, medical care, environment, health employment, safety, and other aspects, of which the supply of water and electricity is one of the most basic living conditions of residents, so the total amount of water resources (10,000 cubic meters), gas household consumption (10,000 cubic meters), and the total amount of gas supply (10,000 cubic meters) are selected to measure the basic living conditions of residents; For higher education investment, everyone can enjoy a higher level of development platform, and it is also an important part of urban development and social progress. Therefore, the expenditure on education (10,000 yuan), the number of college students per 10,000 people (people), and the collection of books in public libraries (10,000 volumes) are selected as indicators to measure the development of education; The level of medical services reflects the socio-economic development of a city from the side, but also reflects the ability of the city to provide medical services for residents, so the number of hospitals, health centers (persons) and the number of practicing or assistant physicians (persons) are selected; The premise of sustainable development is the harmonious coexistence of man and nature, emphasizing that the ecological environment and human settlement environment can bring comfort to the residents' lives, so this paper selects the green coverage area of the built-up area (hectares), the proportion of urban construction land in the municipal area (%), the park green area (hectares), the urban construction land area (square kilometers) and the comprehensive utilization rate of general solid waste (%) to reflect the urban ecological environment, and selects industrial sulfur dioxide emissions (tons), industrial soot dust emissions (tons), The centralized treatment rate of sewage treatment plants (%) and the harmless treatment rate of domestic waste (%) reflect the urban living environment; To a certain extent, the unemployment rate also reflects the happiness of residents, so the number of registered unemployed people (people) in cities and towns is selected to reflect the employment of the labor force; The sharing of development results reflects the living conditions that the results of the urban development process can provide to people, that is, residents can enjoy the social environment brought about by the sustainable development of the city, so the number of urban workers' basic old-age insurance participants (people), the number of urban workers' unemployment insurance (people) and the number of urban workers' basic medical insurance participants (people) are selected to reflect the social environment. Each evaluation index is a key element in forming a sustainable city, and the “inclusive” and “sustainable” level of economic growth of 106 cities at the prefecture level and above in China is more comprehensively and objectively revealed through the indicator system. Therefore, the selection of indicators is related to the evaluation results, so when selecting indicators, comprehensive trade-offs are required. In this case, under the conditions of existing data collection techniques, people build indicator systems based on the logical analysis of the purpose factors, and use the information that can be collected to express the level of the purpose variables that people care about but cannot be directly obtained from multiple aspects.
With the continuous improvement of the analysis method of “structural equations,” people can not only quickly establish an indicator system that expresses the characteristics of things, but also ensure the “independence” between the same indicators in the established indicator system. Features consist of a series of complex hierarchical events, and low-level attributes tend to have observable features, gradually forming higher-level abstract qualities. In general, characteristics are expressed through a system of indicators. The hierarchy of the indicator system is essential for feature recognition, bridging the gap between the underlying behavioral metric data that can be easily obtained through observation and other means and the unobservable advanced behavior that is expected to be understood. To ensure the universality of the index system in terms of structure, this paper studies the indicator system with a multi-layer design, such as the three-layer structure (Figure 1).
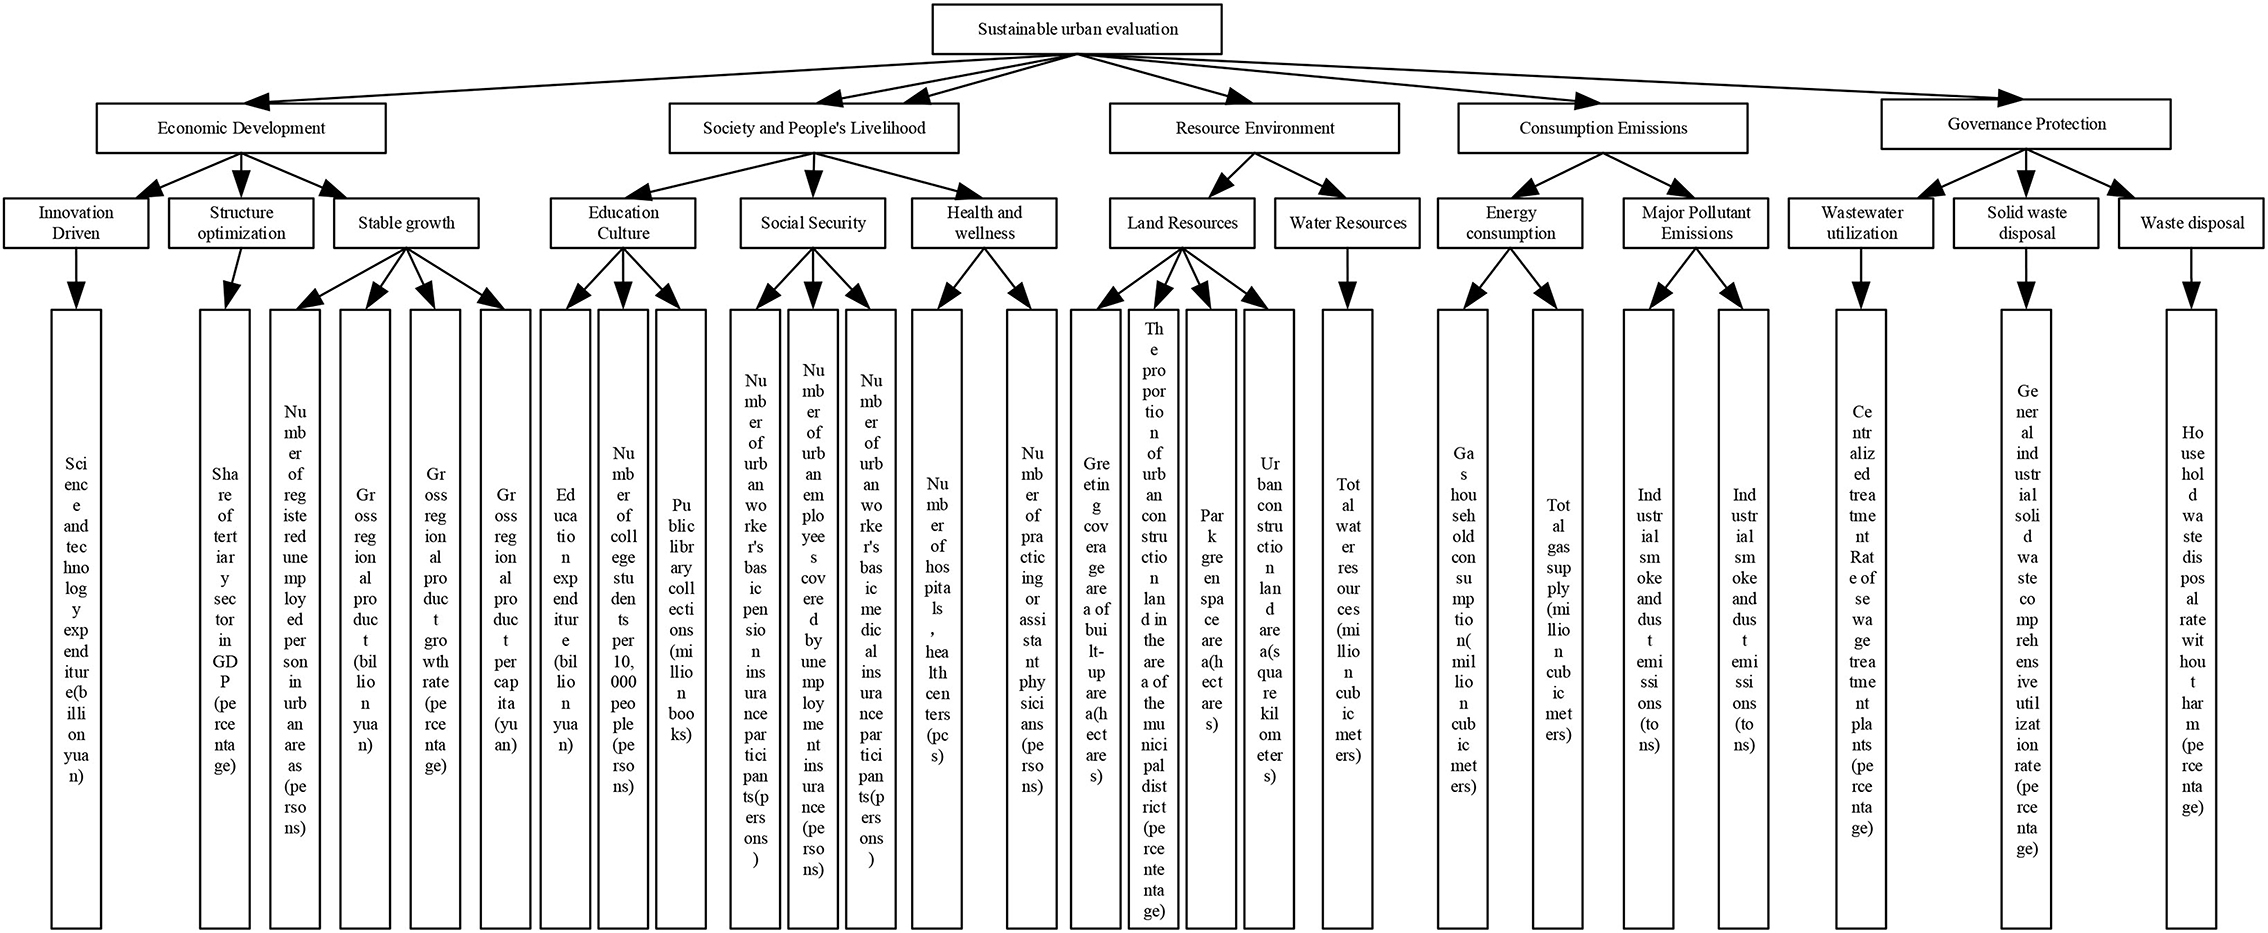
Figure 1. Urban sustainable development evaluation index system.
Evaluation methodology
A complete sustainability evaluation process includes, in addition to the construction of the indicator system, the determination of evaluation criteria, data processing, indicator weights are given, and the selection of evaluation methods. The methods and tools for assessing sustainability are rich, specific, and diverse, and can be divided into two categories, subjective and objective, according to the different ways of assigning weights to indicators; subjective methods mainly include the Delphi method, hierarchical analysis (Lee and Xue, 2021), fuzzy optimization method (Han and Ruan, 2003), fuzzy cluster analysis method, etc., and objective methods mainly include entropy value method, principal component analysis (Liu et al., 2020), etc. The hierarchical analysis method is more subjective and not easy to be convincing. The fuzzy comprehensive evaluation method is complicated to calculate, and when the index set is too large, the phenomenon of super fuzzy will occur, causing the evaluation failure. Considering the multi-objectives of the urban sustainable development evaluation index system and the accuracy of the evaluation results, this paper adopts the SPSS clustering method based on identifying strengths and weaknesses. It focuses on 14 modules, such as innovation drive, structure optimization, education and culture, social security, health, land resources, total water resources, energy consumption, and wastewater utilization, etc. It involves urban areas' “economic development,” “people's livelihood,” “resources and environment,” and “sustainable development.” It covers five aspects: “economic development,” “people's livelihood,” “resources and environment,” “energy consumption and emission,” and “governance and protection.” It not only improves the content of the evaluation system, but also analyzes the sustainable development model of Chinese cities.
Based on the data of n groups of indicators, the advantageous characteristics of each city in each n group in the highest level evaluation indicators and each intermediate level evaluation indicator are obtained, respectively. Cluster analysis is conducted with each indicator as a criterion to identify the advantages of each city under different indicators, to classify them, and to make a specific analysis of different development patterns of urban clusters. Each cluster point represents a favorable characteristic of a city cluster. If there are more cities belonging to a specific pattern, the development pattern reflected by the cluster point is the dominant pattern. Reflecting the common issue of cities, the adjustment or guidance strategy is targeted according to its actual connotation. Among them, the key to achieving advantage identification is to build a mathematical model that can identify individual advantageous characteristics.
(1) Based on the ith city, the model to identify the advantageous characteristics of the pk grassroots indicators of each city from the perspective of the kth indicator of the middle level is:
Where:
denotes the outstanding value of the jth grassroots indicator under the kth subindex of the intermediate layer. It is also necessary to standardize the obtained data again to ensure the authenticity of the group identification results.
xikj denotes the evaluation value of the jth grassroots indicator of the ith city under the kth subindex of the middle layer.
wikj denotes the weight of xikj, and its optimal solution wikj is the dominant characteristic of the city's grassroots indicators obtained from the perspective of the kth indicator in the middle layer based on the ith city according to the optimization method.
Based on the Kuhn-Tucher principle, the optimal solution of model (1) is: (a) when there exists a component of the indicator of the ith city that reaches the ideal value, the weight of the indicator corresponding to the component that reaches the ideal value sums to 1, and the weight of the indicator that does not reach the ideal value is 0; (b) when the value of the indicator of the ith group of cities does not reach the ideal value, the weights are:
(2) Cluster analysis
The k-means algorithm takes k as a parameter. It divides n objects into k clusters so there is a high degree of similarity within clusters and a low degree of similarity between clusters. k-means algorithm is processed as follows: first, k objects are randomly selected, each object initially representing the mean or center of a cluster; for each remaining object, it is assigned to the nearest cluster according to its distance from the center of each cluster. The mean of each cluster is then recalculated. This process is repeated until the criterion function converges. Usually, a squared error criterion is used, which is defined as follows.
Here E is the sum of the squared errors of all objects in the database, and p is the point in space, is the average of the clusters xikj. This objective function makes the generated clusters as compact and independent as possible, and the distance metric used is the Euclidean distance.
Application example—An empirical study of sustainable city model identification in China
Evaluation index system
In this paper, 102 prefecture-level cities and 4 municipalities directly under the central government in mainland China are used as sample data. The evaluation index system draws on the research results of previous literature and contains a total of 26 specific evaluation indicators, as shown in Table 1.
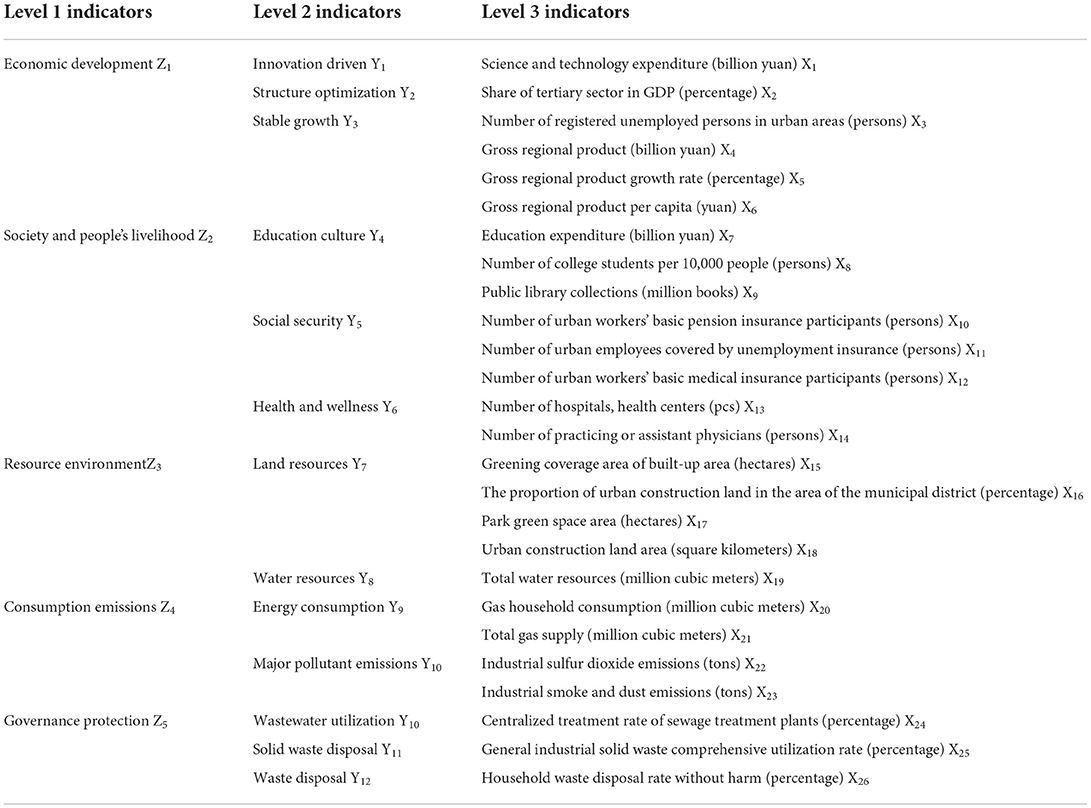
Table 1. Urban sustainable development evaluation index system.
Research on the sustainable development of Chinese cities based on the analysis of individual advantage characteristics
In this paper, the innovation index data of 31 regions in China in 2015 were selected for analysis. The data were obtained from the 2015 and 2016 China Statistical Yearbook, China City Statistical Yearbook, and “China Science and Technology Paper Statistical Analysis Database.”
The standardized data of each region are used to calculate the weight values of individual advantageous characteristics by Formulas (1) and (2), and a total of 106 sets of weight vectors can be obtained. The results are shown in Tables 2, 3. By analyzing the weight coefficients, it can be found that when a region has individual advantageous characteristics in a specific indicator, the weight value of that indicator will also be more significant. In contrast the weight values of other indicators are smaller, which indicates that the analysis of individual advantageous characteristics can suggests that the individual advantageous characteristics of the evaluated area can be fully reflected through individual advantageous characteristics analysis. Then, 106 sets of weight vectors are clustered by k-means clustering. Finally, the 106 cities were divided into five categories.
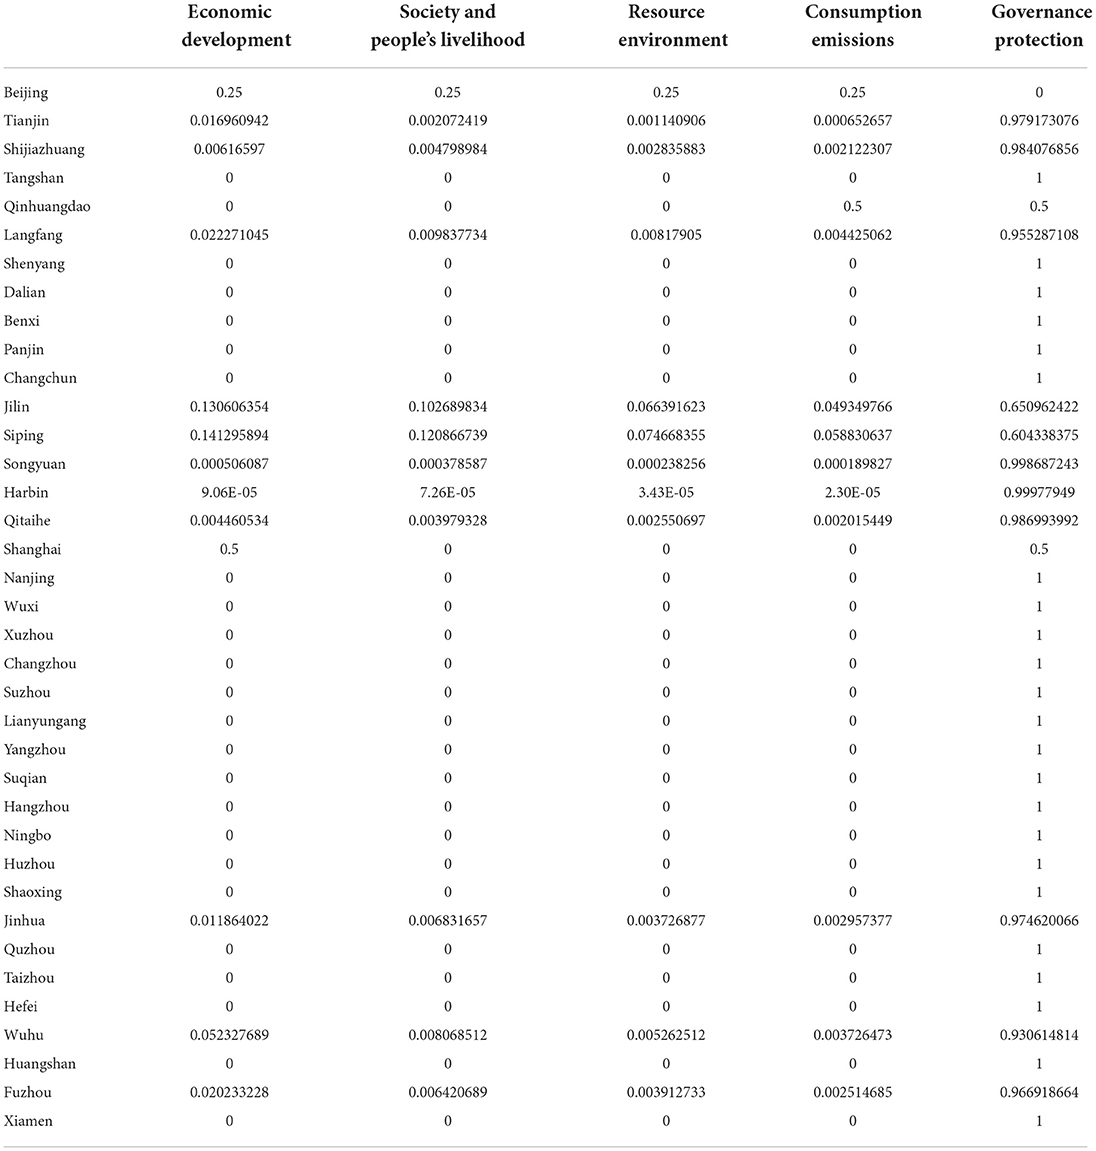
Table 2. Top-level weight vectors (some cities).
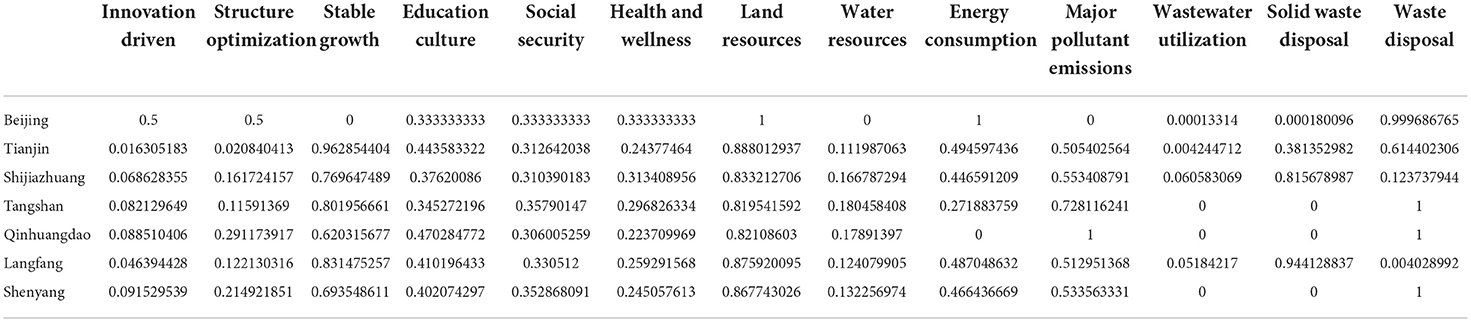
Table 3. Intermediate layer weight vectors (some cities).
Analysis of urban sustainable development patterns
The cluster analysis of sustainable urban development evaluation is to facilitate the identification of the advantages and disadvantages of sustainable urban development, to analyze and coordinate the development model of urban agglomerations. Based on the clustering analysis results of the sustainable development level of the sample cities, the 106 cities were divided into 5 categories according to the top index weights, and the clustering results are listed in Table 4.
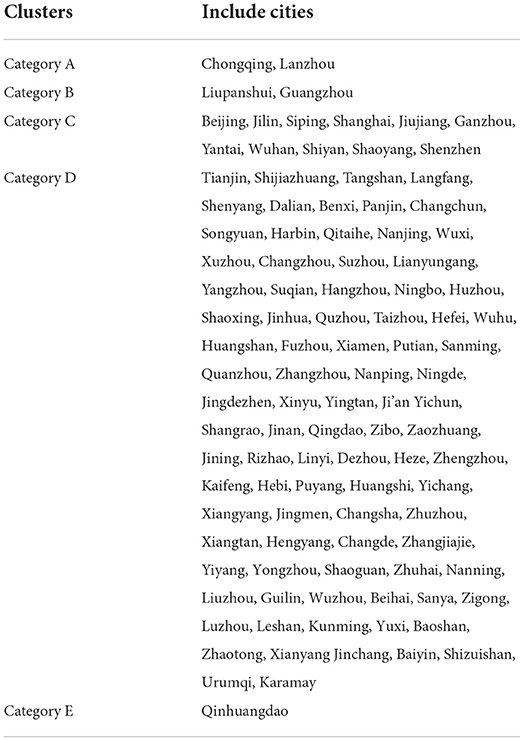
Table 4. City clustering results.
Through the top-level indicators: economic development, social and livelihood, resources and environment, consumption and emission, and governance and protection, 106 cities' advantageous characteristics were clustered and analyzed to obtain five categories of urban sustainable development patterns. Top-level clustering results are shown in Table 5. The proportion of cities in each category to the total sample size was used to judge whether they were mainstream models. Since the calculation process of advantage identification is carried out from the perspective of the most favorable group performance, the advantages analyzed should continue to be carried forward. At the same time, the disadvantages identified should be given sufficient attention.

Table 5. Top-level clustering results.
Analysis of results
(1) Comprehensive development content type: 11 cities were classified as Category C. They have better economic growth and resources and environment, and also have weaker advantages in terms of social livelihood and consumption emissions. They can provide urban residents with better quality production and living conditions in all of the above aspects, and their inclusive development is more comprehensive, with balanced and steady progress in all aspects. However, this group of cities has to a certain extent, damaged the environment and neglected to develop economic governance and protection. To achieve sustainable development in the future, these cities need to strengthen the construction of ecological civilization.
(2) Economic development: Category B cities (including Guangzhou and Liupanshui) are very strong in economic development, but have relatively environmental severe problems. They can improve the quality of sustainable living by improving municipal infrastructure construction, improving residents' lifestyles, upgrading road systems, etc. And vigorously building a green urban environment to promote sustainable urban construction.
(3) Shared development results: According to Table 4, 84.9% of cities have adopted the D-city sustainable development model, indicating that most cities focus on environmental management and protection in the process of economic development, but lack advantages in economic development, social livelihood, resources and environment, consumption and emissions. This group of cities has a relatively good ecological environment. It can promote sustainable city building by advocating for residents to engage in low-carbon living and consumption, changing their lifestyles, improving the efficiency of living resources use, increasing energy-saving facilities such as energy-efficient buildings and green transport systems, and focusing on future development potential. Class A cities (including Chongqing and Lanzhou) have advantages in terms of social livelihood and, consumption and emissions, high quality of education. The city has a good infrastructure, an increased wellbeing index, and a robust industrial economy, all of which contribute to a very inclusive city. Good social welfare and a more inclusive city will significantly enhance the city's attractiveness, speeding up the concentration of rural people in the city and attracting quality foreign businesses, ultimately contributing to the sustainable urban development of society as a whole. This group of cities can promote sustainable city building by adjusting their industrial structure, increasing the proportion of tertiary and high-tech industries, and expanding cooperation with the outside world. While Class E cities (including only Qinhuangdao) have done more in terms of consumption emissions and governance protection, they can improve the quality of sustainable production and carry out sustainable urban transformation by optimizing their industrial structure, and improving energy efficiency, etc. They should also enhance the construction of municipal infrastructure and enhance the quality of life in human settlements. Although all 3 categories of cities belong to the development results sharing type, they show different development results, with the development results of Class A cities. The development outcomes of Class A cities are reflected in the social and livelihood aspects, while cities D and E have advantages in environmental management and protection. But city E also focuses more on the management of consumption and emissions.
Overall, these types of cities did not develop in a balanced manner. The strengths and weaknesses of each city were obtained by assessing the level of sustainability of the 106 case cities. The results show that most cities have strengths in environmental management, but economic development and social livelihoods need to be improved, but some cities have developed better in terms of economic growth, but have relatively environmental severe problems, indicating that the varying level of sustainable development in China's cities is severe, and that efforts are still needed to achieve comprehensive sustainable city building based on their strengths. In the future, it is necessary to pay equal attention to many aspects, starting with crucial construction and gradually improving many elements to develop in the long term.
Clustering analysis of intermediate layer indicator weights
The results of the weighted clustering of the intermediate-level indicators for each city are shown in Table 6.
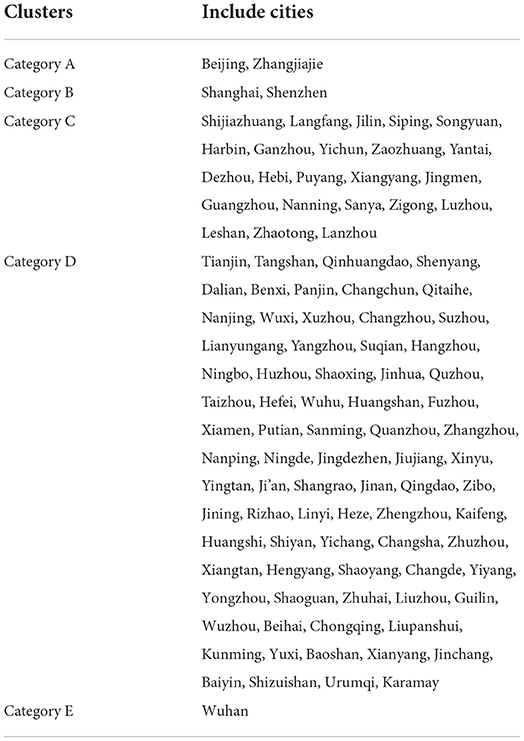
Table 6. City clustering results.
Cluster analysis of 106 cities' dominant characteristics from intermediate level indicators was performed, and cities were clustered from more detailed indicators to obtain urban sustainable development patterns in the same five categories (shown in Table 7).
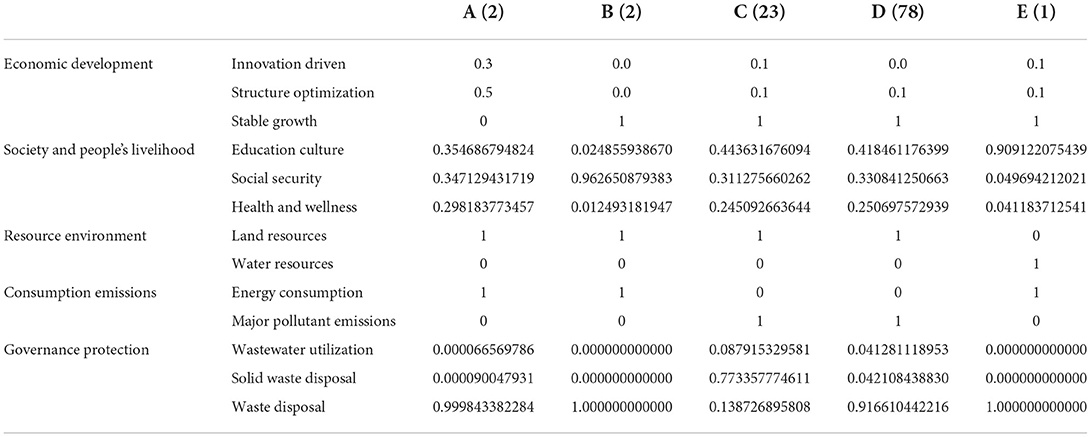
Table 7. Intermediate layer clustering results.
Analysis of results
(1) Comprehensive development content type: the strengths of each city were identified based on intermediate indicators. The evaluation results show that 21.6% of the cities have adopted the Development Balance Type C development model. This shows that most cities have balanced and healthy development, providing a better quality of life for city residents in all aspects, with flat and steady progress in all areas. The economic gap between cities in this category is small. However, there is still room for further improvement in the economy, and in recent years there has been a severe loss of population due to the attraction of large cities. This category of cities should optimize their industrial structure, improve investment in sustainable development and infrastructure growth, and at the same time promote economic development.
(2) Economic development type: Innovation-driven cities (including Beijing and Zhangjiajie) is ranked first in innovation drive, structural optimization and health. The reasons for this are that Beijing and Zhangjiajie place more emphasis on science and technology in their urban development, with a higher proportion of scientific expenditure in GDP, relatively slow economic growth, balanced development of social life and harmless treatment of domestic waste. Innovation-driven cities in terms of sustainable development should enhance and improve urban functions, maximize the value of revealed land, vigorously develop green transport and improve the efficiency of energy use. Category B cities (including Shanghai and Shenzhen), which have powerful economic growth and rank among the top cities in China in terms of economic growth and urban employment, have strong correlations between spatial differences in economic development indicators and development opportunities and resource use. Areas with high levels of economic development have better public and infrastructure development and more efficient resource use. And such cities rank first in terms of social security and waste disposal, with social security also an essential factor in attracting population inflows.
(3) Shared development results: 73.5% of the cities adopt the environment-friendly category D development model. Both category D and C cities have advantages in terms of social livelihood and governance protection. In terms of governance and security, category C deals with the extensive use of general industrial solid waste, while category D is relatively good in harmless domestic waste. These two categories of cities have an excellent ecological environment and abundant natural resources, but still, need to optimize further Category E cities (Wuhan only) have good economic development and a strong focus on education and culture in terms of social livelihoods. Regarding resources and environment, category E is the only category in which water resources are excellent to land resources, and the environmentally sound treatment of domestic waste is superior to sewage treatment and the integrated use of solid waste in general. Residents of cities in this category can enjoy the fruits of an advanced optimization of the social, economic and human environment as a result of sustainable urban development.
In general, these cities, through a more detailed classification, lack a balanced development at interregional and intra-city levels, with different “urban diseases” in other cities. To achieve a high quality and sustainable development, it is recommended that seize the main strengths, lay out complementary advantages, and that other dimensions are gradually improved to reduce development imbalances, and promote the integration of multiple development aspects.
Conclusion
This paper takes the sustainable development of Chinese cities as the research object. It uses the urban sustainable development indicator system to give impetus to the evaluation indicators of the sustainable development of each city. By improving the traditional method and using a clustering algorithm based on identifying strengths and weaknesses, this paper obtains the strengths and weaknesses of each city by assessing the sustainability level of 106 case cities, explores the existing urban sustainable development models, and gives corresponding countermeasure suggestions.
The analysis of urban sustainable development models based on the identification of strengths and weaknesses not only provides information on the strengths and characteristics of the sustainable development of each city in the region, helping each city to clarify its development position and development direction, but also the current situation of the sustainable development level of each city in the region. The varying level of sustainable development in China's cities is severe, and there is still work to be done to achieve a sustainable comprehensive city. However, due to the limitations of our knowledge and research capabilities, the complete evaluation method proposed in this paper is based on the established evaluation indicators, so the completeness and scientificity of the evaluation indicator system will directly affect the reasonableness of the evaluation results.
Data availability statement
The original contributions presented in the study are included in the article/supplementary material, further inquiries can be directed to the corresponding author/s.
Ethics statement
Written informed consent was obtained from the individual(s) for the publication of any potentially identifiable images or data included in this article.
Author contributions
LZ conceived the study and designed research. DS, WG, and SL collected the data and wrote the initial draft of the paper. All authors discussed the results and finalizing this paper. All authors contributed to the article and approved the submitted version.
Funding
This study was supported by Liaoning Social Science Planning Fund Project (L21BGL008).
Acknowledgments
We would like to thank Liaoning Social Science Planning Fund Project for their interest in us and the help they have given us. And we would like to thank my team members for their wonderful collaboration and patient support.
Conflict of interest
The authors declare that the research was conducted in the absence of any commercial or financial relationships that could be construed as a potential conflict of interest.
Publisher's note
All claims expressed in this article are solely those of the authors and do not necessarily represent those of their affiliated organizations, or those of the publisher, the editors and the reviewers. Any product that may be evaluated in this article, or claim that may be made by its manufacturer, is not guaranteed or endorsed by the publisher.
References
Ahmed, Z., Zhang, B., and Cary, M. (2021). Linking economic globalization, economic growth, financial development, and ecological footprint: evidence from symmetric and asymmetric ARDL. Ecol. Indicat. 121, 107060. doi: 10.1016/j.ecolind.2020.107060
Cappai, F., Forgues, D., and Glaus, M. (2019). A methodological approach for evaluating brownfield redevelopment projects. Urban Sci. 3, 45. doi: 10.3390/urbansci3020045
Commission on Sustainable Development. (2001). Agenda 21. UNICED, 1992. Available online at: https://sustainabledevelopment.un.org/content/documents/Agenda21.pdf
Gunnarsdóttir, I., Davidsdottir, B., Worrell, E., and Sigurgeirsdottir, S. (2020). Review of indicators for sustainable energy development. Renew. Sust. Energy Rev. 133, 110294. doi: 10.1016/j.rser.2020.110294
Han, Y. P., and Ruan, B. Q. (2003). Research on evaluation index system of water safety. Acta scientiae circumstantiae. 23, 267–272.
Karjalainen, L. E., and Juhola, S. (2021). Urban transportation sustainability assessments: a systematic review of literature. Transport Rev. 41, 659–684. doi: 10.1080/01441647.2021.1879309
Lee, S. W., and Xue, K. (2021). An integrated importance-performance analysis and modified analytic hierarchy process approach to sustainable city assessment. Environ. Sci. Pollut. Res. 28, 63346–63358. doi: 10.1007/s11356-021-15235-0
Liu, Y., Yang, S., Han, C., Ni, W., and Zhu, Y. (2020). Variability in regional ecological vulnerability: a case study of sichuan Province, China. Int. J. Disaster Risk Sci. 11, 696–708. doi: 10.1007/s13753-020-00295-6
Llorca, C., Silva, C., Kuehnel, N., Moreno, A. T., Zhang, Q., Kii, M., et al. (2020). Integration of land use and transport to reach sustainable development goals: will radical scenarios actually get us there? Sustainability 12, 9795. doi: 10.3390/su12239795
Lowery, B., Dagevos, J., Chuenpagdee, R., and Vodden, K. (2020). Storytelling for sustainable development in rural communities: an alternative approach. Sust. Dev. 28, 1813–1826. doi: 10.1002/sd.2124
Molinaro, R., Najjar, M. K., Hammad, A. W. A., Haddad, A., and Vazquez, E. (2020). Urban Development Index (UDI): a comparison between the city of Rio de Janeiro and four other global cities. Sustainability 12, 823. doi: 10.3390/su12030823
Wang, X., and Chen, X. (2019). An evaluation index system of China's development level of ecological civilization. Sustainability 11, 2270. doi: 10.3390/su11082270
Keywords: sustainable development model, strengths identification, model analysis, urban sustainability, clustering
Citation: Zhang L, Su D, Guo W and Li S (2022) Empirical study on urban sustainable development model based on identification of advantages and disadvantages. Front. Sustain. Cities 4:894658. doi: 10.3389/frsc.2022.894658
Received: 12 March 2022; Accepted: 29 August 2022;
Published: 17 November 2022.
Edited by:
John Rennie Short, University of Maryland, Baltimore County, United StatesReviewed by:
Kwame Adovor Tsikudo, University of Illinois at Urbana-Champaign, United StatesYonn Dierwechter, University of Washington Tacoma, United States
Copyright © 2022 Zhang, Su, Guo and Li. This is an open-access article distributed under the terms of the Creative Commons Attribution License (CC BY). The use, distribution or reproduction in other forums is permitted, provided the original author(s) and the copyright owner(s) are credited and that the original publication in this journal is cited, in accordance with accepted academic practice. No use, distribution or reproduction is permitted which does not comply with these terms.
*Correspondence: Lili Zhang, bGlsaXpoYW5nQGRsbXUuZWR1LmNu