 Johannes Flacke
 Basundhara Maharjan
 Rehana Shrestha
 Javier Martinez1
94% of researchers rate our articles as excellent or good
Learn more about the work of our research integrity team to safeguard the quality of each article we publish.
Find out more
ORIGINAL RESEARCH article
Front. Sustain. Cities , 28 March 2022
Sec. Climate Change and Cities
Volume 4 - 2022 | https://doi.org/10.3389/frsc.2022.835534
Environmental health inequalities in cities of the Global South are hardly studied up to now, though they are expected to increase due to rapid urbanization and motorization taking place in many of these cities. In this study, environmental inequalities in the city of Kathmandu, Nepal for the years 2013 and 2021 are analyzed. The goal of the study is to determine the degree of environmental inequalities and their changes over time. The study examines horizontal and vertical inequalities in access to drinking water sources, air and noise pollution exposure, and health effects based on self-reported household data. Results show statistically significant environmental inequalities between neighborhoods in Kathmandu regarding access to basic water infrastructure, air and noise pollution exposure, and resulting health effects. Inequalities between socio-economic groups are not significant. Over time, the perceived exposure to air pollution has increased, mainly due to increased motorized traffic, whereas vertical inequalities persisted. While inequalities between socio-economic groups have not increased, the high socioeconomic group reveals more concerns and awareness about environmental burdens than the low socioeconomic group. In conclusion, given the intertwined horizontal and vertical inequalities, any planning response action needs to consider the population's vulnerability to target interventions to the most affected areas.
Large cities in the Global South often feature a poor environmental quality. High levels of air (Flanagan et al., 2021), noise (Amoatey et al., 2020), and water pollution (Yin et al., 2021) result from industrial production, small-scale commercial activities, poor infrastructure quality, and motorized transport (Sen Roy, 2018). In addition, in large parts of the cities, people lack access to environmental benefits such as green areas and parks (Gelan and Girma, 2021). The absence of environmental standards and regulations to monitor environmental quality and the limited enforcement of existing regulations due to weak governance systems (Aryal et al., 2021) are restricting improvements of the situation. On the contrary, it is to be expected that due to the rapid growth of many Global South cities going along with rising motorization and increasing industrial production as well as private consumption the environmental quality will worsen over time (Kumar et al., 2014).
At the same time, we see increasing inequalities within cities of the Global South. While certain parts of the society benefit from the slow economic growth of the cities, others are excluded from it (Nijman and Wei, 2020). This is manifested in increasing spatial inequalities associated with an unequal geographic distribution of resources as well as access to amenities that particularly affect marginalized segments of the population (Soja, 2010), as reflected in the Sustainable Development Goals (https://sdgs.un.org/goals). SDG 10 postulates to reduce inequalities concerning income, wealth, opportunity and other dimensions, particularly in lower-income countries. In line with the demanded localization of the SDGs (Fenton and Gustafsson, 2017), such inequalities also need to be addressed at the city level.
Specific inequalities resulting from poor urban environmental quality and increasing socio-economic inequalities are described as environmental inequalities. Brulle and Pellow (2006, p. 104) define environmental inequalities as a “situation in which a specific social group is disproportionately affected by environmental hazards,” either caused by factors relating to the socio-economic status of the population or by characteristics of the built environment (Flacke et al., 2016). Disproportionately affected may further mean that certain groups exposed to environmental burdens may show different health outcomes (Harpham, 2009). People living in neighborhoods strongly exposed to environmental hazards may hold significantly higher amounts of, e.g., cardiovascular or respiratory diseases (Pickett and Pearl, 2001; Riva et al., 2007).
Such environmental inequalities are typically analyzed in a horizontal or in a vertical perspective (Kalasa et al., 2021). The horizontal perspective focuses on spatial variations in levels of exposure and investigates environmental inequalities between different geographical units. Such an analysis helps explore the link between health and place (Bambra et al., 2019). The vertical perspective typically investigates environmental inequalities between different socio-economic variables, for example socio-economic status, ethnicity or race. In this study, we aim to combine the two perspectives because both are needed to devise policy measures suitable to overcome inequalities (Kalasa et al., 2021) While several studies have investigated environmental inequalities in cities of the Global North (e.g., Maantay, 2007; Rüttenauer, 2018), they are hardly studied in cities of the Global South yet (Shao et al., 2021).
To address this gap, we analyze in this paper environmental inequalities at city level in a Global South context, using the city of Kathmandu, Nepal, as the case study. Nepal is one of the least developed countries in South-East Asia. Its capital city, Kathmandu is continuously growing due to a steady inflow from other parts of the country (Chauhan et al., 2021). Major environmental problems of the city are high levels of air (Gurung et al., 2017b) and noise pollution (Chauhan et al., 2021), poor drinking water quality (Thapa et al., 2019), and poor solid waste management (Nepal Health Research Council, 2009). In addition, the city is frequently struck by various environmental disasters from flooding, landslides, and earthquakes, the last major earthquake in 2015 (Khatakho et al., 2021). Various studies have investigated aspects of environmental health issues in Kathmandu (Pant, 2009; Kurmi et al., 2016; Thapa et al., 2019; Chauhan et al., 2021). However, no studies so far have investigated environmental inequalities between different areas or socio-economic groups.
The aim of the paper is to analyze intra-city environmental inequalities and their changes over time at neighborhood level in Kathmandu. This analysis based on empirical data is done for two points in time, i.e., the years 2013 and 2021. The longitudinal design of the study aims to detect whether the situation of environmental inequalities has worsened over the years due to ongoing urbanization and motorization. In the discussion section drivers of potential change are discussed and suitable intervention policies are reflected.
This study analyses environmental inequalities in terms of differences in exposure to environmental burdens and related heaths effects in six neighborhoods of Kathmandu for two points in time, 2013 and 2021. To this end, we make use of the Driving force-Pressure-State-Exposure-Effect-Action (DPSEEA) indicator framework (WHO, 1999). The DPSEEA framework “shows links between exposures and health effects as determined by many different factors operating through a chain of events” (Hambling et al., 2011, p. 12). These are conceptualized as high-level drivers and pressures, such as urban growth, economic or technological development, that influence the state of the environment and exposures. Following Morris et al. (2006) we relate the exposure–effects linkage of the DPSEEA framework to specific social, economic and demographic context indicators to analyze environmental inequalities (Köckler and Flacke, 2013). A further advantage of the DPSEEA framework is that it allows identifying potential policy intervention points along the environmental health causal chain (Briggs, 2003).
Kathmandu Metropolitan city (KMC) is the capital of Nepal and its major economic center. For many years, Kathmandu has been experiencing a huge inflow of people from other parts of the country (Gurung et al., 2017a), resulting in Nepal's highest population growth rates. In 2011 Kathmandu had a population of 1,006,656 (CBS, 2012), which almost doubled within 10 years (2001: 671,846 inhabitants. The population of Kathmandu Metropolitan city is reduced to 845,767 according to the most recent census survey in 2021 (https://censusnepal.cbs.gov.np/Home/Details?tpid=1&dcid=0f011f13-7ef6-42dd-9f03-c7d309d4fca3). Basic infrastructure like water supply, electricity, gas, telecommunications, roads, sanitation, education, and transportation is well-developed in Kathmandu compared to the rest of Nepal, though heavily under pressure due to the strong population increase. The Nepal/Gorkha earthquake from April 2015 caused almost 10,000 fatalities and massive destructions to more than 750,000 houses across Nepal, including Kathmandu (Bisri and Beniya, 2016).
The unplanned urbanization and haphazard development of industrial units have generated many environmental problems affecting human health and welfare. A major infrastructural deficiency in Kathmandu is the shortage of drinkable water from piped water. Kathmandu Upatyaka Khanepani Limited (KUKL) supplies water throughout the Kathmandu Valley but covers only 19% of the water demand during the dry season and 31% during the wet season with the supply being intermittent (Thapa et al., 2008, 2018). Moreover, a continuous increase in motorized vehicles, ongoing construction works, and small-scaled industries contribute to rising noise and air pollution levels (Gurung et al., 2017b). Air pollution and noise pollution are seen as other major problems that are to be addressed by governmental policies in Kathmandu (Chauhan et al., 2021).
For the empirical study, six neighborhoods were selected (Figure 1), that are representative for the urban built area of Kathmandu. We choose the neighborhood level for assessing environmental inequalities, because neighborhoods in Kathmandu show rather homogenous socio-economic characteristics. Details of the six neighborhoods are given in Table 1. Neighborhood N1 is the planned residential area of the Kuleshwor Housing project completed in 1990. Neighborhood N2 portrays mixed residential and commercial development along the major road connecting to Tribhuwan highway. Neighborhoods N3 and N4, located west of the Bishnumati River, are characterized by compact settlements of mixed land use for residential and commercial purposes. N4 includes the old fruit and vegetable wholesale market in the south. Neighborhoods N5 and N6 are located east of the Bishnumati river, the Bagmati river borders N6 in the south. N5 is of the highest settlement density and comprises the traditional core settlement with several courtyards and several sacred shrines and pilgrimage sites nearby and the highway in the north. Medium-density settlements, the highway, and a waste transfer station in the south characterize neighborhood N6.
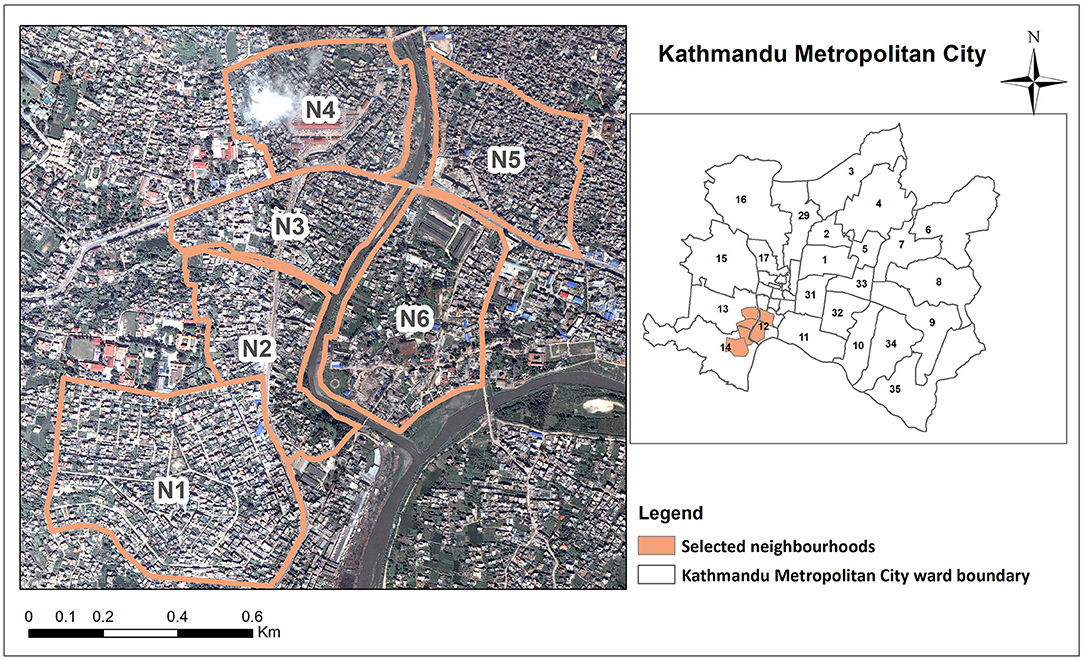
Figure 1. Location of the neighborhoods in Kathmandu.
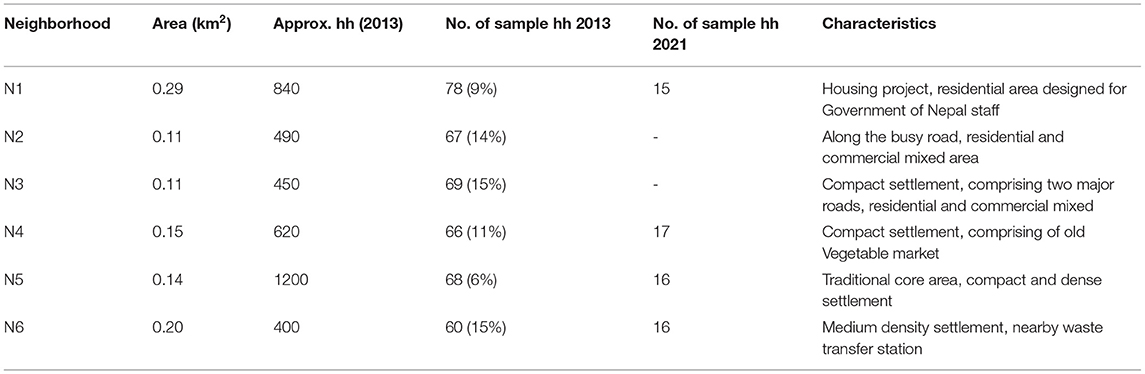
Table 1. Characteristics of sample neighborhoods.
A key challenge of environmental inequality studies at city level in Global South context is the limited data available in terms of exposure and health effects indicators. Given that only limited official data is available, this study is based on self-reported exposure levels and health effects as expressed by survey respondents. The study focuses on exposure levels and health effects related to drinking water availability and air and noise pollution as these are the main environmental hazards the city of Kathmandu faces. The following indicators were asked in the survey to explore levels of exposure to the various environmental burdens (Supplementary Table 1).
Drinking water supply is one of the major environmental concerns in Kathmandu. According to the SDGs indicator 6.1.1 safely managed drinking water service is defined as one located on premises, available when needed and free from fecal and priority chemical contamination (https://unstats.un.org/wiki/display/SDGeHandbook/Indicator$+$6.1.1). Due to a low supply of municipal pipe water in Kathmandu, households must approach multiple water sources (Shrestha et al., 2016b). Regarding water quality, various studies indicate that all water sources can potentially be contaminated in Kathmandu. Warner et al. (2008) observed bacterial contamination in 72% of 100 water sample in Kathmandu valley including pipe water. Subedi and Aryal (2010) found that in a sample of 57 bottles of sealed water from different brands distributed in Kathmandu valley 90% of them contained total coliforms and 60% contained fecal coliforms. A more recent study showed that the treated water had poor quality exceeding most of the standard values set by Nepal Drinking Water Quality Standards (Maharjan et al., 2018). Despite these various findings, piped water is still considered a permanent source of water for drinking and cooking as it is the cheapest source compared to jar water and tanker water (Shrestha et al., 2016b). To capture inequalities with respect to the quality and quantity of the water supply, accessibility to pipe water and use of water for drinking and cooking from the different sources is included in the survey.
Various studies show that motorized transport and industrial production are the major source of air pollution in many Asian cities (Huizenga and Leather, 2012) and that roadside air pollution is very high, especially due to high vehicles emissions and resuspension of street dust (Shah et al., 1997). In Kathmandu, solid waste management is also considered as contributing to air pollution because of the bad odor due to the accumulation of garbage (Mohanty, 2011). Therefore, all three sources for air pollution are considered in the survey.
Noise pollution is less emphasized compared to other environmental pollution. However, due to exposure to noise pollution, health problems are increasing in Kathmandu (Chauhan et al., 2021). Major noise sources include community noise, industrial noise and roadway noise (Nepal Health Research Council, 2009). Thus, all three are included in the survey.
Indicators collected to capture health effects resulting from exposure to the various environmental burdens are shown in Supplementary Table 2. Self-reported health effects due to water pollution were collected using the indicator of the occurrence of waterborne diseases in the family over the last 6 months. Several waterborne diseases have been reported resulting from contaminated water such as diarrhea, typhoid, cholera, dysentery, jaundice, paratyphoid fever, amoebiasis in Nepal (Rijal et al., 2019). As these diseases are transmitted through the oral route, they are often attributed to the cause of direct drinking of contaminated water.
Increasing evidence shows that air pollution is associated with adverse health outcomes, particularly respiratory diseases such as asthma, sore throat, and cough (Cohen et al., 2017). Moreover, air pollution is also considered to trigger external allergic effects. Though the role of air pollution in the development of allergic diseases is not clear, several studies have demonstrated an association between increased air pollution and the increased risk of allergic sensitization and prevalence of rhinitis, which is often associated with cold-like symptoms such as sneezing, itchiness, running nose (Lee et al., 2013). Furthermore, air pollution is considered to exert negative effects on human skin (e.g., itchy skin, eczema, sores, and rash) as was well as on eyes (e.g., itchy eyes, bloodshot eyes, teary eyes; Reinmuth-Selzle et al., 2017). Therefore, two indicators are developed to assess self-reported health effects due to air pollution: respiratory diseases such as asthma, chest pain, chronic cough and symptoms related to allergic reactions such as skin rashes, frequent running nose/sneezing, skin irritation, and burning/swelling eyelid.
Daily exposure to high noise levels over a long period can have harmful effects, and these health effects manifest as auditory disorders or non-auditory symptoms (Nongkynrih et al., 2014). Therefore, the indicator assessing health effects due to noise pollution was based on whether the sampled household reported on any symptoms related to auditory disorders such as hearing impairment, earache, noise-induced hearing loss or hypertension or non-auditory symptoms usually manifested as headache, psychological disturbances presented as irritability, dizziness, and sleeping.
Five indicators were used to assess the socio-economic context of the respondents (Supplementary Table 3). Next to the most commonly used income, education and occupation indicators, two indicators associated with wealth in Global south contexts, car and bike ownership, are added to the survey.
Random sampling was done to select households for the survey in 2013. The total sample size for this study was 408 households with 60–75 households from each selected neighborhood (Table 1). The survey questionnaire focused on three groups of variables: socio-economic characteristics, perceived environmental conditions (exposure) and self-reported health conditions, all captured as yes/no dichotomous variables. The questionnaire used in the 2013 survey is given in Supplementary Table 4.
From March to May 2021, we repeated the household survey in four of the six neighborhoods (N1, 4, 5, 6), because the covid19 pandemic forced us to scale down the second survey and higher environmental inequalities were evident in these neighborhoods in 2013 (Maharjan, 2014). The goal of this second survey was (a) to capture the current exposure levels and health effects in 2021, and (b) to capture changes in environmental quality as perceived by respondents. Hereto, we added questions asking how the respondents perceive and judge environmental quality change since 2013 and what measures they take to cope with the situation. To reduce recall bias as it was presumably difficult to remember environmental qualities some 8 years ago, we asked in the survey how the respondents remember the situation in the times before the earthquake, which occurred in 2015. We interviewed only respondents who had lived in the neighborhood for more than 8 years. We adopted a purposive sampling strategy and selected households located either along the road/river or far away from it and either close to or far away from the waste transfer station and vegetable markets, as these are the main sources of environmental pollution found in 2013 (Maharjan, 2014). Additionally, visual observation of the exterior condition of houses was also considered before the interview to include households with varying socio-economic characteristics. The questionnaire used in the 2021 survey is given in Supplementary Table 5. For some of the questions asked in 2013 already, we changed the format to obtain more detailed information. In detail, the questions regarding exposure to the various environmental burdens were changed from a yes/no format to a 5-point Likert scale ranging from very much/very high to not at all/very low.
The analysis of environmental inequalities combines descriptive statistics and correlation analysis. Horizontal inequalities are analyzed by comparing indicators over the six neighborhoods, while vertical inequalities are studied based on a cluster analysis classifying households into three different socio-economic groups. We applied Pearson's chi-square tests (Field, 2009) to test statistically significant relationships of neighborhoods and socio-economic clusters with environmental exposure levels and reported health effects for 2013. From these associations of the categorical variables we only report the yes categories, assessing statistically significant relationship between two variables at 95% confidence level.
For analyzing the changes of perceived levels of exposure and reported health effects in 2021 compared to 2013 we classified the reported 5-point Likert scaled data of percentages of respondents into quintiles ranging from 0–20% to 80.1–100%. Based on these quintiles, changes in levels of exposure and health effects are indicated as a change of quintile. In the case of water supply these quintiles are classified as a benefit variable, i.e., the higher the better. In the case of air and noise pollution and the reported health effects quintiles are classified as a cost variable, i.e., the higher the quintile the worse.
Socio-economic clusters for 2013 were created using the five socio-economic indicators—household income, education level, occupation, car ownership, and bike ownership –in a two-step cluster analysis in SPSS 21. The number of clusters was specified in advance as 3 in order to achieve distinct socioeconomic clusters. We used log-likelihood distance measure with Schwarz's Bayesian Criterion (BIC) to repeatedly produce the clustering solutions. The Silhouette Index (SI), which ranges from−1 to 1, was observed to determine the clustering quality. We accept the cluster with SI close to 0.5, which is considered fair clustering quality. After inspecting the cluster characteristics, the authors then categorized the clusters to high, medium and low socioeconomic clusters. The indicator household income is the most important predictor for cluster formation, followed by the indicators education level, occupation and car ownership, and numbers of motorbikes per family.
For 2021, socioeconomic clusters were created using the same socio-economic indicators as in 2013 in a two-step cluster analysis, except that bike ownership was considered in 2021 as a dichotomous variable (yes/no) instead of the number of bikes as in 2013. In this cluster analysis, occupation is the most important predictor for forming clusters, followed by household income, highest education, bike ownership, and car ownership.
Table 2 shows the socio-economic characteristics of the six neighborhoods in 2013 based on the sample household data, as no official census data at neighborhood level is available. Neighborhood N1 is mostly inhabited by highly educated people of the upper middle- and high-income groups having also the highest share of car ownership. In all other neighborhoods the share of households in the middle-income group (13,000–30,000 NRs.) is around two-third, while in N2, 3, and 4 another 30% are in the upper middle income group (30,000–60,000 NRs.) and N4, 5, and 6 also have a considerable higher share of household in the low income cluster (<13,000 NRs.).
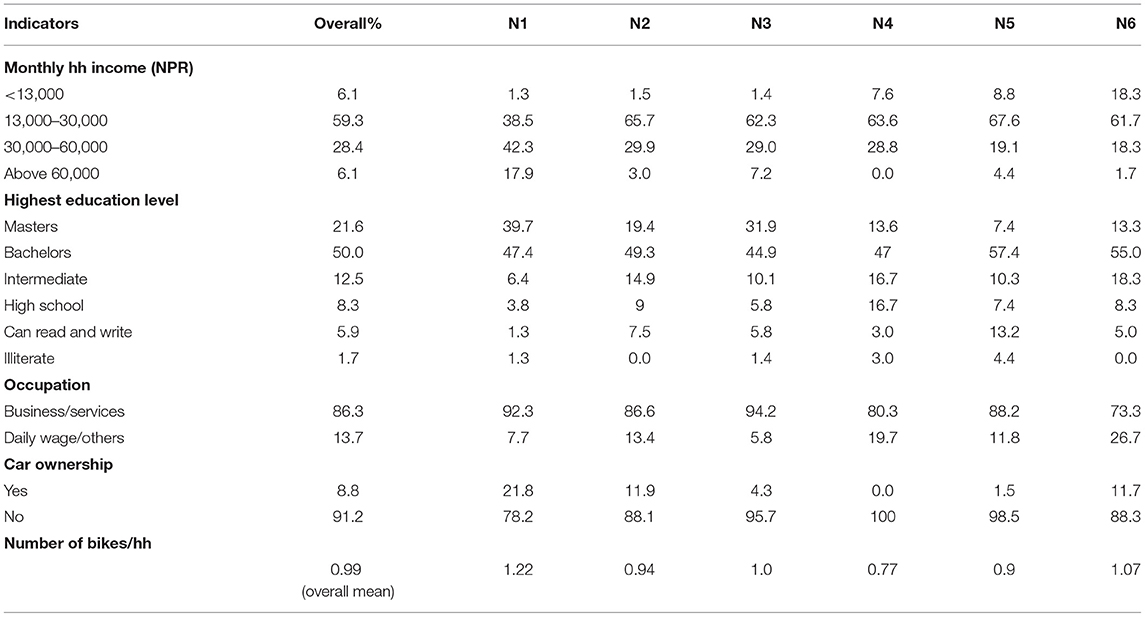
Table 2. Socio-economic characteristics of neighborhoods 2013.
Table 3 shows the characteristics of the three socio-economic clusters in 2013. Cluster C2 can be characterized as the higher socio-economic cluster (HSEC), including 35.3% of the sampled households. All households of high income fall in this cluster. The highest education level attained by family members is typically a bachelor's or master's degree and all households have business or services as a major occupation. All households owning a car are included in this cluster and the average number of motor bikes per household is significantly higher. Cluster C1 can be characterized as the medium socioeconomic class (MSEC). It includes all households with a middle income (13,000–30,000 NRs). Most households have at least a bachelor's degree and a major occupation in business or services. Cluster C3, the low socio-economic class (LSEC), is composed of 29.4% of total sampled households. It contains mainly households with household income between 13,000 and 30,000 NRs or below. Most households in this cluster have as highest education level below bachelor's degree, with only 15% having a master's degree. While still about half of the households have a major occupation in business or services, all households with major occupation as daily wage services are grouped into this cluster. The average number of bikes owned is the lowest.
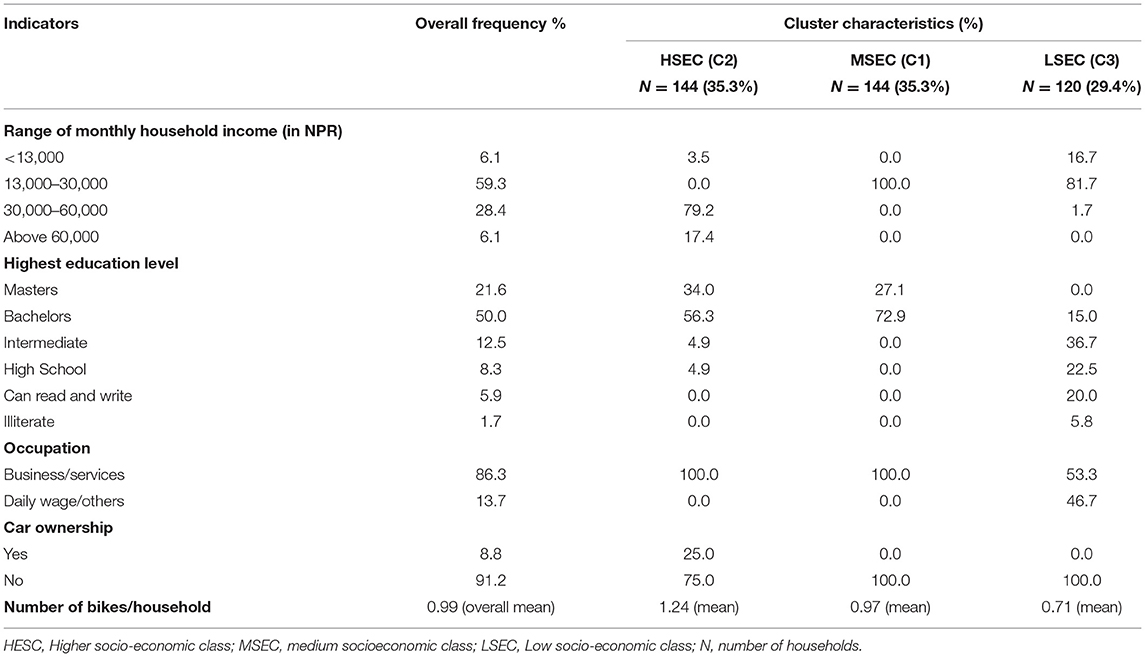
Table 3. Characteristics of clusters 2013.
Figure 2 shows the distribution of classified households in the neighborhoods in 2013. N1 comprises the highest number of HSEC households. N4 contains the highest number of LSEC households, whereas N3 has the highest number of MSEC households. N2 and N3 show an almost similar composition of all clusters. N5 and N6 are largely composed of MSEC and LSEC, almost with equal numbers of households.
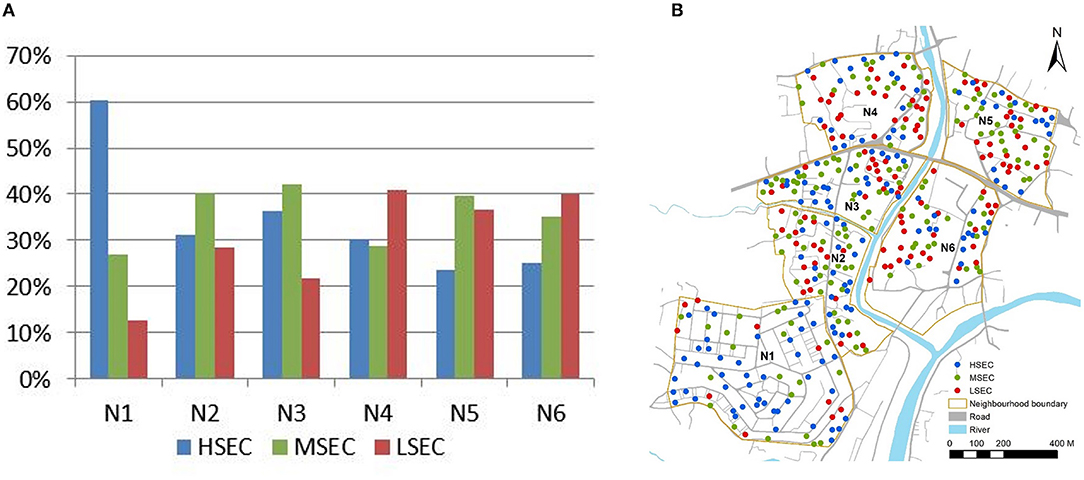
Figure 2. Distribution of socio-economic clusters per neighborhood 2013. (A) In percentage per neighborhood, (B) spatial distribution in neighborhoods.
The three clusters formed for 2021 have very similar characteristics as those formed in 2013 (Supplementary Table 6). Out of 64 households surveyed, the distribution for HSEC, MSEC, and LSEC is 21, 24, and 19 households, respectively. The distribution of socio-economic classes in the different neighborhoods is also similar to 2013. N1 has the highest percentage of HSEC and the lowest percentage of LSEC households. In the case of N4, having the highest percentage of households in LSEC in 2013, the percentage of MSEC and LSEC are equal in 2021, whereas N6 has the highest percentage of households of LSEC. A noticeable increase in households of MSEC is observed in N5.
In 2013 environmental inequalities between the six neighborhoods were found for several sources of environmental burdens considered in the study. Statistically significant were the inequalities in sources of drinking water (Table 4), exposure to air pollution from vehicle emissions and solid waste, and exposure to noise pollution from road traffic and crowds (Table 5). The analysis of health outcomes reveals significant inequalities between the six neighborhoods for all four self-reported health effects (Table 6).
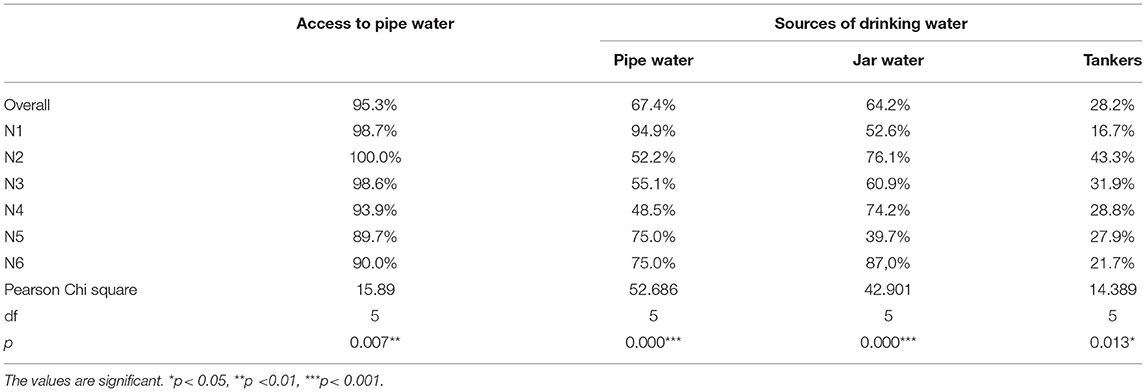
Table 4. Access to pipe water and sources of drinking water (2013).
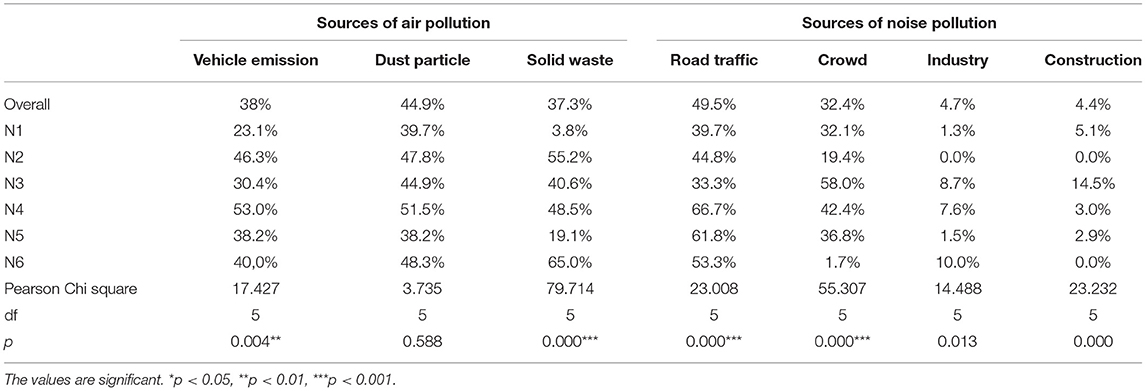
Table 5. Perceived exposure to various sources of air and noise pollution (2013).
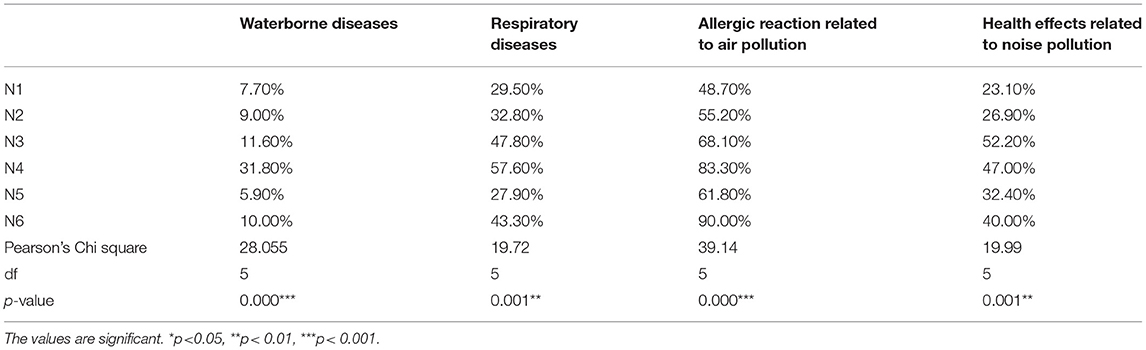
Table 6. Self-reported health effects per neighborhood in 2013.
While around 95% of the households have access to piped water supply (Table 4), only 13% said that it is sufficient for daily use because the water is supplied through the pipes only once a week and the quality is strongly varying (Maharjan, 2014). Accordingly, only about two-thirds of households use pipe water for drinking and cooking. About the same share of households must make use also of jar water, while around 30% also make use of water from private tankers because of the intermittent supply of pipe water.
A share of around 40% of the respondents reported exposure to air pollution from vehicle emission, dust particles and solid waste (Table 5). Regarding exposure to noise pollution, only noise from road traffic (50%) and crowds (32%) is reported from respondents and shows a significant disproportionate distribution. Noise pollution from industries and construction is only mentioned by a small number of respondents.
Comparing the six neighborhoods, the neighborhood N1 is least burdened by environmental hazards. Almost all households in N1 have access to pipe water (95%) (Table 4), and the by far lowest share of households among the six neighborhoods is reporting their exposure to both vehicle emission (23%) and solid waste (4%). The level of air pollution from dust particles is at a similarly low level as neighborhood N5 (Table 5). Also, neighborhood N1 is among the neighborhoods having the lowest shares concerning noise pollution. On the other hand, the most environmentally burdened neighborhood is N4. Though close to 95% of the households report that they have access to pipe water, <50% use this water for drinking and cooking purposes. In contrast, three-quarters of households have to buy jar water, often contaminated. More than half of the respondents reported exposure to air pollution from vehicle emissions (53%) and solid waste (52%) and two third reported exposure to noise pollution from road traffic.
The other neighborhoods are somewhat between these two extremes, being exposed more or less to some of the environmental burdens studied here. Respondents in N2 and N3 report a similarly low usage of pipe water (around 50%) and thus need to buy jar water to a high degree or even from private tankers, which are often more costly. Respondents from N2 report the highest share of exposure to air pollution from solid waste among the three sources, while respondents from N3 report the highest share of noise pollution from crowds. Respondents from the neighborhoods N5 and N6, on the other hand, report a relatively high share of access to pipe water (90%), and accordingly a high usage of pipe water for drinking and cooking (75%) while several households (87%) in N6 buy jar water as well, which indicates that supply of piped water is often intermittent. In terms of air pollution, N6 has the highest share of exposure from solid waste, which is most likely due to the close proximity location to the waste transfer station, which is in this neighborhood, while N5 reports a high share of exposure to noise pollution from road traffic.
These rather disproportionately distributed levels of exposure to environmental burdens between the neighborhoods result in statistically significant inequalities in reported health effects between neighborhoods (Table 6). In neighborhood N1 the lowest shares of health effects are reported for waterborne diseases, allergic health effects from air pollution and noise pollution effects, while in neighborhoodN4 highest shares of health effects are reported for waterborne and respiratory diseases as well as a high share of other air pollution health effects (Table 6). The highest numbers of reported health effects from air pollution in N6 (90%) can be plausibly linked to improper solid waste and management, as most of the households along the river reported bad odor, especially in the summertime when the water level is low. In N4, households complained about bad odor from the nearby vegetable market, particularly at garbage collection times. Health effects due to noise, such as headaches, irritation, etc., are reported highest by households in N3 and N4, whereas the least occurrence is reported in N1. For neighborhoodN3 this aligns with a high level of noise exposure from crowds that are reported, while respondents in N4 reported the highest share of exposure to noise from road traffic.
Vertical environmental inequalities in Kathmandu in 2013 are being analyzed by comparing three socio-economic classes in all six neighborhoods. In contrast to horizontal inequalities, the analysis of vertical inequalities does not yield so many distinct inequalities. Statistically significant are only the levels of unequal exposure to air pollution from dust particles and solid waste (Supplementary Tables 7, 8).
In terms of access to drinking water sources, all three socioeconomic classes have in principal access to pipe water to a high degree (>90%). Likewise, they all report a similar usage of the three different water sources with 60–70% making use of pipe water as well as jar water and between 20 and 30% making also use of water from private tankers (Supplementary Table 7). Consequently, no inequalities in sources of drinking water are statistically significant.
Exposure to the various sources of air pollution results in a somewhat mixed picture. Statistically significant is a slightly higher exposure to air pollution from dust particles for the HSEC cluster and higher exposure of LSEC households to air pollution from solid waste. The latter might relate to the high number of respondents reporting exposure to air pollution from solid waste in neighborhoods N4 and N6, as in both neighborhoods the share of households from LSEC is highest in the sample. In terms of noise pollution, all three socio-economic clusters report similar levels of exposure to the various noise sources, showing no statistically significant differences in levels of exposure. In summary, no socioeconomic class seems to be overall stronger exposed to environmental burdens than the other classes (Supplementary Table 8).
Regarding self-reported health effects, households in LSEC have reported the highest percentage of morbidity due to waterborne and respiratory diseases. However, statistically significant inequalities can only be detected for to waterborne diseases (Supplementary Table 9). Thus, it can be assumed that other factors contribute to varying health effects, such as behavioral factors (health behavior, smoking, etc.; Ploubidis and Grundy, 2011).
The analysis of changes in vertical and horizontal environmental inequalities in 2021 focuses on the four neighborhoods N1, 4, 5, and 6, as these showed the highest levels of inequalities in 2013. The survey covered a smaller sample; thus, the analysis is done qualitatively.
Figures 3–5 summarize the changes in perceived exposure between 2013 and 2021 for all three environmental burdens. While the principal access to pipe water has remained stable for three neighborhoods, only in N6 has it mainly decreased (Figure 3). Nevertheless, the use of pipe water for drinking has decreased in three of the four neighborhoods, most strongly in N1 and N6, where they overly used pipe water in 2013. At the same time, the number of households reporting the use of jar water remained relatively stable in all four neighborhoods in 2021 (Supplementary Table 10), which shows that overall, more jar water is consumed, particularly as the use of water from private tankers has also decreased in most neighborhoods. This reveals that the availability of safely managed drinking water following the SDG definition has worsened, as jar water is more expensive, often contaminated, and typically not available on the premise. Nevertheless, more than half of respondents in all four neighborhoods report that the drinking water quality has more or less stayed the same; only between 20 and 30% of respondents report that it has worsened (Figure 3B).
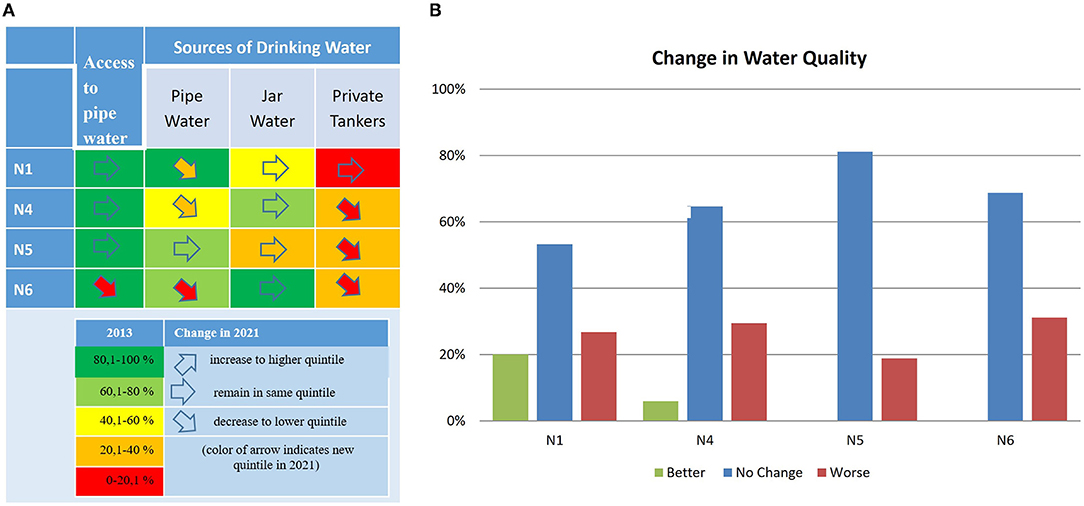
Figure 3. Changes in access to pipe water sources of drinking water in neighborhoods. (A) Per water source, (B) overall water quality.
Regarding air pollution, most households in all four neighborhoods state that the exposure to vehicle emissions and dust particles has increased over the last 8 years (Figure 4A). In contrast, the exposure to solid waste remained relatively low in most neighborhoods and decreased in N4, but it is still a major burden of air pollution for respondents from N6, where the waste transfer station is located (Supplementary Table 11). Overall, a majority of about 50–70 % in all four neighborhoods report that the air quality, in general, has worsened over the last 8 years (Figure 4B).
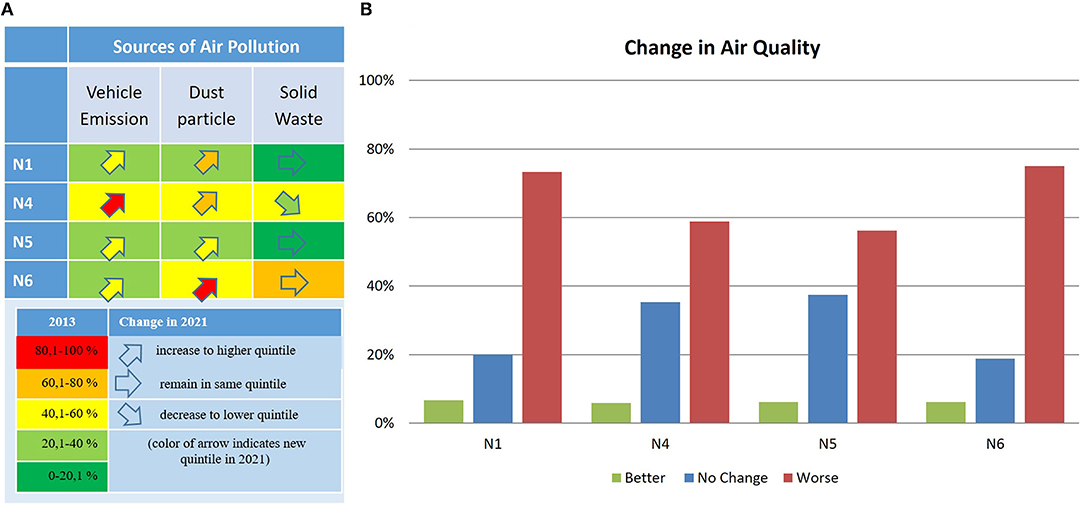
Figure 4. Changes in exposure to air pollution in neighborhood. (A) Per source of air pollution, (B) overall air quality.
Regarding noise pollution, noise from road traffic is increasingly perceived as a burden in neighborhood N1, while it remained on the same high level in N4 and decreased in N5 and N6 (Figure 5A). Perceived exposure to noise from other sources remains similarly low in most neighborhoods, except in N4, where most respondents perceive exposure to noise from crowds as a burden (Supplementary Table 12). Interestingly, in N1 and N5 respondents report that noise pollution in general has worsened (Figure 5B), which matches the perceived increase in noise pollution from road traffic in N1 but contradicts the perceived decrease of noise pollution in N5. This might indicate that households in N1 that mainly belong to the HSEC cluster are more aware and sensitive to noise pollution. Also, in N4 and N6 still a rather large share of around 40% report that the overall noise level has worsened, though only in N4 an increase in noise levels from crowds is reported.
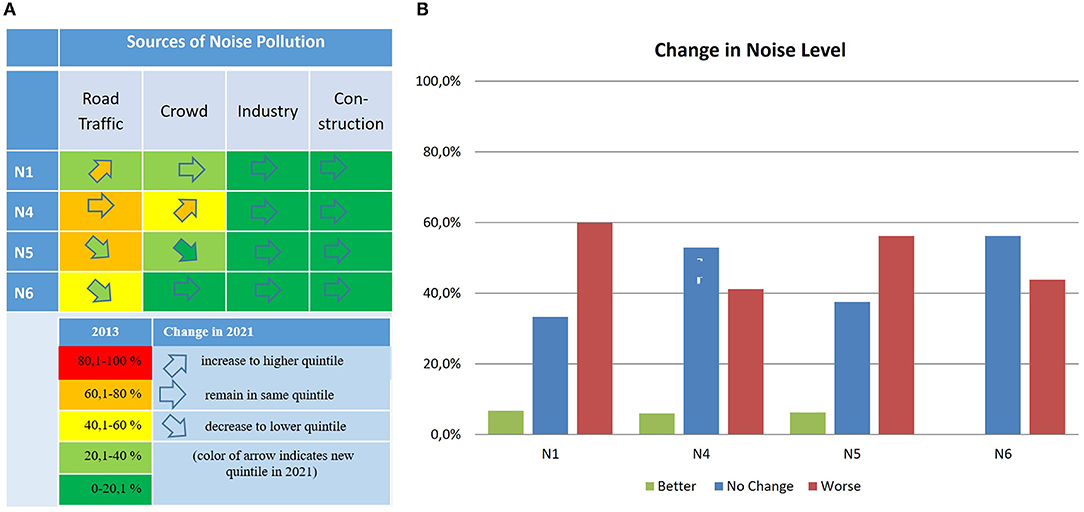
Figure 5. Changes in exposure to noise pollution in neighborhood. (A) Per source of noise pollution, (B) overall noise level.
Overall, Figures 3–5 shows that perceived exposure to environmental burdens in N1, which had the best-perceived environmental quality in 2013, has decreased in many aspects. At the same time, the situation in N4, which was the worst neighborhood in 2013, has also worsened for the use of pipe water for drinking, air pollution from vehicles and dust, and noise pollution from crowds. In N5 and N6 air pollution worsened, noise pollution improved, and water access worsened but only for N6. In summary, we can conclude that the exposure to environmental burdens has increased in general and horizontal environmental inequalities between neighborhoods in 2013 persisted in 2021.
Regarding the self-reported health effects, air pollution-related effects (respiratory diseases, allergic reactions) are still most often reported overall, which matches with the perceived increase in exposure to air pollution (Figure 6, Supplementary Table 13). The share of reported waterborne diseases has decreased or remained low in most neighborhoods. Also reported health effects from noise pollution remained on a low level similar to 2013, except in N5 where they increased significantly. As respondents from N5 also reported an increase in air pollution from vehicle emissions, this is probably due to the increasing amounts of road traffic in the neighborhood, though exposure to noise pollution from road traffic was not significantly mentioned above.
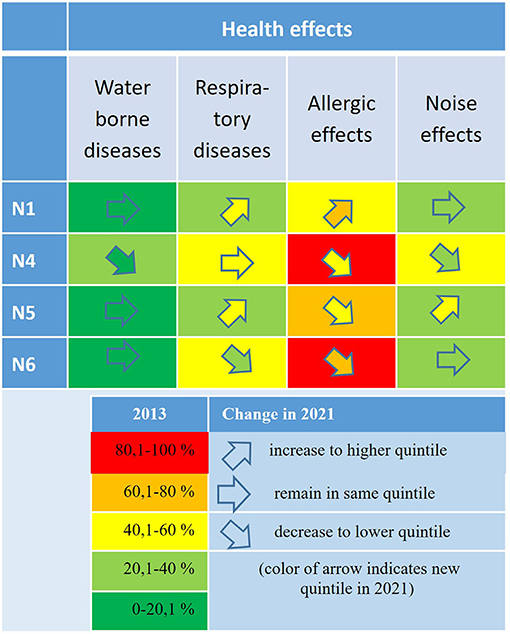
Figure 6. Changes in reported health effects per neighborhood.
A similar picture is found concerning the changes in vertical inequalities between socio-economic clusters in 2021 compared to 2013. Overall, the use of safe drinking water sources has worsened, and air and noise pollution levels have increased for all three socio-economic groups. At the same time, inequalities between the three groups have not increased.
The access to pipe water remained high for the HSE cluster, whereas it has decreased for the other two socio-economic clusters, strongest for the LSEC (Figure 7A). However, the use of pipe water for drinking has significantly decreased for all three SECs. The LSEC cluster includes the lowest share of respondents using pipe water and the highest percentage of respondents buying jar water (Supplementary Table 14). Nevertheless, the overall consumption pattern of the three SECs in terms of water use is similar with around 20–40% using pipe water, 60–70% buying jar water and a minority of <20% buying water from private tankers and indicating no inequalities (Supplementary Table 14). In line with that, around 65% in all three groups report that the water quality has more or less stayed the same (Figure 7B).
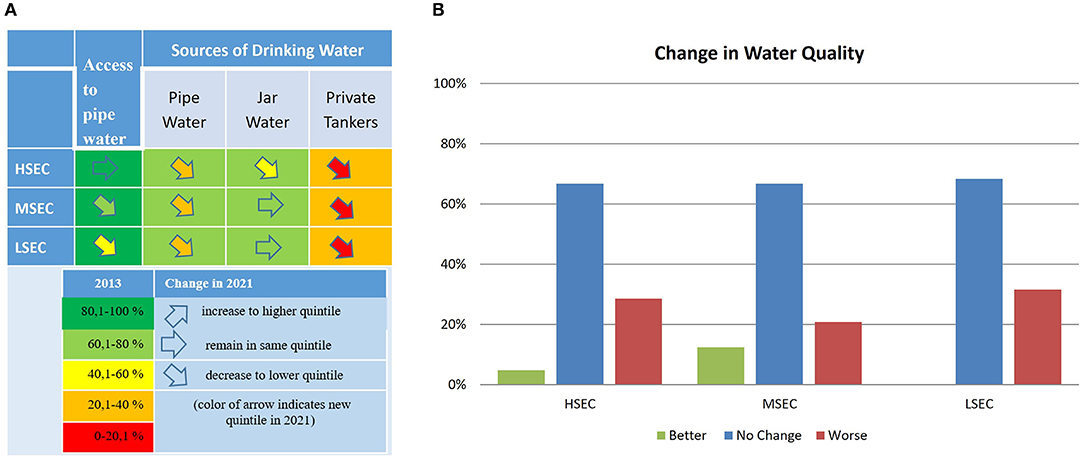
Figure 7. Changes in access to pipe water sources of drinking water in socio-economic clusters. (A) Per water source, (B) overall water quality.
Overall, a high share of respondents reported that they were exposed to air pollution from vehicle emissions and dust particles in 2021 (Supplementary Table 15). In line with that, the perceived exposure to vehicle emissions and dust has increased significantly for all the three SECs (Figure 8A). A majority of around 60% in each cluster reports that the overall air quality has worsened (Figure 8B). Nevertheless, two distinctions in perception of exposure to air pollution can be derived from Figure 8: First, the HSEC cluster has the largest share of respondents reporting a worsening of the air quality in general (Figure 8B) and with respect to vehicle emissions and dust particles (Supplementary Table 15), which might indicate that this group is least used to it and most aware of the changes. Second, the LSEC is the cluster most burdened still with air pollution from solid waste. A reason might be that solid waste stations are allocated in particular locations within the city, which high-income people consequently least prefer.
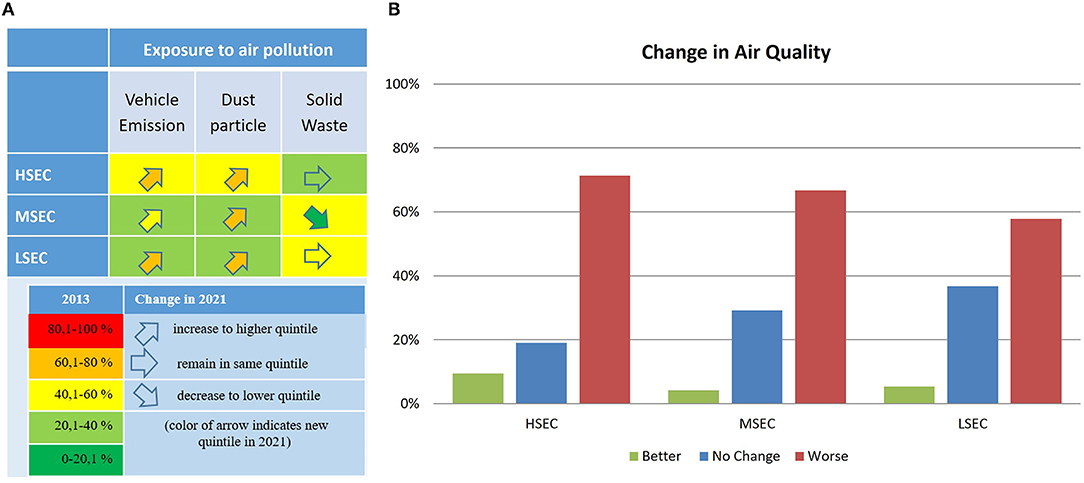
Figure 8. Changes in exposure to air pollution in socioeconomic clusters. (A) Per source of air pollution, (B) overall air quality.
A similar observation can be made concerning exposure to noise pollution from various sources. For LSEC and MSEC, the reported level of exposure remained pretty much the same for all sources of noise pollution, but perceived exposures for respondents from HSEC have increased in 2021 for all four sources (Figure 9A). In line with that higher share of respondents from the HSEC cluster stated the overall increase in noise levels (Figure 9B, Supplementary Table 16).
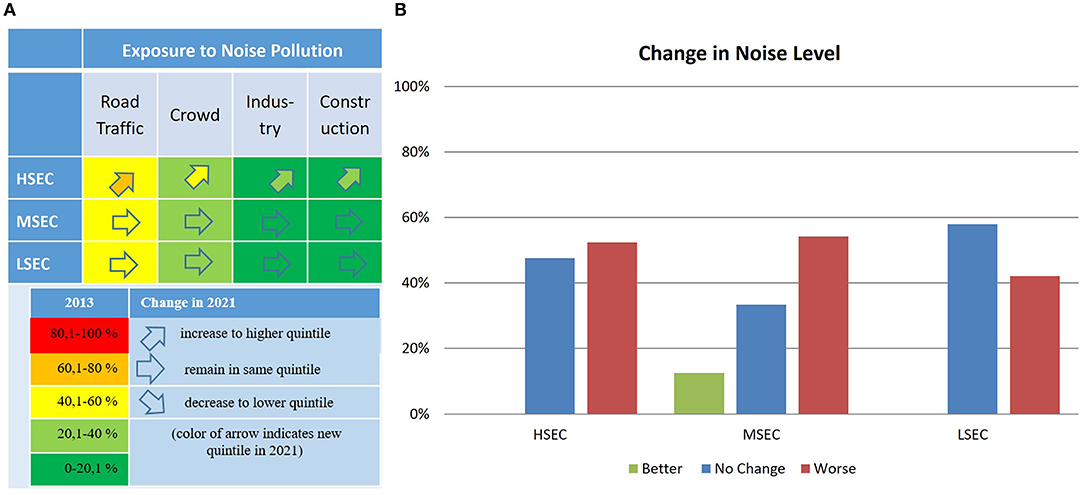
Figure 9. Changes in exposure to noise pollution in socio-economic clusters. (A) Per source of noise pollution, (B) overall noise level.
Concerning health effects, the percentages of reported waterborne diseases in 2021 remain on a similarly low level as in 2013 for all three clusters (Figure 10). Nevertheless, members of the LSEC still report the highest shares of waterborne diseases (Supplementary Table 17). On the other hand, respondents from HSEC report an increase of air pollution-related problems like respiratory diseases and other allergic reactions, which is in line with the high percentage of reported exposure. All three groups conveyed health effects from noise pollution to a similar degree, with the MSEC being slightly higher.
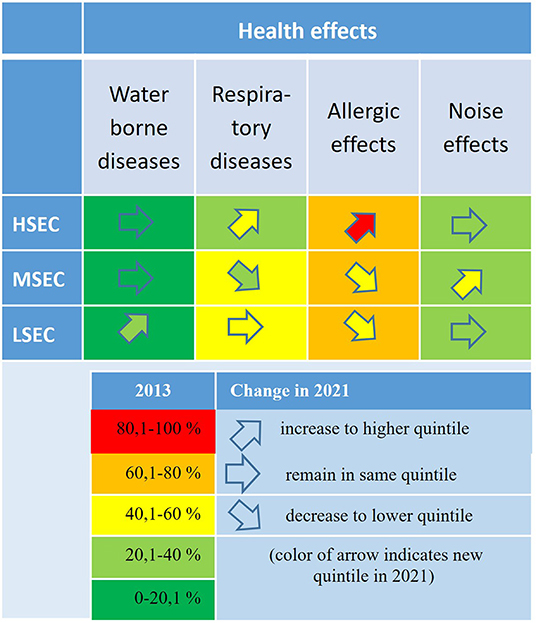
Figure 10. Changes in reported health effects per socio-economic cluster.
The DPSEEA Framework (WHO, 1999) we applied in this study to analyze environment inequalities is meant to support the understanding of driving forces of exposure to environmental burdens and health impacts and to support decision making on action to reduce environmental burdens (Hambling et al., 2011). In the following, we analyze drivers that contributed to the changes as perceived by the respondents, actions that households have taken to mitigate the level of the environmental burden, and actions they have perceived as taken by relevant authorities.
Most of the households report that the overall water quality has remained the same between 2013 and 2021. The worsening of the water quality is by the respondents mainly attributed to the earthquake in 2015, as the damage of water pipes due to the earthquake worsened the already insufficient piped water supply (Shrestha et al., 2016b) forcing households to shift to jar water. However (Pradhan et al., 2020), claim that the main reason for such infrastructure deficiencies, not only for water supply but other infrastructures as well, is the rapid urbanization. To mitigate the limited water availability after the earthquake, the city provided water at a discounted rate via tankers in neighborhoods N5 and N6. In the longer run, people are expecting a better water supply from the “Melamchi water supply project,” a government-led drinking water project initiated in 1998 and completed in 2021 to divert fresh water from Melamchi River to Kathmandu valley. The changes in reported waterborne diseases indicate an increasing awareness of the poor water quality as most households are either boiling or filtering or both before drinking water.
Regarding the perception of air quality change, around three-fourths of the households in N1 and N6 and more than half of the households in N4 and N5 reported worsening air quality in the last 7 years. According to the respondents, the primary reasons are the increase in number of cars on the streets in Kathmandu, creating emissions and transporting dust particles, and poor solid waste management. One respondent in N4 living near the main road complained, “We close our windows to prevent from air pollution; however, it cannot be shut for all the time, so we have to suffer from the pollution,” another one stated “sometimes when the waste is not picked up for several days, the condition is very bad, and additionally, we feel the smell from the river.” In neighborhood N5, several new constructions being erected after the earthquake are reported on contributing to air pollution from dust particles. In N6 respondents reported that the road extension project on the riverside has caused many adverse effects such as trees being cut and vehicle movements increasing on unpaved roads. Moreover, the increase in workshops, garment factories, and scrap factories are also mentioned to create additional air pollution. The only governmental action to mitigate air pollution from dust reported by households has been paving roads with asphalt in the last years. However, these works were carried out mostly on major roads and the secondary roads are mostly left unpaved leading to increasing dust pollution.
With respect to socio-economic clusters, more than half of the households of the HSEC cluster report an overall worsening of air quality, whereas around 26% of households in LSEC do so. The statements regarding the reasons for change manifest the above assumption that there are differences in awareness of bad environmental quality between SECs. One respondent from LSEC stated, “It does not matter how the environment condition is, we just need to have money for our daily life.” Another one responded, “We don't feel affected by environmental conditions as we are habituated with it.” Another respondent, a garbage collector, said that she is adjusted to smell from the garbage center and nearby river.
According to most of the respondents, the increase in number of vehicles is the major cause for the increase in noise level in all neighborhoods. The majority of households living near the main road reported that they suffer from loud noises due to traffic. The government introduced “no horn policy,” but this is not effective according to some households (Chauhan et al., 2021). Also, road expansions have led to a transformation of areas attracting small-scale workshops, industries, and garments factories to move into the neighborhood. Consequently, loading/ unloading activities of heavy vehicles for industries have increased together with an increase in vehicle flow, resulting in higher noise disturbances.
The analysis of environmental inequalities in Kathmandu, Nepal in 2013 resulted in several horizontal inequalities between the different neighborhoods, confirming the spatiality of inequalities (Wei, 2017) diagnosed for Asia. In particular, inequalities were found in the use of drinking water sources, exposure to air pollution from vehicle emissions and solid waste, and exposure to noise pollution from road traffic and crowds. Respondents from neighborhood N4 were mostly reporting exposure toward the various environmental burdens. Many of them were burdened by multiple sources (Morello-Frosch et al., 2011), while respondents from N1 reported the least environmental exposure. From the other neighborhoods, neighborhood N5 is particularly burdened by noise pollution from road traffic and N6 by air pollution from solid waste. Also, the self-reported health effects in 2013 revealed statistically significant inequalities between the various neighborhoods, supporting earlier studies that associations between levels of exposure to environmental burden and health effects exist in Kathmandu (Gurung et al., 2017b). Neighborhood N1 is showing the least reported health effects among all neighborhoods, while N4 is among the top group with the most self-reported health effects for all health effects.
On the other hand, vertical inequalities between the three socio-economic groups could not be identified clearly, validating earlier findings that the socio-economic status does not have a strong influence (Gurung et al., 2017b). Statistically significant inequalities were only found in exposure to air pollution, with the HSEC reporting the highest levels of exposure to dust particles, while the LSEC is reporting the highest level of exposure to air pollution resulting from solid waste. However, the socio-economic dimension of inequalities is inherent in the analysis of vertical inequalities between neighborhoods because the composition of sample households in terms of socio-economic profile differs between the six neighborhoods. Neighborhood N1, which shows the lowest levels of exposure, has more than 60% of the sample from the HSEC cluster, while neighborhoods N4, 5, and 6 have a relatively high share of LSEC households in the sample and are all burdened disproportionally more by certain environmental stressors. Thus, we can conclude that horizontal inequalities between neighborhoods also affect socio-economic groups disproportionately with environmental burdens because the two cannot be strictly separated from each other. In conclusion, both need to be addressed jointly through integrated measures to reduce environmental inequalities (Kalasa et al., 2021).
The analysis of perceived exposure to environmental burdens in 2021 and the changes in comparison to 2013 results in two main findings. First, the perceived exposure to environmental burdens has predominantly increased since 2013 in all neighborhoods. The access to safe and high-quality drinking water has worsened in most neighborhoods, mainly explained by the earthquake in 2015 that destroyed several water pipes. Most strongly, exposure to air pollution from vehicle emissions and dust particles has increased as a result of an increase in urbanization and motorization and a lack of stringent measures from relevant authorities. The same reason applies to the increase in exposure to noise, which is predominantly perceived by respondents in the better-off neighborhood N1.
Second, environmental inequalities between the different neighborhoods and socio-economic groups have not changed significantly compared to 2013. Given the overall increase in levels of exposure as described above, we can rather say that existing inequalities between different neighborhoods have somewhat diminished. This conclusion is supported by the finding that the reported health effects in the better of neighborhood N1 have increased, while they have decreased in the other neighborhoods. In that sense, we see a reduction of inequalities at a low level, not in the way that the disproportionately burdened areas improved in environmental qualities, but that the better-off areas get worse.
The analysis of vertical inequalities between socio-economic groups points at another aspect in environmental justice studies referred to as procedural justice, i.e., the fairness of environmental policy making and the ability and rights of all groups to raise concerns and be heard (Walker, 2009). The analysis in Section Vertical Inequalities in Perceived Exposures and Self-Reported Health Effects showed that respondents from the HSEC are reporting increasing levels of exposure more often, particularly in relation to air pollution from vehicles and dust and noise pollution from road traffic, than respondents from the MSEC or LSEC groups. Similar patterns were also found in air pollution exposure studies in other cities from the Global South (Becerra et al., 2020). The assumption that this is an indication of unequal abilities and chances to raise concerns about the individual living conditions is corroborated with statements from respondents, in which high acceptance and habituation are detected from these groups owing to their occupation and their priority to livelihood, especially with respect to air pollution (Navarro, 2017).
This study shows that environmental inequalities in Kathmandu have not been reduced between 2013 and 2021, as demanded in SDG 10, but rather persisted. Moreover, also concerning SDG 2 (good health and wellbeing), SDG 6 (clean water and sanitation), and SDG 11.6 (environmental impacts of cities, particularly air pollution), no improvements can be identified based on the perception of the interviewed citizens. This can be partly explained by natural disasters, i.e., the earthquake affecting the water pipe system, but is mainly due to impacts resulting from the ongoing urbanization, industrialization and motorization, as it can be seen in many countries and cities of the Global South (Sen Roy, 2018). Moreover, a recent study identified shortcomings of environmental policymaking in Nepal and recommended novel transdisciplinary policymaking approaches to solve the country's complex environmental issues and development imperatives (Aryal et al., 2021).
The analysis of causes of exposure to environmental burdens and health effects, as reported by the respondents, reveals that mainly spatial factors of the urban fabric and its dynamics contribute as driving forces to the experienced burdens. The leading causes mentioned are the
• intermittent water supply through pipes owing to the earthquake;
• intensification of traffic and vehicles on both primary roads as well as secondary roads resulting in higher noise as well as air pollution;
• changes in land use structures, i.e., more commercial and industrial activities in residential areas resulting in higher noise levels;
• locational factors within neighborhoods such as proximity to garbage collection points, the vegetable market, or the river that are often unmanaged;
• increase of garbage in the streets and poorly implemented solid waste management.
As the above-reported factors are all related to the physical environment of cities and its management, urban planning and management-related approaches and interventions are most suitable to mitigate inequalities (Flacke et al., 2016). However, though local governments are responsible for preparing urban plans including land use plans, they lack legal instruments to control land use development effectively (Pradhan et al., 2020). Given the identified interrelations between horizontal and vertical inequalities new spatial planning approaches need to consider the vulnerability of the population (Köckler, 2014).
The small-scaled analysis of environmental inequalities at the neighborhood level also shows that differences between neighborhoods exist. Moreover, answers from respondents on reasons for change even illustrate intra neighborhood differences in levels of exposure. While the exposure to noise and air pollution from cars is perceived as high on the main roads, it is way less so far away from it. Likewise, respondents who live close to the river particularly articulated exposure to air pollution from solid waste more frequently. Thus, to mitigate such burden and the linked inequalities, small–scaled planning approaches are needed to target interventions at these specific locations.
The key limitation of the study is that it relies solely on self-reported data of perceived exposure to environmental burdens and resulting health effects. It is argued that individuals' subjective perceptions may not be necessarily consistent with the objective data (Berhe et al., 2014). Thus, it would have been very insightful to compare the perceived levels of exposure with measured or modeled data of air and noise pollution and drinking water supply. However, such data is not available at the neighborhood level, which is a typical problem for many cities of the Global South. Nevertheless, the subjective perspective on environmental inequalities adds to the existing scholarship on the topic as it allows the consideration of the social dimension of urban sustainability (Chiarini et al., 2020). This is particularly relevant because other studies on environmental health issues in Kathmandu (Kurmi et al., 2016; Thapa et al., 2019; Chauhan et al., 2021) all make use solely of objectively measured data. With respect to urban environmental quality, van Kamp et al. (2003) even argue that the objective environment is less important than the perception of this environment.
A potential remedy could be using satellite image data via remote sensing methods. Hoek (2017) e.g., recently reviewed methods for assessing exposure to air pollutants from satellite measurements. However, the spatial resolution of such methods is not yet fine-grained enough to allow the intra-city study of inequalities (Streets et al., 2013), satellites are not able to measure near-surface levels of air pollution (Duncan et al., 2014), measure air pollution and satellite-based measurements do not allow any inference to the sources of pollution and thus are not useful to identify potential driving forces (Benedetti et al., 2018).
A second limitation of the study is its spatial scale. Boyce et al. (2016) showed that measures of inequalities are sensitive to both spatial scale and population weighting and thus recommend fine-grained scales to avoid ecological fallacies. In this study, the chosen spatial scale of neighborhoods is already rather fine-grained. However, we found even intra-neighborhood differences in exposure, e.g., to noise and air pollution from large streets. Thus, future studies of environmental inequalities might need to adopt stricter spatial-analytical frameworks based on methods of spatial clustering of single household locations or larger samples to detect pockets of disproportionate environmental burdens within neighborhoods.
Finally, this study's data collection and analysis were affected by two major disasters, the earthquake in 2015 and the Covid 19 pandemic starting in 2020, which could only be partly considered. The earthquake that hit the city of Kathmandu in 2015, led to damages to the water infrastructure system and evidently affected accessibility to drinking water, as discussed above. The Covid 19 pandemic affected the data collection in spring 2021, which had to be scaled down because of restricted access to areas and households for interviews. In how far the pandemic influenced the awareness and perceived exposure of environmental burdens could not be included in the study.
In the study, we found statistically significant environmental inequalities in Kathmandu in terms of access to basic water infrastructure, exposure to environmental burdens, and resulting health effects. Environmental inequalities exist in a horizontal perspective between neighborhoods rather than a vertical perspective between socio-economic groups. However, the latter is also present in spatial inequalities between neighborhoods. Changes in environmental inequalities over the 8-year study period show an overall worsening of environmental quality. At the same time, the environmental inequalities between the neighborhoods remain more or less constant. Whether environmental inequalities in Kathmandu converge or diverge (Nijman and Wei, 2020) in the long run must be studied over more extended periods. The study further showed that members of the high-socioeconomic clusters are more aware and concerned about environmental pollution levels in the neighborhood, indicating issues of procedural environmental injustices (Walker, 2009).
Drivers of inequalities in environmental burdens and health effects in Kathmandu are mainly attributed to the increasing number of motorized vehicles on the streets, changes in land use structure, and problems of solid waste management and are thus outcomes of the increasing urbanization and motorization of the city. Therefore, suitable measures to mitigate the inequalities need to address the spatial impacts of the ongoing urbanization. Specific measures have been undertaken already, mainly to complete the water supply project for the city, the paving of main roads, implementation of a no-horn policy, and community-based activities for the cleaning of the river. While these show in parts already positive effects on exposure levels, measures specifically to reduce air pollution, such as urban greening (Gelan and Girma, 2021) or promoting non-motorized modes of transport (Giles-Corti et al., 2016), are urgently needed to reduce environmental burdens. Given the intertwined horizontal and vertical inequalities, planning measures need to consider the population's vulnerability (Shrestha et al., 2016a).
Future research needs and directions are, first and foremost, more studies of environmental inequalities at the intra-city level of Global South cities and the influence of urbanization and industrialization on these to better understand patterns and drivers of environmental inequalities and to devise suitable policies. In addition to that, the added value of modern earth observation methods and data to study environmental inequalities and health issues (Weigand et al., 2019) may be further investigated to overcome current data gaps and shortcomings. In the same line, concepts and methods to engage the population in data collection and monitoring efforts of exposure levels as well as the implementation of interventions following a citizen science approach (Haklay et al., 2021) may be needed. The introduction of such activities, including all socio-economic groups, might also help create awareness of environmental burdens and thereby reduce procedural inequalities.
The original contributions presented in the study are included in the article/Supplementary Material, further inquiries can be directed to the corresponding author.
The original study and survey conducted in 2013 was conceptualized and implemented by BM, supported by JF and JM. The 2021 survey was conceptualized by all authors and implemented by BM and RS. Data analysis was done by BM and RS. Data curation was done by BM. JF wrote the original draft of the manuscript. All authors aided in manuscript revision, read, and approved the submitted version.
The first field survey done in 2013 in Kathmandu was supported by a NFP MSc scholarship provided by Nuffic.
BM was employed by Lumanti Support Group for Shelter.
The remaining authors declare that the research was conducted in the absence of any commercial or financial relationships that could be construed as a potential conflict of interest.
All claims expressed in this article are solely those of the authors and do not necessarily represent those of their affiliated organizations, or those of the publisher, the editors and the reviewers. Any product that may be evaluated in this article, or claim that may be made by its manufacturer, is not guaranteed or endorsed by the publisher.
We would like to thank all the respondents during the two field surveys in 2013 and 2021 for taking time to answer our questions.
The Supplementary Material for this article can be found online at: https://www.frontiersin.org/articles/10.3389/frsc.2022.835534/full#supplementary-material
Amoatey, P., Omidvarbona, H., Baawain, M. S., Al-Mayahi, A., Al-Mamun, A., and Al-Harthy, I. (2020). Exposure assessment to road traffic noise levels and health effects in an arid urban area. Environ. Sci. Poll. Res. 27, 35051–35064. doi: 10.1007/s11356-020-09785-y
Aryal, K., Laudari, H. K., Neupane, P. R., and Maraseni, T. (2021). Who shapes the environmental policy in the global south? Unpacking the reality of Nepal. Environ. Sci. Pol. 121, 78–88. doi: 10.1016/j.envsci.2021.04.008
Bambra, C., Smith, K. E., and Pearce, J. (2019). Scaling up: the politics of health and place. Soc. Sci. Med. 232, 36–42. doi: 10.1016/j.socscimed.2019.04.036
Becerra, S., Belland, M., Bonnassieux, A., and Liousse, C. (2020). ‘Living with’ air pollution in Abidjan (Cote d'Ivoire): a study of risk culture and silent suffering in three occupational areas. Health Risk Soc. 22, 86–106. doi: 10.1080/13698575.2020.1721443
Benedetti, A., Reid, J. S., Knippertz, P., Marsham, J. H., Di Giuseppe, F., Rémy, S., et al. (2018). Status and future of numerical atmospheric aerosol prediction with a focus on data requirements. Atmos. Chem. Phys. 18, 10615–10643. doi: 10.5194/acp-18-10615-2018
Berhe, R. T., Martinez, J., and Verplanke, J. (2014). Adaptation and dissonance in quality of life: a case study in Mekelle, Ethiopia. Soc. Indicat. Res. 118, 535–554. doi: 10.1007/s11205-013-0448-y
Bisri, M. B. F., and Beniya, S. (2016). Analyzing the National disaster response framework and inter-organizational network of the 2015 Nepal/Gorkha Earthquake. Proc. Eng. 159, 19–26. doi: 10.1016/j.proeng.2016.08.059
Boyce, J. K., Zwickl, K., and Ash, M. (2016). Measuring environmental inequality. Ecol. Econ. 124, 114–123. doi: 10.1016/j.ecolecon.2016.01.014
Briggs,. D. (2003). Making a Difference: Indicators to Improve Children's Environmental Health. Geneva: World Health Organization.
Brulle, R. J., and Pellow, D. N. (2006). Environmental justice: human health and environmental inequalities. Ann. Rev. Public Health 27, 103–124. doi: 10.1146/annurev.publhealth.27.021405.102124
CBS. (2012). National Population and Housing Census 2011: National Report (Vol. 1). Kathmandu: Central Bureau of Statistics. Available online at: https://unstats.un.org/unsd/demographic-social/census/documents/Nepal/Nepal-Census-2011-Vol1.pdf
Chauhan, R., Shrestha, A., and Khanal, D. (2021). Noise pollution and effectiveness of policy interventions for its control in Kathmandu, Nepal. Environ. Sci. Poll. Res. 28, 35678–35689. doi: 10.1007/s11356-021-13236-7
Chiarini, B., D'Agostino, A., Marzano, E., and Regoli, A. (2020). The perception of air pollution and noise in urban environments: a subjective indicator across European countries. J. Environ. Manag. 263:110272. doi: 10.1016/j.jenvman.2020.110272
Cohen, A. J., Brauer, M., Burnett, R., Anderson, H. R., Frostad, J., Estep, K., et al. (2017). Estimates and 25-year trends of the global burden of disease attributable to ambient air pollution: an analysis of data from the Global Burden of Diseases Study 2015. Lancet 389, 1907–1918. doi: 10.1016/S0140-6736(17)30505-6
Duncan, B. N., Prados, A. I., Lamsal, L. N., Liu, Y., Streets, D. G., Gupta, P., et al. (2014). Satellite data of atmospheric pollution for U.S. air quality applications: examples of applications, summary of data end-user resources, answers to FAQs, and common mistakes to avoid. Atmos. Environ. 94, 647–662. doi: 10.1016/j.atmosenv.2014.05.061
Fenton, P., and Gustafsson, S. (2017). Moving from high-level words to local action—governance for urban sustainability in municipalities. Curr. Opin. Environ. Sustainabil. 26–27, 129–133. doi: 10.1016/j.cosust.2017.07.009
Flacke, J., Schüle, S., Köckler, H., and Bolte, G. (2016). Mapping environmental inequalities relevant for health for informing urban planning interventions—a case study in the city of Dortmund, Germany. Int. J. Environ. Res. Public Health 13:711. doi: 10.3390/ijerph13070711
Flanagan, E., Mattisson, K., Walles, J., Abera, A., Eriksson, A., Balidemaj, F., et al. (2021). Air pollution and urban green space: evidence of environmental injustice in Adama, Ethiopia. Front. Sustain. Cit. 3:728384. doi: 10.3389/frsc.2021.728384
Gelan, E., and Girma, Y. (2021). Urban green infrastructure accessibility for the achievement of SDG 11 in rapidly urbanizing cities of Ethiopia. GeoJournal. 2021:7. doi: 10.1007/s10708-021-10404-7
Giles-Corti, B., Vernez-Moudon, A., Reis, R., Turrell, G., Dannenberg, A. L., Badland, H., et al. (2016). City planning and population health: a global challenge. Lancet 388, 2912–2924. doi: 10.1016/S0140-6736(16)30066-6
Gurung, A., Levy, J. I., and Bell, M. L. (2017a). Modeling the intraurban variation in nitrogen dioxide in urban areas in Kathmandu Valley, Nepal. Environ. Res. 155, 42–48. doi: 10.1016/j.envres.2017.01.038
Gurung, A., Son, J.-Y., and Bell, M. L. (2017b). Particulate matter and risk of hospital admission in the Kathmandu Valley, Nepal: a case-crossover study. Am. J. Epidemiol. 186, 573–580. doi: 10.1093/aje/kwx135
Haklay, M., Fraisl, D., Greshake Tzovaras, B., Hecker, S., Gold, M., Hager, G., et al. (2021). Contours of citizen science: a vignette study. Royal Soc. Open Sci. 8:202108. doi: 10.1098/rsos.202108
Hambling, T., Weinstein, P., and Slaney, D. (2011). A review of frameworks for developing environmental health indicators for climate change and health. Int. J. Environ. Res. Public Health. 8, 1–22. doi: 10.3390/ijerph8072854
Harpham, T. (2009). Urban health in developing countries: what do we know and where do we go? Health Place 15, 107–116. doi: 10.1016/j.healthplace.2008.03.004
Hoek, G. (2017). Methods for assessing long-term exposures to outdoor air pollutants. Curr. Environ. Health Rep. 4, 450–462. doi: 10.1007/s40572-017-0169-5
Huizenga, C., and Leather, J. (2012). “Transport and climate policy in the developing world – the region that matters most,” in Cars and Carbon, ed T. I. Zachariadis Dordrecht: Springer Netherlands), 371–391. doi: 10.1007/978-94-007-2123-4_16
Kalasa, B., Eloundou-Enyegue, P., and Giroux, S. C. (2021). Horizontal versus vertical inequalities: the relative significance of geography versus class in mapping subnational fertility. Lancet Global Health 9, e730–e731. doi: 10.1016/S2214-109X(21)00171-6
Khatakho, R., Gautam, D., Aryal, K. R., Pandey, V. P., Rupakhety, R., Lamichhane, S., et al. (2021). Multi-hazard risk assessment of Kathmandu Valley, Nepal. Sustainability 13:5369. doi: 10.3390/su13105369
Köckler, H. (2014). Environmental Justice – aspects and questions for planning procedures. UVPreport. 28, 139–142.
Köckler, H., and Flacke, J. (2013). “Health-related inequalities in the global north and south – a framework for spatially explicit environmental justice indicators,” in 14th N-AERUS / GISDECO Conference. Enschede.
Kumar, P., Morawska, L., Birmili, W., Paasonen, P., Hu, M., Kulmala, M., et al. (2014). Ultrafine particles in cities. Environ. Int. 66, 1–10. doi: 10.1016/j.envint.2014.01.013
Kurmi, O., Regmi, P. R., and Pant, P. R. (2016). Implication of Air pollution on health effects in Nepal: lessons from global research. Nepal J. Epidemiol. 6, 525–527. doi: 10.3126/nje.v6i1.14733
Lee, S.-Y., Chang, Y.-S., and Cho, S.-H. (2013). Allergic diseases and air pollution. Asia Pacific Allergy 3:145. doi: 10.5415/apallergy.2013.3.3.145
Maantay, J. (2007). Asthma and air pollution in the Bronx: methodological and data considerations in using GIS for environmental justice and health research. Environ. Just. Populat. Health Crit. Theor. GIS 13, 32–56. doi: 10.1016/j.healthplace.2005.09.009
Maharjan, B. (2014). Development of Environmental and Health Indicators Related to Inequalities and Assessing of Environmental Justice in Kathmandu, Nepal. (MSc thesis), University of Twente, Enschede, Netherlands.
Maharjan, S., Joshi, T. P., and Shrestha, S. M. (2018). Poor quality of treated water in Kathmandu: comparison with Nepal drinking water quality standards. Tribhuvan Univ. J. Microbiol. 5, 83–88. doi: 10.3126/tujm.v5i0.22319
Mohanty, A. (2011). State of environment in Kathmandu Valley, Nepal: a special review. J. Instit. Eng. 8, 126–137. doi: 10.3126/jie.v8i1-2.5103
Morello-Frosch, R., Zuk, M., Jerrett, M., Shamasunder, B., and Kyle, A. D. (2011). Understanding the cumulative impacts of inequalities in environmental health: implications for policy. Health Affairs 30, 879–887. doi: 10.1377/hlthaff.2011.0153
Morris, G. P., Beck, S. A., Hanlon, P., and Robertson, R. (2006). Getting strategic about the environment and health. Public Health. 120, 889–903. doi: 10.1016/j.puhe.2006.05.022
Navarro, O. (2017). “Social inequality and environmental risk perception,” in Handbook of Environmental Psychology and Quality of Life Research, eds G. Fleury-Bahi, E. Pol, and O. Navarro (Cham: Springer International Publishing), 503–518. doi: 10.1007/978-3-319-31416-7_27
Nepal Health Research Council (2009). Situation Analysis and Environmental Health in Nepal 2009. Kathmandu: Nepal Health Research Council.
Nijman, J., and Wei, Y. D. (2020). Urban inequalities in the 21st century economy. Appl. Geogr. 117:102188. doi: 10.1016/j.apgeog.2020.102188
Nongkynrih, B., Gupta, S., and Jamir, L. (2014). Community noise pollution in urban India: need for public health action. Indian J. Commun. Med. 39:8. doi: 10.4103/0970-0218.126342
Pant, P. (2009). Kathmandu Valley Profile Briefing Paper [Briefing paper]. Kathmandu: Governance and Infrastructure Development Challenges Workshop.
Pickett, K. E., and Pearl, M. (2001). Multilevel analyses of neighbourhood socioeconomic context and health outcomes: a critical review. J. Epidemiol. Commun. Health 55, 111–122. doi: 10.1136/jech.55.2.111
Ploubidis, G. B., and Grundy, E. (2011). Health measurement in population surveys: combining information from self-reported and observer-measured health indicators. Demography 48, 699–724. doi: 10.1007/s13524-011-0028-1
Pradhan, B., Sharma, P., and Pradhan, P. K. (2020). “Urban growth and environment and health hazards in Kathmandu Valley, Nepal,” in Urban Health Risk and Resilience in Asian Cities, eds R. B. Singh, B. Srinagesh, and S. Anand (Singapore: Springer Singapore), 293–324. doi: 10.1007/978-981-15-1205-6_17
Reinmuth-Selzle, K., Kampf, C. J., Lucas, K., Lang-Yona, N., Fröhlich-Nowoisky, J., Shiraiwa, M., et al. (2017). Air pollution and climate change effects on allergies in the anthropocene: abundance, interaction, and modification of allergens and adjuvants. Environ. Sci. Technol. 51, 4119–4141. doi: 10.1021/acs.est.6b04908
Rijal, N., Acharya, J., Adhikari, S., Upadhaya, B. P., Shakya, U., Kansakar, P., et al. (2019). Changing epidemiology and antimicrobial resistance in Vibrio cholerae: AMR surveillance findings (2006–2016) from Nepal. BMC Infect. Dis. 19:801. doi: 10.1186/s12879-019-4432-2
Riva, M., Gauvin, L., and Barnett, T. A. (2007). Toward the next generation of research into small area effects on health: a synthesis of multilevel investigations published since July 1998. J. Epidemiol. Commun. Health 61, 853–861. doi: 10.1136/jech.2006.050740
Rüttenauer, T. (2018). Neighbours matter: a nation-wide small-area assessment of environmental inequality in Germany. Soc. Sci. Res. 70, 198–211. doi: 10.1016/j.ssresearch.2017.11.009
Sen Roy, S. (2018). “Resilient and sustainable cities,” in Linking Gender to Climate Change Impacts in the Global South, ed S. Sen Roy (Cham: Springer International Publishing), 117–137. doi: 10.1007/978-3-319-75777-3_6
Shah, J. J., gpal, T., and Brandon, C. J. (1997). Urban Air Quality Management Strategy in Asia: Guidebook. Washington, DC: The World Bank. doi: 10.1596/0-8213-4032-8
Shao, S., Liu, L., and Tian, Z. (2021). Does the environmental inequality matter? A literature review. Environ. Geochem. Health 2021:2. doi: 10.1007/s10653-021-00921-2
Shrestha, R., Flacke, J., Martinez, J. A., and van Maarseveen, M. (2016a). Environmental health related socio-spatial inequalities: identifying “hotspots” of environmental burdens and social vulnerability. Int. J. Environ. Res. Public Health. 13, 1–13. doi: 10.3390/ijerph13070691
Shrestha, S., Aihara, Y., Kondo, N., and Rajbhandari, S. (2016b). Household Water Use in the Kathmandu Valley: A Dry Season Survey (Kofu-shi: Interdisciplinary Center for River Basin Environment), 32.
Soja, E. W. (2010). Seeking Spatial Justice. Minneapolis, MN: University of Minnesota Press. doi: 10.5749/minnesota/9780816666676.001.0001
Streets, D. G., Canty, T., Carmichael, G. R., Foy, B., Dickerson, R. R., Duncan, B. N., et al. (2013). Emissions estimation from satellite retrievals: a review of current capability. Atmos. Environ. 77, 1011–1042. doi: 10.1016/j.atmosenv.2013.05.051
Subedi, M., and Aryal, M. (2010). Public perception about drinking jar water and its bacteriological analysis. Nepal Medical Coll. J. 12, 110–114.
Thapa, B., Ishidaira, H., Pandey, V., Bhandari, T., and Shakya, N. (2018). Evaluation of water security in Kathmandu Valley before and after water transfer from another Basin. Water 10:224. doi: 10.3390/w10020224
Thapa, K., Shrestha, S. M., Rawal, D. S., and Pant, B. R. (2019). Quality of drinking water in Kathmandu valley, Nepal. Sustain. Water Resour. Manag. 5, 1995–2000. doi: 10.1007/s40899-019-00354-x
Thapa, R. B., Murayama, Y., and Ale, S. (2008). Kathmandu. Cities 25, 45–57. doi: 10.1016/j.cities.2007.10.001
van Kamp, I., Leidelmeijer, K., Marsman, G., and de Hollander, A. (2003). Urban environmental quality and human well-being towards a conceptual framework and demarcation of concepts; a literature study. Landscape Urban Plan. 14:3. doi: 10.1016/S0169-2046(02)00232-3
Walker, G. (2009). Beyond distribution and proximity: exploring the multiple spatialities of environmental justice. Antipode 41, 614–636. doi: 10.1111/j.1467-8330.2009.00691.x
Warner, N. R., Levy, J., Harpp, K., and Farruggia, F. (2008). Drinking water quality in Nepal's Kathmandu Valley: a survey and assessment of selected controlling site characteristics. Hydrogeol. J. 16, 321–334. doi: 10.1007/s10040-007-0238-1
Wei, Y. D. (2017). Geography of inequality in Asia. Geograph. Rev. 107, 263–275. doi: 10.1111/j.1931-0846.2016.12212.x
Weigand, M., Wurm, M., Dech, S., and Taubenböck, H. (2019). Remote sensing in environmental justice research—a review. ISPRS Int. J. Geo Informat. 8:20. doi: 10.3390/ijgi8010020
WHO (1999). Environmental Health Indicators. Framework and Methodologies. Geneva: World Health Organization.
Keywords: inequalities, environmental health, Global South, air pollution, noise pollution, access to water, Kathmandu, Nepal
Citation: Flacke J, Maharjan B, Shrestha R and Martinez J (2022) Environmental Inequalities in Kathmandu, Nepal—Household Perceptions of Changes Between 2013 and 2021. Front. Sustain. Cities 4:835534. doi: 10.3389/frsc.2022.835534
Received: 14 December 2021; Accepted: 21 February 2022;
Published: 28 March 2022.
Edited by:
Yuli Shan, University of Groningen, NetherlandsReviewed by:
Anzhelika Antipova, University of Memphis, United StatesCopyright © 2022 Flacke, Maharjan, Shrestha and Martinez. This is an open-access article distributed under the terms of the Creative Commons Attribution License (CC BY). The use, distribution or reproduction in other forums is permitted, provided the original author(s) and the copyright owner(s) are credited and that the original publication in this journal is cited, in accordance with accepted academic practice. No use, distribution or reproduction is permitted which does not comply with these terms.
*Correspondence: Johannes Flacke, ai5mbGFja2VAdXR3ZW50ZS5ubA==
Disclaimer: All claims expressed in this article are solely those of the authors and do not necessarily represent those of their affiliated organizations, or those of the publisher, the editors and the reviewers. Any product that may be evaluated in this article or claim that may be made by its manufacturer is not guaranteed or endorsed by the publisher.
Research integrity at Frontiers
Learn more about the work of our research integrity team to safeguard the quality of each article we publish.