- 1School of Science and Technology, Hong Kong Metropolitan University, Hong Kong, China
- 2Building Energy Research Group, Department of Architecture and Civil Engineering, City University of Hong Kong, Kowloon, Hong Kong SAR, China
Estimation of internal daylight availability is the key step in evaluating various daylighting schemes. Interior daylight is often expressed as daylight factor under the traditional International Commission on Illumination (CIE) overcast sky. Nonetheless, such approach may be inflexible to estimate the kinetic situations as the solar locations vary under cloudless skies. Recently, the CIE adopted 15 standard skies covering the usual skies found in the world. The interior daylight illuminance is influenced by the sky conditions in terms of luminance levels and distributions with respect to the window-facing orientation at any given period. The daylight coefficient concept considering the variations of the sky luminance patterns can be employed to accurately compute the indoor daylight level. A full-scale computer simulation can be costly in modeling the building geometry with a long simulation time. Moreover, additional times and advanced skills are required for preparation and post-processing. Simple design programs would be convenient and helpful in preliminary design phase when various designs and schemes are being studied and analyzed. This paper adopts a simple computer program for computing the interior daylight under the 15 CIE standard skies. The capability of the suggested software was assessed against the simulated results using a computer program, namely, RADIANCE, and the field measurement readings. The running time based on the simple program was far less than that using RADIANCE. The findings showed that the internal daylight simulated by the proposed simple software were in good agreement with the simulated results by RADIANCE and measured readings. The peak daylight factor discrepancy was <2%, and the RMSE was 14.5% of the corresponding measured average values.
Introduction
Daylighting has long been an essential architecture issue in visual comfort (Escuyer and Fontoynont, 2001) and passive energy-efficient building designs (Li and Lam, 2003; Lou et al., 2017). The determination of the interior daylight level is an important step in assessing daylighting schemes. Quite often, the usual approach for calculating the internal daylight from outdoor illuminance is expressed using daylight factor (DF), which is defined as the interior daylight divided by the corresponding horizontal sky illuminance available from an unobstructed International Commission on Illumination (CIE, 1994) overcast sky (i.e., no direct component). The approach is used in many European countries, especially in the UK where the approach and the related simple calculation tools have been established to predict DFs at different phases of the design procedures (British Standards Institution, 2019). In general, the method is simple to apply, but it is inflexible to simulate the kinetic situations in daylight illuminance since the solar location varies under partly cloudy and clear skies. For sites where partly cloudy or cloudless skies appear more often, the conventional DF method seems not suitable for determining internal daylight. Indoor daylight illuminances largely rely on the precise distribution of sky luminance at the same period. In 1983, the daylight coefficient (DC) theory, which considers the variations of sky luminance, was established (Tregenza and Waters, 1983). The CIE has employed a set of 15 sky standards including all possible range of skies in nature (CIE, 2003). As reported by many investigators, all the CIE sky standards give a fine total skeleton for denoting the real sky situations, and the prevailing climate for some places can be effectively identified by a subgroup of three to four CIE standard skies (Tregenza, 1999a; Li et al., 2003). Using the DC method for computing daylight illuminance can be quite complicated. In a previous study, we worked out simple steps to estimate the interior daylight illuminance based on the DC theory under the 15 CIE sky standards (Li and Cheung, 2006; Li et al., 2006c). The evaluation of the simple prediction method was conducted via a scale model (Li et al., 2006b) and full-scale (Li et al., 2006a) field measurements under real sky conditions. Results through daylighting simulation can give complement particulars for architects and building designers to evaluate design cases (Tsou et al., 2003). The lighting simulation programs available in the market are often quite complex and comprehensive to be adopted for the design of tall buildings containing many rooms. It can be cost demanding to have a full-scale computer simulation for building professionals in modeling the building geometry with long simulation times (Reinhart and Herkel, 2000). Architects and engineers would make simulations using sophisticated computer programs to get more accurate results only when the design proposals have been confirmed and ready for submission. A simple software tool would be useful for the non-lighting experts at the preliminary design phase when different design schemes and ideas are being compared and assessed (Moeck and Selkowitz, 1996).
Nowadays, professionals have a strong intention to emphasize the implications of daylighting scheme on building energy consumption. Incorporating sophisticated daylighting simulation into building energy simulation is demanding for computational power and model preparation time. Hence, a simple computational method based on split-flux method (Hopkinson et al., 1966) has been widely used within building energy simulation program such as DOE2 (Winkelmann and Selkowitz, 1985). Loutzenhiser et al. (2007) conducted field measurements and compared the measured illuminance and lighting energy consumption with those predicted by DOE2.1E and EnergyPlus programs. They found that the differences in daylight level between the split-flux method and measurement could be over 100%, and the discrepancy in lighting energy consumption was only 20%. Another study by Queiroz et al. (2020) compared the illuminance predicted by EnergyPlus using the split-flux method with the illuminance level estimated by RADIANCE. They found that the illuminance simulated by EnergyPlus was 20% deviated from RADIANCE for a low-complexity model. In our latest study (Tsang et al., 2021), the illuminance predicted by EnergyPlus and RADIANCE under a heavily obstructed urban area was evaluated. We found that the split-flux method (EnergyPlus) underestimated the illuminance level compared with that predicted by RADIANCE when there was no direct sunlight and vice versa under unobstructed non-overcast conditions. For atrium space, the illuminance level estimated by EnergyPlus and RADIANCE could be closely matched with each other.
Previously, a simple computer program was developed to simulate the daylight illuminance based on the split-flux method and daylight coefficient concept under three typical CIE skies (Li et al., 2007; Wu and Li, 2007). This paper evaluates the performance of this software for estimating the interior daylight illuminance under different types of sky conditions. The results generated from the simple software are compared against those simulated by a well-established lighting simulation program and field measurement data. Implications for daylighting designs are discussed.
The CIE Standard Skies
CIE standard skies contain five overcast skies, five intermediate skies, and five clear skies covering the whole spectrum of usual skies in nature. The distributions are characterized by continuous mathematical expressions that change smoothly in luminance from the horizon to the zenith and with angular distance from the sun. The relative luminance distribution (lv) on any standard sky can be defined as combining gradation function φ(Z) and indicatrix function f (χ) as follows:
where L = sky luminance in an arbitrary sky element (cd/m2)
LZ = sky luminance at the zenith (cd/m2)
Z = sky element zenith angle (rad)
ZS = solar zenith angle (rad)
χ = scattering angle, the shortest angular distance between the sun and a sky element (rad) = arccos(cosZScosZ+sinZssinZcos|ϕ−ϕs |)
ϕ = sky element azimuth angle (rad)
ϕS = solar azimuth angle (rad)
The standard gradation equation relates sky luminance to the zenith angle described by appropriate a and b variables as follows:
The relative scattering indicatrix function models sky luminance with angular distance from the sun characterized by an exponential function with adjustable coefficients c, d, and e as follows:
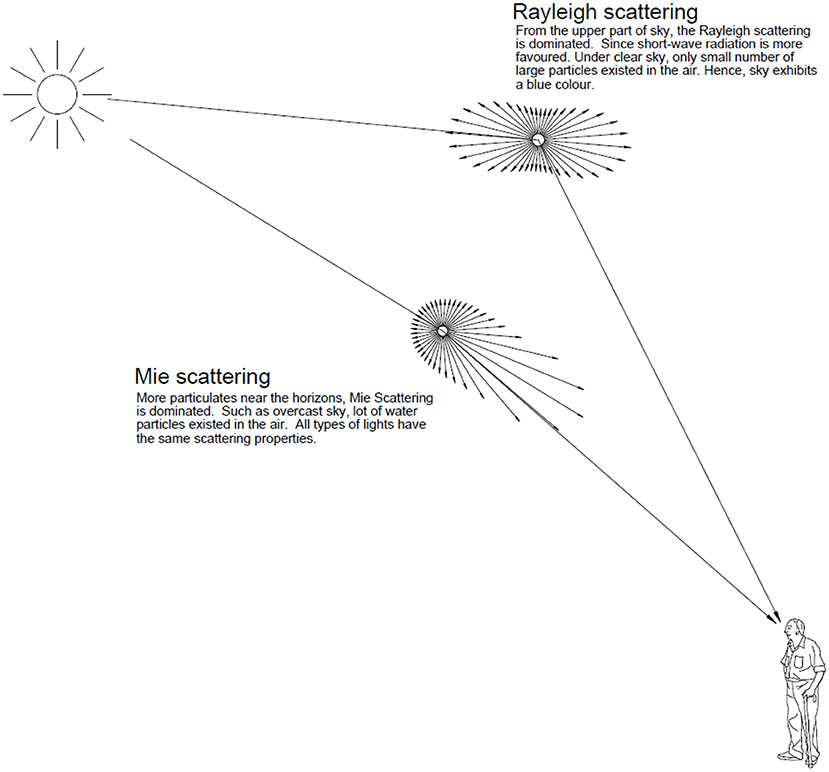
The exponential term exp(dχ) represents the effect of Mie scattering, which decreases rapidly with distance from the sun. The cos2χ term is caused by Rayleigh scattering and is zero at 90° to the sun. Figure 1 demonstrates the Rayleigh scattering and Mie scattering by an aerosol particular. Both gradation and indicatrix functions are of six types covering the usual range of homogeneous cases from heavy overcast to cloudless skies. The combinations can form a large number of skies but only 15 relevant types were selected for the standard set. Table 1 shows the details of the 15 standard skies (CIE, 2003).
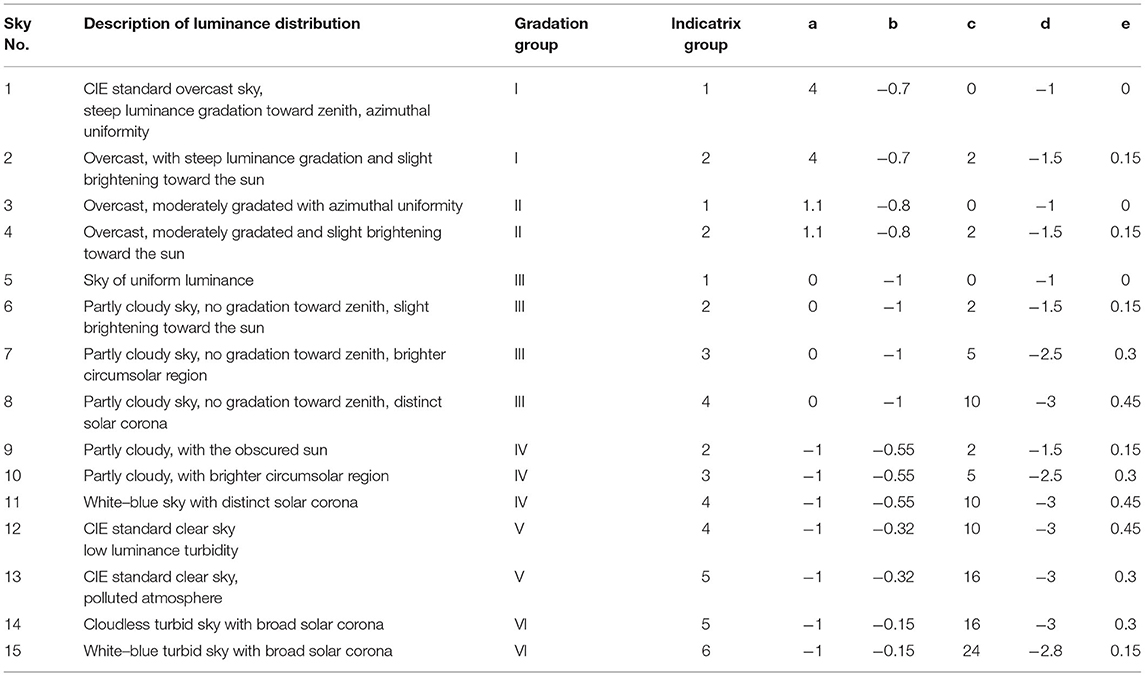
Table 1. A set of 15 standard sky types and their parametrization (CIE, 2003).
As indicated in Eq. (1), the luminance level of a sky element is represented in terms of the LZ. Once the LZ is obtained, absolute illuminance value at a particular point can be easily calculated. However, LZ is seldom systematically recorded. In addition, a small fluctuation in the zenith luminance can lead to substantial variations of the overall sky luminance pattern (Tregenza, 2004). Moreover, it is not possible to have the measured value when the sun is near the zenith. An alternative would be to normalize LZ to the horizontal diffuse illuminance of the whole sky (Es), which is a much stable measure than the luminance of a single patch of sky. Accordingly, the LZ/Es ratios for the 15 CIE standard skies based on the numerical approach under various sun positions were computed for use.
Methodology
Indoor daylight illuminances are generally not only depending on the outdoor illuminance but also relying on the precise distribution of the sky luminance during the same period. It is because an interior point will obtain the daylight from certain parts of the whole sky and the illuminance inside an internal space is not of the same sensitivity to variations in the luminance of various portions of the sky. The principle of DC correlates the sky luminance distribution with the point illuminance in an indoor space. Mathematically, the DC, Dθϕ, is given as follows (Tregenza and Waters, 1983):
where ΔEθϕ = the illuminance eventually provided at a point in an internal space by a tiny sky element at elevation θ and azimuth ϕ (lux)
Lθϕ = the luminance of the sky element (cd/m2)
ΔSθϕ = the angular size of the sky element (sr)
The Dθϕ relies on the room geometry and its external condition, the reflectance of various surfaces, and the visual transmittance of the fenestrations. It is, however, not related to the sky luminance distribution as ΔEθϕ varies in scale to Lθϕ. Hence, room characteristics and the outdoor climatic situations are separated. The overall daylight illuminance, E, at the point is thus expressed by the following:
For the simple cases, for instance, sky component from the unobstructed uniform or CIE overcast sky through windows containing a constant visual transmittance, it is easy to calculate analytically. If the whole sky is separated into n angular regions, then Eq. (5) can be written in numerical computational form as follows:
This shows that for a specific point, the illuminance is the summation of n products of D, L, and ΔS for individual sky element, i. Therefore, Eq. (6) can be employed to compute the daylight illuminance for rooms facing various directions.
For calculation purposes, daylight illuminance for a point inside a room usually consists of three components, namely, the sky component (SC), externally reflected component (ERC), and internally reflected component (IRC). Take an assumption that rooms in the topmost floors of a tall building or a house located in low-density residential zones face an unobstructed sky, ERC can be ignored. Under an unobstructed horizontal plane, the DC via an aperture without any glazing facing a sky element (i.e., SC) is the sine function of the altitude of the sky patch (i.e., sinθ). Adopting a numerical approach indicates that the whole sky needs to be subdivided into finite elements. Tregenza (1999b) proposed an appropriate subdivision method that divides the celestial hemisphere into 145 angular elements of constant elevation bands in symmetry about the zenith. Such a pattern is also adopted for sky scanner measurements (CIE, 1994). The elevation of band, solid angle, and azimuth increment for this subdivision of sky hemisphere proposed by Tregenza and Sharples (1995) were adopted. It would lead to more accurate of illuminance computation with more sky vault division. However, a longer calculation time is required (Cesarano et al., 1996). Furthermore, each sky patch was evenly divided into 16 (i.e., 4 × 4) smaller regions for computation. The sky regions “reviewed” via the aperture can be determined by simple geometry. Accordingly, the SC at the reference room location is the summation of the outdoor illuminance for each sky patch seen by the openings. Aimed rays representing 6 × 10⁻⁶ sr are modeled for each sample point, and in total, 105,050 rays were evenly distributed to the sky vault. There are over 700 sample rays for each sky patch.
The split-flux principle is applied to determine the IRC. The basic equation is expressed as follows (Hopkinson et al., 1966):
where A = all the interior surface areas (m2)
C1 and C2 = configuration factors (CFs) of the daylight flux incident on the mid-height of the windowpane, respectively, from above and below the horizon (dimensionless)
R = mean reflectance of all the interior surfaces (dimensionless)
Rcw = mean reflectance of the ceiling and upper walls above the mid-height of the window. (excluding the window wall) (dimensionless)
t = the overall visual transmittance of the window (dimensionless)
W = window area (m2)
The flux penetrating the room through the window is divided into two portions, namely, (i) light straightly coming from above the horizon on a vertical plane (Ea) and (ii) reflected light coming from below the horizon on a vertical plane (Eb). The CF C1 is Ea over the horizontal diffuse illuminance of the whole sky (Es). Considering the vertical glazing wall of a side-lit room faces half of the whole sky, Ea is written as follows:
where ϕn = the azimuth angle of window normal (radians).
The CF C2 is half of the total daylight illuminance (i.e., Et = Ed + Es) times the ground reflectance (Rg) over Es. With no direct sunlight, C2 would be 0.5 times Rg under overcast skies. Then, C2 can be expressed as follows:
Under partly cloudy and clear sky conditions, the interior daylight is strongly dependent on sun location particularly under cloudless skies. The sun may shine directly into the internal space or may cast a clear shadow in front of the window wall. In this connection, subsequent corrections and modifications are required. The direct sunlight is so bright that the luminance can be a few 100 times more than the other sky patches, and occupants use internal shading device to eliminate the visual glare, thermal discomfort, and excessive brightness. When the sun shines directly into the room, direct sunlight is excluded and only the sky-diffuse and ground-reflected components are considered for indoor daylight prediction. In case a well-defined shadow is cast in front of the window wall, Equations (9) and (10) are used to compute C2 for shaded and un-shaded ground-reflected areas, respectively (Li, 2007). The outdoor illuminance components (i.e., Ed and Es) were given by Kittler et al. (1998). By summing up the SC and IRC and applying the corresponding LZ/Es ratio, the DF can be got. Afterwards, the DF times the corresponding horizontal sky-diffuse illuminance (Es) and the internal daylight illuminances can be obtained.
Data Analysis
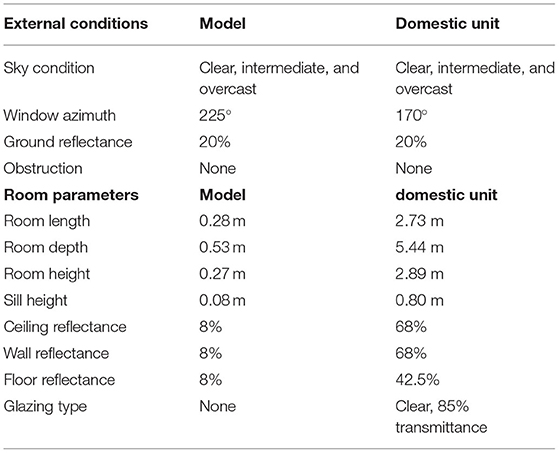
The software for the present study can calculate the indoor daylight illuminances via the glazing walls facing the eight principal directions (i.e., N, E, S, W, NE, NW, SE, and SW) at various daytime hours in 12 months under the 15 CIE sky standards. The examples chosen were similar to those illustrated by Bryan (1980) who calculated the daylight factors at a given sun location under the CIE sky 12 (clear sky) using a serial of tables and charts. The study was a room of 6 m × 6 m × 3 m containing a big rectangular-shaped vertical window of 1.8 m × 4.8 m with the windowsill at 0.75 m off the floor. The working surface was the room center point, which is also at a height of 0.75 m above the floor. Table 2 summarizes the room variables and the exterior environment for the analysis. The determinations included the internal daylight illuminances at the working plane with the glazing walls facing the four cardinal directions (i.e., N, E, S, and W) in the morning (09.00), at noon (12.00), and in the afternoon (15.00) in spring (March), summer (June), autumn (September), and winter (December) under the 15 CIE standard skies. In total, 720 cases were simulated. The findings were simulated by RADIANCE, which adopts backward ray-tracing techniques to examine high-ranking lighting regimes. It is a well-developed simulation package and has been applied by a number of researchers (Ng et al., 2001; Jones et al., 2004). Many studies reported that RADIANCE can simulate quite accurate outcomes, which are close to actual building measurements comparing with other daylighting programs (Gugliermetti et al., 2001). The luminance distribution for the whole sky employed by RADIANCE modeled the CIE standard sky (Greenup, 2003). The version of RADIANCE used for the study was developed at Lawrence Berkeley Laboratory running under UNIX workstation mode.
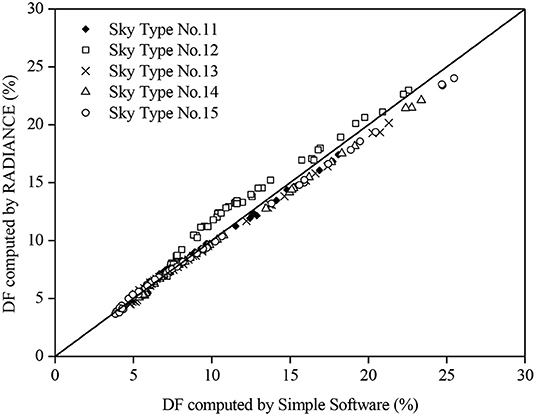
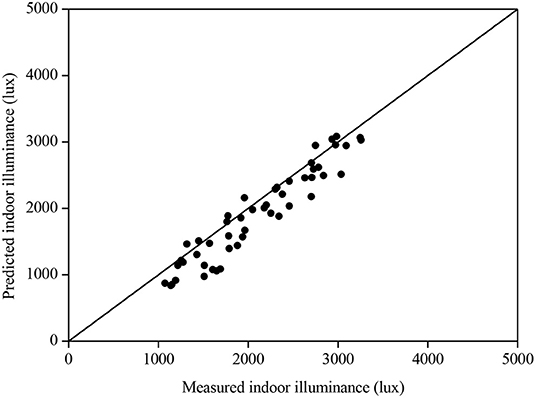
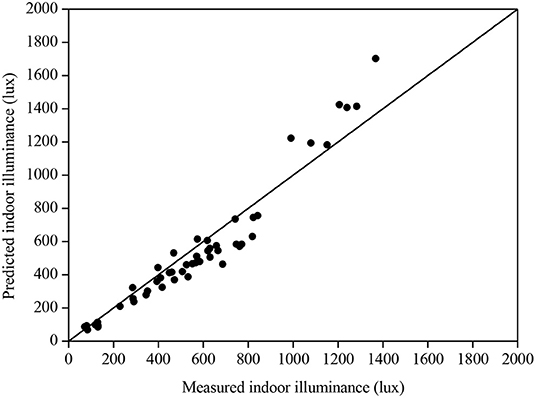
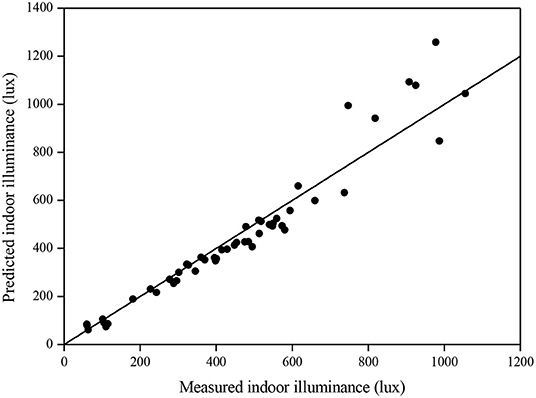
For skies 1, 3, and 5, their luminance distributions are not depending on solar azimuth, and the vertical daylight illuminance is invariant to room direction; thus, the determined DFs varied slightly for these three skies. The simulated DFs using the simple software for skies 1, 3, and 5 were 4.8, 5.9, and 6.8%, respectively. Slightly smaller DFs were obtained by RADIANCE ranging from 4.2 to 4.3% for sky no. 1, from 5.2 to 5.3% for sky no. 3, and from 6 to 6.1% for sky no. 5. The difference was just larger than 0.7%. Likewise, the DFs for the other CIE standard skies were computed. Figure 2 displays the results for the anisotropic overcast skies (i.e., skies 2, 4, and 6). With anisotropic sky patterns, the calculated DFs changed at various times of the day for different sky numbers. Using the simple software, the DFs were determined ranging between 3% at 1200h in March for north-facing window facade under sky no. 2 and 9.3% at 1500h in March for west-facing window facade under sky no. 6. Again, the DFs modeled by RADIANCE were slightly less than those obtained by the simple software. The peak DF difference was just <1% appearing in sky no. 6. Under non-overcast sky conditions, the sun effects become significant, resulting in larger DFs. The predicted DFs using the two programs for skies 7–10 (i.e., partly cloudy skies) are plotted in Figure 3. With the presence of direct sunlight, the ground-reflected component (C2) contributes to a greater amount of DF. The peak DFs for individual skies were found to be more than 10%. The DFs predicted by RADIANCE were still less than those obtained by our software but with smaller differences. As the amount of cloud further decreases, the ground-reflected component becomes more significant. Figure 4 presents the DFs estimated by the two simulation programs for the cloudless skies (skies 11–15). It can be observed that the DFs simulated by the two tools are in good agreement as dispersions in the plots are of a general order. Particularly for the DFs of low values, when the window facades face well-defined shadows, the outcomes simulated by the two programs are almost identical. More than half of the results simulated by RADIANCE were slightly more than those calculated by the simple software. The peak DF discrepancy obtained between the two programs was <2%. Given that most of the DFs were of more than 10%, the difference was not substantial. In general, the two simulation programs can produce similar DF results for the 15 CIE standard skies. Another criterion for consideration is the duration of the simulation. The simulation times for the 720 cases were 60 h and 4.5 min using the RADIANCE and the simple software, respectively. It indicates that the proposed software is useful at the early design stage where approximate daylight performance under various standard sky conditions is required. The accuracy of the simple software tool was further evaluated against data measured in a scale model (Li et al., 2006b) and inside a domestic unit (Li et al., 2006a). The model was 530 mm (depth) × 280 mm (along the opening) × 270 (height) representing a rectangular cellular office of 1:10 scale containing an opening area of 200 mm × 180 mm (without glazing) situated in Hong Kong (latitude 22.3° N and longitude 114.3° E). The plan view, the section, and the measurement points of the scale model are illustrated in Figure 5. The measurements were conducted on the rooftop. The model was put with the opening facing southwest (225°) where it is relatively free from external obstruction. Black paper of 0.08 reflectance was used to cover the model such that the SC was the main daylight source. In total, 50 readings were used for the evaluation. Figure 6 presents the simulated and measured results. It can be observed that the indoor daylight illuminance can be computed reasonably well under different skies by the proposed software. For some readings, the measured and simulated data are the same. Generally, the software tends to underestimate the daylight illuminance. The mean bias error (MBE) and root mean square error (RMSE) were respectively computed to be −8.4 and 14.9%. For the field measurement, it is a bed–study room situated at the 10th floor of a 13-story hostel block. The room is 5.44 m (depth) × 2.73 m (along with window) × 2.89 m (height) with the window façade facing close to south of 170°. The domestic block was built on the mid-level of a hillside, and the window walls mainly face an unobstructed outdoor environment. The working plane was at desk level of 800 mm from the finishing floor level. The room layout plan and the two measurement points are presented in Figure 7. In total, about 50 readings were made for each point. Figure 8 displays the measured and predicted results for point 1. The recorded interior daylight levels vary from 80 to 1,370 lux. Figure 8 displays the measured and predicted results for point 1. Likewise, the indoor daylight levels for point 2 were computed and are displayed in Figure 9. Since point 2 may receive less amount of daylight, the measured values were less than those in point 1, with the variations between 60 and 1,060 lux. The software tool slightly underestimated the daylight illuminance with the MBE of −2.6% and RMSE 14.5% of the corresponding recorded mean values.
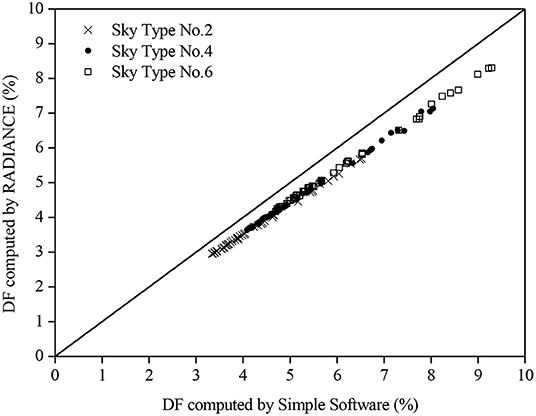
Figure 2. The daylight factors (DFs) simulated by RADIANCE and the simple software for skies 2, 4, and 6.
Discussion
The set of 15 CIE standard skies represents the sky conditions in many places and covers the entire possible sky spectrum found in the world. Once the sky types are classified, the primary daylight illuminance on the surface facing various orientations can be got via mathematical expressions. It means that DF can take building orientations, sun location, and the effect of direct and reflected skylight and sunlight into consideration. Most importantly, DF is strongly correlated with orientations and room parameters especially the window area and the visual transmittance. Such variables could be easily changed in order to meet the criteria and building regulations during the initial design stage when different building facade schemes are investigated and evaluated. Once the initial design has been confirmed, a few full-scale building simulations using a sophisticated computer program can be conducted to get more accurate data. Afterwards, even more complicated cases can be undertaken. The split-flux method is a simple and fast for indoor daylight illuminance estimation. This is very common for use in energy estimation and building performance evaluation. We would like to develop a simple software tool for this application by considering various CIE standard skies. This approach can also be applied for measured sky luminance distributions.
Conclusions
A simple software tool considering the DC concept and split-flux theory for estimating the interior daylight levels was developed. The performance of the proposed software was demonstrated based on a typical room containing a big vertically glazed window. The internal daylight illuminances in terms of DFs at the room center under the 15 CIE sky standards at different daytime hours in March, June, September, and December with the window facade facing the four cardinal directions (i.e., N, E, S, and W) were simulated and compared with the finding simulated by the RADIANCE program. Generally, the DFs estimated using the two programs were in a reasonably well agreement. With isotopic sky patterns, the simulated DFs for skies 1, 3, and 5 were quite constant at different times and orientations. Slightly smaller DFs were obtained by RADIANCE with the peak difference of just larger than 0.7%. For anisotropic overcast skies (skies 2, 4, and 6), the simulated DFs had relatively large variations. Smaller DFs were predicted using the RADIANCE with the maximum discrepancy of <1%. With the presence of direct sunlight, the maximum DFs for individual partly cloudy skies (i.e., skies 7 to 10) were simulated of more than 10%. The DFs predicted by RADIANCE were still less than those obtained by the proposed software but with smaller discrepancies. When the amount of cloud further decreases, the ground-reflected component becomes more significant, and the simulated DFs were up to more than 25% under cloudless skies (i.e., skies 11 to 15). More than half of the results simulated by RADIANCE were larger than those calculated by the simple software. In general, both the simulation programs can produce similar DF results for the 15 CIE standard skies. The simulation times for the 720 cases were 60 h and 4.5 min using RADIANCE and the simple software, respectively. A scale model and full-scale field measurements were considered for validating the proposed program. A measuring point in a 10:1 scale model covered with black paper was analyzed. For full-scale field measurement, two measuring points at a hostel study–bedroom were studied. The findings show that the internal daylight simulated by the proposed software were in reasonable agreement with the recorded data. In view of the user-friendly features, short time periods for running simulations, and the reasonably good predictability of the proposed computer program, it would be very useful employing the simple software at various building design, construction, and operation stages when approximate daylight performance under various standard sky conditions is required.
Data Availability Statement
The data analyzed in this study is subject to the following licenses/restrictions: all rights of the datasets reserved by City University of Hong Kong. Requests to access these datasets should be directed to Ernest Kin Wai Tsang, ZWt3dHNhbmdAaGttdS5lZHUuaGs=.
Author Contributions
ET made significant contributions in the conceptualization, data curation, formal analysis, investigation, methodology, writing of original draft, software, and validation. DL made significant contributions in the supervision, funding acquisition, and project administration. SL made significant contributions in the validation and writing review and editing. All authors contributed to the article and approved the submitted version.
Funding
The work described was fully supported by a General Research Fund from the Grant Council of HKSAR [Project no. 9042504 (CityU 11209217)].
Conflict of Interest
The authors declare that the research was conducted in the absence of any commercial or financial relationships that could be construed as a potential conflict of interest.
Publisher's Note
All claims expressed in this article are solely those of the authors and do not necessarily represent those of their affiliated organizations, or those of the publisher, the editors and the reviewers. Any product that may be evaluated in this article, or claim that may be made by its manufacturer, is not guaranteed or endorsed by the publisher.
References
British Standards Institution European Committee for Standardization, and DIN Deutsches Institut für Normung. (2019). Daylight in Buildings. London: BSI Standard Limited.
Bryan, H. J. (1980). A simplified procedure for calculating the effects of daylight from clear skies. J. Illuminating Eng. Soc. 9, 142–151. doi: 10.1080/00994480.1980.10747892
Cesarano, A., Bellia, L., Minichiello, F., and Sibilio, S. (1996). Sky luminance models: sensitivity to sky-dome subdivision. Lighting Res. Technol. 28, 131–140. doi: 10.1177/14771535960280030401
CIE (1994). Guide to Recommended Practice of Daylight Measurement. Technical report, central bureau of CIE, Vienna. Report No. CIE 108–1994.
CIE (2003). Spatial Distribution of Daylight - CIE Standard General Sky. Standard, CIE General Bureau, Vienna. Report No. S 011/E:2003/ISO 15469:2003(E)
Escuyer, S., and Fontoynont, M. (2001). Lighting controls: a field study of office workers' reactions. Lighting Res. Technol. 33, 77–94. doi: 10.1177/136578280103300202
Greenup, P. (2003). SSLD Sky Model. Available online at: http://www.radiance-online.org/patches/ssld/www.radiance-online.org/patches/ssld/SSLD algorithm with PDF.zip
Gugliermetti, F., Grignaffini, S., and Bisegna, F. (2001). “Computer simulations, full and scale model measurements as design tools to assess daylight factors in underground open space,” in Proceedings of the International Lighting Congress (Istanbul), 519–526
Jones, P. J., Alexander, D., Marsh, A., and Burnett, J. (2004). Evaluation of methods for modelling daylight and sunlight in high rise Hong Kong residential buildings. Indoor Built Environ. 13, 249–258. doi: 10.1177/1420326X04045177
Kittler, R., Perez, R., and Darula, S. (1998). A set of standard skies. Characterizing daylight conditions for computer and energy conscious design. Bratislava: Polygrafia. doi: 10.13140/RG.2.1.4798.7048
Li, D. H. W. (2007). Daylight and energy implications for CIE standard skies. Energy Conversion Manage. 48, 745–755. doi: 10.1016/j.enconman.2006.09.009
Li, D. H. W., and Cheung, G. H. W. (2006). Average daylight factor for the 15 CIE standard skies. Lighting Res. Technol. 38, 137–149. doi: 10.1191/1365782806li165oa
Li, D. H. W., Cheung, G. H. W., and Cheung, K. L. (2006a). Evaluating an indoor daylight illuminance calculation tool against full-scale measured data. Archit. Sci. Rev. 49, 243–251. doi: 10.3763/asre.2006.4933
Li, D. H. W., Cheung, G. H. W., and Cheung, K. L. (2006b). Evaluation of simplified procedure for indoor daylight illuminance determination against data in scale model measurements. Indoor Built Environ. 15, 213–223. doi: 10.1177/1420326X06066300
Li, D. H. W., Cheung, G. H. W., and Lau, C. C. S. (2006c). A simplified procedure for determining indoor daylight illuminance using daylight coefficient concept. Build. Environ. 41, 578–589. doi: 10.1016/j.buildenv.2005.02.027
Li, D. H. W., and Lam, J. C. (2003). An investigation of daylighting performance and energy saving in a daylit corridor. Energy Build. 35, 365–373. doi: 10.1016/S0378-7788(02)00107-X
Li, D. H. W., Lau, C. C. S., and Lam, J. C. (2003). A study of 15 sky luminance patterns against Hong Kong data. Archit. Sci. Rev. 46, 61–68. doi: 10.1080/00038628.2003.9696965
Li, D. H. W., Tsang, E. K. W., Lam, T. N. T., and Wong, S. L. (2007). “A simple software tool for determining internal daylight illuminance,” in Proceedings of the 4th International Workshop on Energy and Environment of Residential Buildings (Harbin).
Lou, S. W., Tsang, E. K. W., Li, D. H. W., Lee, E. W. M., and Lam, J. C. (2017). Towards zero energy school building designs in Hong Kong. Energy Procedia 105, 182–187. doi: 10.1016/j.egypro.2017.03.299
Loutzenhiser, P. G., Maxwell, G. M., and Manz, H. (2007). An empirical validation of the daylighting algorithms and associated interactions in building energy simulation programs using various shading devices and windows. Energy 32, 1855–1870. doi: 10.1016/j.energy.2007.02.005
Moeck, M., and Selkowitz, S. E. (1996). A computer-based daylight systems design tool. Automation Construct. 5, 193–209. doi: 10.1016/0926-5805(96)00151-3
Ng, E. Y. Y., Poh, L. K., Wei, W., and Nagakura, T. (2001). Advanced lighting simulation in architectural design in the tropics. Automation Construct. 10, 365–379. doi: 10.1016/S0926-5805(00)00053-4
Queiroz, N., Westphal, F. S., and Pereira, F. O. R. (2020). A performance-based design validation study on EnergyPlus for daylighting analysis. Build. Environ. 183, 107088. doi: 10.1016/j.buildenv.2020.107088
Reinhart, C. F., and Herkel, S. (2000). The simulation of annual daylight illuminance distributions — a state-of-the-art comparison of six RADIANCE-based methods. Energy Build. 32, 167–187. doi: 10.1016/S0378-7788(00)00042-6
Tregenza, P., and Sharples, S. (1995). New Daylight Algorithms. University of Sheffield. Available online at: http://naturalfrequency.com/Tregenza_Sharples/Daylight_Algorithms/intro.htm
Tregenza, P. R. (1999a). Standard skies for maritime climates. Lighting Res. Technol. 31, 97–106. doi: 10.1177/096032719903100304
Tregenza, P. R. (1999b). The sensitivity of room daylight to sky brightness. Archit. Sci. Rev. 42, 129–132. doi: 10.1080/00038628.1999.9696865
Tregenza, P. R. (2004). Analysing sky luminance scans to obtain frequency distributions of CIE Standard General Skies. Lighting Res. Technol. 36, 271–279. doi: 10.1191/1477153504li117oa
Tregenza, P. R., and Waters, I. M. (1983). Daylight coefficients. Lighting Res. Technol. 15, 65–71. doi: 10.1177/096032718301500201
Tsang, E. K. W., Li, D. H. W., and Aghimien, E. I. (2021). “Evaluation of daylight prediction algorithms in building energy performances under heavily obstructed urban topography,” in Proceeding of 9th Global Conference on Global Warming (Croatia), 147–150.
Tsou, J.-Y., Chow, B., and Lam, S. (2003). Performance-based simulation for the planning and design of hyper-dense urban habitation. Automation Construct. 12, 521–526. doi: 10.1016/S0926-5805(03)00039-6
Winkelmann, F. C., and Selkowitz, S. (1985). Daylighting simulation in the DOE-2 building energy analysis program. Energy Build. 8, 271–286. doi: 10.1016/0378-7788(85)90033-7
Keywords: daylighting, CIE standard skies, daylight coefficient, sky luminance, software
Citation: Tsang EKW, Li DHW and Li S (2022) Predicting Daylight Illuminance for 15 CIE Standard Skies Using a Simple Software Tool. Front. Sustain. Cities 4:792997. doi: 10.3389/frsc.2022.792997
Received: 11 October 2021; Accepted: 19 January 2022;
Published: 03 March 2022.
Edited by:
Adeb Qaid, Kingdom University, BahrainReviewed by:
Abdul-Manan Sadick, Deakin University, AustraliaKhaled A. Tarabieh, American University in Cairo, Egypt
Copyright © 2022 Tsang, Li and Li. This is an open-access article distributed under the terms of the Creative Commons Attribution License (CC BY). The use, distribution or reproduction in other forums is permitted, provided the original author(s) and the copyright owner(s) are credited and that the original publication in this journal is cited, in accordance with accepted academic practice. No use, distribution or reproduction is permitted which does not comply with these terms.
*Correspondence: Shuyang Li, c2h1eWFuZ2xpNy1jQG15LmNpdHl1LmVkdS5oaw==
 Ernest Kin Wai Tsang
 Danny Hin Wa Li2
 Shuyang Li