 Ravi Yadav1*
 Pushpendra Vyas2
 Praveen Kumar1
 Lokesh Kumar Sahu3Umangkumar Pandya4Nidhi Tripathi3Mansi Gupta3
 Vikram Singh5Pragnesh N. Dave6
 Devendra Singh Rathore7Gufran Beig1,8S. N. A. Jaaffrey9
- 1Air Pollution and Transport Modeling Division, Indian Institute of Tropical Meteorology, Ministry of Earth Sciences, Government of India, Pune, India
- 2Department of Physics, Janardan Rai Nagar Rajasthan Vidyapeeth (Deemed-to-be University), Udaipur, India
- 3Space and Atmospheric Sciences Division, Physical Research Laboratory, Ahmedabad, India
- 4Department of Physics, Shankersinh Vaghela Bapu Institute of Science, Gandhinagar, India
- 5Department of Physics, Sangam University, Bhilwara, India
- 6Department of Chemistry, Sardar Patel University, Vallabh Vidyanagar, India
- 7Department of Environmental Sciences, Mohanlal Sukhadia University, Udaipur, India
- 8Natural Sciences and Engineering, National Institute of Advanced Studies, Bangalore, India
- 9Department of Physics, Mohanlal Sukhadia University, Udaipur, India
The outbreak of COVID-19 is a global public health challenge and has affected many countries, including India. The nationwide lockdown was imposed in India from March 25 to May 31, 2020 to prevent the transmission of COVID-19. The study intends to assess the impact of the absence of major anthropogenic activities during the various phases of the COVID-19 lockdown (LDN) period on the daily mean concentrations of PM2.5 and PM10 in six populated cities of Jaipur, Jodhpur, Kota, Udaipur, Ajmer, and Alwar in the state of Rajasthan. Investigation has been done for the different periods, including the pre-lockdown—PRELD (January 1–March 4, 2020), partial lockdown—PLDN (March 5–24, 2020), COVID-19 lockdown—LDN (March 25–May 31, 2020), and unlocking—ULC (June 1–August 31, 2020) phases. We have also compared the mean concentrations of PM2.5 and PM10 with the same period of the year 2019. A significant improvement in air quality during the COVID-19 LDN period was noticed in all cities compared to 2019 and for the same period of the year 2020. However, the levels of PM2.5 and PM10 were seen to rise during the second, third, and fourth LDN phases compared to the first LDN, indicating that the subsequent lockdowns started with some relaxations and dusty conditions. On the other hand, wind-blown dust is another vital source of PM10, resulting in high concentrations in the summer months (April–May). Significant reductions in PM2.5 (~25–50%) and PM10 (20–37%) in all six cities during the LDN period compared with PRELD were estimated. However, with significant variations from city to city, the lowest reductions in PM2.5 (~25%) and PM10 (~20%) were measured in Jodhpur and Ajmer, respectively. It was noticed that the episodes of rainfall and transport of oceanic air masses resulted in a reduction of particles during the ULC period compared to the LDN period. The air quality index was, more or less, in the “good to satisfactory” category during the first 3 LDN periods, whereas it was moderate for Jodhpur, Jaipur, and Ajmer during the last LDN period. The study will be helpful to determine mitigation policies to minimize air pollution, especially in developing regions.
Highlights
- The investigation shows the impact of the various phases of COVID-19 lockdown on PM2.5 and PM10 in six cities of Rajasthan.
- There was a reduction during the COVID-19 lockdown, by 16–50% in PM2.5 and by 22–47% in PM10.
- Mineral dust pollution is prominent in particle loads over the Rajasthan state.
- Monsoon rains and winds dominate over emissions during the unlocking periods (June–August) in PM2.5 and PM10 distribution.
Introduction
The entire world has been facing an acute pandemic and challenging circumstances because of the novel contamination of coronavirus disease (COVID-19) since the beginning of 2020. The first case was identified in Wuhan, China, in December 2019 (Li et al., 2020). In view of the expanding pace of COVID-19 cases worldwide, the transmittable disease has become a global pandemic (WHO, 2020). Therefore, many countries have declared a nationwide strict lockdown with varying rules and regulations to control the spread of COVID-19. In India, the first COVID-19 case was identified on January 30, 2020 in Trisharu, Kerala (India) (WHO, 2020) and in different parts of the country during the first week of March (https://www.mohfw.gov.in/). The multiple cases of infection from India started to come into view in the first week of March 2020. Later, the government of India (Prime Minister) announced “Janata Curfew” for a day on March 22, 2020, with a complete shutdown of daily activities. Later, complete lockdown for 21 days across India was officially announced, from March 25 to April 14, 2020. Later, to deal with the decline of the pandemic in the nation, the lockdown was extended up to May 3, 2020. After looking at the problematic situation, it continued until May 31, 2020 with some relaxation. The details of prohibited and permitted activities during the different lockdown phases, including LDN1 (March 25–April 14, 2020), LDN2 (April 15–May 3, 2020), LDN3 (May 04–17, 2020), LDN4 (May 18–31, 2020), are listed in Table 1. Improvements in air quality due to reductions in transport (flights, trains, and vehicles), industrial, academic, economic, and social-related activities are reported in several studies (Dantas et al., 2020; Kumari and Toshniwal, 2020; Nakada and Urban, 2020; Navinya et al., 2020; PPAC, 2020; Sharma et al., 2020; Sicard et al., 2020; Singh et al., 2020; Yadav et al., 2020). About 40–70% reductions were suggested in transport, industrial, and construction activities based on the fuel consumption data during the lockdown period, but ~12% enhancement was estimated in biofuel consumption for cooking purposes (PPAC, 2020). The combustion-related emissions are considered one of the significant sources of air pollutants in Indian cities. The air quality, in terms of air quality index and health impact, is mainly determined by the levels of hazardous particulate pollutants in a year. In ambient air, the most important anthropogenic sources of fine particulate matter are the incomplete combustion of biofuel and fossil fuels (Sahu et al., 2011). In addition to local emissions, the long-range transport from the regions of biomass burning and dust sources also influence the receptor sites (Yadav et al., 2016, 2017). Exposure to elevated levels of PM2.5 in ambient air can cause adverse health effects like respiratory and cardiovascular diseases (e.g., Pope et al., 2009). Several studies have reported the association of COVID-19-related mortality and morbidity along with air pollution and meteorological parameters during the lockdown period (Beig et al., 2020; Conticini et al., 2020; Wu et al., 2020; Yao et al., 2020). On the other hand, many studies have reported a significant reduction in air pollution across the world due to the COVID-19 restrictions (Bashir et al., 2020; Jain and Sharma, 2020; Kanniah et al., 2020; Kumar et al., 2020; Kumari and Toshniwal, 2020; Mahato et al., 2020; Nakada and Urban, 2020; Navinya et al., 2020; Singh and Chauhan, 2020; Singh et al., 2020; Tobías et al., 2020; Yadav et al., 2020; Goel et al., 2021; Sokhi et al., 2021). Most of the studies in India have been focused on megacities so far, including Delhi, Mumbai, Ahmedabad, Pune, Chennai, Kolkata, Lucknow, Jaipur, and Bangalore, etc. However, studies during the COVID-19 lockdown period in several cities of Rajasthan are reported for a very limited period (Sharma et al., 2020). Aside from local anthropogenic emissions, the air pollution footprints are unique in Rajasthan, where dust-related sources are also dominant. The geographic characteristics of Rajasthan are the Thar Desert and the Aravalli Range, and the north-western portion of Rajasthan is generally sandy and dry. Hence, due to being the driest region and given the different climatic zones, the study will be very prominent in these locations. The present study highlights the role of long-term COVID-19 lockdown on PM2.5 and PM10 in six major cities of Rajasthan, including Jaipur, Jodhpur, Kota, Udaipur, Ajmer, and Alwar, and the alteration in air pollution levels during the unlocking periods. We have also discussed the change in the air quality index (AQI) for all cities. Overall, we present a detailed investigation by considering the combined effects of local emissions and meteorology during the lockdown period.
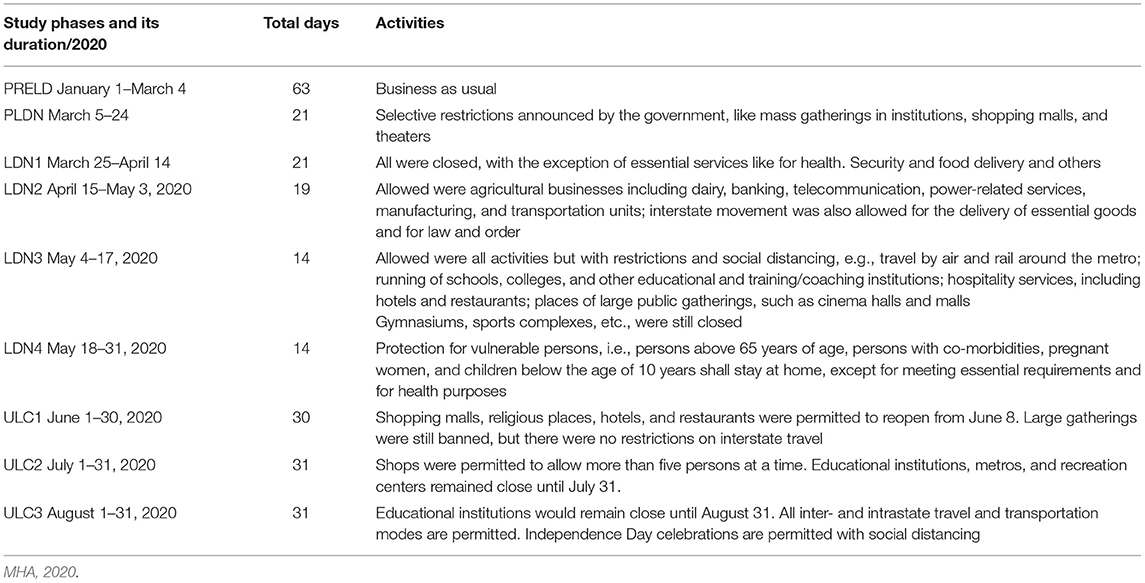
Table 1. Details of the prohibited and permitted activities during the study period.
Methodology
Data Sources, Locations, and Local Meteorology
The concentration data of PM2.5 and PM10 as measured in six cities, namely, Jaipur, Jodhpur, Kota, Udaipur, Ajmer, and Alwar, in the state of Rajasthan were obtained from the Central Pollution Control Board (CPCB) for the years 2019 and 2020. The PM2.5 and PM10 data in these cities located in the northwest part of India were analyzed to investigate the pollution levels during the long-term COVID-19 lockdown period. The locations of the study sites in the maps of India and Rajasthan are shown in Figure 1.
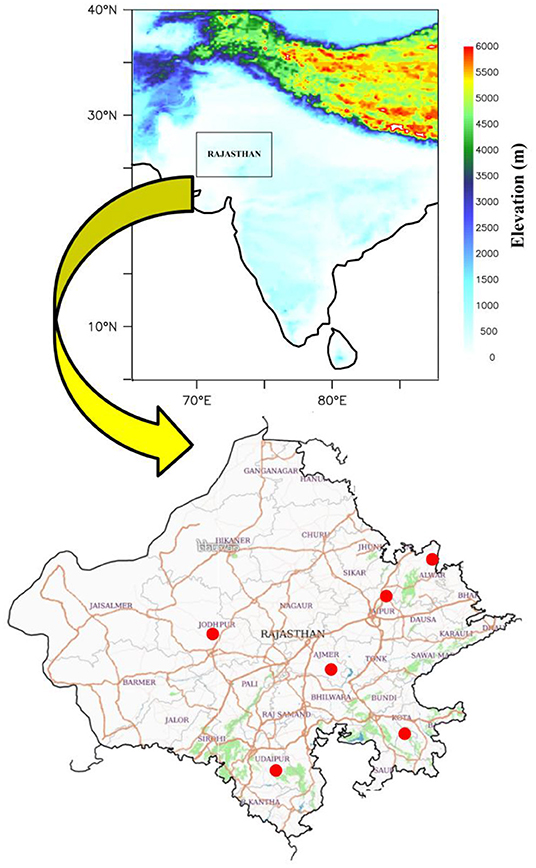
Figure 1. Map of India on surface elevation depicting Rajasthan along with the location of selected cities such as Jaipur, Jodhpur, Kota, Udaipur, Ajmer, Alwar are shown by the red oval. The Rajasthan Map (bottom panel) has been used from ISRO's Earth visualization portal Bhuvan (https://bhuvan.nrsc.gov.in/).
The data studied include during the pre-lockdown period (PRELD) (January 1 to March 4, 2020), partial lockdown (PLDN) (March 5 to 24, 2020), COVID-19 lockdown (LDN) (March 25 to May 31, 2020), and unlocking (ULC) period (June 1 to August 31, 2020). The average matching periods of the year 2019 were considered as the references to study the change in air quality during the COVID-19 lockdown period. We have used the National Centre for Environmental Prediction reanalysis datasets to derive the wind streamlines and temperature at a spatial resolution of 2.5° × 2.5° during the entire study period for 2019 and 2020, as shown in Figure 2. The precipitation rate (mm day−1) data from the CPC Merged Analysis of Precipitation (CMAP), at a spatial resolution of 2.5° × 2.5°, was used. The Moderate Resolution Imaging Spectroradiometer (MODIS) active fire count maps over India during the entire study period for 2019 and 2020 are plotted in Figure 3. Rajasthan is the largest state of India, located in the north-western region with a population of ~6.8 million (http://census2011.co.in). However, being located near most cities, the state has various types of industrial units, including those of marble, steel, cement, handicrafts, textiles, chemicals, IT, and thermal plants (Report 2018). The primary sources of air pollutants are vehicular, industrial, agriculture residual burning, municipal solid waste treatment, diesel generator, biofuel and LPG (residential cooking), and construction activities. The common sources of PM2.5 and PM10 include biofuel and fossil fuel combustion, industrial processes, and biomass burning. However, for PM10, wind-blown dust, road dust suspension, building construction, lime kilns, and slab polishing are important non-combustion sources (Yadav et al., 2017). Daily mean temperature ranges of 10–27, 32–45, and 35–40°C are recorded during winter (January–February), pre-monsoon (March–May), and monsoon (June–September) seasons, respectively. The strong hot winds called “Loo” blow from the west during pre-monsoon, while relatively low winds blow from the north and northeast during the winter (Yadav et al., 2014a). Rainfall values as high as 819 mm in the eastern part and as low as 170 mm in the western part of the state were recorded (Maanju and Saha, 2013). In the monsoon season, the inter-tropical convergence zone moves northward across India, and strong southwest (SW) winds prevail over the study region. Therefore, the measurements in this season are influenced by the transport of cleaner air masses from the Arabian Sea (see Supplementary Figure S1).
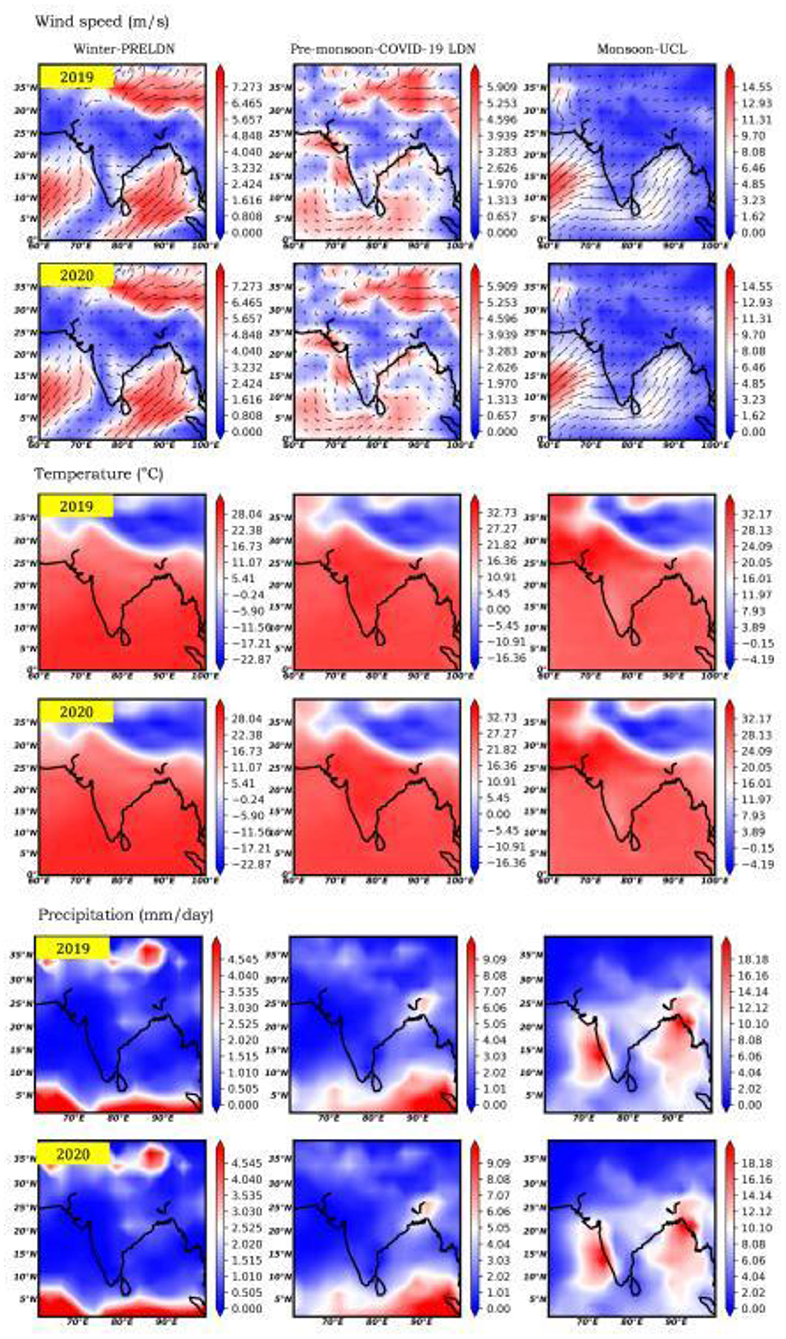
Figure 2. Meteorological parameters during the different phases of the study in the years 2019 and 2020: (top) wind speed; (middle) temperature; (bottom) precipitation.
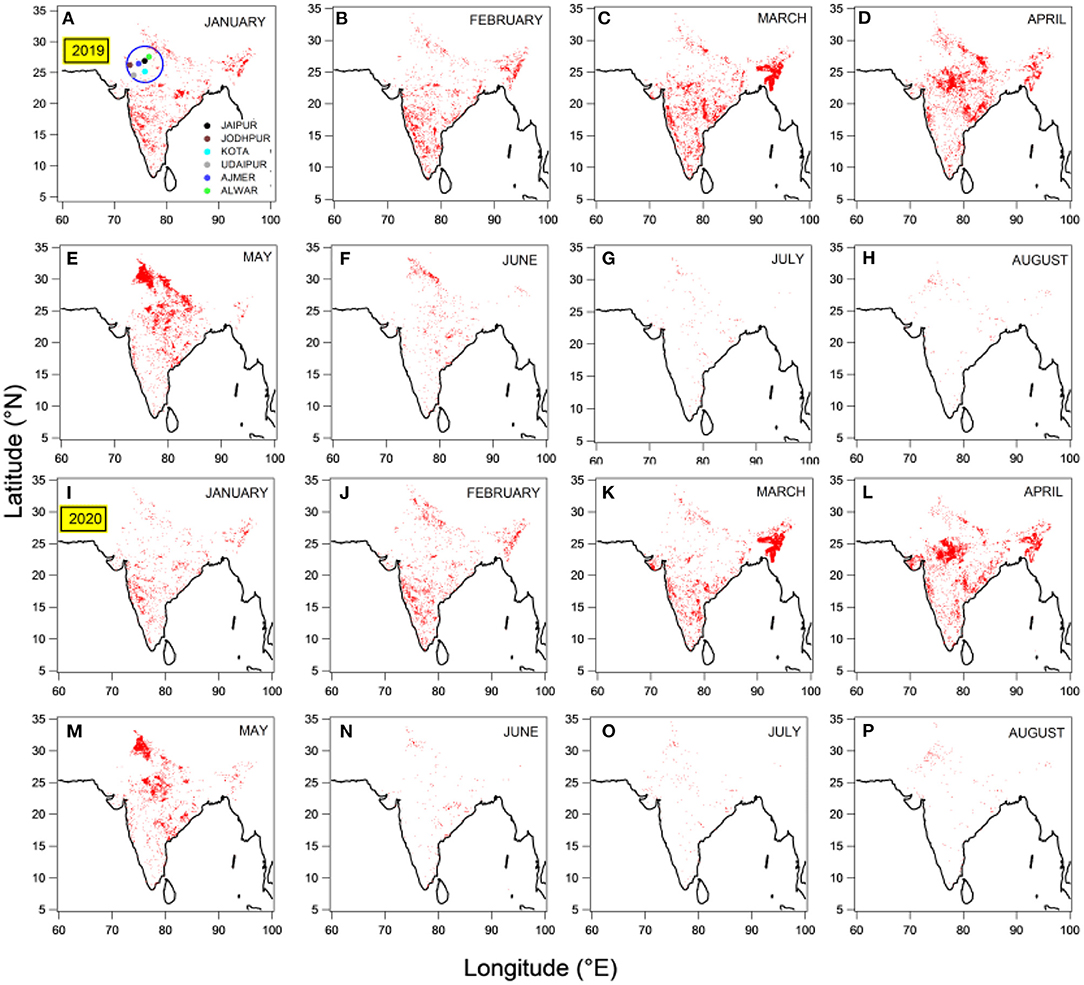
Figure 3. MODIS fire count data maps from January to August for the years 2019 and 2020.
Results and Discussion
Role of COVID-19 Lockdown in the Variation of PM2.5 and PM10
The time series analysis of PM2.5 and PM10 over a period of 8 months (January 1–August 31, 2020) reveals interesting trends. The daily means of PM2.5 and PM10 concentrations measured in Jaipur, Jodhpur, Kota, Udaipur, Ajmer, and Alwar are shown in Figure 4. The daily mean time series concentrations of PM2.5 and PM10 for all cities are divided into the four different periods of PRELD (January 1–March 4), PLDN (March 5–24), COVID-19 LDN (March 25–May 31), and ULC (June 1–August 31). During the business-as-usual period, many studies have reported a clear seasonality in the daily mean concentrations of PM2.5 and PM10, with the highest in the dry period (winter to pre-monsoon) and the lowest in the monsoon season, in different cities of India (Beig et al., 2007; Yadav et al., 2017; Hama et al., 2020). However, the findings become effectively more crucial in 2020 to researchers and policymakers because of the COVID-19-related consecutive LDN and ULC situations in which anthropogenic activities were restricted. The daily mean concentrations of PM2.5 were in the ranges of 7–81, 18–156, 12–91, 14–93, 10–114, and 15–63 μg m−3, while those of PM10 varied in the ranges of 20–256, 39–282, 23–185, 26–202, 15–266, and 30–121 μg m−3, respectively, in Jaipur, Jodhpur, Kota, Udaipur, Ajmer, and Alwar during the entire study period. The mean concentrations of PM2.5 were 51 ± 10, 78 ± 21, 45 ± 13, 49 ± 12, 47.3 ± 13, and 47.2 ± 8 μg m−3 in the PRELD period, which reduced to 34 ± 09, 58 ± 16, 29 ± 3, 29 ± 2, 32 ± 11, and 24 ± 4.4 μg m−3 during the LDN period in Jaipur, Jodhpur, Kota, Udaipur, Ajmer, and Alwar, respectively. On the other hand, the mean concentrations of PM10 were 115 ± 23, 162 ± 41, 97 ± 25, 104 ± 18, 100 ± 25, and 85 ± 9 μg m−3 in the PRELD period, which decreased by 90 ± 27, 116 ± 29, 67 ± 8, 65 ± 14, 80 ± 35, and 53 ± 10 μg m−3 during the LDN periods in Jaipur, Jodhpur, Kota, Udaipur, Ajmer, and Alwar, respectively. The daily mean concentrations of PM2.5 and PM10 during PRELD, PLDN, various phases of LDN, and UCL situations are shown in Table 2. The National Ambient Air Quality Standards (NAAQS) recommend the daily permissible PM2.5 of 60 μg m−3 and PM10 of 100 μg m−3 for India (MoEFCC, 2015). About 3, 33, and 6% of PM2.5 daily data exceeded the permissible limit of NAAQS during the COVID-19 LDN period in Jaipur, Jodhpur, and Ajmer, while 35, 46, 4, 7, and 19% of PM10 exceeded in Jaipur, Jodhpur, Kota, Udaipur, and Ajmer, respectively. It is suggested that the concentrations of PM2.5 significantly decreased in all cities that met the NAAQS limits. However, in a few cities, like Jodhpur, Jaipur, and Ajmer, the PM10 levels did not fall below the standard limit during most of the COVID-19 LDN period due to non-combustion-related sources like wind-blown dust. The highest reduction by 47% in PM2.5 was observed in Alwar, followed by Udaipur (40%), Kota (36%), Jaipur (32%), and Ajmer (32%), while Jodhpur showed the lowest reduction of about 25% during the COVID-19 LDN, respectively. PM10 was reduced by 37% in Alwar and 36% in Udaipur. However, the lowest reductions of 19–30% were estimated for Jaipur, Jodhpur, Kota, and Ajmer cities (Figure 5). Additionally, we have compared the PM2.5 and PM10 concentrations measured in 2020 with those during the previous year (2019) for the COVID-19 LDN and ULC periods (see Figure 6). The differences are, more or less, the same during PLDN, but significantly lower concentrations of both pollutants were estimated during the COVID-19 LDN and ULC periods. Wilcoxon test has been performed, and P-value < 0.05 was found, which was considered statistically significant in the LDN periods. The reductions in PM2.5 and PM10 varied in the ranges of 16–50 and 22–47% during the COVID-19 LDN period with respect to the same period of the year 2019 (without meteorological normalization), as shown in Figure 7. The reductions of 6–46% in PM2.5 and 28–49% in PM10 were estimated during the overall ULC period.
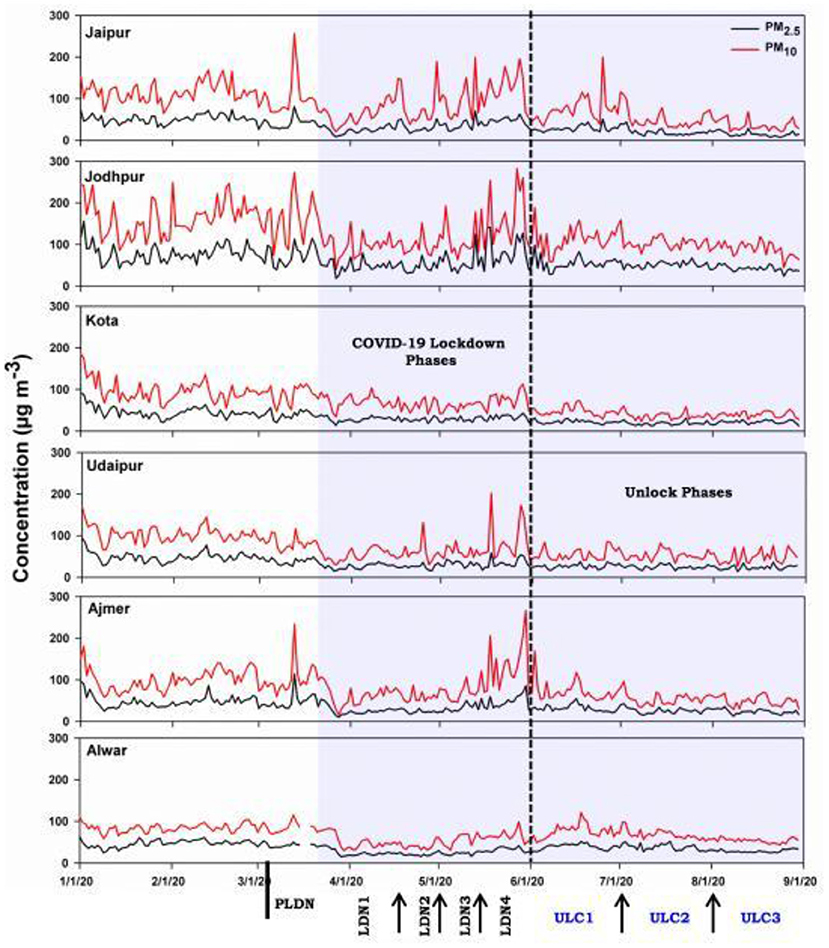
Figure 4. Daily time series variations of PM2.5 and PM10 in six major cities from January 1 to August 31, 2020.
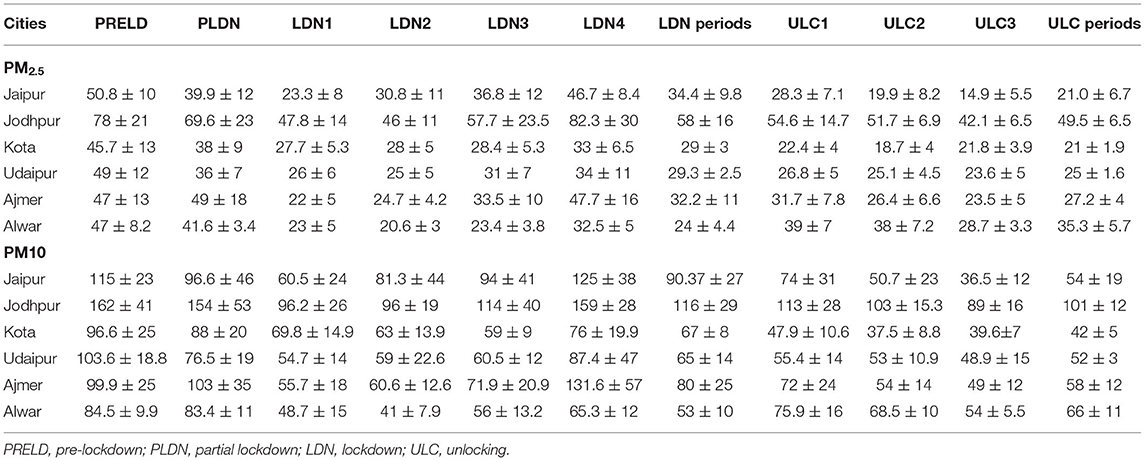
Table 2. The daily average mass concentrations of PM2.5 and PM10 during different periods, namely, PRELD, PLDN, and LDN phases and unlocking phases in six different cities of Rajasthan in India.
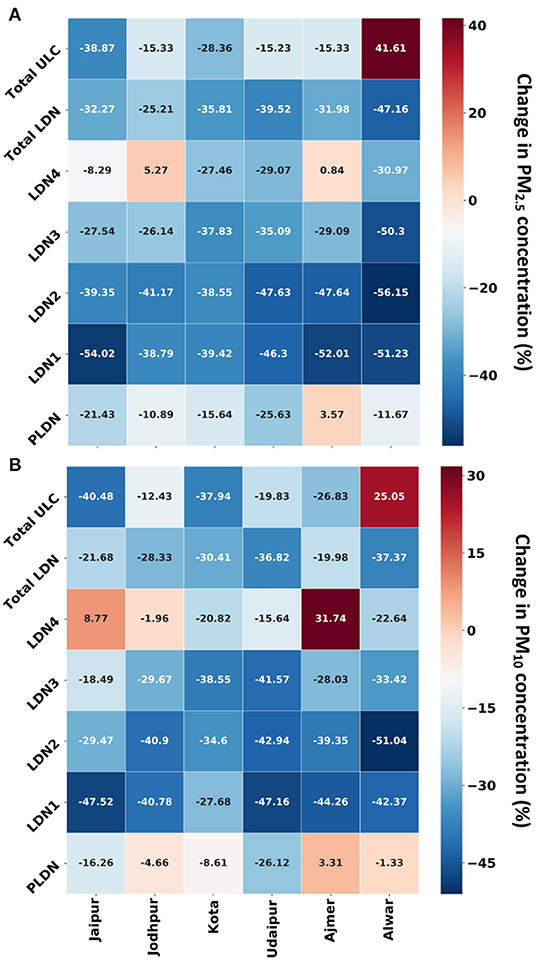
Figure 5. Percentage change in the concentrations of PM2.5 and PM10 during the COVID-10 lockdown (LDN) phases and unlocking period in six cities. The percentage change in the concentration of PM2.5 and PM10 was calculated during partial lockdown and LDN phases by comparing the pre-lockdown period and the change in the unlocking period compared to the LDN period.
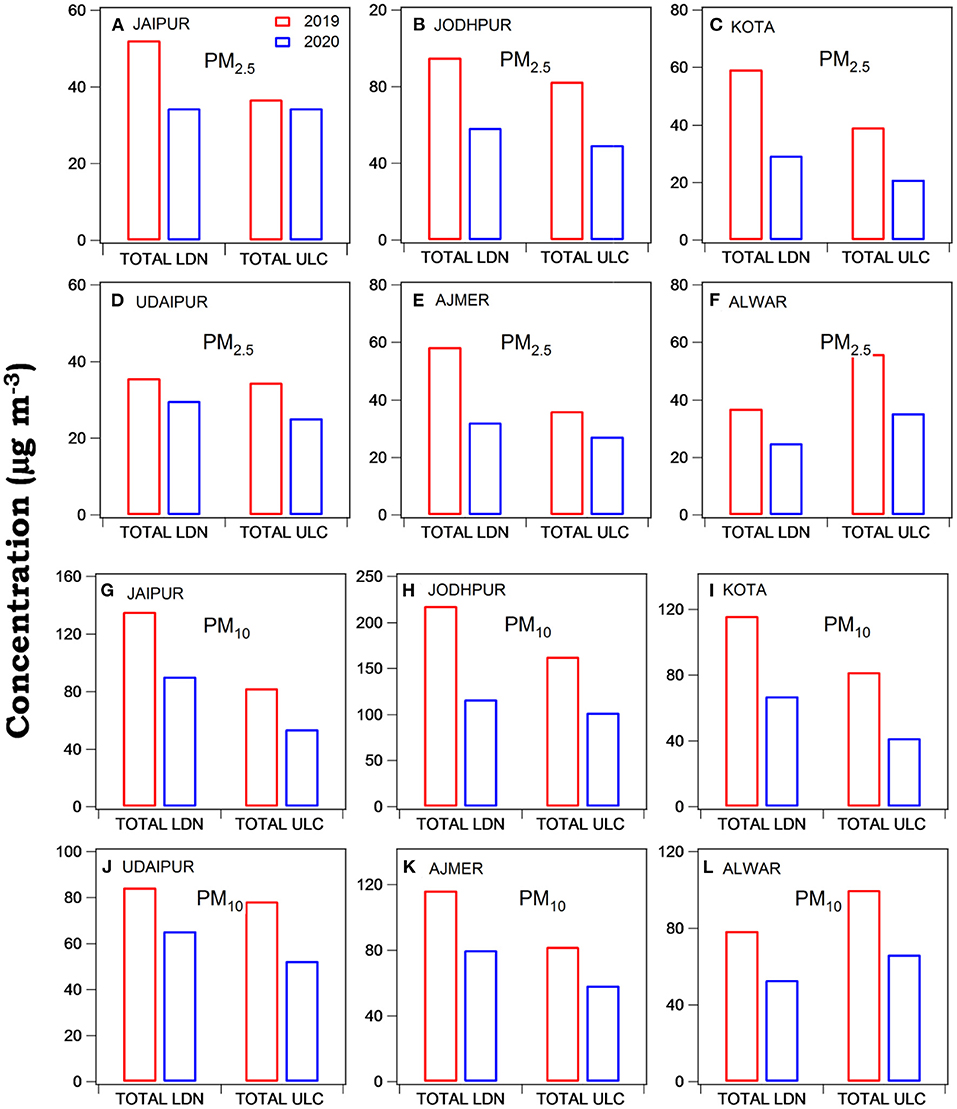
Figure 6. Variations of PM2.5 and PM10 in Jaipur, Jodhpur, Kota, Udaipur, Ajmer, and Alwar during COVID-19 lockdown and unlocking periods and a comparison to the same period of the previous year (2019).
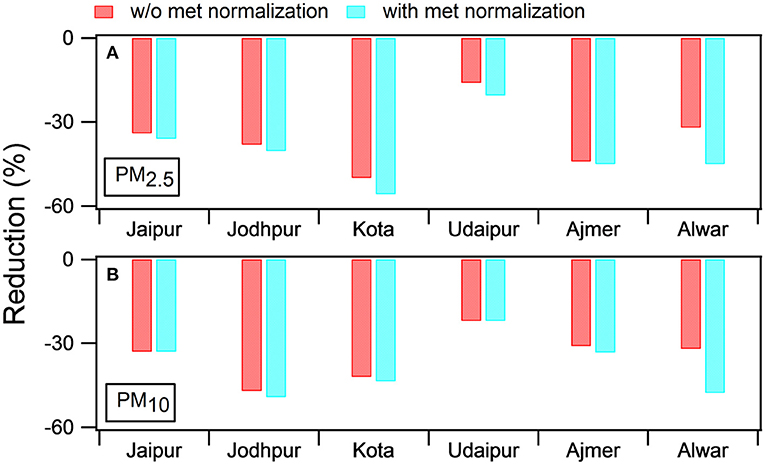
Figure 7. Percentage reduction (without and with meteorology normalization) during the COVID-19 lockdown period in 2020 in all cities of Rajasthan with respect to the mean of the previous years for the same period.
Overall, the declining trends of PM2.5 and PM10 observed in all cities during the COVID-19 LDN period are attributed to the reduction in combustion-related emissions (NASA, 2020; Navinya et al., 2020). Conversely, to some extent, elevated levels of PM2.5 and PM10 were observed during the LDN3 and LDN4 periods (see Figure 4). During all COVID-19 LDN phases, the restrictions were diverse and resulted in variations of PM2.5 and PM10 in each LDN phase—for example, major anthropogenic and industrial activities were stopped, except for emergency services like the health sector (Yadav et al., 2020). Later, some relaxations with limitations were allowed in the subsequent LDN periods (MHA, 2020). Sahu et al. (2011) have reported that the emissions from transport and industrial sectors have significant contributions to the ambient concentrations of both PM2.5 and PM10. In addition to this, wind-blown dust is a more substantial source of coarser particles (PM10) in the northern and western regions of India (Sahu et al., 2011; Yadav et al., 2014b). During the ULC period, only Alwar City exhibited higher values of PM2.5 and PM10 compared with the overall LDN phases in the same year; this could have happened due to limited local rainfall events. Interestingly, the highest plummet can be attributed to rainfall in the ULC period (monsoon) compared to 2019. In the monsoon period, episodes of rainfall can wash out the dust particles (PM10) much faster than the finer particles (PM2.5), unless there is frequent rainfall for many days (Yadav et al., 2014c). Figure 8 shows the ratios of PM2.5/PM10 during the study period in the year 2020 in six cities that were used to investigate aerosol combustion and non-combustion sources. The ratio of PM2.5/PM10 was observed to be <0.50 μg μg−1 in all cities due to higher temperatures during the COVID-19 LDN period (pre-monsoon months), leading to dry and dusty conditions (Chan and Yao, 2008). The emissions from wind-blown dust are highly significant, mainly contributing to PM10, and are probably the reason for the high levels of coarser particles. Interestingly, about 0.40 μg μg−1 ratio of PM2.5/PM10 was observed during all phases of COVID-19 LDN in Jaipur City (nearby Delhi) due to the impact of dust storm. In the pre-monsoon season, dust storms originate from Arab countries, and the Thar Desert can influence most regions, like Delhi, Rajasthan, etc., of India (Anand et al., 2019), thus rapidly increasing the PM10 levels. Overall, dust pollution is prominent in particle loads over the Rajasthan state. In addition to this, we have incorporated the plots of O3/NO2 and SO2/NO2 ratios during the study period in Figure 8. In the LDN periods (pre-monsoon months), the high O3/NO2 ratios were due to the transport of photochemical pollutants from higher altitudes. The efficient vertical mixing with free tropospheric air increases O3 in the pre-monsoon months. The enhanced SO2/NO2 indicates that the predominant source of SO2 is coal-based thermal power plants. In other words, the site receives reasonably aged SO2 from distant regions, resulting in high ratios (Mor et al., 2021).
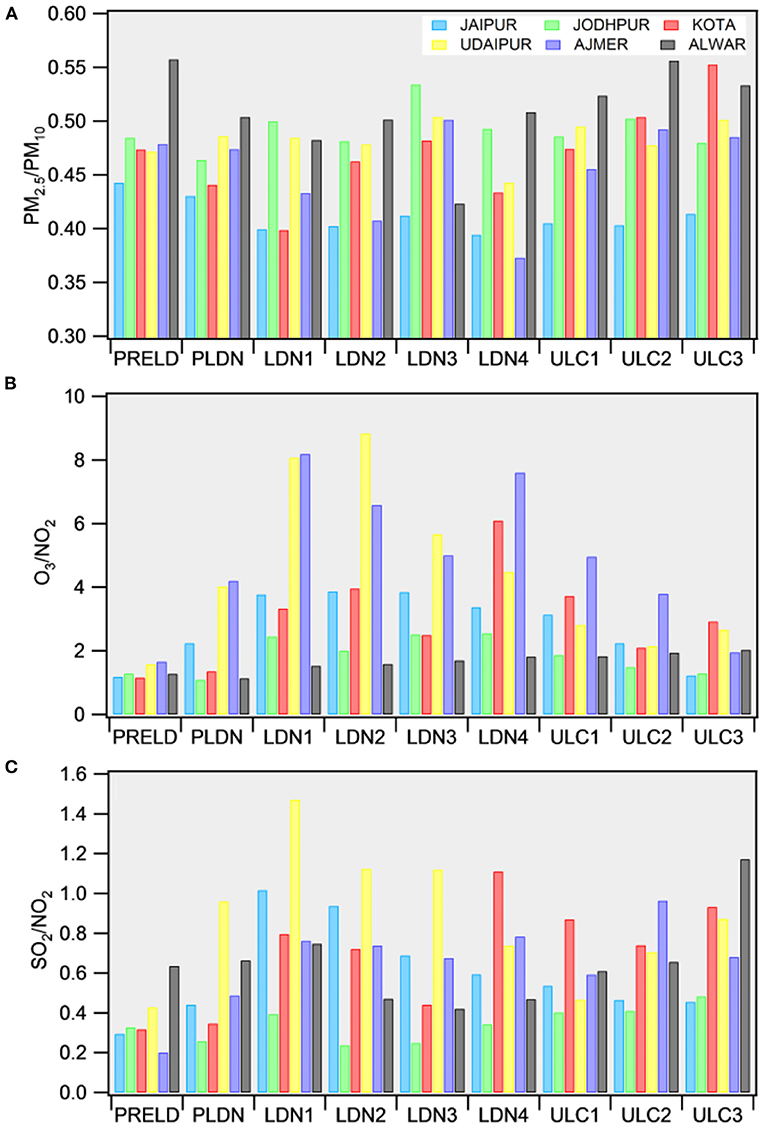
Figure 8. PM2.5/PM10, O2/NO2 and SO2/NO2 ratios in six cities of Rajasthan during the different phases of the study.
Impact of Meteorology and Biomass Burning on Air Quality
In addition to the local emissions, the variation in ambient air pollutants can also be influenced by the local meteorology, transport, transformation, and scavenging by the precipitation (Sahu et al., 2016a,b, 2020; Yadav et al., 2019a,b). Therefore, the mean wind streamlines along with temperature and precipitation at 925 mb pressure level are used in the study to investigate any unusual changes in meteorological and transport processes during the COVID-19 LDN period. The comparison of meteorological parameters during 2020 and 2019 for the PRELD, COVID-19 LDN, and UCL periods is shown in Figure 2. The trends in wind speed, temperature, and precipitation indicate the different features during the entire study period due to the change of seasons from winter to pre-monsoon and then monsoon (Yadav et al., 2014a; Sahu et al., 2017). Hence, the trends of PM2.5 and PM10 may also include a factor related to the change of meteorological conditions in the same year in comparison with the PRELD period. In the pre-monsoon season (LDN period), high temperatures, high wind speeds, and more profound boundary layer heights may lead to a higher dispersion of pollutants and lower concentrations (Sahu et al., 2020). However, the difference between 2019 and 2020 does not show significant fluctuations in wind speed, temperature, and precipitation in the western region of India during the PRELD to ULC periods. The mean surface temperatures and rainfall were in ranges of 30–32°C and 0–1.5 mm day−1 during the COVID-19 LDN period in the years 2019 and 2020 over the study region. The strong westerly wind prevails over the area during both years in the COVID-19 LDN period. In general, all meteorological parameters were, more or less, similar during the study period, especially in the COVID-19 lockdown period in 2019 and 2020. Several studies have reported that the meteorological parameters were identical in the previous years and 2020 during the COVID-19 LDN over the Indian region (Navinya et al., 2020; Sharma et al., 2020; Singh et al., 2020; Yadav et al., 2020). Additionally, in the pre-monsoon season, the local emissions become lesser, but outside contributions become more prominent due to the increased transport of regional air masses. Furthermore, ~7% open agricultural burning in this season is mainly due to the burning of residues from wheat crops. Figure 3 shows MODIS-active fire maps over India during the entire study period for the years 2019 and 2020. In addition to this, to some extent, the SW winds also influenced the region after passing through populated areas of central India; they may get polluted during the pre-monsoon-to-monsoon transition period (Sahu et al., 2020; Maji et al., 2021; Yadav et al., 2021). The maps clearly show that the pre-monsoon fire events in 2020 during COVID-19 LDN have somewhat decreased to a shallow level compared to those in 2019, especially in western, northern, and central India (Kant et al., bib2020), as biomass burning is a significant aerosol source. Overall, the reductions in fire events along with local emissions have also been deficient. Additionally, we have normalized the mass concentrations of PM2.5 and PM10 with meteorology to investigate the actual change in emissions due to COVID-19 LDN. In the method, ventilation coefficient, a product of wind speed (WS) and boundary layer height (BLH), is used to see the role of weather dynamics for all cities of Rajasthan. The WS (above 10 m) and BLH datasets used in the study are from Copernicus Emergency Management Service (Climate Data Store) (https://cds.climate.copernicus.eu/cdsapp#!/search?type=dataset). The extensive details of normalizing the meteorological effects on ambient pollutants are reported elsewhere (Dai et al., 2020; Falocchi et al., 2021; Mishra et al., 2021). The reductions in PM2.5 and PM10 (with meteorology-normalized data) were in the ranges of 20–55 and 22–49% during the COVID-19 LDN period compared to the same period of 2019, as shown in Figure 7. Enhancement (differences ~10%) was observed in the reduction of PM2.5 and PM10 (in meteorology-normalized data) compared to without meteorology-normalized data during the LDN period in all cities.
Air Quality Index in Rajasthan Cities
Air quality index is a tool for people to understand the air quality status in an easy way. This tool transforms the complex data of various pollutants into a single number (index value), classification, and color (Beig et al., 2010). AQI was calculated for all cities to identify the overall improvement in air quality, and the details of AQI are available elsewhere (CPCB, 2014). There are six AQI categories: good + satisfactory (0–100), moderately polluted (101–200), poor (201–200), very poor (301–400), and severe (401–500). We have converted the PM2.5, PM10, and SO2 concentration values into AQI using typical values, as the minimum of three parameters was very much needed for the calculation. Therefore, only SO2 concentration was used for the AQI analysis. Each category is decided based on the ambient concentration values of air pollutants and their likely health impacts known as health breakpoints. The AQ sub-index and breakpoint concentration of different pollutants are provided elsewhere (CPCB, 2014). Figure 9 indicates the AQI variation during the entire study period over six cities. Overall, the AQI was satisfactory to moderately polluted categories during the whole study period (PRELD to ULC). The AQI varied in the ranges of 85–161 during PRELD in all cities, with the highest in Jaipur, Jodhpur, and Udaipur cities, during which the traffic was regular. Later, the AQI declined during various LDN periods compared to during PRELD in all cities, except Jaipur, Jodhpur, and Ajmer. More or less, in all cities, increasing values were seen during the subsequent LDN periods but with the highest of 117 in Jaipur, 174 in Jodhpur, and 121 in Ajmer. Overall, in LDN1 to LDN3, all cities were in satisfactory ranges, but Jaipur, Jodhpur, and Ajmer showed moderate air quality conditions in LDN4. Interestingly, Jodhpur City gets good air quality during the third phase of ULC since the LDN periods. It suggests that more contributions to coarser particles (PM10) are wind-blown dust and dust storms and, of course, anthropogenic activities, which have been allowed with limitations in the subsequent LDNs.
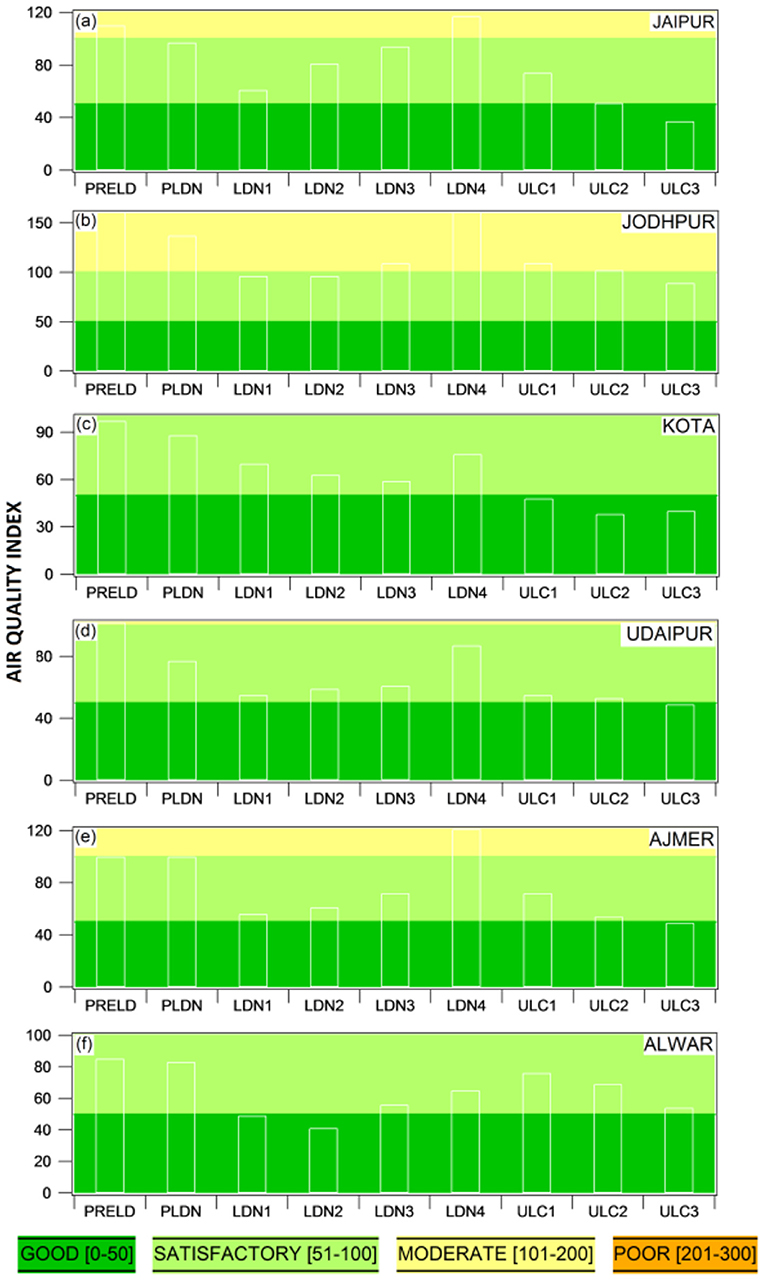
Figure 9. Air quality index for major cities of Rajasthan during the study period in the year 2020.
Conclusions
We have investigated the trends of the daily mean concentrations of PM2.5 and PM10 in six cities, including Jaipur, Jodhpur, Kota, Udaipur, Ajmer, and Alwar of Rajasthan in India. We have obtained the data from CPCB and analyzed it for the years 2019 and 2020 during eight specific months (January to August). The primary aim is to understand the role of unusually low anthropogenic emissions in ambient concentrations of particulate pollutants during the COVID-19 lockdown. The investigation combines the effects of local anthropogenic emissions, meteorology, and the transport of biomass burning in the variations of both pollutants. The PM2.5 and PM10 concentrations were reduced significantly in all cities and met the national standards during the lockdown. However, in a few cities, like Jodhpur, Jaipur, and Ajmer, the PM10 levels have not fallen below the standard limit (100 μg m−3) most of the time during the COVID-19 LDN period due to non-combustion-related sources like wind-blown dust. The highest reduction in PM2.5, by 47%, was observed in Alwar, followed by Udaipur (40%), Kota (36%), Jaipur (32%), and Ajmer (32%), while Jodhpur showed the lowest reduction of about 25% during the COVID-19 LDN, respectively. PM10 was reduced by 37 and 36% in Alwar and Udaipur. However, the lowest (19–30%) reductions were in Jaipur, Jodhpur, Kota, and Ajmer. More or less, there was 50% of PM2.5 and PM10 in all cities due to higher temperatures during the COVID-19 LDN period (pre-monsoon months), supporting the uplifting of mineral and dust particles (PM10). In addition to the unusual local emissions, meteorological parameters, such as rainfall and movement of air masses, played a significant role in reducing the particle levels.
Data Availability Statement
Publicly available datasets were analyzed in this study. This air quality data can be found form the CPCB (https://cpcb.nic.in/).
Author Contributions
RY: conceptualization, software, and writing—original draft. PV: formal data analysis. PK and RY: data analysis. UP, PV, and VS: data collection. MG, PK, RY, and NT: methodology. PD, SJ, LS, GB, and DR: discussion. PD, SJ, LS, GB, DR, RY, PV, PK, UP, VS, MG, and NT: writing—review and editing. GB, RY, and LS: investigation. SJ, LS, and GB: visualization. All authors contributed to the article and approved the submitted version.
Conflict of Interest
The authors declare that the research was conducted in the absence of any commercial or financial relationships that could be construed as a potential conflict of interest.
Publisher's Note
All claims expressed in this article are solely those of the authors and do not necessarily represent those of their affiliated organizations, or those of the publisher, the editors and the reviewers. Any product that may be evaluated in this article, or claim that may be made by its manufacturer, is not guaranteed or endorsed by the publisher.
Acknowledgments
We acknowledge and thank the Central Pollution Control Board (India), the Rajasthan State Pollution Control Board, and the Ministry of Environment, Forest, and Climate Change (India) for making the air quality data publicly available. We acknowledge the ISRO-Bhuvan (https://bhuvan.nrsc.gov.in/) for providing the map of Rajasthan state. We acknowledge the Moderate Resolution Imaging Spectroradiometer (MODIS) for providing the active fire count datasets. We are thankful to ECMWF ERA5 (https://climate.copernicus.eu/) for providing the boundary layer height and wind speed datasets used in the study. Authors would like to acknowledge the use of temperature, wind speed and precipitation datasets provided by National Centre for Environmental Prediction (NCEP). We acknowledge the meteorological data explorer (METEX), Centre for Global Environmental Research (CGER) for providing the backward trajectories data. The authors would like to thank the Director, IITM, and Secretary, Ministry of Earth Sciences (Govt. of India), for their encouragement and support. RY and GB also acknowledge the INDO-UK APHH PROMOTE project. PND thanks Indian National Science Academy, New Delhi, for the award of Visiting Scientist-2021.
Supplementary Material
The Supplementary Material for this article can be found online at: https://www.frontiersin.org/articles/10.3389/frsc.2022.792507/full#supplementary-material
References
Anand, V., Korhale, N., Rathod, A., and Beig, G. (2019). On processes controlling fine particulate matters in four Indian megacities. Environ. Pollut. 254, 113026. doi: 10.1016/j.envpol.2019.113026
Bashir, M. F., Jiang, B., Komal, B., Bashir, M. A., Farooq, T. H., Iqbal, N., et al. (2020). Correlation between environmental pollution indicators and COVID-19 pandemic: a brief study in Californian context. Environ. Res. 187, 109652. doi: 10.1016/j.envres.2020.109652
Beig, G., Bano, S., Sahu, S. K., Anand, V., Korhale, N., Rathod, A., et al. (2020). COVID-19 and environmental -weather markers: unfolding baseline levels and veracity of linkages in tropical India. Environ. Res. 191, 110121. doi: 10.1016/j.envres.2020.110121
Beig, G., Ghude, S. D., and Deshpande, A. (2010). Scientific Evaluation of Air Quality Standards and Defining Air Quality Index for India. Pune: Indian Institute of Tropical Meteorology. Available online at: https://www.tropmet.res.in/l~ip/Publication/RR-pdf/RR-127.pdf
Beig, G., Gunthe, S., and Jadhav, D.B. (2007). Simultaneous measurements of Ozone and its precursors on a diurnal scale at a semi-urban site in India. J Atmos. Chemi. 57, 239–253. doi: 10.1007/s10874-007-9068-8
Chan, C. K., and Yao, X. (2008). Air pollution in mega cities in China. Atmos. Environ. 42, 1–42. doi: 10.1016/j.atmosenv.2007.09.003
Conticini, E., Bruno, F., and Dario, C. (2020). Can atmospheric pollution be considered a co-factor in extremely high level of SARS-CoV-2 lethality in Northern Italy? Environ. Poll. 261, 114465. doi: 10.1016/j.envpol.2020.114465
CPCB. (2014). National Air Quality Index Report. Central Pollution Control Board, New Delhi (India). Available online at: https://app.cpcbccr.com/ccr_docs/FINAL-REPORT_AQI_.pdf
Dai, Q., Liu, B., Bi, X., Wu, J., Liang, D., Zhang, Y., et al. (2020). Dispersion normalized PMF provides insights into the significant changes in source contributions to PM2. 5 after the COVID-19 outbreak. Environ. Sci. Technol. 54, 9917–9927. doi: 10.1021/acs.est.0c02776
Dantas, G., Siciliano, B., França, B. B., da Silva, C. M., and Arbilla, G. (2020). The impact of COVID-19 partial lockdown on the air quality of the city of Rio de Janeiro, Brazil. Sci. Total Environ. 729, 139085. doi: 10.1016/j.scitotenv.2020.139085
Falocchi, M., Zardi, D., and Giovannini, L. (2021). Meteorological normalization of NO2 concentrations in the Province of Bolzano (Italian Alps). Atmos. Environ. 246, 118048. doi: 10.1016/j.atmosenv.2020.118048
Goel, A., Saxena, P., Sonwani, S., Rathi, S., Srivastava, A., Bharti, A. K., et al. (2021). Health benefits due to reduction in respirable particulates during COVID-19 lockdown in India. Aerosol Air Qual. 21, 200460. doi: 10.4209/aaqr.200460
Hama, S. M., Kumar, P., Harrison, R. M., Bloss, W. J., Khare, M., Mishra, S., et al. (2020). Four-year assessment of ambient particulate matter and trace gases in the Delhi-NCR region of India. Sustain. Cities Soc. 54, 102003. doi: 10.1016/j.scs.2019.102003
Jain, S., and Sharma, T. (2020). Social and travel lockdown impact considering coronavirus disease (COVID-19) on air quality in megacities of India: present benefits, future challenges and way forward. Aerosol Air Qual. Res. 20, 1222–1236. doi: 10.4209/aaqr.2020.04.0171
Kanniah, K. D., Zaman, N. A. F. K., Kaskaoutis, D. G., and Latif, M. T. (2020). COVID-19's impact on the atmospheric environment in the Southeast Asia region. Sci. Total Environ. 736, 139658. doi: 10.1016/j.scitotenv.2020.139658
Kant, Y., Mitra, D., and Chauhan, P. (2020). Space-based observations on the impact of COVID-19-induced lockdown on aerosols over India. Curr. Sci. 119, 539–544. doi: 10.18520/cs/v119/i3/539-544
Kumar, P., Hama, S., Omidvarborna, H., Sharma, A., Sahani, J., Abhijith, K. V., et al. (2020). Temporary reduction in fine particulate matter due to ‘anthropogenic emissions switch-off’ during COVID-19 lockdown in Indian cities. Sustain. Cities Soc. 62, 102382. doi: 10.1016/j.scs.2020.102382
Kumari, P., and Toshniwal, D. (2020). Impact of lockdown measures during COVID-19 on air quality- A case study of India. Int. J. Environ. Health Res. 32, 503–510. doi: 10.1080/09603123.2020.1778646
Li, L., Li, Q., Huang, L., Wang, Q., Zhu, A., Xu, J., et al. (2020). Air quality changes during the COVID-19 lockdown over the Yangtze River Delta Region: an insight into the impact of human activity pattern changes on air pollution variation. Sci. Total Environ. 732, 139282. doi: 10.1016/j.scitotenv.2020.139282
Maanju, S. K., and Saha, K. (2013). Impact of mining industry on environmental fabric -a case study of Rajasthan state in India. J. Environ. Sci. Toxicol. Food Technolo. 6, 8–13.
Mahato, S., Pal, S., and Ghosh, K. G. (2020). Effect of lockdown amid COVID-19 pandemic on air quality of the megacity Delhi, India. Sci. Total Environ. 730, 139086. doi: 10.1016/j.scitotenv.2020.139086
Maji, S., Yadav, R., Beig, G., Gunthe, S. S., and Ojha, N. (2021). On the processes governing the variability of PTR-MS based VOCs and OVOCs in different seasons of a year over hillocky mega city of India. Atmos. Res. 261, 105736. doi: 10.1016/j.atmosres.2021.105736
MHA (2020). No. 40-3/2020-DM-I (A), Government of India, Ministry of Home Affairs. Available online at: https://www.mha.gov.in/sites/default/files/MHA%20order%20dt%2015.04.2020%2C%20with%20Revised%20Consolidated%20Guidelines_compressed%20%283%29.pdf; http://www.du.ac.in/du/uploads/PR_Consolidated%20Guideline%20of%20MHA_28032020%20(1)_1.PDF
Mishra, A. K., Rajput, P., Singh, A., Singh, C. K., and Mall, R. K. (2021). Effect of lockdown amid COVID-19 on ambient air quality in 16 Indian cities. Front. Sustain. Cities 3, 705051. doi: 10.3389/frsc.2021.705051
MoEFCC. (2015). Environment (Protection) Amendment Rules. Ministry of Environment, Forest and Climate Change (MoEFCC), Government of India, New Delhi.
Mor, S., Kumar, S., Singh, T., Dogra, S., Pandey, V., and Ravindra, K. (2021). Impact of COVID-19 lockdown on air quality in Chandigarh, India: understanding the emission sources during controlled anthropogenic activities. Chemosphere 263, 127978. doi: 10.1016/j.chemosphere.2020.127978
Nakada, L. Y. K., and Urban, R. C. (2020). COVID-19 pandemic: Impacts on the air quality during the partial lockdown in São Paulo state, Brazil. Sci. Total Environ. 730, 139087. doi: 10.1016/j.scitotenv.2020.139087
NASA. (2020). Available online at: https://earthobservatory.nasa.gov/images
Navinya, C., Patidar, G., and Phuleria, H. C. (2020). Examining effects of the COVID-19 national lockdown on ambient air quality across urban India. Aerosol Air Qual. Res. 20, 1759–1771. doi: 10.4209/aaqr.2020.05.0256
Pope, C. A., Ezzati, M., and Dockery, D. W. (2009). Fine-particulate air pollution and life expectancy in the United States. N. Engl. J. Med. 360, 376–386. doi: 10.1056/NEJMsa0805646
PPAC (2020). Consumption of Petroleum Products, Petroleum Planning & Analysis Cell. Available online at: https://www.ppac.gov.in/content/147_1_ConsumptionPetroleum.aspx
Sahu, L. K., Pal, D., Yadav, R., and Munkhtur, J. (2016b). Aromatic VOCs at major road junctions of a metropolis in India: measurements using TD-GC-FID and PTR-TOF-MS instruments. Aerosol Air Qual. Res. 16, 2405–2420. doi: 10.4209/aaqr.2015.11.0643
Sahu, L. K., Tripathi, N., and Yadav, R. (2017). Contribution of biogenic and photochemical sources to ambient VOCs during winter to summer transition at a semi-arid urban site in India. Environ. Pollu. 229, 595–606. doi: 10.1016/j.envpol.2017.06.091
Sahu, L. K., Yadav, R., and Pal, D. (2016a). Source identification of VOCs at an urban site of western India: Effect of marathon events and anthropogenic emissions. J. Geophys. Res. 121, 2416–2433. doi: 10.1002/2015JD024454
Sahu, L. K., Yadav, R., and Tripathi, N. (2020). Aromatic compounds in a semi-urban site of western India: Seasonal variability and emission ratios. Atmos. Res. 246, 105114. doi: 10.1016/j.atmosres.2020.105114
Sahu, S. K., Beig, G., and Parkhi, N. (2011). Emissions inventory of anthropogenic PM2.5 and PM10 in Delhi during commonwealth games 2010. Atmos. Environ. 45, 6180–6190. doi: 10.1016/j.atmosenv.2011.08.014
Sharma, S., Zhang, M., Gao, J., Zhang, H., and Kota, S. H. (2020). Effect of restricted emissions during COVID-19 on air quality in India. Sci. Total Environ. 728, 138878. doi: 10.1016/j.scitotenv.2020.138878
Sicard, P., De Marco, A., Agathokleous, E., Feng, Z., Xu, X., Paoletti, E., et al. (2020). Amplified ozone pollution in cities during the COVID-19 lockdown. Sci. Total Environ. 735, 139542. doi: 10.1016/j.scitotenv.2020.139542
Singh, R. P., and Chauhan, A. (2020). Impact of lockdown on air quality in India during COVID-19 pandemic. Air Qual. Atmos. Health 13, 921–928. doi: 10.1007/s11869-020-00863-1
Singh, V., Singh, S., Biswal, A., Kesarkar, A. P., Mor, S., and Ravindra, K. (2020). Diurnal and temporal changes in air pollution during COVID-19 strict lockdown over different regions of India. Environ. Pollut. 266, 115368. doi: 10.1016/j.envpol.2020.115368
Sokhi, R. S., Singh, V., Querol, X., Finardi, S., Targino, A. C., de Fatima Andrade, M., et al. (2021). A global observational analysis to understand changes in air quality during exceptionally low anthropogenic emission conditions. Environ. Int. 157, 106818. doi: 10.1016/j.envint.2021.106818
Tobías, A., Carnerero, C., Reche, C., Massagu,é, J., Via, M., Minguillón, M. C., et al. (2020). Changes in air quality during the lockdown in Barcelona (Spain) one month into the SARS-CoV-2 epidemic. Sci. Total Environ. 726, 138540. doi: 10.1016/j.scitotenv.2020.138540
WHO (2020). Rolling Updates on Coronavirus Disease (COVID-19). World Health Organization. Available online at: https://www.who.int/emergencies/diseases/novel-coronavirus-2019/events
Wu, A., Peng, Y., Huang, B., Ding, X., Wang, X., Niu, P., et al. (2020). Genome composition and divergence of the novel coronavirus (2019-nCoV) originating in China. Cell Host Microbe 27, 325–328. doi: 10.1016/j.chom.2020.02.001
Yadav, R., Beig, G., Anand, V., Kalbande, R., and Maji, S. (2021). Tracer-based characterization of source variations of ambient isoprene mixing ratios in a hillocky megacity, India, influenced by the local meteorology. Environ. Res. 205, 112465. doi: 10.1016/j.envres.2021.112465
Yadav, R., Beig, G., and Jaffrey, S. N. A. (2014c). The linkages of anthropogenic emissions and meteorology in the rapid increase of particulate matter at a foothill city in the Arawali range of India. Atmos. Environ. 85, 147–151. doi: 10.1016/j.atmosenv.2013.09.007
Yadav, R., Korhale, N., Anand, V., Rathod, A., Bano, S., Shinde, R., et al. (2020). COVID-19 lockdown and air quality of SAFAR-India metro cities. Urban Clim. 34, 100729. doi: 10.1016/j.uclim.2020.100729
Yadav, R., Sahu, L. K., Beig, G., and Jaaffrey, S. N. A. (2016). Role of long-range transport and local meteorology in seasonal variation of surface ozone and its precursors at an urban site in India. Atmos. Res. 176–177, 96–107. doi: 10.1016/j.atmosres.2016.02.018
Yadav, R., Sahu, L. K., Beig, G., Tripathi, N., and Jaaffrey, S. N. A. (2017). Ambient particulate matter and carbon monoxide at an urban site of India: influence of anthropogenic emissions and dust storms. Environ. Pollut. 225, 291–303. doi: 10.1016/j.envpol.2017.01.038
Yadav, R., Sahu, L. K., Beig, G., Tripathi, N., Maji, S., and Jaaffrey, S. N. A. (2019b). The role of local meteorology on ambient particulate and gaseous species at an urban site of western India. Urban Clim. 28, 100449. doi: 10.1016/j.uclim.2019.01.003
Yadav, R., Sahu, L. K., Jaaffrey, S. N. A., and Beig, G. (2014a). Temporal variation of particulate matter (PM) and potential sources at an urban site of udaipur in western India. Aerosol Air Qual. Res. 14, 1613–1629. doi: 10.4209/aaqr.2013.10.0310
Yadav, R., Sahu, L. K., Jaaffrey, S. N. A., and Beig, G. (2014b). Distributions of ozone and related trace gases at an urban site in western India. J. Atmos. Chem. 71, 125–144. doi: 10.1007/s10874-014-9286-9
Yadav, R., Sahu, L. K., Tripathi, N., Pal, D., Beig, G., and Jaaffrey, S. N. A. (2019a). Investigation of emission characteristics of NMVOCs over urban site of Western India. Environ. Pollut. 252, 245–255. doi: 10.1016/j.envpol.2019.05.089
Keywords: particulate matter, COVID-19 lockdown, air quality index, meteorology, India
Citation: Yadav R, Vyas P, Kumar P, Sahu LK, Pandya U, Tripathi N, Gupta M, Singh V, Dave PN, Rathore DS, Beig G and Jaaffrey SNA (2022) Particulate Matter Pollution in Urban Cities of India During Unusually Restricted Anthropogenic Activities. Front. Sustain. Cities 4:792507. doi: 10.3389/frsc.2022.792507
Received: 10 October 2021; Accepted: 13 January 2022;
Published: 22 March 2022.
Edited by:
Prashant Rajput, Banaras Hindu University, IndiaReviewed by:
Pallavi Saxena, University of Delhi, IndiaSergio Ibarra Espinosa, University of São Paulo, Brazil
Copyright © 2022 Yadav, Vyas, Kumar, Sahu, Pandya, Tripathi, Gupta, Singh, Dave, Rathore, Beig and Jaaffrey. This is an open-access article distributed under the terms of the Creative Commons Attribution License (CC BY). The use, distribution or reproduction in other forums is permitted, provided the original author(s) and the copyright owner(s) are credited and that the original publication in this journal is cited, in accordance with accepted academic practice. No use, distribution or reproduction is permitted which does not comply with these terms.
*Correspondence: Ravi Yadav, eWFkYXZyYXZpMzhAZ21haWwuY29t; cmF2aS55YWRhdkB0cm9wbWV0LnJlcy5pbg==