 Philip James
 Jennine Jonczyk1
 Luke Smith
- 1Urban Observatory, School of Civil Engineering, Newcastle University, Newcastle upon Tyne, United Kingdom
- 2Internet of Things Laboratory, School of Computing, Newcastle University, Newcastle upon Tyne, United Kingdom
The smart city term has been widely used for a number of years and many pilot projects and limited scale, sector independent initiatives have been progressed, but comprehensive, long-term, city wide, multi-sector systems are much less evident. This paper examines one such case study in Newcastle, UK highlighting the challenges and opportunities that realizing “smart city” concepts at scale present. The paper provides the background to the Newcastle Urban Observatory project and discusses the socio-technical and practical challenges of developing and maintaining smart city networks of sensors in the plurality that is a modern city. We discuss the organizational requirements, governance, data quality and volume issues, big data management and discuss the current and future needs of decision makers and other city stakeholders. Finally, we propose areas where smart cities can have a positive impact on public outcomes through the discussion of two case studies related to COVID-19 and pedestrianization initiatives.
Introduction
Across the globe cities and regions are building and developing smart infrastructure to support the drive to smart cities.1 There are many definitions and ideas of what a smart city is (Cocchia, 2014) but here we are focusing on smart systems that release new forms of data at unprecedented volume and velocity through deployed sensing or data from systems embedded in infrastructure (smart infrastructure). Much of this is related to the internet of things (IoT; Atzori et al., 2010) that describes devices that connect to the internet and provide measurements, operational information or alerts to their operators and others. These systems can be used to measure traffic flow, pedestrian movement, air quality, temperature, humidity, rainfall, passenger numbers, wind speed, energy consumption etc. through embedded or specialist sensors that typically transmit data in near real time and require little power and intermittent maintenance.
Whilst there are countless examples of the deployment of smart city systems and infrastructure and a global market estimated to be worth billions of dollars these tend toward the pilot scale or address an issue across a single sector (e.g., smart parking systems; UKAuthority, 2021) and are, in many cases, the result of investment in technology solutions and hardware e.g., e-scooters (UK Government, 2020). 1 While these IoT devices are connected to the internet, they often lack the virtues that attracted many early adopters of the World Wide Web—the IoT data often lacks discoverability, transparency, and longevity. System integrators and data companies are concurrently developing “smart city platforms” (Chamoso et al., 2018) that are envisaged to be a clearing house of data from these new systems that unlock innovation and efficiency in city operations but with few concrete and live examples that showcase how these might work in practice. The innovators in this space also tend to have more centralized control of city management and resources and are able to force change from the top to ensure integration and compliance whilst having access to the capital to invest such as in new city developments (TfL, 2017; Singapore, 2018; Dubai, 2022). Mega-cities and centralized economies notwithstanding, deploying and managing cross-sector IoT infrastructure in many cities must contend with pluralistic city governance, a lack of tools through which compliance can be forced, limited finance and complex procurement issues.
The Newcastle Urban Observatory (UO; James et al., 2014) is based in Newcastle, a regional capital in the North East of England with a population of ~300,000, one of the mid-sized cities that are the source of economic dynamism (Frick and Rodríguez-Pose, 2018) and is typical of the many European and US post-industrial cities reshaping themselves after the decline of traditional heavy industry. The concept of the Urban Observatory, as defined by the United Nations is a network for collating and disseminating data with the goal of understanding urban indicators (United Nations, 2019) to achieve the UN SDGs. Extending this concept to include embedded, real-time monitoring data that cities, organizations and others collect that can be accessed, visualized, and analyzed in real-time to support operational and strategic decision making and democratization of governance is the vision of the Newcastle Urban Observatory. The research hypothesis that underpinned the Newcastle UO was firstly that a smart city monitoring infrastructure across multiple urban sectors could be built at the scale of the city using existing off-the-shelf sensors, minimizing technological lock-in (Kitchin, 2014) and, secondly, that this collection of data could be applied to new forms of research and evidence-based policy-making in cities.
On the ground the UO in Newcastle has been deploying environmental, infrastructural and social monitoring systems (sensors and sensor platforms) and acting as a clearing house and curated data system for other real-time data either already in the public domain or accessed through data sharing agreements. The UO was established in 2015 and to date has collected over 10,000,000,000 city observations through over 3,600 sensor streams across 65 variables (including air quality, traffic, pedestrian movements, and climate indicators). Currently the UO ingests circa 10,000 observations every minute and provides real-time access to live and historic data openly through dashboards, APIs and data download facilities.
Initially conceived as a platform for research into smart cities and a facility to enable easy access to heretofore locked away data the UO has grown organically through close collaboration with the quadruple helix of university-industry-government-public (Carayannis and Campbell, 2009) to act as a focal point for real-time smart infrastructure data in the city. The data has been used in many university based research projects, by the city to support local schemes such as pedestrianization and to understand the drivers and impact of congestion charges and the impact of COVID19 lockdowns (James et al., 2020), by citizens to understand and collect their own data (Puussaar et al., 2018) and to understand the impact of air quality on school children (Keast et al., 2022).
Related Work
There are many challenges in developing systems in the wild that are common across many disciplines. For example, in healthcare there are issues with data privacy, the regulatory environment, data integration and data access (Coulby et al., 2021). In precision agriculture, there are challenges for data integration, high up-front capital investment costs, and problems with measuring the return on investment (ROI; Sengupta et al., 2021). Communication issues from IoT devices are widespread causing dropouts and data loss (Brun-Laguna et al., 2018). This research encountered similar issues in the context of cities and infrastructure, but the benefits of attempting to develop systems outside the lab, at scale, enable emergent properties of a technology ecosystem to be discovered in collaboration with the people with whom it is envisioned to be used (Hay et al., 2018). What is different about working in the city context across multiple urban indicators and infrastructure sectors is that the potential user-base is potentially very broad with different requirements and data and analysis needs.
The following sections broadly categorize the issues and challenges into five sections, although it should be acknowledged that this is largely categorized for presentational purposes as these challenges are themselves interwoven and connected. The first section focuses on the organizations with whom collaboration was both necessary and desirable to develop city wide monitoring and observation capability. The second section assesses the governance and privacy issues. Section three outlines the challenges of acquiring data and quality control mechanisms. Section four exposes the challenges faced in maintaining large-scale sensor networks. Section five addresses the issue of large-scale data analytics and the skills gap.
Section 1: Organizational Issues
The Newcastle UO has been largely funded through equipment and research grants from the UK Research and Innovation funding councils, the main vehicle for university research funding in the UK. It has been hosted on University servers based in the UK and has adopted an open by default model of data access since its inception. However, it is only viable due to the collaboration of the five local councils who are responsible for the day-to-day governance and management of the city-region and services. This close cooperation has developed over time from simple data sharing to a much richer vein of collaboration as the potential roles and benefits of collaboration have become clearer. The most pressing is access to infrastructure such as street furniture to deploy sensors which in Newcastle is further complicated due to third party management agreement between the city and an energy provider to maintain the street lighting network that was contracted before a widespread awareness of the smart city agenda. The UO supported the city to provide data around strategic city initiatives such as redevelopment and charging clean air zones (CAZ), further fostering trust and collaboration. A key area of collaboration has been the ability of the UO to extend the lifespan of local authority purchased IoT sensing by adopting the equipment and including it with its own ongoing maintenance programme when otherwise the equipment would have been mothballed due lack of ongoing operational expenditure. Like many local authorities, Newcastle city council has faced large scale cuts to funding. It is estimated that local government funding in the UK has been cut by over £15 billion over the last decade (LGA, n.d.). This has resulted in a substantial reduction in support and ancillary staff with the requisite skills to collect, manage, and interpret the data from smart infrastructure, a void that that university researchers and software engineers could help fill. Over time, de-facto partnerships have developed into de-jure partnerships such as the recent, joint deployment of a LoraWAN IoT sensing network in Newcastle (Connexin, 2020). One of the perceived benefits of this partnership is that the University is largely seen as a trusted, independent advocate by citizens, bolstered by our policy of open data publication of sensor observations. Governance and security of smart city data is, of course, critical to ensuring trust. This wider debate covers technical, social and policy based discourse (Braun et al., 2018; Ruhlandt, 2018; Cao et al., 2020; Habib et al., 2020) and necessary to avoid perception of the “panoptic” city (Kitchin, 2014).
Of course, cities are made up of more than just the local authority or city councils and data sharing partnerships have been developed with commercial operators and other public bodies such as the North East Combined Authority (NECA) Urban Traffic Management Center (UTMC) that provides ANPR based vehicle counts and other metrics and all local bus operators provide real-time vehicle location updates from their fleets, as required by the Bus Services Act 2017. It is worth noting that as the visibility of the Urban Observatory grew within the region, data providers and others became aware of multiple benefits in data sharing which includes access to analysts and scientists in the University and positive reputational benefits through being seen to be involved with a large-scale smart city initiative.
Section 2: Governance and Privacy
For many, smart cities are just an arm of the surveillance culture (Galdon-Clavell, 2013) that permeates our lives and as such there have been notable push backs on some projects e.g., Sidewalk labs (Goodman and Powles, 2019). Although a full debate about ethics and privacy is beyond the scope of this paper (see Bianchini and Ávila, 2014; Kitchin, 2016) it is perhaps useful to note that in practice, governance issues have been less fraught than we first imagined. In some places, a citizens' charter (Charlie Catlett, 2016; A Charter for the Smart City, 2021) has been created that explicitly recognizes the rights of the citizen. Although the UO in some cases processes personal data, and therefore prepared Data Privacy Impact Assessments (DPIAs; Information Commissioner's Office, 2021) as required by GDPR, we established an open and transparent system that specifically avoids retaining personally identifiable information after processing. Data is published openly, freely and in real-time. Where necessary aggregation is used (such as in pedestrian counts) to remove any possibility of identification or re-identification. Hosting data at the University also creates space between state and local government and the data being recorded. For example, the UO deploys a network of CCTV cameras in the city center with the express purpose of counting pedestrian flows. This is done through Artificial Intelligence (AI) where computer vision-based machine learning algorithms process the images without human intervention. Counts and flows are then aggregated before being posted to the UO data systems. CCTV video once processed is deleted. Whilst there are obvious sensibilities to CCTV and surveillance and the same cameras could be repurposed for tracking or, in some cases, facial recognition, the arguments put forward collectively is that is important to measure things that have been previously difficult to measure (such as how people move about the city). Traffic counting has been carried out for many years but understanding how people and pedestrians use the city is perhaps more important in the age of decarbonisation. Interestingly, although people worry about creeping surveillance from CCTV they seem oblivious to the many ANPR cameras that track their vehicular movements around the city. In Newcastle the UO receives aggregated counts of vehicles from the ANPR system that is managed independently by the NECA UTMC (UTMC, 2021). People are concerned about privacy, but our experience has shown that openness, a perception of independence, and reasonable justifications have proved this to be less of an issue than first envisaged. One suspects this might be different if Amazon, Google or one of the other data companies was beneficiary of these sorts of measurements. If the purpose for data collection and the beneficiaries of this data collection are clear and transparent then there seems to be a way forward here to balance the need to understand our cities at the human scale by e.g., understanding the impact on people movement due to pedestrianization and managing the security and the privacy of the individual.
Section 3: Data Collection and Quality
There is perhaps an unwritten assumption that the actual collection of data from smart systems is relatively straightforward and that the data it collects is relatively good and simple to interpret. Our experience is that data collection is fraught with both technical and logistical issues impacting the usability and trust in urban data. For instance, most commercial off the shelf sensor manufacturers (COTS) provide a cloud storage and download system or Application Programme Interface (API) for machine to machine (m2m) data retrieval. But these are not static entities and maintaining a separate code base of connection libraries, scripts and triggers to interrogate multiple APIs is time-consuming and costly to develop. The APIs provided by sensor manufacturers are often managed by small teams or individuals and are often bespoke whilst generally following REST principles (Fielding, 2000). Changes can be introduced by the manufacturer triggering code changes by consumers, like the UO, who consume the data. The relative immaturity of the market means that changes are more frequent than would be desired and often missing data is the first sign that an update has occurred. The prevalence of cloud-based, sensor specific storage is not an accident; three separate threads are driving this (1) it enables sensor manufacturer to adjust raw data readings before passing it on to consumers for recalibration or quality control purposes, (2) it provides the opportunity to provide detailed analytics (or aggregation) as a (paid for) service or for internal product development, and (3) the raw data is considered commercially sensitive. One of the benefits of the cooperative nature of the Newcastle UO approach has been the adoption of open data requirements for access to real-time data for anyone providing smart city systems to the city through local government tendering. Whilst this is written into procurement contracts, realization in all cases has proved more problematic with an unwillingness to legally pursue data on the part of the council where it fails to materialize, relying more on the goodwill of the system provider. As cities acquire more and more “smart” systems, the ability to access and overlay this data is a critical requirement to understand, assess and improve urban lives (Lau et al., 2019). This fragmentation and isolation into siloed systems is a major barrier to a holistic view of cities and understanding complexity.
Although environmental sensing has been prevalent for many years, this has largely focused on scientific instrumentation and only in recent years has communication and electronics developed to the point where sensing can be deployed anywhere due to the reduction in size and development of new low power sensors and systems. Whilst scientific grade equipment may have a large body of compliance and performance testing, this is not often the case for IoT equipment. For example, MCERTS certification for air quality monitoring (Environment Agency, 2014) provides different standard levels for scientific instrumentation and IoT equipment where IoT sensors are classified as indicative sensors that are required to be within 50% of reference measurements. Air quality professionals question the performance and reliability of many IoT sensors but many systems are deployed without certification and may well be used to drive decisions on new or changed infrastructure in the future. The opportunity here is to understand the uncertainty and to use the denser nature of the measurements as a means of balancing this out to achieve usable accuracy. It may be that the volume of data from these types of devices may lead to new and improved statistical or Artificial Intelligence models that will also work to process out erroneous measures, spikes, and drift in measurements without the need for constant and repeated calibration exercises.
The Newcastle UO supports many different COTS sensors and integrates data from 3rd party sensors where that data is accessible in the public domain or through agreement with 3rd party data providers. Typically, the system ingests 10,000 observations every minute covering 65+ variables. One of the goals of this system is to better understand the complex systems and interactions in the city and to develop new models that are parameterised and validated by these new data. Whilst abrupt and significant disturbance such as flooding or road closures are easy to spot in the data, subtler, slow change requires longer baselines of data to tease out trends against background variation. To do this we need to maintain usable metadata records that links the observations to the equipment used to observe it and the location of that observation. Similarly, this metadata should be easily traversable by the data consumer so they can use appropriate analytical methods or data for their particular questions. For instance, Nitrogen Oxide (NO) is measured by three different instrument types in the Newcastle UO, two of which could be classed as IoT sensors and the others as scientific grade MCERT certified instruments using electro-chemical and Chemiluminescence methods respectively. These instruments have different performance characteristics, accuracy, and measuring frequencies and therefore should be analyzed in different ways (e.g., through ensemble methods in the case of IoT instruments) but are often treated as perfect measures of objective truth especially when used by non-specialists. For example, a local lobby group that supports active travel (Space for Gosforth, 2020) reported that in one locale NO2 had risen dramatically when in fact the sensor had developed a fault and was reporting excessive values—a second sensor on the same junction was reporting more realistic values. Similarly, a sensor was flagged as showing high values when it had been moved from its normal location in a relatively quiet street to be co-located with a precision station for calibration purposes on a much busier street. Using a single measure from an IoT sensor is prone to these types of quality and misreporting issues, eroding trust in the data.
Whilst there are any number of IoT metadata standards available (Milenkovic, 2020) none are widely adopted and none are mandated resulting in undocumented values whose provenance is hard to trace. This is doubly so for data provided by third-party systems outside of one's immediate control. The UOs initial concept for metadata was to link Sensor IDs to manufacturer's specifications and to store critical metadata alongside the observations themselves using extensible sets of Key-Value pairs (later superseded by JSON types). For example, an observation on temperature would also record the sensor ID, measurement units, observation and database timestamps, flags for obvious erroneous values etc. Later this was expanded to include the latitude and longitude as fixed sensors were relocated either permanently or temporarily. Maintaining the link between sensor IDs and manufacturer specifications quickly became unwieldly as systems were upgraded or firmware replaced and detailed performance specifications are not always published at the same frequency as firmware upgrades etc. As we move from simply measuring to a more analytical role and ultimately to decisions that are driven by new forms of data then it is critical that usable metadata standards are developed and mandated preferably whilst remaining lightweight and easy to implement and update One such approach is that of the Open and Agile Smart Cities (OASC) which defines Minimum Interoperability Mechanisms (MIMs; OASC, 2019) and the adoption of measurement specific data models such as (Smartdatamodels.org, 2022). As smart city systems mature automated analytical tools, cross-referencing etc. should be developed to support the widespread uptake and investment in data and reducing the risk of inappropriate data cherry-picking or analytical processes e.g., with wider use of data driven automated model outputs rather than the use of raw observed data.
Section 4: Maintenance and Durability
Smart city systems are often sold as low-maintenance, largely unattended systems with low per unit capital costs. Our experience is that whilst this may be true for small deloyments once a certain threshold of the number of units is reached and their life-span extends beyond 6–12 months, the maintenance of the network becomes a substantial burden. Maintenance may include in-situ or back to base firmware upgrades, redeployment or location change, troubleshooting communication issues, replacing faulty sensors or batteries, removing decommissioned or vandalized sensors as well as the normal deployment of new devices and replacement of consumable sensor pod. Calibration of air quality sensors using traveling reference nodes or co-deployments has proven to be a particular operating burden as the electrochemical sensors can be upgraded as often as twice a year forcing re-calibration and checking. One way to reduce the maintenance burden is to maintain the equipment as part of other ongoing essential operational maintenance or to co-opt sensors used for operational purposes and hence maintained into a wider network of systems monitoring. In Newcastle we utilize feeds from ANPR cameras (maintained by the NECA for operational purposes) and real-time GPS bus data (maintained for operational purposes by the bus operators) and share responsibility for maintenance of air quality monitoring stations with a number of Local Authorities. Whilst this reduces the capital and operating costs it exacerbates the data provenance issue and some factors, though critical to a holistic understanding of city performance, such as pedestrian flows may not be measured as part of other operational requirements.
Ongoing maintenance costs aside, ensuring the durability of systems remains a challenge as there are many potential beneficiaries of better data in cities including the citizens themselves e.g., through better services, but the benefits are spread thinly across many parts and organizations. For example, there is a direct link between citizen health and air quality and improving air quality will have a long-term benefit which should result in a reduction on health spending (United Nations Environment Programme, 2017). Despite this, health providers are unlikely to invest in monitoring equipment to understand the current or future values of pollutants, thus the burden of investment and durability falls on hard-pressed local government budgets or other institutions.
Section 5: Analytics and Usability
When asked everyone wants better data, but in reality few are equipped to analyse complex data and even fewer are able to handle the volume of data that smart city systems such as the UO generate daily. In short, few people want data, what they really want is analysis and insight. Analysis and insight currently falls to the “data scientist” who can wrangle the data into usable forms, apply a variety of analytical techniques and develop clear infographics and visualizations of the outputs. At present, these activities are manual, time consuming, and expensive. It is clear that to make use of this new paradigm of big city data we need better automated tools to deliver insight without (much) human intervention. The first stage of this is already apparent with data visualization tools which goes some way to turning data into information. Open standards for data access, machine learning and artificial intelligence and low-code/no-code visualization tools such as Tableau, PowerBI, (BI, 2021; Tableau, 2021) etc. provide the tools to deliver insight from data, we are just not there yet.
Smart city measurements and observations are also entrenched in the concepts of measuring widgets. Devices are deployed that measure a certain variable at a place and time at a given frequency. However, widget-based measurements aren't very useful because most people want to understand how a system (or part thereof) is performing. A traffic manager does not want to know the GPS location of a bus, but rather wants to understand if that particular set of traffic controls is having a positive effect on journey time and needs to be confident unrelated factors such as a traffic accident haven't compromised the analysis. Future analytics need to focus on systems and enable us to interrogate how these social, infrastructural, and environmental systems interweave and interact to capture intended and unintended consequences. And systems need to be definable on the fly as sometimes a “system” might be a single sector or a geographical area such as a redevelopment site. Moving away from thinking about measuring widgets to analyzing systems is the next step in smart city evolution.
The following sections provide examples of how smart city data can be used to support decision making in cities. Both of these studies are ongoing—which reflects one of the other properties of cities that managed change and infrastructure development often spans years rather than months requiring a long-term view of city monitoring and sensing. These brief case studies are intended to highlight some of the potential benefits that have been co-developed with stakeholders despite the challenges described above
Case Study 1: City Center Pedestrianization
Pedestrianization and the removal of traffic from the center of cities to create low carbon cities and improve air quality and liveability have been shown to have positive impacts on public health and well-being and improved the economic wellbeing of places (Gouldson et al., 2018). Blackett Street in the center of Newcastle is a major east-west link road closed to public vehicular traffic but heavily used by buses and taxis (Figure 1). It separates two other pedestrian zones along the main shopping thoroughfares of Northumberland Street and the area around the Monument and bisects the Eldon Square Shopping mall. It is the closest stopping points for a large number of bus routes to the city center, with passengers alighting in the heart of the city. It has been a long-held ambition of Newcastle City Council to pedestrianize Blackett Street routing buses and taxis via alternative routes both to improve road safety and to improve the environment (Newcastle City Council, 2019).
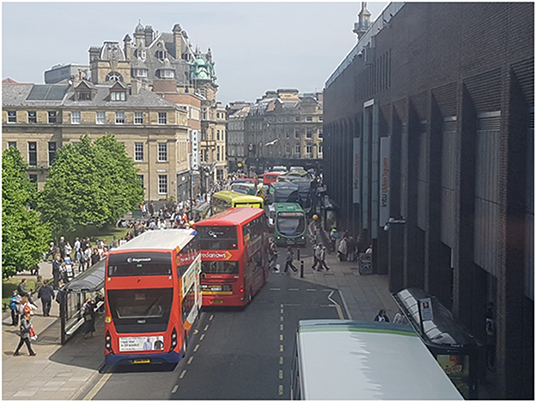
Figure 1. Blackett Street forms the main east-west crossing for bus and taxi traffic and cuts through the heart of the shopping district. It is connected to three other largely pedestrianized areas.
The development forms part of a larger plan to reimagine the city center but has come under intense opposition from a number of bus companies and retailers anxious about the impact on their business and access for the physically impaired or infirm (Holland, 2020). Since 2017 the Newcastle Urban Observatory in partnership with the City Council has been monitoring the area and its environs. This takes the form of air pollution monitoring across a number of sites (NO2, PM2.5, PM10), pedestrian footfall, bus journey times and traffic counts (Figure 2).
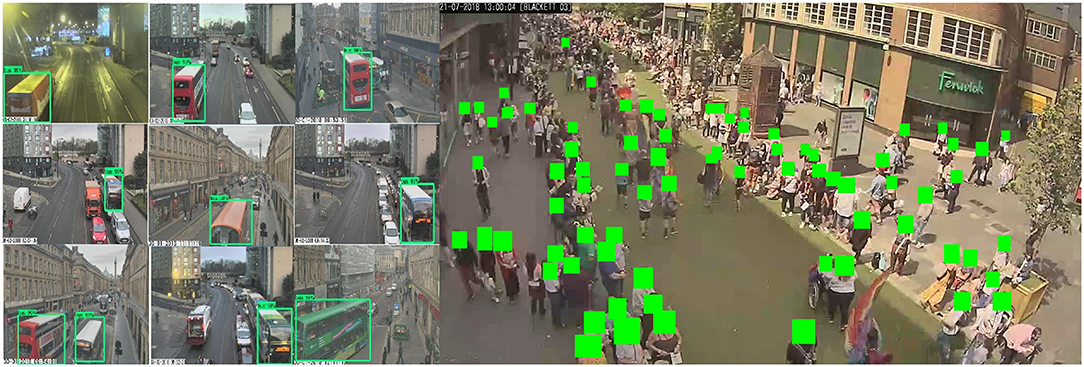
Figure 2. Examples of bus counting and pedestrian flow monitoring using CCTV and machine learning from Urban Observatory sensors.
To understand the impact of pedestrianization the road has been closed for events such as Christmas markets, European Rugby Cup finals and other sporting events and for a number of weekends during the Great Exhibition of the North that took place between June and September in 2018 (Figure 3). These city experiments demonstrated the concept of using the city as a living laboratory, closely observing the impacts of the road closures on city metrics such as air pollution, bus journey times and pedestrian flows.
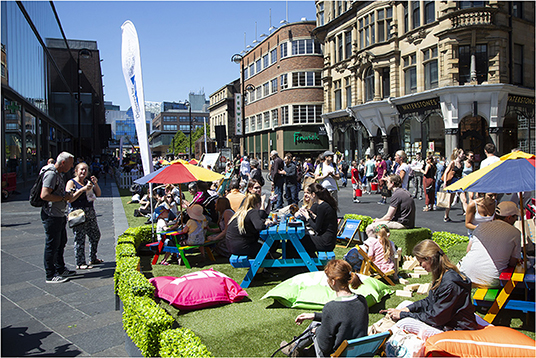
Figure 3. Blackett Street with pop-up seating areas as part of the Great Exhibition of the North celebrations June ~ September 2018.
Through analysis of the data the impacts on measured city metrics were largely uncontroversial. There was a small reduction in pollutants along Blackett Street during the road closures although some of this was displaced to adjoining roads where the bus traffic was re-routed. There was a small increase in bus journey times which were on average less than a minute. Not surprisingly, removing traffic increased pedestrian numbers in the area although it should be noted that these experiments either provided additional attractions (pop-up parks etc.) or were carried out at times of increased visitor numbers. Anecdotal and pictorial evidence would suggest that people stayed longer rather than just using the area to transit from one part of the city to the other. However, the benefits of the experiments were not in the nature of the results themselves that were in line with expectations but that these impacts could be quantified precisely. The difference here is summed up by the statements “Your bus journey will be slower” and “Your bus journey will be slower by 25 s.” The first statement would cause some distress to passengers and operators alike, the second is a little inconvenient but as a passenger you would be unlikely to be that concerned. This quantification emboldens decision makers to balance the pros and cons of interventions and provides an evidence base to counteract concerns and a vocal minority. Analysis of bus data also identified specific intersections that related to the increased journey time, which allowed improvements to be made to traffic signal timings to reduce the delay. The UO continues to provide data as part of the ongoing pedestrianization and redevelopment plans of the city center of Newcastle and also will play a critical part in the ongoing evaluation of the impacts of pedestrianization schemes over the long term.
Case Study 2 COVID-19 Response and Recovery
The role of data during the COVID-19 pandemic has been critical to local, national and international responses. Data has been used to track deaths and outbreaks through online portals (John Hopkins University, 2020) and many different types of data have been used to understand the immediate impact of public health policies and lockdowns related to the virus including mobile phone data (Vinceti et al., 2020), financial data (Caceres-Silva, 2000), social media (Klein et al., 2021), and wastewater (Larsen and Wigginton, 2020) to name but a few examples. What is common across many of these proposed approaches and operational track and trace systems deployed by governments is the need for immediacy of data when faced with a fast-changing environment. Understanding the impacts of local and national lockdowns and the ability for agile decision and policy making requires data and analytics that are also available quickly. The COVID-19 pandemic has clearly demonstrated that managing perishable insight i.e., data and insight that has value in the immediate near future but loses some, or all, of that value over time (notwithstanding any long-term value of historic data) is critical in the management of crises and may have other roles in city management and understanding in the future.
In the UK, the first national lockdown was announced on the 23rd March, 2020 (Institute for Government, 2021). In response to requests from the local authority and public health officials many of the sensor streams were repurposed to create a live activity dashboard across a number of city metrics within a few days of the lockdown. A website based on Jupyter notebooks was created that interacted directly with the existing APIs of the Urban Observatory platform to show, in real-time, data and comparative statistics across pedestrian movement sensors, traffic sensors, car park data, air quality, and noise (James et al., 2020). This enabled city officials to “see” the response locally to national policy and local advertising campaigns and provided a real-time view of activity levels across the region (Figure 4).
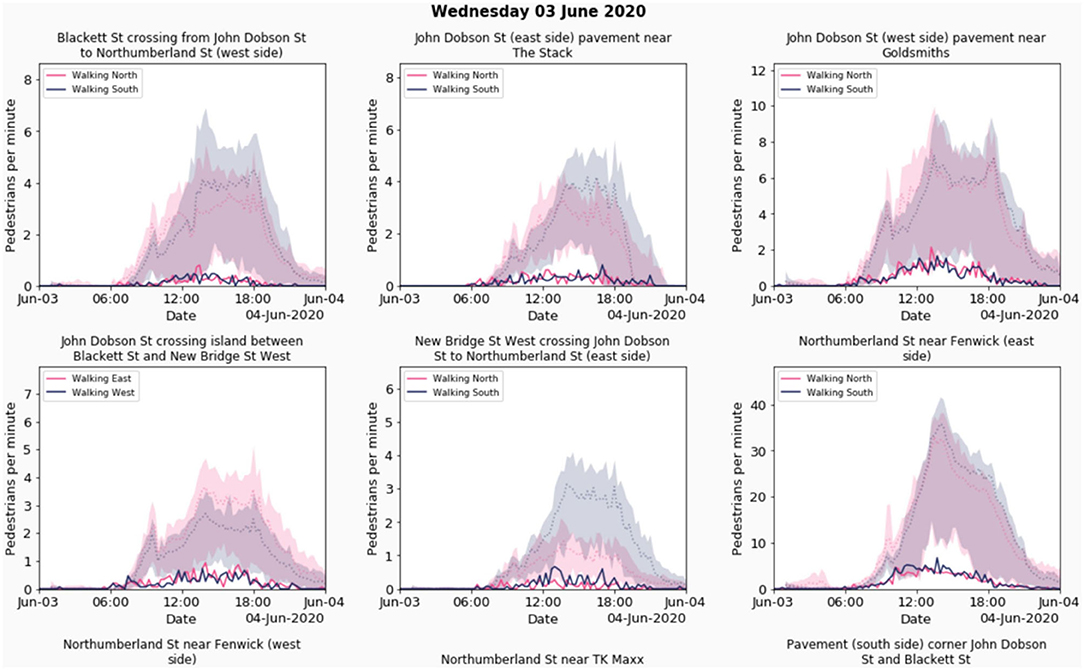
Figure 4. Pedestrian metrics compared to baseline data (pre-Covid baseline) generated automatically in real-time from the COVID-19 activity dashboard (http://covid-view.urbanobservatory.ac.uk).
In the UK, what has followed the initial lockdown has been a series of regional tiers allowing different levels of activity and mixing and, in November 2020, a second national lockdown. Figure 5 shows data from traffic sensors over this period generated through live data on the COVID-19 activity dashboard showing how activity slowly increased from the initial lockdown and subsequently after the 2nd lockdown. The data has been used by the UK's Department of Transport as it uniquely encompasses data from urban centers and suburbs not just major trunk roads. During the period of tiered lockdowns, having a regional view of activity was critical to understanding the efficacy of local restrictions. The format of the displays were created to mimic the UK government's official outputs and utilized the same methodology for creating baselines.
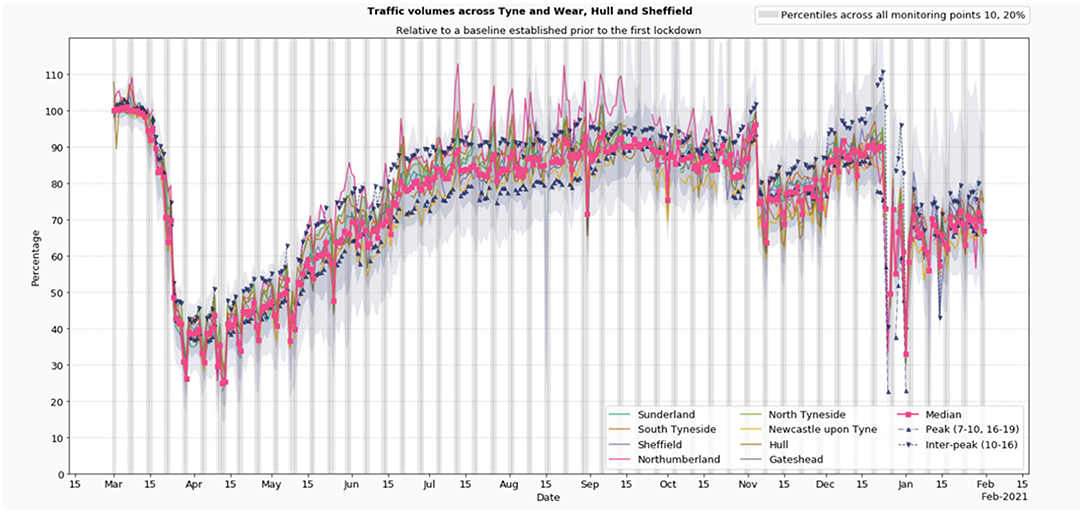
Figure 5. Aggregated data from traffic sensors, generated automatically from Urban Observatory APIs as part of the COVID-19 activity dashboard (http://covid.view.urbanobservatory.ac.uk).
As cities moved and move toward a recovery phase smart city data has a continued to play a role in understanding activity levels. The Newcastle UO uses CCTV static images and CCTV video and machine learning (ML) to count pedestrians in and around the city. These methods can be widely applied to any CCTV system providing near real-time data on activity within our urban centers (Chen et al., 2021). In addition to providing statistics and graphs to city officials data from the Urban Observatory has been repurposed to provide real-time data to provide information to citizens who are traveling into the city to understand the busyness of the city center and provide a single point of information on COVID-19 related restrictions and travel advice for those planning to visit the city center (https://howbusyistoon.com/) (Figure 6).
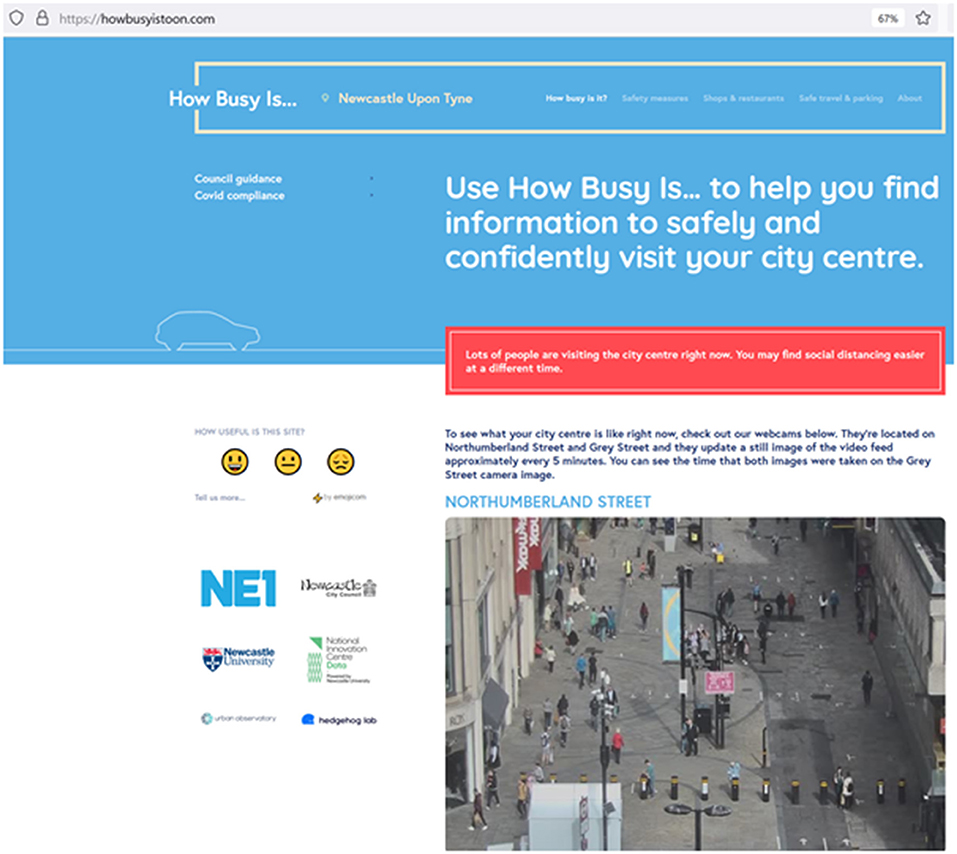
Figure 6. Howbusyistoon website aimed at citizens to understand current levels of busyness in the city center and other information (accessed August 31, 2021).
Smart city data such as that provided by the Urban Observatory was able to provide real insight and reassurance to city and national officials on the efficacy of policy measures and messaging during the pandemic. This was only possible as the infrastructure was already in place and running and notwithstanding occasional maintenance issues, IoT measuring devices largely work autonomously once in-situ. Whilst we make no claims that this type of data was critical to the handling of the pandemic it demonstrated that well managed city data and sensor systems that report data in real-time have a role to play in crisis management and the autonomous, long-term nature of this type of data collection enables a deeper understanding of recovery and response.
Discussion and Conclusion
Our experience supports the view that smart city deployments are complex socio-technical problems (Razaghi and Finger, 2018). The maturity of the technology itself is still at a low level and wireless communications are far from 100% reliable. Coupled with complex ownership, wayleaves, legal restrictions and rights and responsibilities in cities there are many barriers to simply deploying the right equipment to gather the right sort of metrics, indeed understanding what metrics can be captured, at what scale and with what accuracy is still an ongoing active area of research (Li et al., 2020) and despite the claims of both cities and manufacturers, smart cities are not a done deal that just need financial backing, they are, or should be, an active area of research both in the methods and technology. There is little clear understanding of what lower cost IoT sensors are truly useful for if their absolute accuracy is hard to pin down. Without associated analytical methods becoming commonplace there is a danger that the data is dismissed as worthless due to low levels of trust or conversely is used without proper regard for its veracity. Dense sensor networks provide an opportunity for new types of analysis enabled through the high temporal and spatial resolution and hence new insight, but users and advocates should not overstate their abilities especially in replacing longstanding scientific instrumentation used for statutory purposes.
The balance of ensuring privacy whilst capturing data that truly reflects how people use the city is still an open question as is the governance, ownership and curation of this data. It is important for citizens to trust the data that is being collected in their name especially as we move toward data driven decision making and automated systems for operations and planning/evaluation. Some form of citizen charter around the collection of data, especially where it has the potential for misuse, would be beneficial to set the limits of data collection and generate trust. We want to avoid a binary position of anything goes or nothing allowed when it comes to understand something like movement in a city. Depersonalization, aggregation and privacy preserving technology are all possible and would still provide planners and operators with valuable and otherwise unavailable data, however, the same infrastructure could be used for facial recognition, tracking, and other activities.
The lack of both standards for equipment performance and data sharing coupled with the siloing of data by sectors and manufacturers also raises concern for future data sharing adding further layers of complexity to unlocking the potential of multi-sector big data from IoT and city systems. A similar issue is apparent in addressing the skills gap in those that might make use of this data as big data provides its own challenges in data wrangling and analysis and new tools and techniques need to be applied and mastered.
Despite these issues and with respect to our hypothesis, the Newcastle Urban Observatory has demonstrated that it is possible to develop, deploy and utilize large scale, off the shelf, urban sensor systems within this pluralistic environment and that an integrated approach to the data collection and curation has the potential to support city planning, management and social awareness and develop new methods of appraisal for future infrastructure or policy interventions and that this can be done without undue technological lock-in. The data collected by the project has been instrumental in informing and validating policy decisions, as hypothesized, but also non-policy interventions such as tuning of algorithms for traffic signals and nudge-based approaches to alleviating dense crowds during COVID-19.
An open and privacy-preserving approach has helped alleviate concerns locally about the purposes of data collection and the limits of what is being collected and used. COVID-19 has demonstrated a need for agile decision making, strengthening the case for real-time data and its associated analytics within the decision-making process. The long-term viability of these systems in the public realm depends on the value proposition that can be made to maintain sensors, repurpose existing operational systems and curate long term storage and access systems. Data may be the “new oil” but information extraction does not come cheap. In developing the value proposition there are a number of areas that could support the creation and upkeep of large sensor networks (i) to parameterise and validate new models and digital twins of city systems or system of systems (ii) to provide the data for new forms of analytics including stochastic and AI algorithms (iii) to provide additional evidence for planning and infrastructure (iv) to provide additional and ongoing analysis of the impact of interventions across different scales and sectors capturing unintended consequences (v) automated reporting and regulatory services (vi) capturing subtle and slow changes in city systems through data mining (vii) enabling digital playback of city systems to understand what happens when things go wrong and (viii) enabling agile, data-centric decision making through the ready availability of real-time data. However, to realize these goals the complex systems of systems and interleaving strands of ownership, governance, privacy, responsibility, value, technology, skills, and trust must be coordinated in an unprecedented way.
Data Availability Statement
Publicly available datasets were analyzed in this study. This data can be found at: http://newcastle.urbanobservatory.ac.uk.
Author Contributions
The article was written by PJ with inputs from all authors including ideas and textual corrections. LS, NH, and DB developed the computer based systems behind the UO including the visualisation platforms, APIs and websites. JJ developed the physical systems and processes that underpins the UO including co-creation with stakeholders, the integration of the UO with external parties and she manages the larger UO project and partnerships. TK developed the AI and ML based CCTV platforms and associated APIs and systems. RR provided technical expertise in IoT systems and data integration. All authors contributed to the article and approved the submitted version.
Funding
This work has been funded by UK Research and Innovation, grant numbers EP/P016782/1, EP/R013411/1, EP/M023001/1, and NE/P017134/1.
Conflict of Interest
The authors declare that the research was conducted in the absence of any commercial or financial relationships that could be construed as a potential conflict of interest.
Publisher's Note
All claims expressed in this article are solely those of the authors and do not necessarily represent those of their affiliated organizations, or those of the publisher, the editors and the reviewers. Any product that may be evaluated in this article, or claim that may be made by its manufacturer, is not guaranteed or endorsed by the publisher.
Acknowledgments
The authors would like to thank the many contributors and partners, both public and private who support the Urban Observatory Programme through collaboration, partnership, and data provision.
Footnotes
1. ^https://www.smartsantander.eu/, https://www.smartsantander.eu/, https://amsterdamsmartcity.com/, https://www.sidewalktoronto.ca/
References
A Charter for the Smart City (2021). Wetenschappelijk Bureau GroenLinks. Available online at: https://www.wetenschappelijkbureaugroenlinks.nl/a-charter-for-the-smart-city (accessed July 7, 2021).
Atzori, L., Iera, A., and Morabito, G. (2010). The internet of things: a survey. Comput. Netw. 54, 2787–2805. doi: 10.1016/j.comnet.2010.05.010
BI, M. P. (2021). Data Visualization. Microsoft Power BI. Available online at: https://powerbi.microsoft.com/en-us/?&ef_id=Cj0KCQjwpreJBhDvARIsAF1_BU0Omxz-paetvItpBXkheTBi3Oc5LLEE5Rdn4NLe1zP4UlHf0ZC14swaAt1MEALw_wcB:G:s&OCID=AID2200056_SEM_Cj0KCQjwpreJBhDvARIsAF1_BU0Omxz-paetvItpBXkheTBi3Oc5LLEE5Rdn4NLe1zP4UlHf0ZC14swaAt1MEALw_wcB:G (accessed August 31, 2021).
Bianchini, D., and Ávila, I. (2014). Smart cities and their smart decisions: ethical considerations. IEEE Technol. Soc. Magazine. 33, 34–40. doi: 10.1109/MTS.2014.2301854
Braun, T., Fung, B. C. M., Iqbal, F., and Shah, B. (2018). Security and privacy challenges in smart cities. Sustain. Cit. Soc. 39, 499–507. doi: 10.1016/j.scs.2018.02.039
Brun-Laguna, K., Minet, P., Watteyne, T., and Henrique Gomes, P. (2018). Moving beyond testbeds? lessons (we) learned about connectivity. IEEE Pervasive Comput. 17, 15–27. doi: 10.1109/MPRV.2018.2873847
Caceres-Silva, L. (2000). National Communication Republic of Ecuador. United Nations Framework Convention on Climate Change. National Climate Committee. Available online at: http://www.unfcc.int/resource/docs/natc/ecun1.pdf (accessed August 2021).
Cao, Q. H., Giyyarpuram, M., Farahbakhsh, R., and Crespi, N. (2020). Policy-based usage control for a trustworthy data sharing platform in smart cities. Future Gener. Comput. Syst. 107, 998–1010. doi: 10.1016/j.future.2017.05.039
Carayannis, E. G., and Campbell, D. F. J. (2009). “Mode 3” and “Quadruple Helix”: toward a 21st century fractal innovation ecosystem. Int. J. Technol. Manag. 46, 201–234. doi: 10.1504/IJTM.2009.023374
Chamoso, P., González-Briones, A., Rodríguez, S., and Corchado, J. M. (2018). Tendencies of technologies and platforms in smart cities: a state-of-the-art review. Wireless Commun. Mobile Comput. 2018:3086854. doi: 10.1155/2018/3086854
Charlie Catlett (2016). Array of Things Governance Policy and Process. Available online at: https://arrayofthings.github.io/final-policies.html (accessed April 26, 2017).
Chen, L., Grimstead, I., Bell, D., Karanka, J., Dimond, L., James, P., et al. (2021). Estimating vehicle and pedestrian activity from town and city traffic cameras. Sensors 21:4564. doi: 10.3390/s21134564
Cocchia, A. (2014). “Smart and digital city: a systematic literature review,” in Smart City. Progress in IS, eds, R. Dameri and C. Rosenthal-Sabroux (Springer), 13–43. doi: 10.1007/978-3-319-06160-3_2
Connexin (2020). Connexin awarded Newcastle city-wide LoRaWAN network tender to support Newcastle's Digital City ambitions. Available online at: https://www.connexin.co.uk/newsroom/connexin-awarded-newcastle-city-wide-lorawan-network-tender/Connexin (accessed July 7, 2021).
Coulby, G., Clear, A. K., Jones, O., and Godfrey, A. (2021). “IoT in the Wild: an expedition of discovery for remote monitoring. UbiComp/ISWC 2021,” in Adjunct Proceedings of the 2021 ACM International Joint Conference on Pervasive and Ubiquitous Computing and Proceedings of the 2021 ACM International Symposium on Wearable Computers, 519–522. doi: 10.1145/3460418.3479364
Dubai (2022). Dubai Data. Available online at: https://www.digitaldubai.ae/data (accessed March 3, 2022).
Environment Agency (2014). MCERTS: Performance Standard for Indicative Ambient Particulate Monitors - GOV.UK. Available online at: https://www.gov.uk/government/publications/mcerts-performance-standard-for-indicative-ambient-particulate-monitors (accessed August 2021).
Fielding, R. (2000). Architectural Styles and the Design of Network-based Software Architectures (University of California). Available online at: https://www.ics.uci.edu/~fielding/pubs/dissertation/fielding_dissertation.pdf (accessed August 2021).
Frick, S. A., and Rodríguez-Pose, A. (2018). Big or small cities? On city size and economic growth. Growth Change 49, 4–32. doi: 10.1111/grow.12232
Galdon-Clavell, G. (2013). (Not so) smart cities? the drivers, impact and risks of surveillance-enabled smart environments. Sci. Public Policy 40, 717–723. doi: 10.1093/scipol/sct070
Goodman, E. P., and Powles, J. (2019). sUrbanism under Google: Lessons from Sidewalk Toronto. Fordham Law Review, 88. doi: 10.2139/ssrn.3390610 Available online at: https://heinonline.org/HOL/Page?handle=hein.journals/flr88&id=473&div=19&collection=journals (accessed August 2021).
Gouldson, A., Sudmant, A., Khreis, H., and Papargyropoulou, E. (2018). The Economic and Social Benefits of Low-Carbon Cities: A Systematic Review of the Evidence. Coalition for Urban Transitions, (June), 1–92. Available online at: https://coalitionforurbantransitions.org/en/publication/the-economic-and-social-benefits-of-low-carbon-cities-a-systematic-review-of-the-evidence/ (accessed August 2021).
Habib, A., Alsmadi, D., and Prybutok, V. R. (2020). Factors that determine residents' acceptance of smart city technologies. Behav. Inform. Technol. 39, 610–623. doi: 10.1080/0144929X.2019.1693629
Hay, D., Buyuklieva, B., Daothong, J., Edmonds, B., Hudson-Smith, A., Milton, R., et al. (2018). “IoT in the wild: what negotiating public deployments can tell us about the state of the internet of things,” in IET Conference Publications, 2018(CP740). doi: 10.1049/cp.2018.0017
Holland, D. (2020). Multi-Million Pound Plan Unveiled to Change the Face of Newcastle and Ban Traffic From Shopping Area - Chronicle Live. Available online at: https://www.chroniclelive.co.uk/news/north-east-news/blackett-street-city-centre-vision-17547535 (accessed July 7, 2021).
Information Commissioner's Office (2021). What is a DPIA?. ICO. Available online at: https://ico.org.uk/for-organisations/guide-to-data-protection/guide-to-the-general-data-protection-regulation-gdpr/data-protection-impact-assessments-dpias/what-is-a-dpia/ (accessed July 7, 2021).
Institute for Government (2021). Timeline of UK Government Coronavirus Lockdowns. The Institute for Government. Available online at: https://www.instituteforgovernment.org.uk/charts/uk-government-coronavirus-lockdowns (accessed July 7, 2021).
James, P., Das, R., Jalosinska, A., and Smith, L. (2020). Smart cities and a data-driven response to COVID-19. Dialog. Hum. Geogr. 2020:204382062093421. doi: 10.1177/2043820620934211
James, P. M., Dawson, R., Harris, N., and Joncyzk, J. (2014). Urban Observatory Environment Data. Newcastle upon Tyne: Newcastle University.
John Hopkins University (2020). COVID-19 Dashboard: Global Deaths. Johns Hopkins University Coronavirus Resource Centre. Available online at: https://coronavirus.jhu.edu/map.html (accessed May 12, 2020).
Keast, L., Bramwell, L., Maji, K. J., Rankin, J., and Namdeo, A. (2022). Air Quality Outside Schools in Newcastle upon Tyne, UK: an investigation into NO 2 and PM concentrations and PM respiratory deposition. Atmosphere. 13, 1–16. doi: 10.3390/atmos13020172
Kitchin, R. (2014). The real-time city? Big data and smart urbanism. GeoJournal. 79, 1–14. doi: 10.1007/s10708-013-9516-8
Kitchin, R. (2016). The ethics of smart cities and urban science. Philos. Trans. Royal Soc. A 374:115. doi: 10.1098/rsta.2016.0115
Klein, A. Z., Magge, A., O'Connor, K., Amaro, J. I. F., Weissenbacher, D., and Hernandez, G. G. (2021). Toward using twitter for tracking COVID-19: a natural language processing pipeline and exploratory data set. J. Medical Internet. Res. 23:25314. doi: 10.2196/25314
Larsen, D. A., and Wigginton, K. R. (2020). Tracking COVID-19 with wastewater. Nat. Biotechnol. 38, 1151–1153. doi: 10.1038/s41587-020-0690-1
Lau, B. P. L., Marakkalage, S. H., Zhou, Y., Hassan, N. U., Yuen, C., Zhang, M., et al. (2019). A survey of data fusion in smart city applications. Inform. Fusion 52, 357–374. doi: 10.1016/j.inffus.2019.05.004
Li, G., Ma, R., Liu, X., Wang, Y., and Zhang, L. (2020). “RCH: Robust calibration based on historical data for low-cost air quality sensor deployments,” in UbiComp/ISWC 2020 Adjunct - Proceedings of the 2020 ACM International Joint Conference on Pervasive and Ubiquitous Computing and Proceedings of the 2020 ACM International Symposium on Wearable Computers, 650–656. doi: 10.1145/3410530.3414322
Milenkovic, M. (2020). Chapter 6: IoT data models and metadata. Internet Things 6, 201–223. doi: 10.1007/978-3-030-41346-0_6
Newcastle City Council (2019). Blackett Street. Newcastle City Council. Available online at: https://www.newcastle.gov.uk/our-city/transport-improvements/city-centre-improvements/blackett-street (accessed September 18, 2019).
Puussaar, A., Johnson, I. G., Montague, K., James, P., and Wright, P. (2018). Making open data work for civic advocacy. Proc. ACM Hum.-Comput. Interact. 2, 143–220. doi: 10.1145/3274412
Razaghi, M., and Finger, M. (2018). Smart governance for smart cities. Proc. IEEE 106, 680–689. doi: 10.1109/JPROC.2018.2807784
Ruhlandt, R. W. S. (2018). The governance of smart cities: a systematic literature review. Cities 81, 1–23. doi: 10.1016/j.cities.2018.02.014
Sengupta, A., Gill, S. S., Das, A., and De, D. (2021). “Mobile edge computing based internet of agricultural things: a systematic review and future directions,” in Mobile Edge Computing, eds A. Mukherjee, D. De, S. K. Ghosh, and R. Buyya (Cham: Springer). 415–441. doi: 10.1007/978-3-030-69893-5_17
Singapore (2018). Smart Nation Singapore. Available online at: https://www.smartnation.gov.sg/ (accessed March 3, 2022).
Smartdatamodels.org (2022). Smart Data Models – A Global Program Led By. Available online at: https://smartdatamodels.org/ (accessed March 4, 2022).
Space for Gosforth (2020). SPACE for Gosforth. Available online at: http://spaceforgosforth.com/ (accessed July 7, 2021).
Tableau (2021). We're Changing the Way You Think About Data. Available online at: https://www.tableau.com/en-gb/trial/tableau-software?utm_campaign_id=2017049&utm_campaign=Prospecting-CORE-ALL-ALL-ALL-ALL&utm_medium=Paid+Search&utm_source=Google+Search&utm_language=EN&utm_country=UKI&kw=tableau&adgroup=CTX-Brand-Core-EN-E-control&aduse (accessed August 31, 2021).
TfL (2017). Our Open Data - Transport for London. Available online at: https://tfl.gov.uk/info-for/open-data-users/our-open-data (accessed March 3, 2022).
UK Government (2020). E-Scooter Trials: Guidance for Local Areas and Rental Operators - GOV.UK. Available online at: https://www.gov.uk/government/publications/e-scooter-trials-guidance-for-local-areas-and-rental-operators/e-scooter-trials-guidance-for-local-areas-and-rental-operators (accessed July 7, 2021).
UKAuthority (2021). Belfast Council Trials app for Smart Parking. UKAuthority. Available online at: https://www.ukauthority.com/articles/belfast-council-trials-app-for-smart-parking/ (accessed July 7, 2021).
United Nations (2019). UN-HABITAT.:. Global Urban Observatory. Observatories. Available online at: http://mirror.unhabitat.org/content.asp?typeid=19&catid=646&cid=8381 (accessed September 17, 2019).
United Nations Environment Programme (2017). Towards a Pollution-Free Planet. Available online at: https://www.unep.org/resources/report/towards-pollution-free-planet-background-report (accessed August 2021).
UTMC (2021). UTMC Open Data Service. North East Urban Traffic Management and Control Open Data Service. Available online at: https://www.netraveldata.co.uk/ (accessed July 7, 2021).
Keywords: urban sensing, internet of things, smart cities, data, governance
Citation: James P, Jonczyk J, Smith L, Harris N, Komar T, Bell D and Ranjan R (2022) Realizing Smart City Infrastructure at Scale, in the Wild: A Case Study. Front. Sustain. Cities 4:767942. doi: 10.3389/frsc.2022.767942
Received: 31 August 2021; Accepted: 28 March 2022;
Published: 09 May 2022.
Edited by:
Christopher Rogers, University of Birmingham, United KingdomReviewed by:
Eduarda Marques Da Costa, University of Lisbon, PortugalNigel Davies, Lancaster University, United Kingdom
Copyright © 2022 James, Jonczyk, Smith, Harris, Komar, Bell and Ranjan. This is an open-access article distributed under the terms of the Creative Commons Attribution License (CC BY). The use, distribution or reproduction in other forums is permitted, provided the original author(s) and the copyright owner(s) are credited and that the original publication in this journal is cited, in accordance with accepted academic practice. No use, distribution or reproduction is permitted which does not comply with these terms.
*Correspondence: Philip James, cGhpbGlwLmphbWVzQG5jbC5hYy51aw==