 Elvia J. Meléndez-Ackerman1*
 Mervin E. Pérez2
 Ana B. Pou Espinal3
 Claudia Caballero3Leonardo Cortés3
 Solhanlle Bonilla-Duarte4Gerald Bauer3José M. Martínez Guridy5Wayne J. Arendt3David J. Nowak6
- 1Department of Environmental Sciences, University of Puerto Rico at Río Piedras, San Juan, Puerto Rico
- 2Departamento de Restauración del Paisaje Forestal, Instituto Nacional de Bosques, Ciudad Guatemala, Guatemala
- 3International Institute for Tropical Forestry, US Forest Service, San Juan, Puerto Rico
- 4Instituto Tecnológico de Santo Domingo, Santo Domingo, Dominican Republic
- 5Dirección General de Gestión Ambiental y De Riesgos, Ministerio de Educación, Santo Domingo, Dominican Republic
- 6United States Department of Agriculture (USDA) Forest Service, 5 Moon Library, State University of New York-Environmental Science and Forestry (SUNY-ESF), Syracuse, NY, United States
Maintaining a diverse urban forest that provides ecosystem services can promote urban sustainability and resilience to environmental change. Around the world, cities have taken to inventorying their urban trees and quantifying their ecosystem services but more so in industrialized counties than in Latin America. Here we describe the results of an i-Tree inventory that established 206 survey plots in the National Municipal District of Santo Domingo (NMDSD). We used social-ecological theory to evaluate potential factors that may influence urban forest structure, composition, and ecosystem services diversity across three wards with distinct social and urban characteristics. Rarefaction curves showed a diverse urban forest dominated by non-native trees that have ornamental and medicinal uses. Wards differed in species composition with palms being particularly dominant in Wards 1 and 2 where the proportion of low-income houses is smaller. Ward 1 supports high-income residential areas and Ward 3 is the area with higher population and housing densities and lower income residents. On average, we found no significant differences among wards in tree species richness, average dbh, leaf area, and percent tree cover per plot. Trees in Ward 2 were taller, on average, than those in Ward 1 but were comparable to those in Ward 3. Likewise, tree density per plot was highest in Ward 2, followed by Ward 1 and Ward 3. Despite these significant differences in stem densities, average values in four ecosystem services involving measures of carbon, rainfall, and contaminants (C-sequestration, C-storage, avoided runoff, and removal of air pollutants) were non-significant across wards. We found disproportionately more street trees in Ward 1 relative to Wards 2 and 3 and more trees in public spaces in Wards 1 and 2 relative to Ward 3. Evidence for the luxury effect on tree distribution in the NMDSD was subtle and manifested mostly through differences in species composition and tree distribution across public and private domains as well as the amount of planting space. Overall results point to inequalities in the potential of reforestation among NMDS wards and an overabundance of non-native species, which should guide urban forest management with ecosystem services and conservation goals.
Introduction
Maintaining a network of biodiverse urban trees that ensures the provision of critical ecosystem services for current and future generations is a key element of the sustainability discourse. This vision has been advocated in a variety of policy arenas (Millenium Ecosystem Assessment, 2005; Benedict and McMahon, 2012; United Nations, 2015; Intergovernmental Platform on Biodiversity and Ecosystem Services (IPBES), 2019). Globally, urban trees are increasingly integrated into urban planning [e.g., European Environment Agency (EEA), 2014; Young et al., 2014; City of Melbourne, 2017] as a way to mitigate urban phenomena, adapt to environmental uncertainties and increase urban resilience.
Cities are warmer than their surrounding environment, a phenomenon described as the urban heat island effect (Oke, 1997; Nuruzzaman, 2015) that increases energy and water use (Harlan et al., 2006; Jenerette et al., 2011) as well as ozone production at ground level (Akbari, 2001) creating added vulnerabilities. Also, urban land use, with its high impervious cover, makes cities prone to flooding following extreme weather events (National Academies of Sciences, 2019). The are many ways in which urban trees can make cities more livable. The presence of urban trees can help mitigate the urban heat island effect and other adverse phenomena, thus leading to reduced city temperatures and reduced energy consumption (Nowak and Dwyer, 2007), filtration of urban air pollutants lowering health risks from respiratory illnesses (Escobedo et al., 2011; Nowak and Greenfield, 2018) and reduced urban runoff from precipitation lowering the probability of flooding events (Farrugia et al., 2013). Indeed, many cities around the world have begun quantifying tree benefits (i.e., ecosystem services) to increase their adaptive capacity and resilience (McPhearson, 2014). Yet, these ecosystem service approaches have been less studied in Latin American cities, relative to cities located in Europe and North America (Vihervaara et al., 2010; McPhearson et al., 2016; Dobbs et al., 2019; Ordoñez-Barona et al., 2020).
Despite its benefits, urban tree cover is often inadequate and unevenly distributed. Many cities have seen its decline over time (Nowak and Greenfield, 2018). From an environmental justice perspective, unequal distribution of urban tree cover and biodiversity as a function of social stratification would lead to inequities in benefits derived by trees (Gerrish and Watkins, 2018). Clearly, a first step to implementing urban reforestation strategies to support cities requires not only inventorying tree resource but also understanding factors that may drive variation in tree cover. In natural settings, tree cover and biodiversity may be influenced by factors such as the availability of water, nutrients, light and their interactions. However, in cities the status and distribution of urban tree cover are largely shaped by social actions (preferences, policies, management) that act on multiple scales (e.g., individuals, households, community, or government) (Pickett et al., 2011; Olivero-Lora et al., 2020). Often, studies have found that urban tree cover and biodiversity varies within cities as a function of wealth disparities with higher tree cover and biodiversity often found in wealthier areas (e.g., Hope et al., 2003; Landry and Chakraborty, 2009; Leong et al., 2018) in what has been termed the “luxury effect.” Yet there are often exceptions to this pattern (Kendal et al., 2012; Grove et al., 2014; Meléndez-Ackerman et al., 2014; Kuras et al., 2020) emphasizing the need to contextualize these studies as other urban indicators may be in play.
Adaptive urban planning and design call for the identification of indicators (e.g., tree cover, faunal composition, etc.) to characterize the extent of biodiversity, ecosystem function and provision of ecosystem services by the urban forest (Ahern, 2013). Also, an ecosystem service approach to urban planning is best approached when these indicators are integrated with the valuation of multiple ecosystem services, depending on the stakeholders involved (Urgenson et al., 2013; Demuzere et al., 2014). Different modeling tools are being used for the assessment and valuation of ecosystem services worldwide. Of these, i-Tree, provided by the USDA Forest Service (Nowak and Crane, 2000; Nowak et al., 2008) stands as a “freely distributed public domain” model for assessing urban ecosystem services under a variety of platforms (i-Tree–Canopy, i-Tree–Eco, i-Tree–Hydro etc.) that responds to specific planning or management needs and objectives. i-Tree evaluates multiple ecosystem services of trees such as temperature regulation, air quality improvement by removal of pollutants, climate change mitigation by carbon sequestration and the reduction in carbon emissions through altered building energy use, and guides the development of green infrastructure goals for local communities of any size (Nowak et al., 2013; Baró et al., 2014). In the Western Hemisphere this approach is being used extensively in North American cities and less so in Latin America and the Caribbean (i-Tree, 2020).
Here we describe the results of an i-Tree inventory implemented in the National Municipal District of Santo Domingo, capital of the Dominican Republic (Figure 1). We subsequently use social-ecological theory on drivers of urban biodiversity and vegetation quality as a context to discuss the potential factors influencing variation of urban forest characteristics and ecosystem services in this tropical city.
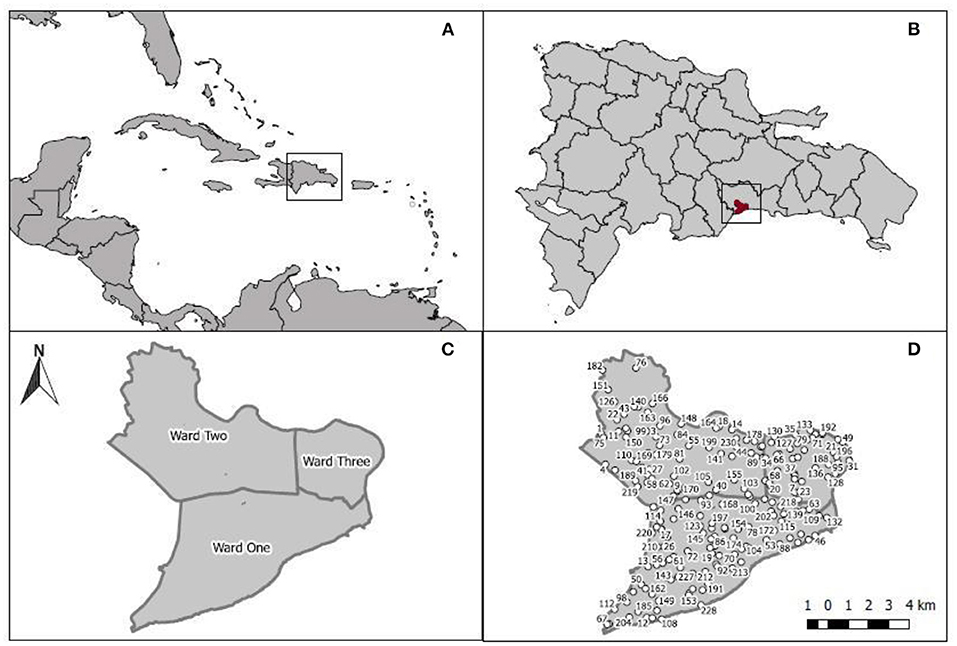
Figure 1. Study area. (A) Hispaniola, (B) Dominican Republic and Santo Domingo, National District and its three wards, (C) and the 206 randomly distributed circular plots (D).
As with many small island nations, the Dominican Republic (DR) is vulnerable to climate-related impacts, including hurricanes, volcanic eruptions, sea level rise, flooding, extreme heat, prolonged droughts, and disruptions in water supply. State and local agencies in the DR are addressing these potential impacts and working toward developing adaptation strategies in collaboration with US based agencies, such as USAID and the USDA Forest Service. Urban areas, such as Santo Domingo, are of concern because more people live in particularly poor, marginalized communities located in high-risk areas. The extensive and aging infrastructure throughout the city and the lack of forest vegetation create added risks, such as urban flooding and water quality issues, that can exacerbate climate-related impacts and biodiversity impoverishment. We used results from the urban tree inventory of the National Municipal District of Santo Domingo to address the following questions: (a) At what capacity do green areas provide multiple ecosystem-based adaptation services and how variable is that capacity across different wards (political sectors) within the National District? (b) Is the spatial variation in the provision of ecosystem services related to spatial variation in urban tree attributes (biodiversity, structure, condition of urban trees, urban domain and geographic location)? (c) Is this distribution consistent with landscape (population and housing density, household income) or plot-level variation in urban attributes (social/economic/physical) at the plot or landscape scale? Under the luxury effect hypothesis (Hope et al., 2003; Landry, 2013), we hypothesized that the forest quantity and quality of tree cover, diversity and forest ecosystem services provided are positively correlated with income. We also expected that these vegetation indicators would also be negatively correlated with variation in urban indicators at the landscape scale, i.e., among wards, such as population density, green cover. We discuss the implications of our results within the context of management strategies and areas of opportunity for implementing urban forest management strategies using ecosystem services-based approaches in The National Municipal District of Santo Domingo.
Methods
Study Area and Data Collection
The Dominican Republic shares the island of Hispaniola with the Republic of Haiti (Figures 1A,B) and occupies 48,671 km2 between the geographical coordinates 17°36′ – 19°56′ N and 68°19′ – 72° W (Sangermano et al., 2015). The country is divided into one National Municipal District and 31 provinces [Oficina Nacional de Estadísticas (ONE), 2010; Figure 1B]. This study was undertaken in the National Municipal District of Santo Domingo (hereafter NMDS), capital of Dominican Republic with a population of 965,040 (Figure 1C) and located in the southeastern region of the island [Oficina Nacional de Estadísticas (ONE), 2010]. The NMDS was established in 1502 on the southern coast of the Dominican Republic (Figure 1B) and has an extension of 91.58 km2 dominated by urban or “built” cover (82.72%) (Alcaldía del Distrito Nacional, 2019). As the capital of the Dominican Republic, NMDS is the site of all central government offices (Figure 1C). About 75% of the NMDS is surrounded by water (rivers in the eastern and northern sectors and the Caribbean coast to the south) and prone to flooding; 28.3% of the population lives below the poverty level (Alcaldía del Distrito Nacional, 2019). Compared to other provinces in the Dominican Republic, indices of human development (IHD) and per capita income are above average [IDH: NMDSD = 0.85 vs. Dominican Republic = 0.56, Annual Per Capita Income ($USD): NMDSD = 1,394 vs. Dominican Republic = 590, Programa de la Naciones Unidas para el Desarrollo (PUND), 2020]. Yet, socioeconomic profiles and urban characteristics, e.g., population and housing density, amount of public space, socio-economic profiles, show marked differences across three wards, i.e., electoral sectors for the purpose of political representation within NMDSD, Savonis et al. (2016), in which the city is divided (Table 1). Ward 3 has the highest population density, the lowest percentage of households within the highest socioeconomic stratum and the highest number of households under the poverty level (Table 1). In contrast, Ward 1, in the southern portion of the city, presents the lowest population density and is characterized by a population of middle- and upper-class residents, while Ward 2, located in the north-northwestern portion of the city, supports a middle-to-upper class and lower-class population (Table 1).
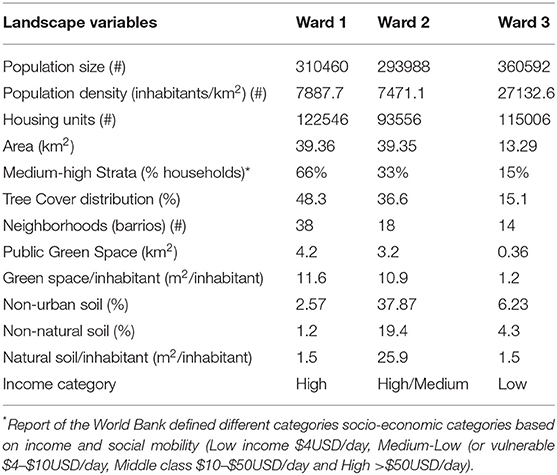
Table 1. Socio-demographic and landscape cover traits for the three wards of the Santo Domingo's National District as reported by official sources [Villalona and Alfonso, 2006; Oficina Nacional de Estadísticas (ONE), 2010; Alcaldía del Distrito Nacional, 2019; Programa de la Naciones Unidas para el Desarrollo (PUND), 2020].
Vegetation Surveys
Surveys followed the sample design and methods of Nowak and Greenfield (2018) and the urban forest assessment protocol for i-Tree Eco (i-Tree Eco user's manual v6.0). In total, 206 circular sample plots (0.04 ha) were randomly distributed within the limits of the National District (Figure 1D). We implemented a post-stratification design to assess differences in forest structure and ecosystem services among the three wards. The number of sample plots per site was as follows: 98 in Ward 1, 69 in Ward 2, and 39 in Ward 3 (Figure 1D). At each plot, we measured overall tree cover; shrub cover; planting space; land use (e.g., residential, transportation, park); and land cover (e.g., building, tar, grass, soil). We measured trees with a dbh ≥2.5 cm at 1.37 m above ground. We also measured tree height (total, live top, and crown base); tree canopy width (north-south and east-west); percent canopy missing; percent of dieback; crown light exposure; percent of permeable surface and shrubs under the tree canopy; and we determined whether it was a “street tree” or not. Shrubs were also included in the species inventory. For each shrub species, measured height, percent canopy missing, and percent area cover.
Species Community Analyses
We constructed tree species and taxonomic family abundance matrices to analyze variation in species richness within the NMDSD. We then constructed a 3-D bar plot depicting the percent plant abundance within each of the 91 plant families identified to evaluate differences in relative composition among wards at the family taxonomic scale. We also generated rarefaction curves to evaluate differences in the expected number of species richness among wards using first order jackknife estimators using the SpadeR package (Chao et al., 2016). To determine if wards differed in species composition for a potential further evaluation, we then performed a Principal Coordinate Analysis (PCoA) by transforming the initial tree abundance matrix into a Bray-Curtis distance matrix (i.e., “vegdist” function). Plot values were then used to run a permutational multivariate ANOVA (i.e., “adonis” function) that tested for differences in ordination centroids among the three wards. When significant, a paired comparison was performed using the same functions in the “vegan” R package (Oksanen et al., 2015). All tests were run using a p-value of 0.05 in the R statistical package (R Core Team, 2017) and results were visualized by plotting resulting values for the first two PCoA axes. Using the “combinespecies” and “multipatt” functions from the “indicspecies” R Package (De Caceres and Legendre, 2009) we determined the list of the species that were associated to a particular ward. For this, we used the “IndVal.g” index and 999 random permutations to test the statistical significance on the relationship between the species and each ward.
Vegetation Structure Analyses
We entered the field-collected data into the i-Tree Eco platform provided by the US Forest Service (www.i-treetools.org) to generate additional variables on vegetation structure and ecosystem services at the species and plot level and used resulting matrices for further statistical analyses. The platform generated data matrices with estimates for the Importance Value index (IV) for each species and tree condition for each tree. The IV index integrates the values for a species' relative density, frequency of occurrence and the basal area occupied by each tree of a given species to characterize its level of dominance within the system (Lamont et al., 1977). The “tree condition” variable classifies each tree into one of four condition classes based on its percent dieback (Excellent = 0%, good = 1–10%, fair = 10–25%, critical >25%). Trees in the data matrix were also classified according to their locality domain, i.e., public vs. private and street vs. non-street. We used the data collected at the plot level to estimate the average percentage of tree cover, shrub cover, and space available for planting at the ward level, in addition to the average species richness (number of tree and shrub species per plot), average tree density (trees.ha−1) and average tree height, dbh, canopy cover, and leaf area per plot, to test for differences among wards in vegetation structure. Many plots had zero values, therefore to test for differences among wards, we ran a series of poisson models, e.g., ordinary poisson, negative-binomial, and zero inflated, and used the Vuong non-nested test to compare them (using pscl R package; Jackman, 2017). In model comparisons, if model one had a positive and significant test statistic, this suggested that model one was superior to model two. For selected models, we used the ANOVA function in the “car” package following (Riley et al., 2018) to obtain the likelihood-ratio test statistic followed by a post-hoc Tukey (when significant) test using the “lsmeans” R package (Lenth, 2016). To assess differences in tree height, dbh, canopy cover and leaf area among wards, the four variables were log transformed and analyzed using one-way ANOVA. When significant, analyses were followed by post-hoc Tukey tests to analyze contrasts between wards. Chi-square analyses were performed to test for differences among wards in the frequency distribution of trees across different plant conditions, dbh structure classes, and location domain categories. In the case of tree condition, two Chi-square analyses (X2) were performed, first comparing the four categories between Ward 1 and Ward 2 (no critical condition was found in Ward 3), and second testing the first three categories among the three wards. All analyses used a p-value of 0.05 to test for significance using the R statistical package (R Core Team, 2017).
Ecosystem Services
The i-Tree Eco platform generated individual, species and plot-level values for five ecosystem services associated to the structure of individual plants and the associated monetary values for these services. Ecosystem services reported here include: carbon storage (t) and sequestration (t y−1), avoided storm water runoff (m3 y−1), and atmospheric pollution removal (t y−1). To estimate the ecosystem services of green infrastructure in urban areas, climatic and atmospheric pollution information from the study area is required. This information is currently unavailable from the NMDSD area. Therefore, we used the 2013 climatic and pollution data from the station located in “Las Americas” International Airport (station code 784850-99999) located about 25 km southeast of the metropolitan area. To test for differences in the ecosystem services among the three wards, we used individual tree information to estimate services at the plot level. Data were log-transformed and analyzed using one-way ANOVA. If variables did not meet ANOVA assumptions, non-parametrical Kruskal-Wallis tests were run. When significant (p < 0.05), analyses were followed by post-hoc Tukey tests to analyze contrast between ward pairs.
In addition to regulation and support services generated by i-Tree, we explored differences in provision and ornamental services using the species data from i-Tree inventories. Specifically, we did a literature research to classify each species into four categories of general use (food, medicinal, ornamental, wood) as a way to document the potential for some provision and cultural ecosystem services that were common enough to evaluate using rarefaction curves and that also have been considered in other urban studies to evaluate vegetation benefits in reference to residential green spaces (Daniels and and, 2006; Buchmann, 2009; Vila-Ruiz et al., 2014) but not necessarily in reference to green spaces from multiple land uses in city-scale inventories We used species data per plot to construct individual rarefaction curves for each general use category (ornamental, medicinal, food, wood) and evaluated differences in the expected species richness among Wards using first order Jacknife estimators (Chao et al., 2016).
Vegetation Traits vs. Social Variables
Using available GIS data for the NMDSD, the following social variables were assigned to each plot: housing density, proportion of women and the density of low-income houses [Villalona and Alfonso, 2006; Oficina Nacional de Estadísticas (ONE), 2010]. We then analyzed the relationship between these urban metrics and average indicators of vegetation structure (tree species richness, tree density, stem density, average dbh, tree height and leaf area) using multiple regression (GLM) with a negative binomial distribution. All analyses were run using the R statistical program (R Core Team, 2017).
Results
Species Richness
The 575 individuals sampled within the combined area of NMDSD represented a total of 90 species (25 native) distributed across 43 families (Supplementary Material). Throughout the NMDSD, 72.2% of surveyed tree species were non-native and the relative frequencies of native and non-native species and stems were statistically similar among wards (X2 < 2.2, df = 2, p's > 0). Ordination analyses yielded statistical differences between wards in their species composition [F(2, 122) = 1.507, p = 0.03, Figure 2] of wards. The centroid of the ordination clusters based on species composition for Ward 2 was similar in all paired comparisons to those of the two other wards (all values of p > 0.05) but the ordination cluster for ward 3 was significantly different from that of ward 1 [F(1, 79) = 1.651, p = 0.04]. At a global scale, rarefaction curves indicate significant differences in the expected number of species among wards (W1>W2>W3, Figure 3A). Rarefaction curves based on the number of native and non-native species indicate that the expected number of non-native species is likely higher than that observed (curves have not stabilized); and the ratio of native to non-native species is approximately 1 (native) to 4 (non-native) (Figure 3B).
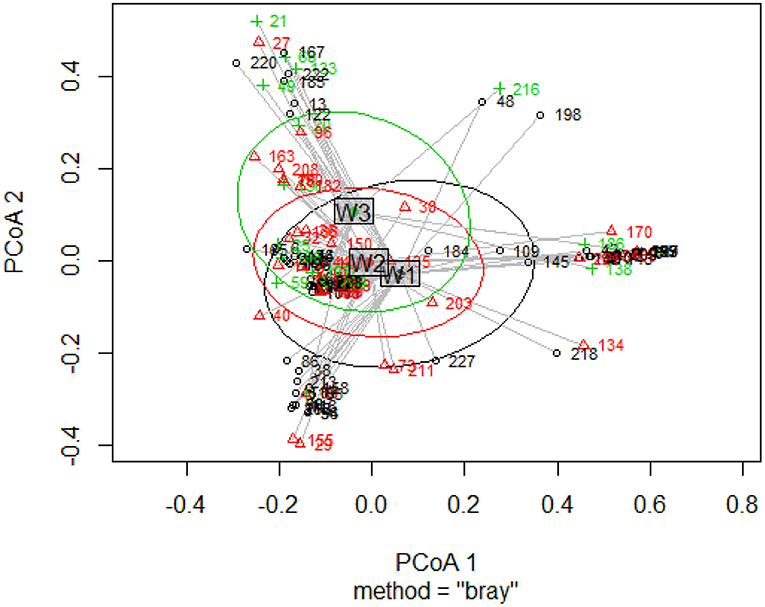
Figure 2. Tree species composition among the three wards of the National District of Santo Domingo, Dominican Republic. Each number corresponds to plots randomly distributed within the three localities: W1 (Ward 1) = black color and open circles, W2 (Ward 2) = red color and triangles, W3 (Ward 3) = green color and crosses. [PCoA1] and PCoA2 explained 15% of the variation among the data.
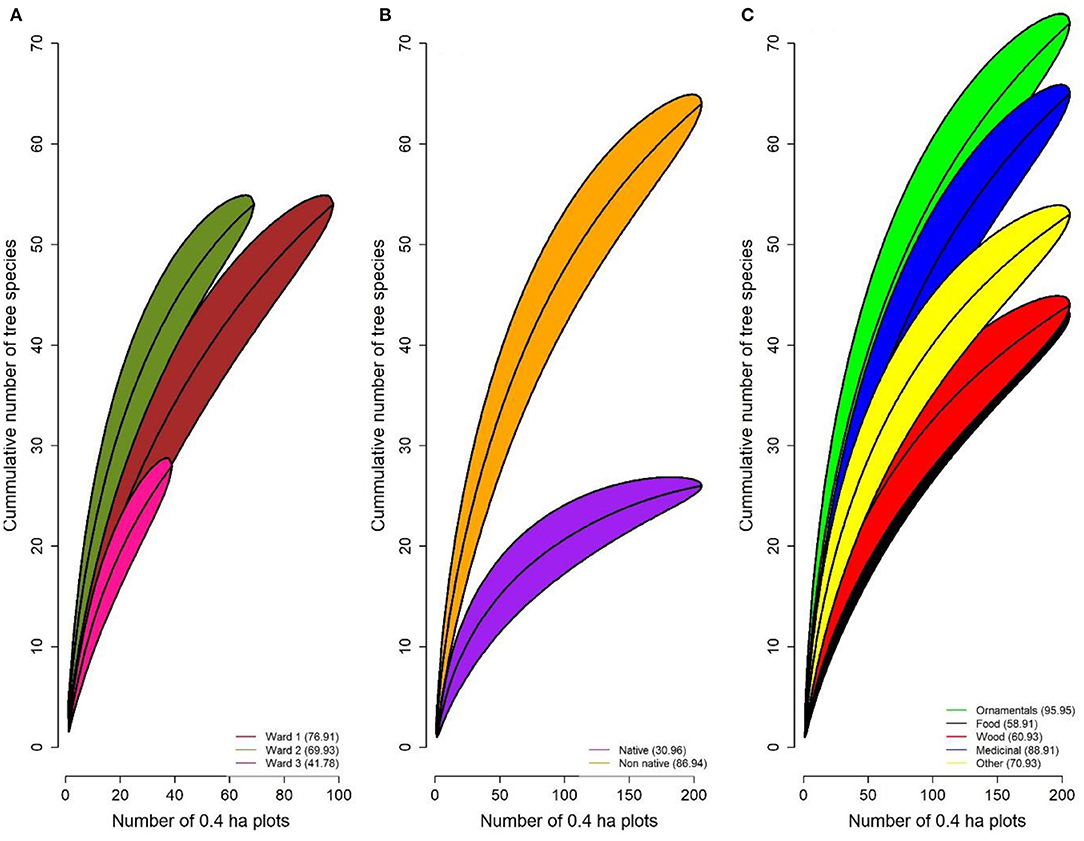
Figure 3. Rarefaction for curves using 1st jackknife estimators to evaluate differences among (A) wards, (B) native vs. non-native species, (C) plant uses.
Based on the species index (“IndVal.g”) analysis, four species combinations were associated with Ward 3: Azadirachta indica (indicator value index = 0.35, p = 0.01), Ouratea striata (Tiegh.) Urb. (Ochnaceae, indicator value index = 0.31, p = 0.02), Mangifera indica + A. indica (Anacardiaceae + Meliaceae, indicator value index = 0.31, p = 0.02), and Citrus sp. (Rutaceae, indicator value index = 0.29, 0.03). With these analyses, there were no significant species combinations that were unique to tree communities in either Ward 1 or Ward 2. However, Persea americana (Lauraceae, indicator value index = 0.45, p = 0.01) and Psidium guajava L. (Myrtaceae, indicator value index = 0.33, p = 0.04) were indicators of the combined tree communities of Ward 2 and Ward 3. A closer examination of the taxonomic profile of Wards 2 and 3 based on the relative distribution of stems by plant family indicates that Wards 2 and 3 shared more plant families with each other than with Ward 1 (Figure 4).
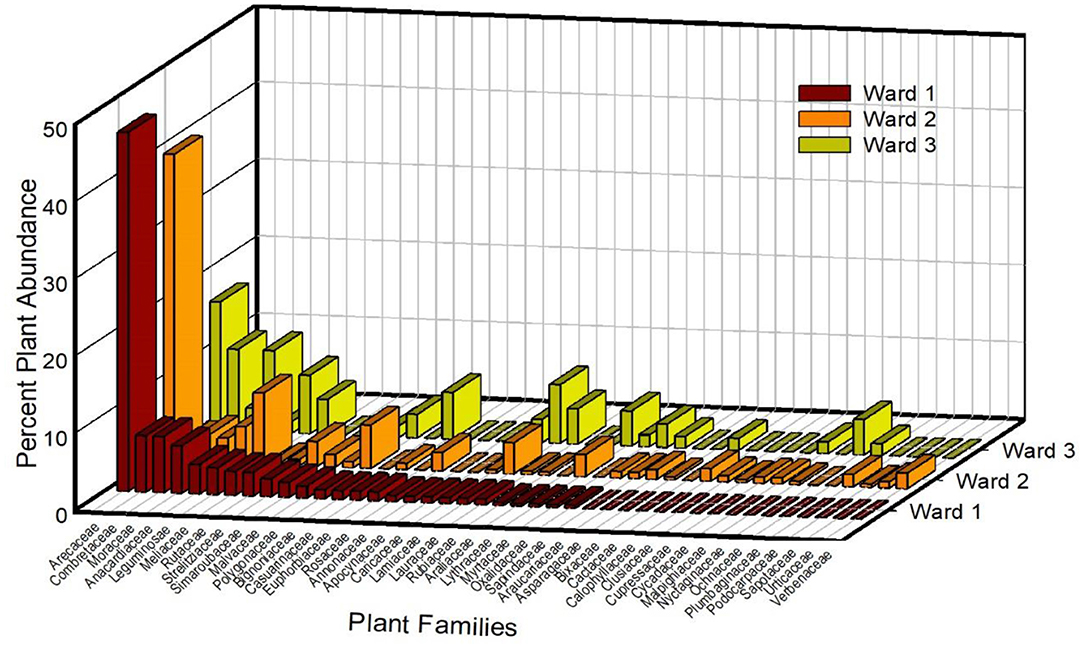
Figure 4. Differences in the relative abundance of stems for the most common plant families among three wards in the National District of Santo Domingo.
When importance values of the 10 most dominant species were considered, Wards 1 and 2 showed more pronounced dominance structures and higher IV index values for species in the Areacaeae family than in Ward 3 (Table 2). When we evaluated species in terms of their importance value, the three wards shared little species overlap. The most dominant species in Ward 1 were Adonidia merrilllii (Arecaceae), M. indica (Anacardiaceae), and Bucida buceras (Combretaceae) and in Ward 2 these were Coccos nucifera (Arecaceae), A. merrillii (Arecaceae), and Mammea americana L. (Sapindaceae, Table 2). In Ward 3, the dominants species were M. indica (Anacardiaceae), Azaridachta indica A. Juss (Meliaceae), and Persea Americana Mill (Lauraceae, Table 2).
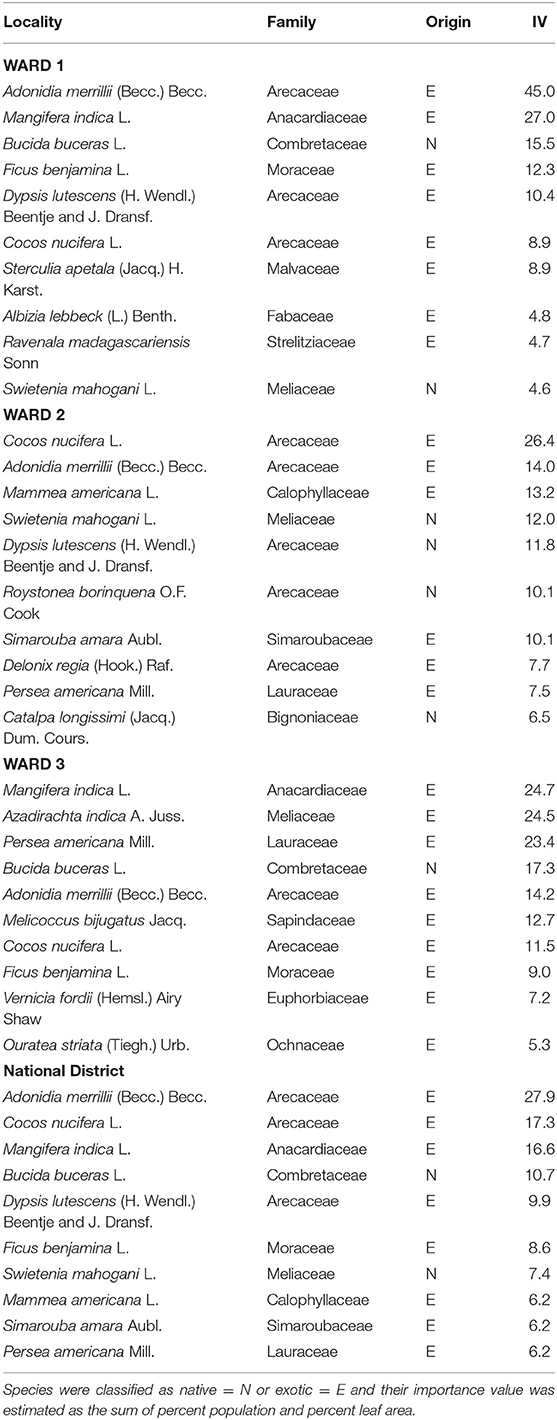
Table 2. Importance values (IV) of the ten most dominant species per ward and within the National District of Santo Domingo, Dominican Republic.
Forest Structure and Tree Abundance
Overall, there was a significant difference in tree density per plot among the three wards (X2 = 524.6, df = 2, p < 0.001; Figure 5A). Plots in Ward 2 had the highest average tree density (90.2 trees.ha−1) and were significantly different from those in both Ward 1 (66.3 trees.ha−1; Z = 2.42; p = 0.041) and Ward 3 (42.3 trees.ha−1; Z = 4.59; p < 0.001). A significant difference in the mean tree density was also observed between Ward 1 and Ward 3 (Z = 2.88; p = 0.011). There were no significant differences in average tree dbh, tree canopy cover, and leaf area among wards (all p > 0.05), but there was a significant difference in tree height among wards (Kruskall-Wallis X2 = 10.35, p = 0.005, Figures 5C–F). Trees in Ward 2 were taller on average (8.4 m, ± 0.4), than those in Ward 1 (6.3 m, ± 0.2) but comparable to those in Ward 3 (7.0 m, ± 0.5). No differences in tree height were observed between Ward 1 and Ward 3 (Figure 5F).
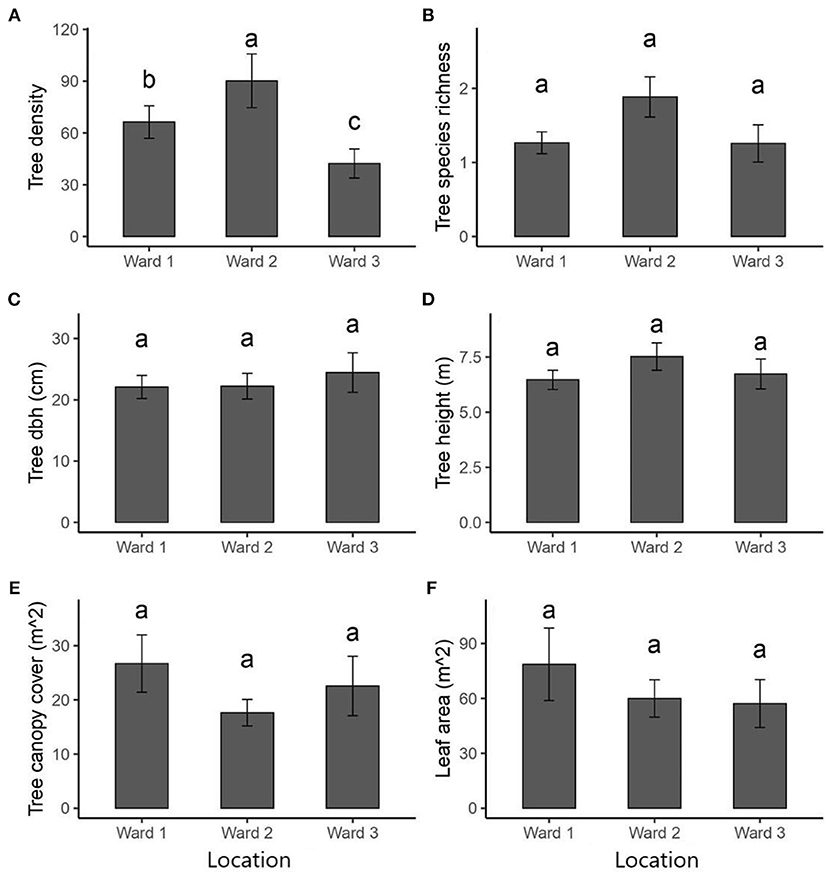
Figure 5. Between-site variation in (A) plant density, (B) species richness (includes trees and shrubs), (C) diameter at breast height (dbh), (D) tree height, (E) canopy cover, and (F) leaf area among the three wards within the National District area of Santo Domingo, Dominican Republic. Dissimilar letters represent significant differences at a p-value = 0.05. Vertical lines (“T”) are standard error around the mean.
Most of the trees (97.6%) in the National District area ranged from fair to excellent condition (< 25% of dieback) and only 2.4% exhibited critical conditions (> 25% dieback). There was a significant difference in the health condition of trees among the three wards (X2 > 70, p < 0.001). Trees in excellent condition were positively associated with Ward 2, whereas trees in good (1–10% dieback) and fair (10–25% dieback) condition were positively associated with Ward 1 and Ward 3, respectively (Figure 6A). Trees in critical condition were most prominent in Ward 1 (Figure 6A). Although the percentage of trees on streets occupied < 35% of the study area, there was a significant difference in the relative frequency of trees that were located on streets vs. those that were not among the three wards (X2 = 66.39, df = 2, p < 0.001). Street trees were more frequent in Wards 2 and 3, and less so in Ward 1 (Figure 6B). When we assessed the differences in the frequency distribution of trees in relation to location domain (public vs. private), we also found significant differences among wards (X2 = 19.7, df = 2, p < 0.001; Figure 6C). In Ward 1, trees were more abundant in public domains, whereas in Ward 3, trees were more abundant in private domains (Figure 6C).
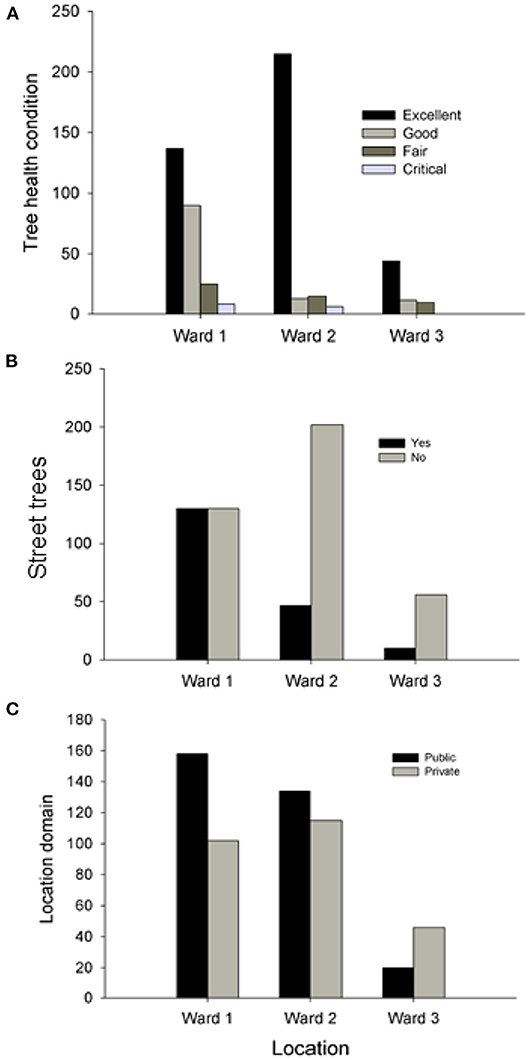
Figure 6. Differences among the three wards in the National District area of Santo Domingo, Dominican Republic in the frequency distribution of trees according to: (A) health condition categories (X2 > 70, p < 0.001); (B) functional locality (streets vs. no streets) (X2 = 66.39, df = 2, p < 0.001); and (C) urban domain (public vs. private) (X2 = 19.7, df = 2, p < 0.001).
Ecosystem Services
In the NMDSD trees and shrubs removed about 49.71 t y−1 of air pollution per year—Ozone (O3), Carbon monoxide (CO), Nitrogen dioxide (NO2), particulate matter <2.5 microns (PM2.5), and Sulfur dioxide (SO2)—with a monetary value of 1.47 M USD. Gross carbon sequestration within the study area was about 7.000 t y−1 with a monetary value of 1.0 M USD, yet the net carbon sequestration was about 6,600 t y−1. The urban forest in the NMDSD stores a total of 84.5K t of carbon with a monetary value of about 12.1 M USD. The three top tree species that store and sequester the most carbon within the study area were the introduced species M. indica and Ficus benjamina L., and the native B. buceras. Nevertheless, we did not observe a significant difference in carbon storage (X2 = 0.32, df = 2, p = 0.851), carbon sequestration (Kruskal-Wallis X2 = 0.88, df = 2, p = 0.645), or air pollution removal (X2 = 1.82, df = 2, p = 0.402; Table 3) among the three wards. Additionally, trees in the study area avoid runoff at a rate of 27,700 m3 y−1 with an associated value of 65.5K USD; and the compensatory value all trees from NMDSD exceeded 240 M USD. At the plot-level, we observed no significant differences in the average number of species (and stems) of food, wood and medicinal plants among wards (all values of X2 < 4.49, all values of p > 0.05, see Table 3). However, there were significant differences in the number of ornamental species per plot across wards (Table 3). On average, plots in Ward 2 had a higher number of ornamental species per plot than Ward 1 (Z = −2.25, p = 0.024) but there were no significant differences between Wards 2 and 3 (Z = −1.90, p = 0.057). Likewise, the number of ornamental trees' stems per plot was significantly higher in Ward 2 than in Ward 3 (Z = −3.27, p = 0.001), but statistically similar to Ward 1 (Z = −1.49, p = 0.136). At the municipal scale, the diversity of ornamental species was higher than that of other plant uses and was followed by medicinal uses (Figure 3C).
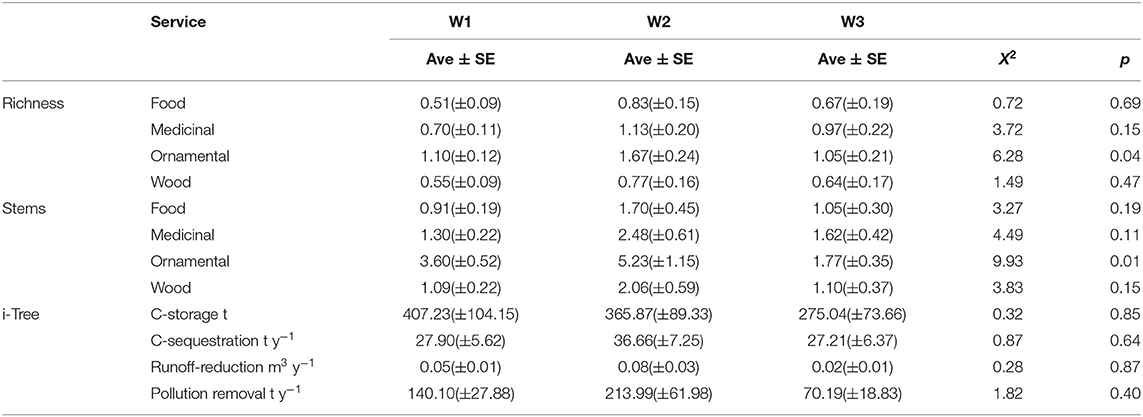
Table 3. Differences among wards in the average number of species and stems per plot for each of four ecosystem service categories (food, medicinal, ornamental, wood) and average values of services calculated by i-Tree.
Ground Cover
Tree cover in the NMDSD was estimated at 15.4%, which translates into a tree cover area of 14.17 km2. At the plot scale, the NMDSD ground cover was dominated by impervious surfaces (> 60%) and impervious surfaces were also dominant at the ward scale: Ward 1 = 81.8%; Ward 2 = 71.4%; Ward 3 = 83.1%; Table 4. Average percentage of trees (All wards: Average percentage tree cover/plot = 14.9%; Average percentage shrub cover = 5.7%, Table 4). Planting space was low in all wards, but it was unequally distributed. There was more space available for planting per plot in Ward 1 (3.5%) than in Ward 2 (1.4%) whereas no such space was detected in Ward 3. Other pervious surfaces were also unequally distributed. Ward 1 had proportionally more pervious surfaces (herbaceous and grass cover, mulch, bare soil 16.3%), than Ward 2 (9.6%) and Ward 3 (15.7%) (Table 4).
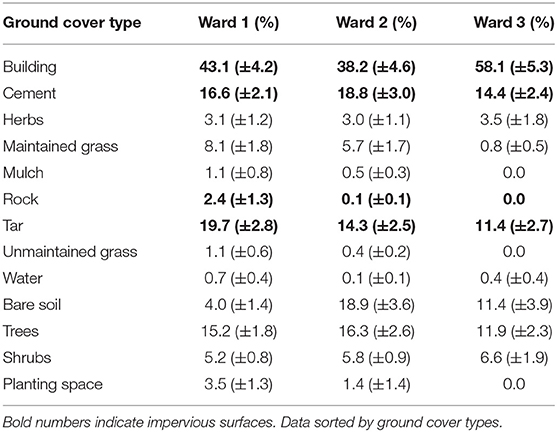
Table 4. Ground cover type estimated for the three wards in the National District of Santo Domingo, Dominican Republic.
Vegetation Traits vs. Social Variables
The value for the average number of plant species per plot (1–2 species/plot) was similar across the three wards (X2 = 5.10, df = 2, p = 0.08; Figure 5B). Population density was positively related to the proportion of low-income houses (r = 0.42, p < 0.0001), but not correlated with the proportion of women (r = −0.01, p > 0.05). Conversely, the proportion of low-income houses was negatively correlated with the proportion of women in the population (r = −0.59, p < 0.001). A GLM model showed that species richness per plot was unexplained by either population density or the proportion of low-income housing; and revealed that Ward 2 had significantly more species than Ward 1, but not Ward 3 (Table 5). GLM analyses showed no associations between population density and the proportion of low-income houses with stem density, average tree dbh, average tree height and leaf area per plot (Table 5).
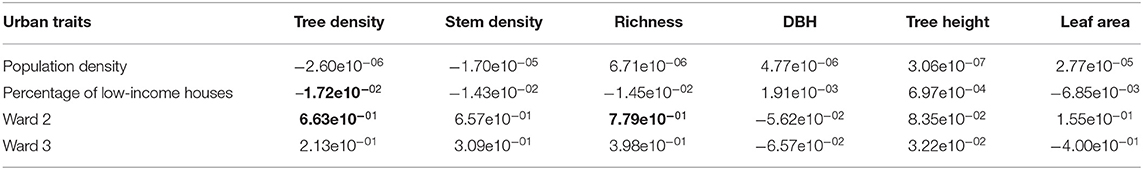
Table 5. Multiple regression coefficients from GLM analyses using negative binomial distribution of canopy structure and cover as a function of urban traits at the plot level, numbers in bold represent regression coefficients with p-values <0.001.
Discussion
Drivers of Urban Tree Diversity
Classic urban socio-ecological theory predicts that tree cover and diversity in urban spaces will be highly influenced by social factors (Cadenasso and Pickett, 2008; Pickett et al., 2011). The NMDSD surpasses, at least in general terms, the remaining districts of the Dominican Republic in many of the indicators of human development, yet the NMDSD's socio-economic and urban characteristics are hardly homogeneous. The territory of the NMDSD is divided into three wards with distinct income profiles. The percentage of households in Ward 1 that could be classified into a middle-high stratum according to the World Bank was 4 times higher than that of Ward 3 and twice the percentage of Ward 2 (Table 1). Under the “luxury effect” hypothesis (Hope et al., 2003; Landry, 2013), we expected Ward 1 to exhibit more planting space, tree cover and species diversity, arboreal stem densities and ecosystem services provided by trees. Our results suggest that only tree density supports this hypothesis and that it was at best weakly related to the percentage of low-income houses per neighborhood suggesting that, for this city, relationships between the quality of urban forest vegetation and “household income status classification” may be more complex due to the role of other interacting factors which may include but not be limited to differences in composition and variation in the functoriality of tree species (below) and availability of planting space.
While most traits did not conform to the luxury effect hypothesis, the role of household wealth cannot be discarded. On a per plot basis, we failed to find differences among wards in tree canopy cover, leaf area, dbh (a proxy of tree size) and certain ecosystem services provided by trees as calculated by the i-Tree tool (carbon sequestration, avoided runoff, removal of air pollutants, stored carbon). Studies that have evaluated the use of species in urban domestic yards have found that ornamental plants (which are often exotic) can be more common among households with higher incomes (Davoren et al., 2016; Leong et al., 2018), while food plants tend to be more common in lower income households (Sierra-Guerrero and Amarillo-Suárez, 2017). At the landscape scale, we did find that the frequency of ornamental stems was significantly higher in Ward 1 and 2 than in Ward 3, with ornamental palm species dominating the urban landscape specially in in Ward 1. At the plot level, we found no significant differences in the density of species and stems of food plants or other uses.
It is noteworthy that the scientific evaluation of ecosystem services provided by urban vegetation in Latin America and the Caribbean is limited. Even more so, is the scarcity of scientific studies addressing provision and cultural services relative to biodiversity as compared to those solely addressing regulation or supporting services (Dobbs et al., 2019). This is important especially when considering that urban forests are seen as key elements of a multi-functional urban green infrastructure in urban planning using sustainability visions (Benedict and McMahon, 2012; Dobbs et al., 2018). Provision and cultural services furnished by urban trees in addition to other services are deemed important in Latin American cities (e.g., Ordóñez-Barona and Duinker, 2014; Olivero-Lora et al., 2020) and as such should be evaluated for planning and management purposes.
Other results may point to more subtle relationships between variation in local wealth and the quality and quantity of urban tree vegetation. For example, we found differences in the relative species compositions of tree communities among wards also related to species uses (ornamental vs. food species). We found significant differences among wards that were largely driven by the presence of indicator species that in most cases aligned with either ornamental or food. For example, statistical differences between Wards 1 and 3 were largely driven by three species, two of which were the fruit trees M. indica (mango) and P. americana (avocado). Tree community composition in Ward 2 had elements of both Wards 1 and 3 in terms of shared species (species shared with both wards but more with Ward 3), a steep (inverted J-shaped) species ranked-abundance curve with palms as dominant stems (observed in Ward 1) and having food plants within the top three most frequent species (characteristic of Ward 3's tree community).
Additional results emerging from the differences in the quality and quantity of trees among the three wards suggest that other factors in addition to wealth may also be operating. For example, we found no significant differences among wards in the provision of ecosystem services related to tree volume, i.e., those estimated by i-Tree, even when plots in Ward 2 exhibited significantly higher tree densities relative to those in Wards 1 and 3. Trees in Ward 2 were also taller and tree cover was significantly less in Ward 3 relative to that observed in the other wards. This may seem paradoxical as some studies have shown that services such as carbon sequestration tends to improve with tree density (Mexia et al., 2018). Several factors may have contributed to cancel out potential differences in ecosystem services even when differences in tree cover and density were detected. First, sites presented differences in their overall species composition. Different species are likely to show functional (growth rate) and structural differences (size, canopy cover) that will influence the calculations for estimated ecosystem services by i-Tree (Scholz et al., 2018; Lin et al., 2020). Palms were dominant in both Wards 1 and 2 but given their simpler structures relative to large dominant species in Ward 3 such as M. indica, they do not yield high values for ecosystem services calculated by i-Tree such as carbon storage (M. indica = 13,000 t y−1 vs. palm species ≤ 5,000 t y−1) and sequestration (M. indica = 980 t y−1 vs. palm species ≤ 400 t y−1). Tree data that relate to canopy structure and cover that are entered into the i-Tree platform will also be influenced by tree condition. While most trees in the NMDSD were in good or excellent conditions, Ward 1 presented the highest frequency of trees in poor or critical condition, which may have canceled out any advantages that Ward 1 may have had over Ward 3.
Even with a weak luxury effect, there is potential for inequities that could materialize through differences in wealth. The wealthier ward (Ward 1) had three times the available planting space of Ward 2 and no planting space was detected for plots within Ward 3. This finding points to differences in the potential for reforestation among wards. Also, while street trees where more prevalent in Wards 2 and 3, trees were overall more frequently found in public spaces in Ward 1 and more frequently found in private spaces in Ward 3. This difference mirrors the fact that available green space in Wards 1 and 2 is 9 to 12 times higher than that of Ward 3, respectively (Table 1). Consequently, reforestation efforts that focus solely on public spaces may lead to unequal access to green infrastructure benefits across wards.
Urban Biodiversity and Conservation
There has been a recent convergence among international treaties, e.g., Convention for Biological Diversity (CBD); The Intergovernmental Science-Policy Platform of Biodiversity and Ecosystem Services Intergovernmental Platform on Biodiversity and Ecosystem Services (IPBES), 2019; The United Nations Framework Convention on Climate Change (UNFCCC); and government and non-government bodies, in their call for the use of nature-based solutions in cities to address pressing societal challenges. These challenges include but are not limited to climate change and biodiversity loss (Asian Development Bank, 2016; Depietri and McPhearson, 2017; Kabisch et al., 2017; WHO, 2017; Cohen-Shacham et al., 2019; Frantzeskaki et al., 2019).
It has been widely acknowledged that while cities are biodiversity-rich, these areas also tend to have high frequencies of non-native plant species many of which are cultivated for ornamental purposes (Smith et al., 2006; Loram et al., 2008; Ignatieva, 2010; Dunn and Heneghan, 2011; Müller et al., 2013; Avolio et al., 2020). Urban floristic studies are more common in North American, European and Australian cities relative to urban areas in the global south and particularly in the Latin American and Caribbean regions (Aronson et al., 2014; Ordoñez-Barona et al., 2020). A global meta-analysis of published plant species lists that included mostly temperate cities from North America, Europe, New Zealand and Australia showed that, with few exceptions, the relative proportions of introduced species were lower than that of native species (average percentage of introduced species = 30.2 ± 0.01%, Table 2, Aronson et al., 2014). Another study which included European and non-European cities (non- in the Latin America or the Caribbean regions) found that the average percentage of native species among the 110 cities examined was 52.1 ± 0.01% (Appendix S1, La Sorte et al., 2014). Likewise, a study of urban trees across US cities showed that, with few exceptions, native tree species were more frequent than non-native ones (Blood et al., 2016). Yet, results from the current study and recent studies in the Latin American and Caribbean regions suggest contrasting patterns at least when it comes to woody species based on city-wide tree inventories. In those studies, the relative proportion of non-native species is always larger than that of native ones, e.g., observed percentage of non-native species: NMDS, Dominican Republic = 72% (this study); Mexico City DF, Mexico = 61.8% (Ortega-Álvarez et al., 2011); five cities of central Chile = 86.1% (Santilli et al., 2018); San Juan Metro Area, Puerto Rico = 52% of common species (Brandeis et al., 2014).
From a conservation perspective these trends are disconcerting as the Latin American and Caribbean regions include important biodiversity hotspots (Myers et al., 2000). Invasive species constitute a key factor in the continuing decline of global biodiversity and environmental change (Pyśek and Richardson, 2010; Rojas-Sandoval et al., 2016). Furthermore, the establishment of introduced species in urban areas through the ornamental trade has been identified as a major factor influencing the subsequent escape of non-native species that become invasive in different areas the world (Dolan et al., 2011; Huebner et al., 2012), including the Caribbean (Rojas-Sandoval and Ackerman, 2021).
Clearly more studies are needed in Latin American and the Caribbean before generalizations and evaluations can be made regarding the relative proportions of introduced vs. native species within these two regions in order to promote wise management of native and introduced species by urban planners and other resource-oriented government officials. But for those cities in which non-native species have been documented and whose numbers continue to grow, often exponentially, studying the causes and consequences of their presence and especially their interaction with, and impact on, endemic and native species should be a priority.
Inventories of urban trees, determination and evaluation of their origin, status and ecosystem services are a required first step in the planning of urban green spaces as they determine the magnitude and composition of this resource and help set informed goals for wise management of urban forest resources (Östberg et al., 2018). The overall tree cover of NMDSD is only 15.4% in all wards, well below the recommended range for tree cover of 40–60% for forested cities (Nowak et al., 2010). Current tree cover values can be used to set canopy cover goals for the city. However, what should those goals be? Professional forestry associations are recognizing that setting realistic tree cover goals will be highly dependent upon the social (e.g., densification, impervious cover) and ecological (e.g., climate regimes) contexts of each individual city (Leahy, 2017). A report by the Davey Institute recommends setting canopy goals guided by three main criteria: what is physically possible, socially desirable and what is the potential planting space (Leff, 2015).
Ground cover distribution for NMDSD suggests that increasing tree cover is more plausible in Ward 1 than Wards 2 and 3 because it contains relatively more planting space and total combined pervious cover. Readily available planting space is more limited in Ward 3 and tree planting there may require more complex interventions to create green space such as land conversion, e.g., removing impervious surfaces, and concomitant with the implementation of engineered nature-based solutions (green roofs and walls). Any intervention should be scientifically driven by clear goals supported by information and empirical results, which are progressively embodying much of the contemporary social-desirability for nature-based solutions to address city livability issues. While results suggest that the provision of certain tree ecosystem services is comparable among wards on a per area basis, conversely, on a per capita basis, residents of Ward 3 clearly have less access to tree benefits than those of Wards 1 and 2 given the high population density and the relative low tree cover within Ward 3; most likely because of the high concentration of housing units (Table 1) via informal settlements (Alcaldía del Distrito Nacional, 2019).
Results from our study can be used to develop goals of desired tree species composition, abundance and dispersion as well as a richer biodiversity of flora and fauna inhabiting the NMDSD. The assessment report, Nature in the Urban City launched at the 14th Conference of the Parties (COP 14) during the Convention for Biodiversity, calls for the integration of biodiversity conservation initiatives in urban areas (Palmer, 2019). Yet, tree cover the in the NMDSD is highly dominated by non-native species. As a co-signee of the United Nation's Convention of Biological Diversity (CBD), the Dominican Republic has an opportunity to incorporate initiatives that increase the use of native tree species in reforestation initiatives within the NMDSD.
Observed differences in species composition among wards based on certain services (ornamental uses) may reflect different management practices that need to be understood when deciding tree species goals. Thus, additional studies should be conducted to address local citizens' preferences for trees and the services that urbanites request most often, as this information will contribute to the success of such initiatives (Olivero-Lora et al., 2020). Also related to species composition and diversity, there is a paradigm in urban forestry advocating urban tree cover should be highly diverse in order to minimize the loss of urban tree resources to pests and disease attacks (Raupp et al., 2006).
Palm species are dominant in the NMDSD. Consecuently, its tree cover prominence, particularly in Ward 1, makes it highly vulnerable to pests. In the Caribbean, red palm mite (Raoiella indica Hirst, Tenuipalpidae) was first reported in that region in 2004 and has become a substantial threat to palms. This mite is an invasive species from Asia and Africa that attacks a variety of species in Arecaceae (palms) and other monocots leading to leaf chlorosis and reduced reproduction (Roda et al., 2008; Rodrigues et al., 2020). This insect has already been reported on Santo Domingo's island of Hispanola (Vázquez et al., 2008).
Conclusion
The results presented here contribute to the growing body of research that investigates the factors that drive urban forest quality and quantity of cities in LAC (Latin America and the Caribbean). As in other studies, our results emphasize that the composition and abundance of urban trees can be highly heterogenous within tropical cities and this heterogeneity can be related to social factors in complex ways. Our results provide baseline data for the NMDSD that can be used by governmental ministries, urban planners, and others to facilitate the development of urban forest management guidelines that combine both biodiversity and ecosystem-based approaches to promote the environmental and functional integrity of the National Municipal District of Santo Domingo.
Data Availability Statement
The original contributions presented in the study are included in the article/Supplementary Material, further inquiries can be directed to the corresponding author.
Author Contributions
EM-A: co-led project conceptualization (design and data analysis), led the manuscript write-up, and constructed Figure 3. MP: performed data analyses and four out of five figures, wrote methods section, led on the ground data collection, and established data management procedures. AE, CC, and LC: performed data collection, validation, and data entry. CC provided edits to the manuscript and helped update socio-economic data for NMDSD. SB-D: co-led project conceptualization, provided project funding, and provided facilities for local iTree training. GB: co-led project conceptualization, provided funding and facilitated field crew logistics and stakeholder interaction in RD, and provided edits to the manuscript. JM: facilitated field crew logistics and secondary data. WA: co-led project conceptualization and facilitated field crew logistics and provided edits to the manuscript. DN: provided iTree training and application support, provided edits to the manuscript, and assisted in tree cover data interpretation. All authors contributed to the article and approved the submitted version.
Funding
Funding for this work was provided by a National Science Foundation (NFS) Partnerships for Enhanced Engagement in Research (PEER) Grant (USAID-OAA-A-11-00012) to INTEC, USAID/Dominican Republic (Agreement PAPA-517-AID-AEG-T-00-07-0000) and U.S. Forest Service International Institute of Tropical Forestry.
Conflict of Interest
The authors declare that the research was conducted in the absence of any commercial or financial relationships that could be construed as a potential conflict of interest.
Publisher's Note
All claims expressed in this article are solely those of the authors and do not necessarily represent those of their affiliated organizations, or those of the publisher, the editors and the reviewers. Any product that may be evaluated in this article, or claim that may be made by its manufacturer, is not guaranteed or endorsed by the publisher.
Acknowledgments
We thank personnel of Ayutamiento del Distrito Nacional de Santo Domingo, the Ministry of the Environment, INTEC, and RAUDO for their help locating and providing secondary data used in this manuscript and facilitating field data collection in the Dominican Republic. Dr. Sofia Olivero Lora and Ana Trujillo, and Mirel Volcán collaborated with local i-Tree training in Santo Domingo.
Supplementary Material
The Supplementary Material for this article can be found online at: https://www.frontiersin.org/articles/10.3389/frsc.2021.764073/full#supplementary-material
References
Ahern, J. (2013). Urban landscape sustainability and resilience: the promise and challenges of integrating ecology with urban planning and design. Lands. Ecol. 28, 1203–1212. doi: 10.1007/s10980-012-9799-z
Akbari, H. (2001). Energy Saving Potentials and Air Quality Benefits of Urban Heat Island Mitigation. Washington, DC: United States Department of Energy, 12–18. Available online at: https://www.osti.gov/servlets/purl/860475 (accessed December 5, 2021).
Alcaldía del Distrito Nacional (2019). Borrador Plan Estratégico del Distrito Nacional 2030 Diagnóstico y Acciones. Available online at: https://www.adn.gob.do/index.php?option=com_content&view=article&id=140&Itemid=657 (accessed December 5, 2021).
Aronson, M. F. J., La Sorte, F. A., Nilon, C. H., Katti, M., Goddard, M. A., Lepczyk, C. A., et al. (2014). A global analysis of the impacts of urbanization on bird and plant diversity reveals key anthropogenic drivers. Proc. R. Soc. 281:20133330. doi: 10.1098/rspb.2013.3330
Asian Development Bank (2016). Nature-Based Solutions for Building Resilience in Towns and Cities: Case Studies From the Greater Mekong Subregion. Mandaluyong City: Asian Development Bank. Available online at: https://www.cbd.int/financial/doc/adb-naturebasedsolutions2016.pdf (accessed December 5, 2021).
Avolio, M., Pataki, D. E., Jenerette, G. D., Pincetl, S., Weller Clarke, L., Cavender-Bares, J., et al. (2020). Urban plant diversity In Los Angeles, California: Species and functional type turnover in cultivated landscapes. Plants People Planet 2, 144–156. doi: 10.1002/ppp3.10067
Baró, F., Chaparro, L., Gómez-Baggethun, E., Langemeyer, J., Nowak, D. J., and Terradas, J. (2014). Contribution of ecosystem services to air quality and climate change mitigation policies: the case of urban forests in Barcelona, Spain. Ambio 43, 466–479. doi: 10.1007/s13280-014-0507-x
Benedict, M. A., and McMahon, E. T. (2012). Green Infrastructure: Linking Landscapes and Communities. Washington, DC: Island Press.
Blood, A., Starr, G., Escobedo, F., Chappelka, A., and Staudhammer, C. (2016). How do urban forests compare? tree diversity in urban and periurban forests of the Southeastern US. Forests 7:120. doi: 10.3390/f7060120
Brandeis, T. J., Escobedo, F. J., Staudhammer, C. L., Nowak, D. J., and Zipperer, W. C. (2014). San Juan Bay Estuary Watershed Urban Forest Inventory. Gen. Tech. Rep. SRS−190. Asheville, NC: Department of Agriculture Forest Service, Southern Research Station, 44 p. Available online at: https://www.fs.usda.gov/treesearch/pubs/45759 (accessed December 5, 2021).
Buchmann, C. (2009). Cuban home gardens and their role in socialecological resilience. Hum. Ecol. 37, 705–721. doi: 10.1007/s10745-009-9283-9
Cadenasso, M. L., and Pickett, S. T. A. (2008). Urban principles for ecological landscape design and management: scientific fundamentals. Cities Environ. 1, 1–16. doi: 10.15365/cate.1242008
Chao, A., Ma, K. H., Hsieh, T. C., and Chiu, C.-H. (2016). SpadeR: Species-Richness Prediction and Estimation Diversity With R. R Package Version 0.1.1. Available online at: https://CRAN.R-project.org/package=SpadeR (accessed December 5, 2021).
City of Melbourne (2017). Green our City Strategic Action Plan 2017-2021. Available online at: https://www.melbourne.vic.gov.au/sitecollectiondocuments/green-our-city-action-plan-2018.pdf (accessed July 20, 2021).
Cohen-Shacham, E., Andrade, A., Dalton, J., Dudley, N., Jones, M., Kumar, C., et al. (2019). Core principles for successfully implementing and upscaling Nature-based Solutions. Environ. Sci. Policy 98, 20–29. doi: 10.1016/j.envsci.2019.04.014
Daniels, G. D., and Kirkpatrick, J. B. (2006). Comparing the characteristics of front and back domestic gardens in Hobart, Tasmania, Australia. Landsc. Urban Plan 78, 344–352. doi: 10.1016/j.landurbplan.2005.11.004
Davoren, E., Siebert, S., Cilliers, S., and du Toit, M. J. (2016). Influence of socioeconomic status on design of Batswana home gardens and associated plant diversity patterns in northern South Africa. Lands Ecol. Eng. 12, 129–139. doi: 10.1007/s11355-015-0279-x
De Caceres, M., and Legendre, P. (2009). Associations between species and groups of sites: indices and statistical inference. Ecology 90, 3566–2574. doi: 10.1890/08-1823.1
Demuzere, M., Orru, K., Heidrich, O., Olzazbal, E., Geneletti, D., Orru, H., et al. (2014). Mitigating and adapting to climate change: Multi-functional and multi-scale assessment of green urban infrastructure. J. Environ. Manag. 146, 107–115. doi: 10.1016/j.jenvman.2014.07.025
Depietri, Y., and McPhearson, T. (2017). “Integrating the grey, green, and blue in cities: nature-based solutions for climate change adaptation and risk reduction,” in Nature-Based Solutions to Climate Change Adaptation in Urban Areas. Theory and Practice of Urban Sustainability Transitions, eds N. Kabisch, H. Korn, J. Stadler, and A. Bonn (Cham: Springer), 91–109.
Dobbs, C., Eleuterio, A. A., Amaya, J. D., Montoya, J. J., and Kendal, D. (2018). The benefits of urban and peri-urban forestry. Unasylva 69, 22–29. Available online at: https://www.fao.org/3/i8707en/I8707EN.pdf
Dobbs, C., Escobedo, F. J., Clerici, N., de la Barrera, F., Eleuterio, A. A., McGregor-Fors, I., et al. (2019). Urban ecosystem Services in Latin America: mismatch between global concepts and regional realities? Urban. Ecosyst. 22, 173–187. doi: 10.1007/s11252-018-0805-3
Dolan, R. W., Moore, M. E., and Stephens, J. D. (2011). Documenting effects of urbanization on flora using herbarium records. J. Ecol. 99, 1055–1062. doi: 10.1111/j.1365-2745.2011.01820.x
Dunn, C. P., and Heneghan, L. (2011). “Composition and diversity of urban vegetation,” in Urban Ecology: Patterns, Processes, and Applications, ed J. Niemelä (Oxford: Oxford University Press), 103–114.
Escobedo, F. J., Kroeger, T., and Wagner, J. E. (2011). Urban forests and pollution mitigation: analyzing ecosystem services and disservices. Environ. Pollut. 159, 2078–2087 doi: 10.1016/j.envpol.2011.01.010
European Environment Agency (EEA) (2014). Spatial Analysis of Green Infrastructure in Europe. Copenhagen: European Environment Agency. Available online at: https://www.eea.europa.eu/publications/spatial-analysis-of-green-infrastructure (accessed March 26, 2019).
Farrugia, S., Hudson, M. D., and McCulloch, L. (2013). An evaluation of flood control and urban cooling ecosystem services delivered by urban green infrastructure. Int. J. Biodivers. Sci. Ecosyst. Serv. Manag. 9, 136–145. doi: 10.1080/21513732.2013.782342
Frantzeskaki, N., McPhearson, T., Collier, M. J., Kendal, D., Bulkeley, H., Dumitru, A., et al. (2019). Nature-based solutions for urban climate change adaptation: linking science, policy, and practice communities for evidence-based decision-making. Bioscience 69, 455–466. doi: 10.1093/biosci/biz042
Gerrish, E., and Watkins, S. L. (2018). The relationship between urban forests and income: a meta-analysis. Landsc. Urban Plan. 170, 293–308. doi: 10.1016/j.landurbplan.2017.09.005
Grove, J. M., Locke, D. H., and O'Neil-Dunne, J. P. M. (2014). An ecology of prestige in new york city: examining the relationships among population density, socio-economic status, group identity, and residential canopy cover. Environ. Manage. 54, 402–419. doi: 10.1007/s00267-014-0310-2
Harlan, S. L., Brazel, A. J., Prashad, L., Stefanov, W. L., and Larsen, L. (2006). Neighborhood microclimates and vulnerability to heat stress. Soc. Sci. Med. 63, 2847–2863. doi: 10.1016/j.socscimed.2006.07.030
Hope, D., Gries, C., Zhu, W., Fagan, W. F., Redman, C. L., Grimm, N. B., et al. (2003). Socioeconomics drive urban plant diversity. Proc. Natl. Acad. Sci. U.S.A. 100, 8788–8792. doi: 10.1073/pnas.1537557100
Huebner, C. D., Nowak, D. J., Pouyat, R. V., and Bodine, A. R. (2012). “Nonnative invasive plants: maintaining biotic and socioeconomic integrity along the urban–rural–natural area gradient,” in Urban–Rural Interfaces, eds D. N. Laband, B. G. Lockaby, and W. C. Zipperer (Madison, WI: American Society of Agronomy, Soil Science Society of America), 71–98.
Ignatieva, M. (2010). “Design and future of urban biodiversity,' in Urban Biodiversity and Design, eds N. Muller, P. Werner, and J. G. Kelcey (Oxford: Blackwell Publishing), 118–144.
Intergovernmental Platform on Biodiversity and Ecosystem Services (IPBES) (2019). “Global assessment report on biodiversity and ecosystem services of the Intergovernmental Science-Policy Platform on Biodiversity and Ecosystem Services,” eds E. S. Brondizio, J. Settele, S. Díaz, and H. T. Ngo (Bonn: IPBES secretariat), 1148. doi: 10.5281/zenodo.3831673
i-Tree (2020). i-TreeInternational. Available online at: https://www.i-Treetools.org/support/resources-overview/i-tree-international (accessed October 10, 2020).
Jackman, S. (2017). pscl: Classes and Methods for R Developed in the Political Science Computational. Sydney, NSW: Laboratory. United States Studies Centre, University of Sydney. Available online at: https://cran.r-project.org/web/packages/pscl/citation.html (accessed December 5, 2021).
Jenerette, G. D., Harlan, S. L., Stefanov, W. L., and Martin, C. A. (2011). Ecosystem services and urban heat riskscape moderation: Water, green spaces, and social inequality in Phoenix, USA. Ecol. Appl. 21, 2637–2651. doi: 10.1890/10-1493.1
Kabisch, N., Korn, H., Stadler, J., and Bonn, A., (eds.). (2017). Theory and Practice of Urban Sustainability Transitions Nature-based Solutions to Climate Change Adaptation in Urban Areas Linkages between Science, Policy and Practice. Berlin: SpringerOpen.
Kendal, D., Williams, N. S. G., and Williams, K. J. H. (2012). Drivers of diversity and tree cover in gardens, parks and streetscapes in an Australian city. Urban For. Urban Green. 11, 257–265. doi: 10.1016/j.ufug.2012.03.005
Kuras, E. R., Warren, P. S., Zinda, J. A., Aronson, M. F. J., Cilliers, S., Goddard, M. A., et al. (2020). Urban socioeconomic inequality and biodiversity often converge, but not always: a global meta-analysis. Landsc. Urban Plan. 198:103799. doi: 10.1016/j.landurbplan.2020.103799
La Sorte, F. A., Aronson, M. F., Williams, N. S., Celesti-Grapow, l., Cilliers, S., Clarkson, B. D., et al. (2014). Beta diversity of urban floras among European and non-European cities. Glob. Ecol. Biogeogr. 23, 769–779. doi: 10.1111/geb.12159
Lamont, B., Downes, S., and Fox, J. (1977). Importance–value curves and diversity indices applied to a species rich heathland in Western Australia. Nature 265, 438–441. doi: 10.1038/265438a0
Landry, C. L. (2013). Changes in pollinator assemblages following hurricanes affect the mating system of Laguncularia racemosa (Combretaceae) in Florida, USA. J.Trop. Ecol. 29, 209–216. doi: 10.1017/S0266467413000266
Landry, S. M., and Chakraborty, J. (2009). Street trees and equity: evaluating the spatial distribution of an urban amenity. Environ. Plan. A Econ. Space 41, 2651–2670. doi: 10.1068/a41236
Leahy, I. (2017). Loose Leaf. Loose Leaf: The Official Blog of American Forests, January, 1–6. Available online at: https://www.americanforests.org/blog/no-longer-recommend-40-percent-urban-tree-canopy-goal/ (accessed December 5, 2021).
Leff, M. (2015). Michael Leff Davey Institute/USDA Forest Service USFS Philadelphia Field Station The Sustainable Urban Forest A Step-by-Step Approach. Available online at: https://www.itreetools.org/documents/485/Sustainable_Urban_Forest_Guide_14Nov2016_pw6WcW0.pdf (accessed December 5, 2021).
Lenth, R. V. (2016). Least squares means: the R package {lsmeans}. J. Stat. Softw. 69, 1–33. doi: 10.18637/jss.v069.i01
Leong, M., Dunn, R. R., and Trautwein, M. D. (2018). Biodiversity and socioeconomics in the city: a review of the luxury effect. Biol. Lett. 14:20180082. doi: 10.1098/rsbl.2018.0082
Lin, J., and Kroll, C. N. D. J. (2020). Ecosystem service-based sensitivity analyses of i-Tree Eco Ecosystem service-based sensitivity analyses of i-Tree Eco. https://www.researchgate.net/journal/Arboriculture-Urban-Forestry-1935-5297 Arboric. Urban For. 46, 287–306. doi: 10.48044/jauf.2020.021
Loram, A., Warren, P. H., and Gaston, K. J. (2008). Urban Domestic Gardens (XIV): the characteristics of gardens in five cities. Environ. Manage. 42:361. doi: 10.1007/s00267-008-9097-3
McPhearson, E. G. (2014). Monitoring million trees la: tree performance during the early years and future benefits. Arboric. Urban For. 40, 285–300. doi: 10.48044/jauf.2014.027
McPhearson, T., Parnell, S., Simon, D., Gaffney, O., Elmqvist, T., Bai, X., et al. (2016). Scientists must have a say in the future of cities. Nat. News 538, 165–166. doi: 10.1038/538165a
Meléndez-Ackerman, E. J., Santiago-Bartolomei, R., Vila-Ruiz, C. P., Santiago, L. E., García-Montiel, D., Verdejo-Ortiz, J. C., et al. (2014). Socioeconomic drivers of yard sustainable practices in a tropical city. Ecol. Soc. 19:20. doi: 10.5751/ES-06563-190320
Mexia, T., Vieira, J., Príncipe, A., Anjos, A., Silva, P., Lopes, N., et al. (2018). Ecosystem services: urban parks under a magnifying glass. Environ. Res. 160, 469–478. doi: 10.1016/j.envres.2017.10.023
Millenium Ecosystem Assessment (2005). Ecosystems and Human Well-Being: Synthesis. Washington, DC: Island Press.
Müller, N., Ignatieva, M., Nilon, C. H., Werner, P., and Zipperer, W. C. (2013). “Patterns and trends in urban biodiversity and landscape design,” in Urbanization, Biodiversity, and Ecosystem Services: Challenges and Opportunities, eds T. Elmqvist, M. Fragkias, J. Goodness, B. Güneralp, P. J. Marcotullio, R. I. McDonald, S. Parnell, M. Schewenius, M. Sendstad, and K. C. Seto (Dordrecht: Springer), 123–174.
Myers, N., Mittermeier, R., Mittermeier, C. G., da Fonseca, G. A. B., and Kent, J. (2000). Biodiversity hotspots for conservation priorities. Nature 403, 853–858. doi: 10.1038/35002501
National Academies of Sciences Engineering, and Medicine. (2019). Framing the Challenge of Urban Flooding in the United States. Washington, DC: The National Academies Press.
Nowak, D. J., and Greenfield, E. J. (2018). Declining urban and community tree cover in the United States. Urban For. Urban Green. 32, 32–55. doi: 10.1016/j.ufug.2018.03.006
Nowak, D. J., and Crane, D. (2000). “The Urban Forest Effects (UFORE) Model: Quantifying urban forest structure and functions',” in Integrated Tools for Natural Resources Inventories in the 21st Century. Proc. IUFRO Conference, February 2019 (Krabi), 714–720.
Nowak, D. J., Crane, D. E., Stevens, J. C., Hoehn, R. E., and Walton, J. T. (2008). A ground-based method of assessing urban forest structure and ecosystem services. Arboric. Urban For. 34, 347–358. Available online at: https://www.fs.usda.gov/treesearch/pubs/19526
Nowak, D. J., and Dwyer, J. F. (2007). Understanding the benefits and costs of urban forest ecosystems. in Urban and Community Forestry in the Northeast, ed J. Kruser (Newtown Square, PA: U.S.D.A. Forest Service, North Eastern Research Station), 25–46.
Nowak, D. J., Greenfield, E. J., Hoehn, R. E., and Lapoint, E. (2013). Carbon storage and sequestration by trees in urban and community areas of the United States. Environ. Pollut. 178, 229–236. doi: 10.1016/j.envpol.2013.03.019
Nowak, D. J., Stein, S. M., Randler, P. B., Greenfi, E. J., Greenfi Eld, E. J., Comas, S. J., et al. (2010). Sustaining America's Urban Trees and Forest. United States Department of Agriculture. Available online at: https://www.fs.fed.us/openspace/fote/reports/nrs-62_sustaining_americas_urban.pdf (accessed December 5, 2021).
Nuruzzaman, M. (2015). Urban Heat Island: causes, effects, and mitigation measures–a review. Int. J. Environ. Monit. Anal. 3:67. doi: 10.11648/j.ijema.20150302.15
Oficina Nacional de Estadísticas (ONE) (2010). Perfiles Sociodemográficos Provinciales región Ozama 2010. Available online at: https://web.one.gob.do/publicaciones/2012/perfiles-sociodemograficos-provinciales-region-ozama-2010/ (accessed December 5, 2021).
Oke, T. R. (1997). “Urban climates and global environmental change,” in Applied Climatology: Principles and Practice, eds R. D. Thompson and A. Perry (New York, NY: Routledge), 273–287.
Oksanen, J., Blanchet, F. G., Kindt, R., Legendre, P., Minchin, P., O'Hara, B. S., et al. (2015). Vegan: Community Ecology Package. R Package Version 2.2-1. 2, 1–2. Available online at: http://www.pelagicos.net/MARS6910_spring2015/manuals/R_vegan.pdf (accessed December 5, 2021).
Olivero-Lora, S., Meléndez-Ackerman, E., Santiago, L., Santiago-Bartolomei, R., and García-Montiel, D. (2020). Attitudes toward residential trees and awareness of tree services and disservices in a tropical city. Sustainability (Switzerland) 12:117. doi: 10.3390/su12010117
Ordoñez-Barona, C., Devisscher, T., Dobbs, C., Aguilar, L. O., Baptista, M. D., Navarro, N. M., et al. (2020). Trends in urban forestry research in latin america and the caribbean: a systematic literature review and synthesis. Urban For.Urban Green. 47:126544. doi: 10.1016/j.ufug.2019.126544
Ordóñez-Barona, C., and Duinker, P. N. (2014). Urban forest values of the citizenry in three Colombian cities. Soc. Nat. Resour. Int. J. 27, 834–849. doi: 10.1080/08941920.2014.905891
Ortega-Álvarez, R., Hernando, A., Rodríguez-Correa, H. A., and MacGregor-Fors, I. (2011). Trees and the city: diversity and composition along a neotropical gradient of urbanization. Int. J. Ecol. 2011:704084. doi: 10.1155/2011/704084
Östberg, J., Wiström, B., and Randrup, T. B. (2018). The state and use of municipal tree inventories in Swedish municipalities—results from a national survey. Urban Ecosyst. 21, 467–477. doi: 10.1007/s11252-018-0732-3
Palmer, C. O. (2019). Statement by Dr. Cristiana Pa?ca Palmer Executive Secretary Convention on Biological Diversity on the Occasion of World Cities Day 2019. Available online at: https://www.un.org/en/events/citiesday/ (accessed December 5, 2021).
Pickett, S. T. A., Cadenasso, M. L., Grove, J. M., Boone, C. G., Groffman, P. M., Irwin, E., et al. (2011). Urban ecological systems: scientific foundations and a decade of progress. J. Environ. Manage. 92, 331–362. doi: 10.1016/j.jenvman.2010.08.022
Programa de la Naciones Unidas para el Desarrollo (PUND) (2020). Desarrollo Humano Provincial IDHp de la Republica Dominicana, 2016 Data. Available online at: https://mapa.do.undp.org/map (accessed December 5, 2021).
Pyśek, P., and Richardson, D. M. (2010). Invasive species, environmental change and management, and health. Annu. Rev. Environ. Resour. 35, 25–55. doi: 10.1146/annurev-environ-033009-095548
R Core Team (2017). R: A Language and Environment for Statistical Computing. Available online at: https://www.R-project.org/ (accessed December 5, 2021).
Raupp, M. J., Cumming, A. B., and Raupp, E. C. (2006). Street tree diversity in eastern North America and its potential for tree loss to exotic borers. Arboric. Urban For. 32, 297–304. Available online at: https://pubag.nal.usda.gov/catalog/27863
Riley, C. B., Herms, D. A., and Gardiner, M. M. (2018). Exotic trees contribute to urban forest diversity and ecosystem services in inner-city Cleveland, OH. Urban For.Urban Green. 29, 367–376. doi: 10.1016/j.ufug.2017.01.004
Roda, A., Dowling, A., Welbourn, C., Peña, J., Rodrigues, J. C. V., Hoy, M. A., et al. (2008). Red palm mite situation in the Caribbean and Florida. Proc. Caribbean Food Crops Soc. 44, 80–87. Available online at: https://ideas.repec.org/p/ags/cfcs08/256598.html
Rodrigues, J. C. V., Cosh, M. H., Hunt, E. R., de Moraes, G. J., Barroso, G., White, W. A., et al. (2020). Tracking red palm mite damage in the western hemisphere invasion with landsat remote sensing data. Insects 11, 1–18. doi: 10.3390/insects11090627
Rojas-Sandoval, J., and Ackerman, J. D. (2021). Ornamentals lead the way: global influences on plant invasions in the Caribbean. NeoBiota 64, 177–197. doi: 10.3897/neobiota.64.62939
Rojas-Sandoval, J., Meléndez-Ackerman, E. J., and Anglés-Alcázar, D. (2016). Assessing the impact of grass invasion on the population dynamics of a threatened caribbean dry forest cactus. Biol. Conserv. 196, 156–164. doi: 10.1016/j.biocon.2016.02.015
Sangermano, F., Bol, L., Galvis, P., Gullison, R. E., Hardner, J., and Ross, G. S. (2015). Habitat suitability and protection status of four species of amphibians in the Dominican Republic. Appl. Geogr. 63, 55–65. doi: 10.1016/j.apgeog.2015.06.002
Santilli, L., Castro, S. A., Figueroa, J. A., Guerrero, N., Ray, C., Romero-Mieres, M., et al. (2018). Exotic species predominates in the urban woody flora of central Chile. Gayana. Botánica 75, 568–588. doi: 10.4067/S0717-66432018000200568
Savonis, M., Hellmuth, M., Potter, J. R., Wong, A., Hamilton, T., Herrera Moreno, A., et al. (2016). Planing for Climate Adaptation Program Climate Vulnerability Assessment of Las Terrenas to Inform Municipal Land Use Planning. Technical Report. Available online at: https://www.researchgate.net/figure/Location-of-the-National-District-showing-sectors-black-lines-and-ward-limits-red_fig19_337154902 (accessed December 5, 2021).
Scholz, T., Hof, A., and Schmitt, T. (2018). Cooling effects and regulating ecosystem services provided by urban trees-Novel analysis approaches using urban tree cadastre data. Sustainability (Switzerland) 10:712. doi: 10.3390/su10030712
Sierra-Guerrero, M. C., and Amarillo-Suárez, A. R. (2017). Socioecological features of plant diversity in domestic gardens in the city of Bogotá Colombia. Urban For.Urban Green. 28, 54–62. doi: 10.1016/j.ufug.2017.09.015
Smith, R. M., Thompson, K., Hodgson, J. G., Warren, P. H., and Gaston, K. J. (2006). Urban domestic gardens (IX): composition and richness of the vascular plant flora, and implications for native biodiversity. Biol. Conserv. 129, 312–322. doi: 10.1016/j.biocon.2005.10.045
United Nations (2015). Transforming Our World: The 2030 Agenda for Sustainable Development. The Division for Sustainable Development Goals (DSDG) in the United Nations Department of Economic and Social Affairs (UNDESA). Available online at: https://sustainabledevelopment.un.org/post2015/transformingourworld/publication (accessed October 9, 2020).
Urgenson, L. S., Prozesky, H. E., and Esler, K. J. (2013). Stakeholder perceptions of an ecosystem services approach to clearing invasive alien plants on private land. Ecol. Soc. 18:26. doi: 10.5751/ES-05259-180126
Vázquez, C., Quros de, G. M, Aponte, O., and Sandoval, M. F. (2008). First report of Raoiella indica Hist (Acari: Teneipalpidae) in South America. Neotrop. Entomol. 37, 739–740. doi: 10.1590/S1519-566X2008000600019
Vihervaara, P., Rönkä, M., and Walls, M. (2010). Trends in ecosystem service research: early steps and current drivers. Ambio 39, 314–324. doi: 10.1007/s13280-010-0048-x
Vila-Ruiz, C. P., Meléndez-Ackerman, E., Santiago-Bartolomei, R., Garcia-Montiel, D., Lastra, L., Figuerola, C. E., et al. (2014). Plant species richness and abundance in residential yards across a tropical watershed: implications for urban sustainability. Ecol. Soc. 19:22. doi: 10.5751/ES-06164-190322
Villalona, M., and Alfonso, P. J. (2006). Plan Indicativo Zona Metropolitana de Santo Domingo: Distrito Nacional (PIZMD). P107-134. Available online at: https://docplayer.es/109679740-Pizmsd-informe-diagnostico-plan-indicativo-zona-metropolitana-de-santo-domingo-conare.html (accessed October 10, 2020).
WHO (2017). Urban green spaces: A brief for action. Regional Office for Europe. World Health Organization. “Urban Planning, Environment and Health: From Evidence to Policy Action.” Meeting Report. Available online at: https://www.euro.who.int/en/health-topics/environment-and-health/urban-health/publications/2017/urban-green-spaces-a-brief-for-action-2017 (accessed December 5, 2021).
Keywords: Caribbean, urban forest, i-Tree, tropical, tree cover, ecosystem services, luxury effect
Citation: Meléndez-Ackerman EJ, Pérez ME, Espinal ABP, Caballero C, Cortés L, Bonilla-Duarte S, Bauer G, Martínez Guridy JM, Arendt WJ and Nowak DJ (2022) A Social-Ecological Approach to Studying Variation in Urban Trees and Ecosystem Services in the National Municipal District of Santo Domingo, Dominican Republic. Front. Sustain. Cities 3:764073. doi: 10.3389/frsc.2021.764073
Received: 25 August 2021; Accepted: 17 November 2021;
Published: 12 January 2022.
Edited by:
Ignacio Fernández, Universidad Mayor, ChileReviewed by:
Tenley M. Conway, University of Toronto Mississauga, CanadaChi Xu, Nanjing University, China
Copyright © 2022 Meléndez-Ackerman, Pérez, Espinal, Caballero, Cortés, Bonilla-Duarte, Bauer, Martínez Guridy, Arendt and Nowak. This is an open-access article distributed under the terms of the Creative Commons Attribution License (CC BY). The use, distribution or reproduction in other forums is permitted, provided the original author(s) and the copyright owner(s) are credited and that the original publication in this journal is cited, in accordance with accepted academic practice. No use, distribution or reproduction is permitted which does not comply with these terms.
*Correspondence: Elvia J. Meléndez-Ackerman, ZWxtZWxlbmRAZ21haWwuY29t