 Aditya Rebally
 Caterina Valeo
 Jianxun He2
 Saeid Saidi
- 1Department of Mechanical Engineering, University of Victoria, Victoria, BC, Canada
- 2Department of Civil Engineering, Schulich School of Engineering, University of Calgary, Calgary, AB, Canada
A region's transportation sector is vital to its economic and social health. Transportation systems are also influenced by climate change directly and indirectly and on a variety of spatial and temporal scales. Under a changing climate, many regions around the globe and especially in urban areas, have experienced increases in flood intensity and frequency in recent decades. Flooding can strain transportation networks in both the short- and long-term through transportation delays, infrastructure damage, and recovery, and potentially affect economies. The present article is a review of how flooding impacts transportation networks in both short- and long-term timescales and their subsequent impact on resiliency of the network. Firstly, flood effects are classified based on the connections between the type of flooding and the type of impact (either direct or indirect) on the transportation system. An analysis of the assessment methods and the transport models used to formulate flood effects on the transportation system is provided, as well as the drawbacks from the context of timescales, and recommendations for future research. The analysis indicates that the majority of the articles assess the direct and tangible impacts with focus on the resilience of the transportation network in short- and medium-term temporal scales and at smaller spatial scales. There is less emphasis on indirect, intangible flood impacts, and long-term temporal scales.
Introduction
Transportation systems are vital component to the smooth functioning of daily life and to society's standard of living (Pant et al., 2018). Events like floods and extreme snowfalls can have adverse impacts on infrastructure function in the form of economic disruption and loss to social systems (Bíl et al., 2015; Dong et al., 2020; Wiśniewski et al., 2020). Nearly all transportation modes (e.g., roads, transit, aviation, etc.) are highly dependent on the supporting network of infrastructure, and are vulnerable to extreme events such as large floods (He et al., 2020). During these types of events, structural integrity and the safety of the infrastructure can be compromised, which can lead to serious consequences (Esposito et al., 2018). These flood events effect the transportation network and its connectivity by reducing, deviating, or canceling travel for passengers, goods, and services due to roads being submerged, closed, or unsafe to travel (Douglas et al., 2017; Diakakis et al., 2020; He et al., 2020). Floods have direct effects on transportation networks through physical damage to infrastructure, and indirect effects that are the result of a cascade of adverse effects that can severely impact critical infrastructure (e.g., energy related infrastructure). They can lead to the failure of a city's infrastructure and economy (Pant et al., 2018; Serre and Heinzlef, 2018; Wang et al., 2020). Critical infrastructure like transportation systems, power grids, etc., are generally interdependent in cities. Within interdependent networks, failure of one element or node may result in failure of multiple nodes that are interconnected (Saidi et al., 2018; Wang et al., 2019). In light of climate change, cities are to expected to face an increase in devastating floods in the coming years, which are in turn compounded by increases in population size, urbanization, and impermeable surfaces (Pregnolato et al., 2017a).
In general, flood impacts on transportation networks and infrastructure can be quantified based on physical quantities (such as area of potholes or total length of bridge rendered unpassable) and on economic consequences (in dollar values, which can also arise from travel time delays). A flood assessment may estimate the impacts/effects of floods in monetary terms because it facilitates a comparison to multiple hazards (de Moel et al., 2015). Physical impacts can be direct impacts if they result from direct contact between the water body and the infrastructure. While indirect impacts have no direct contact with water, damage can occur beyond the physical limits of the flood such as traffic congestion outside the flood zone. Economic impacts are generally estimated as monetary values and are either tangible or intangible; with the latter being far more difficult to compute (Hammond et al., 2015; Pyatkova et al., 2019). A diagram of flood damage classification categories and their relationships is shown in Figure 1.
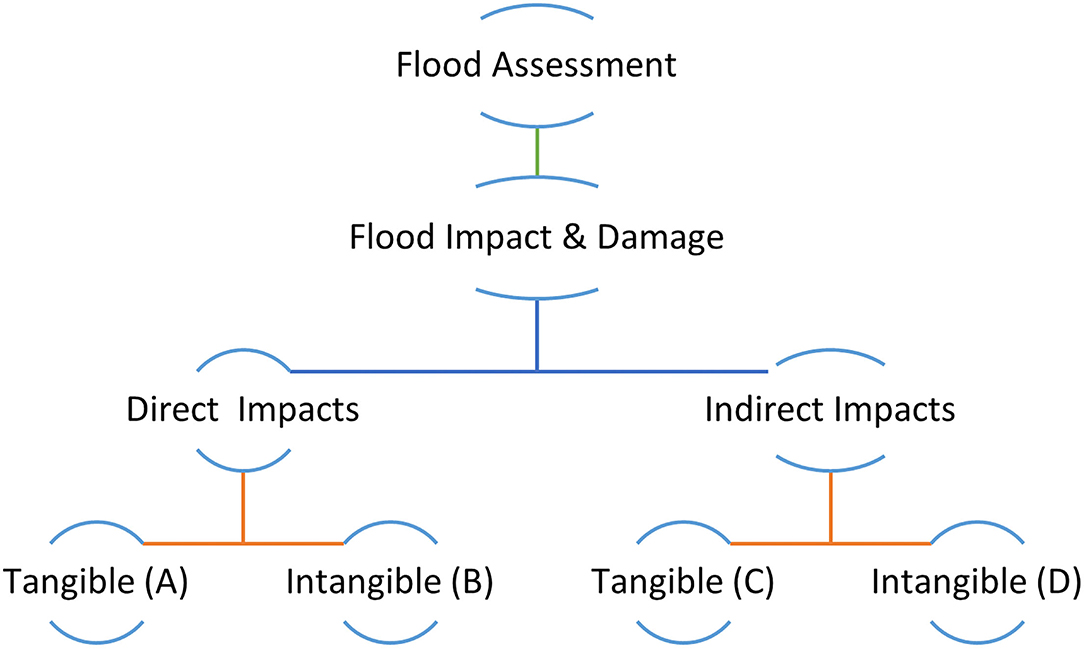
Figure 1. Flood damage classification for an operational network (Zhang and Alipour, 2019; Forero-Ortiz et al., 2020).
The classification of flood impacts shown in Figure 1 can be detailed as (Abdulla and Birgisson, 2021):
(A) Direct and tangible: the physical damage done to the infrastructure through direct contact of water. Can be estimated in monetary terms (for e.g., physical damage to infrastructure like roads and property).
(B) Direct and intangible: physical damage or activity interruption resulting from direct contact with flood waters but difficult to estimate in monetary terms (such as loss of network reliability).
(C) Indirect and tangible: damage done to infrastructure or other entities without any physical contact with flood waters and can be estimated in monetary terms (such as decrease in transportation demand due to traffic delays and congestion, etc.).
(D) Indirect and intangible: damage or interruption arising without physical contact with flood waters that is difficult to estimate in monetary terms (such as post flood recovery and maintenance, i.e., the time it takes for the transportation to function at pre-flood conditions and the consecutive losses).
Methods for evaluating the resilience of a transportation network to flooding can be classified into probabilistic methods, fuzzy inference methods, analytical methods, graph network theory, and empirical methods. Apart from these classifications, there are hybrid methodologies that use a combination of methods or models to form an integral part of flood risk and impact assessment.
Terms Related to Flood Impacts and Risk Assessments
A flood risk assessment is a general methodology for assessing the impact and risk of a flood to a given region. The assessment may be from an environmental perspective, an economic perspective, a social perspective, or all three. The methodology for a flood risk assessment involves determining the functions of hazard, exposure, and vulnerability arising from the flood (de Moel et al., 2015). Some of the external factors like warning time, social and economic resistance, etc., are generally not included in the assessment (de Moel et al., 2015). It consists of the following steps (Hammond et al., 2015; Pyatkova et al., 2019):
i. Identification of the hazard and respective temporal and spatial scales.
ii. Assessment of the hazard, which includes (estimation of) probability, intensity and frequency of flood event, and other characteristics (water depth, scale, intensity, duration, etc.) influencing the flood.
iii. Estimation of effects and vulnerability of the system over hazard scenarios.
iv. Evaluation of risk by combining the hazard maps and the socio-economic factors (results in the exposure of floods and can estimate the potential damage).
v. Assessment of risk, which refers to evaluation and comparison of the estimated risks based on socio-economic criteria and the possible measures to be applied for mitigation.
The flood impacts noted previously provide a glimpse of the vulnerability that the transportation sector faces due to floods. With increases in urbanization and flooding in the future, the (infrastructure) networks in existing and new developments need to be developed for resiliency to future disasters. Resilience, in the context of impact assessment, is defined as the ability of a network to withstand an extreme event, adapt, and recover any loss in functionality from the event (Serre and Heinzlef, 2018; Zhang and Alipour, 2019). For a flood event, resilience can be defined as the ability of a network to withstand the impacts through physical measures like reinforcement, minimize the damages in extreme events, restore the functionality of the network, and potentially reduce the network's future uncertainties (Hammond et al., 2015; Wang and Reed, 2017; Serre and Heinzlef, 2018; Zhang and Alipour, 2019).
Multiple cities are adopting the concept of resilience as part of flood risk management and mitigation (Hammond et al., 2015), with the majority of research being focused on society's capacity to adapt and respond appropriately based on the specific disaster (floods in this case). Resiliency involves three stages in the following order: recovery, adaptation, and transition. With respect to temporal scales, resilient approaches for time scales of short-term, short-to-medium-term, and long-term can provide opportunities for multiple patterns of development in resilience and impact mitigation. From the perspective of spatial scale, resilient approaches for local communities, local-regional, and regional networks, can reduce the impacts of floods to the networks at these spatial scales, and possibly at a variety of temporal scales. Recovery can be considered a short-term approach for increasing the resilience of existing infrastructure (Chelleri et al., 2015) and consists of two sub-phases. The first sub-phase involves the usage of emergency and rescue services and the second sub-phase involves reorganization or construction and additions to the infrastructure that can mitigate subsequent flood impacts (Chelleri et al., 2015). Adaptation can be considered a short-to-medium-term strategy that improves the existing system (the infrastructure) by disregarding system boundaries, and can potentially mitigate flood impacts and allow the system to persist (Chelleri et al., 2015). Transition, which is a long-term approach, requires alteration to the existing infrastructure to incorporate the resilient elements. This strategy is generally applied when the existing infrastructure approaches dangerous threshold levels (Chelleri et al., 2015). In the present context, dangerous threshold levels refer to the condition of infrastructure or networks with reduced resiliency either due to repeated extreme flood events with less recovery time, or if the existing infrastructure has not been modified or improved over time. The three stages of resiliency are often considered necessary to maintaining stability in infrastructure, but all too often, are viewed from a shorter-term lens, which is the time needed for the system to return to a stable equilibrium state and with emphasis on recovery for what is likely practical reasons. Because of this, there is an increased need for incorporating strategies within each stage with longer-term systemic transformations such as incorporating risk mitigation within the recovery process (Chelleri et al., 2015). Figure 2 connects the three stages in the process of resilience to the different temporal scales.
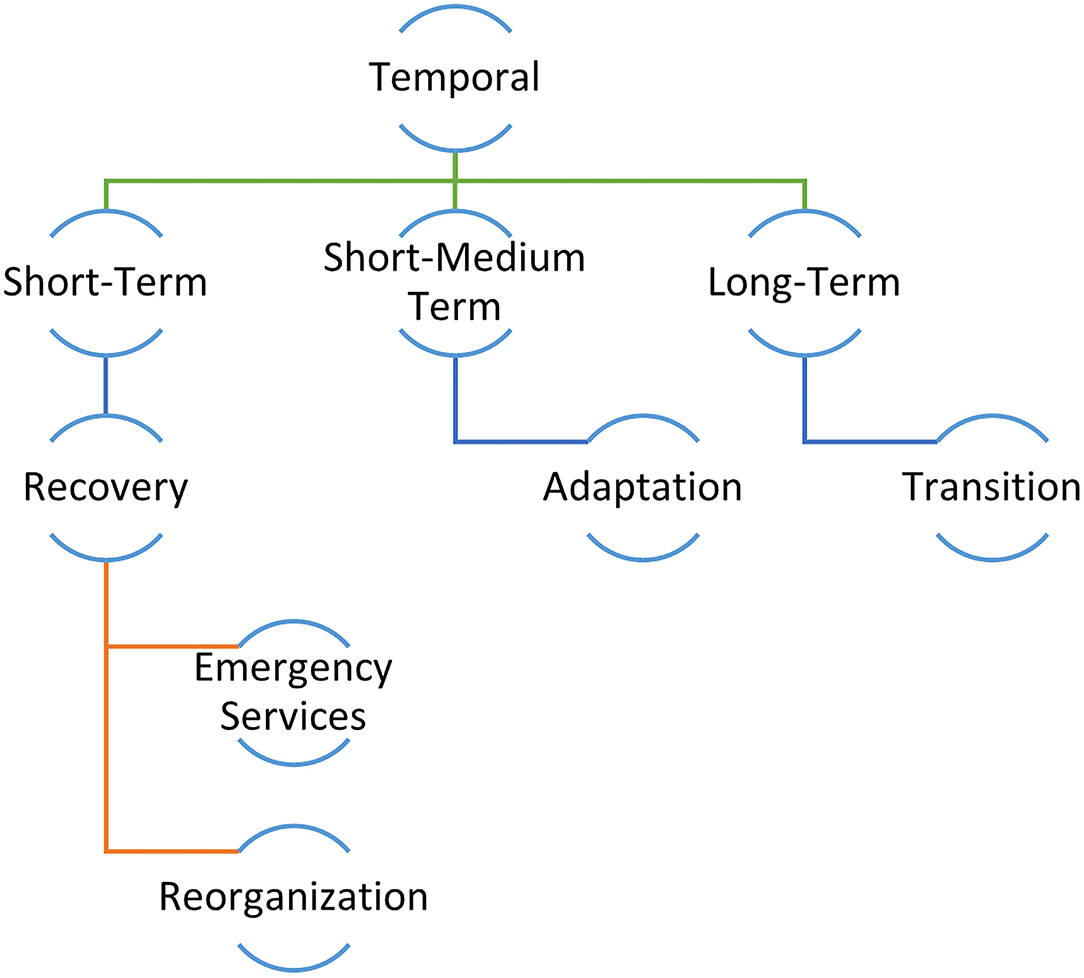
Figure 2. Temporal scales associated with the difference stages of resilience.
Flood Impact Evaluation Methods
As indicated earlier, the general methods for conducting a flood assessment and determining resilience are probabilistic, analytical, fuzzy logic/inference, graph theory, empirical, and combined/hybrid methods. The probabilistic method uses a simple stochastic model for the flood modeling analysis and resilience assessment. In this type of model, a probabilistic function/equation is developed based on the data (historical flooding, traffic patterns etc.), which are used to analyse the performance of a system during a flood event. The depth-disruption function developed in the flooding event of the Tyne in the UK with a 1-in-100 year return period (Pregnolato et al., 2017b) is a prime example of the probabilistic method. One of the assumptions in this method is that it assumes that the total loss during any disruptive event is dependent on the level of resilience (Abdulla and Birgisson, 2021).
Analytical methods for resilience find application in multiple aspects of social, economic, and technical spheres. These methods divide the system into multiple components (social and economic) and analyze them quantitatively by using properties like robustness, redundancy, and resourcefulness (Abdulla and Birgisson, 2021).
Fuzzy logic/inference methods have become a practical tool in hydrologic analysis and have overcome many of the drawbacks of probabilistic and deterministic methods in recent years. Fuzzy logic can incorporate multiple scenarios into mathematical models in the form of fuzzy interference. But fuzzy logic methods suffer from the drawback of requiring multiple fuzzy rules that are dependent on the variables and can be complicated. Because of these multiple rules, accurate interaction between few interdependent variables is difficult to assess in the analysis (Aziz et al., 2013; Zhou et al., 2015, 2016; Abdulla and Birgisson, 2021).
Graph theory uses statistical data for flood forecasting and is applied in assessing the resilience of infrastructure (or networks). It generates systematic graphs by using the data before and after the event. In case of a regional transportation system, graph theory measures the resilience by assuming the physical layouts of a transportation network as nodes and edges with links (Fournier Gabela and Sarmiento, 2020; Abdulla and Birgisson, 2021). The topological properties of a network applied by Zhang and Alipour (2019) for flood risk assessment can be an example of a graph theory approach. It relies on the physical layout and the connectivity of the network and the flow via links and nodes, in order to identify the inter-dependencies and vulnerabilities of the network. To assess the functionality of the network, alternate links, and connecting nodes are used if existing links fail.
Empirical modeling methods, like probabilistic methods, make use of the historical data of extreme events including surface measurements, surveys, interviews, aerial and satellite imagery, to generate flood maps, assess the flood impacts, and predict the flow. With recent advances and continuous research, this method is considered as robust and as accurate as is possible for a method based on past data. However, in empirical methods, even with the data availability, the flood flow can be under-represented due to the uncertainties involved and assumptions required for analysis (Teng et al., 2017). The approach adopted in Kinshasa in the Democratic Republic of Congo is an example of the empirical method (He et al., 2020).
Data requirements are generally very large in flood assessment methods and thus, many methods will employ multiple tools such as remote sensing, Geographic Information Systems (GIS), combined techniques of GIS-machine learning, hydrodynamic models, traffic models integrated with flood maps, and input-output models (Douglas et al., 2017; Pedrozo-Acuña et al., 2017; Sämann et al., 2019; Chen et al., 2020). These will often form an integral part of flood assessment methodology in the form of hybrid/combined methods used to assess flood impacts (direct and indirect) on transportation. The hybrid/combined methods suffer from the drawback of data requirements, processing time, and difficulty in representing changing weather conditions based on historical data (Lyu et al., 2016; Teng et al., 2017; Chen et al., 2020). Even with these drawbacks, the hybrid models are used in most flood assessments due to its fairly accurate representation of flood flow using physical datasets (data sets such as traffic flow, route maps, traffic volume, etc.) and flood impacted areas or infrastructure by using visual aids. The hybrid models can generate flood impact graphs with reduced accuracy through GIS even with limited and missing temporal data. Its integration with other methods such as graph theory for example, can estimate the vulnerabilities in the network with high precision.
The methods noted above provide an assessment of flood damage to infrastructure networks including the critical links and flood vulnerable regions. They can be applied in the decision making process for planning, design, and improving vulnerable links for increased resiliency in infrastructure networks (Teng et al., 2017).
Criteria for Choosing a Flood Assessment Method
Flood impacts can be classified into: short-term impacts such as property damage, risk to life, and transport failure, which are impacts that occur immediately after the flood; medium-term impacts resulting from contaminated flood waters, spread of disease, and environmental pollution, which are often observed sometime after the flood; and long-term impacts that involve economic consequences in and beyond the affected regions (Hammond et al., 2015) that arise long after the flood occurs. Because these terms are qualitative, for the present review, the temporal scales are defined as short-term when the flood impact assessment period ranges from 0 to 2 weeks from or post-flood; medium-term when the assessment period ranges from 2 weeks to 6 months; and long-term when the assessment period is longer than 6 months. These selected definitions are actually based on the review of flood assessment articles carried out in this paper. The authors reviewed the temporal scales and noted the general time frames adopted and the context. For articles with a flood analysis during the recovery period or after the flood with a temporal resolution of hours to days, are categorized as short-term. The articles with a temporal resolution ranging from days to weeks and whose assessment is carried out during post recovery period are categorized into medium-term. The articles whose assessment is carried out during adaptation, post-adaptation, and transition phases, or whose temporal resolution ranges from months to years, are categorized into long-term.
Based on the analyzed literature, the authors have classified the spatial scale networks into three categories: community scale involves assessments working at a characteristic length of <5 km; urban city scale assessments include residential networks ranging from 5 to 200 km; and regional scale refers to large-scale networks having a distance in the range of 200–1,000 km and greater. For the current spatial scale ranges, they are assigned by using the type of network assessed in the region/area and by using the range of the impact. The articles where specific communities were assigned and whose total area is <2 km2 are assigned a range <5 km at a community scale. The majority of the articles assessed here are for urban networks and for this case, the articles whose network area is largest is chosen as the larger end of the range, and any article whose assessment involves highway networks are assigned the regional scale. But defining the impacts of a flood on a specific infrastructure network can be difficult due to the sheer variety in the types of damage and conditions (economic, environmental, etc.) as well as the connecting links of the infrastructure, which are strongly interdependent in urban environments (Hammond et al., 2015). For example, maintenance costs of roads due to weather can range from 30 to 50% of total annual municipal costs with 10% reserved specifically for extreme events. But this does not include the cascading effects that the events cause on transportation like travel delays, congestion, etc. (Michielsen et al., 2016).
Flood assessment methods differ based on the scale, duration, and intensity of the event. Scale can refer to either the spatial or the temporal scale. Spatial scale is defined as the extent of an area or space where the event or observation takes place and temporal scale is the total time or duration the event/observation occurs (Fischer and Schumann, 2020; Valeo et al., 2021). Flood assessment requires the data and analyses at various spatial and temporal scales, i.e., area (local or local-regional or regional) and duration, respectively. For example, small scale rain events, even with limited spatial dimension, can cause floods in smaller catchments, whereas for a larger area or river, the rainfall needs greater spatial extent with increased duration in order to generate a flood scenario (Fischer and Schumann, 2020). These flood events (small and large), which display high variability in their peaks, durations, and volumes can result in damage to infrastructure, partial and complete closure of roads, increased travel times, and traffic congestion. All of which can impact transportation with intangible impacts to industry followed by indirect impacts (Fischer and Schumann, 2020). In addition, the temporal scale of a flood's impact can be measured or observed during the flood, immediately after, within hours, days, weeks, months, and even years. The choice of temporal scale over which to conduct a flood assessment, therefore, becomes markedly more complicated and involved as the temporal scale increases. But undoubtedly, there is a need for long-term flood impact assessments on infrastructure to properly plan for a future with climate change and increasing populations. It is also very important to note that underscoring all of this is the fact that very often, the data that are available to conduct the assessment will often dictate the temporal and spatial scale over which the assessment is made.
The primary objective of this article is to assess the literature for flood impact assessment methods and their applications from the perspective of what methods were used when and how often, and the temporal and spatial scales at which the applications were made. The multiple flood assessment terminology used in the current manuscript are based on the multiple articles assessed. Although there exist review articles that define and describe flood assessment methods, or flood impacts, etc., in the literature, to the authors' knowledge, there is no review that examines and connects the spatial scales, temporal scales, flood impacts, and assessment methods all together at once. By combining these criteria for this review, the authors attempt to bring insight into what gaps exist and why.
Review Methodology
Based on the terminology introduced in the previous sections, the literature review focuses on the flood assessment methods for determining the resiliency in transportation networks by using the flood impacts, i.e., direct, and indirect impacts, and the temporal and spatial scales as classification criteria. The review and analysis are carried out by using the guidelines provided in the PRISMA Protocol for Review Papers (www.prisma-statement.org/Extensions/Protocols accessed April, 2021). The articles are selected from multiple web sources like Google Scholar, ScienceDirect, and web portals of conferences and universities, and these articles are retrieved from library resources at the University of Victoria. The search is carried out by using the following keywords: flood impacts, flood temporal and spatial scale, flood disruption cost, flood traffic model, network disruption, flood risk management, flood direct and indirect impacts, flood impact scales, flood assessment methods, flood impact assessment methodology and flood classification, flood impact modeling, and flood vulnerability. The initial results obtained from the search were then refined by using the abstract, methods, and keywords, which was used as a starting point for refining the database of articles to be reviewed and cited. In the present case, book chapters were excluded, and the total number of articles selected (49) include two conference publications that were relevant to the present study. Of the 49 papers selected, only 30 papers were used for critical assessment and the remaining 19 papers were used for literature survey and for defining/describing the terminologies like spatial and temporal scales, and the assessment methods. The literature review framework is conducted in the following steps:
a) Articles are selected from multiple web sources and university library resources by using the keywords mentioned above.
b) The articles are then refined or eliminated by reading the abstracts and the conclusion. The articles which include contaminant transport, underground drainage system, underground transport systems like metro-systems are excluded as the scope is limited to only surface transport networks.
c) From the selection, conference papers and book chapters are excluded due to limited information or if the information is updated and available in other published sources.
d) From the selection, a full-scale reading and assessment of articles is conducted to determine if it contains information regarding the flood assessment methodologies.
e) A detailed analysis/synthesis of each article is carried out and the possible gaps are identified and described in later sections.
The literature is not limited to a specific part or area of the world and multiple regions that were impacted by floods especially transportation networks and critical infrastructure are considered. The majority of articles assessed in this review are published on or before 2020, with a few articles published in 2021. Apart from the abovementioned methods, there exist other multiple models like time series methods, space syntax theory, etc., which are based on the approaches mentioned above but are not discussed in detail in the present review due to limited data availability. Thus, even with the multitude article selection and multiple methodologies used herein, it is not impossible that the authors missed some of the very recent developments in publication queues regarding methodologies and models used in flood assessments.
Following this introduction, section Results provides a summary and analysis of the literature review of the impact of flooding on transportation resilience in the context of direct and indirect impacts as well the governing temporal and spatial scales. Articles are grouped and synthesized based on the methods used, identified scales, and the type of flood impact (direct vs. indirect). This information is used to identify gaps in the literature and recommendations for further research. This is followed by a discussion in section Discussions and finally the conclusions. The Supplementary Table 1 contains greater details of the literature review presented in section Results in the form of a table.
Results
To assess the literature, multiple articles were grouped and analyzed based on the type of method listed above in section Flood Impact Evaluation Methods. To provide insight into the advantages and disadvantages of each type, examples from the literature from each group are provided. This is then followed by an overall analysis and synthesis of the all the literature analyzed in this review.
Probabilistic Approach
Yin et al. (2016) and Pregnolato et al. (2017b) applied the probabilistic approach and developed a probability density function by using multiple flood return periods and traffic data, but assumed that the traffic data would be constantly updated during and after the flood, which can alter the results. Tsang and Scott (2020) noted from their flood analysis, that floods are proportional to the extent of population, which has direct implications to spatial scale. Wiśniewski et al. (2020) applied the probability density function along with an input-output model to analyse the indirect and tangible flood impacts but did not specify the increase in time due to rerouting processes, which can impact the assessment. Based on the assessment, it can be inferred that non-typical disruptions can impact mobility and accessibility of roads as well as traffic speed. Wang et al. (2020), applied the probabilistic approach for the highway network by assuming that the network is two way with no additional lanes or traffic and did not include local transport. Based on the assessment, impact remedies, and recommendations for the network were presented. Singh et al. (2018) used a probability density equation developed from traffic and climate data to propose that flood impacts can be dependent on the health of the infrastructure and that multiple, successive extreme events can decrease the overall resilience of the city and infrastructure. This can be attributed to the long-term temporal scale effects, which can impact the resilience and overall functioning of the transport network. Pant et al. (2018) applied the probabilistic approach to develop a structures-based flood risk assessment methodology for catchment wide infrastructure in an attempt to bridge the gaps in cascading effects assessment. Unfortunately, they did not provide any assessment for the intangible and indirect impacts, which can be significant flood impacts in this case. It should be noted that for depth disruption functions, the key metrics used are depth and velocity. In addition, measures such as flood duration, flow intensity, flood preparedness, etc., are often used but the influence of these multiple variables on flood dynamics is difficult to estimate due to the data scarcity as well as the spatial and temporal dynamics of these variables (Pregnolato et al., 2017b).
Analytical Approach and Fuzzy Inference Methods
In the present assessment, there were only a handful of articles using analytical approaches or fuzzy logic based methods. Serre and Heinzlef (2018) applied the combined analytical approach and hybrid models to analyse the resiliency of transport networks. They suggested that alternative methods need to be applied to increase the resiliency but did not mention any alternative approaches for this, nor the possible flood impacts on a resilient network. Pourghasemi et al. (2021) applied machine learning techniques and fuzzy theorems to generate flood susceptibility maps by using the data from public domain sources to generate counter measures for flood impacts. Schnebele et al. (2014) is one of the few works that focused on non-authoritative data like crowd-sourcing, public domains, etc., to generate the flood impacts on transportation networks. The typical advantage of using these data is that temporal gaps in the analysis could be identified and incorporated. The community mapping by Petersson et al. (2020) primarily focused on temporal scale flood analysis by using data from weeks post-flood. By using visual measurements, they attempted to analyse flood effects during and after the recovery phase. It provided a glimpse into the resiliency of critical links and the modification carried out during the recovery phase leading to possible increases in resiliency of the network. However, few of the articles incorporated new approaches to assess the flood impacts by considering a specific transport mode, a fixed network, or traffic count data.
Graph Theory
Graph theory uses statistical data for network mapping and assessment. It can be applied in flood assessments to identify the vulnerabilities of the transportation network and identify measures for resiliency of the network. Pregnolato et al. (2016) incorporated graph theory and flood depths on a road network to generate flood impacts and identify the critical links during flooding, but did not incorporate the time scale. Zhang and Alipour (2019) applied the topological properties of a network for risk assessment and functioning of the network under the threat of hazards utilizing graph theory. Fournier Gabela and Sarmiento (2020) was one of the first articles to use independent time series methods based on graph theory. In conjunction with automatic traffic counter data, they analyzed the flood impacts on highway transport by incorporating the time periods of weeks before the flood. Bíl et al. (2015) applied graph theory for multiple flood events to assess the direct flood impacts but limited data from traffic systems and the transport network after the events limited the results. Kalantari et al. (2019) used the physical parameters of soil and infrastructure to analyse flood impacts, but did not specify how these multiple characteristics of soil influenced the flood duration and impact. Although these multiple articles used graph theory for assessing flood impacts that were primarily direct, tangible, and intangible, there was less emphasis on the resilience of the network. Kalantari et al. (2017) applied graph theory on an urban network to identify the vulnerabilities in the network and used statistical data integrated with a GIS model to analyse flood effects including direct impacts on road transport infrastructure. Although Kalantari et al. (2017) applied a hybrid GIS model in the analysis for visual representation of vulnerabilities and identify any missing links resulting from graph theory approach, it is considered an example of graph theory approach. They did not include post flood effects in the assessment, which can be a drawback considering the multiple parameters and data used for the analysis.
Hybrid Models/Methods
The majority of the articles analyzed in the current review used hybrid models i.e., the combination of traffic model, GIS, hydrodynamic model along with the other approaches stated in the section Introduction. Traffic models which use a multitude of traffic data and network parameters are widely used for flood impact assessment of urban networks. Suarez et al. (2005) for example, used the integrated urban traffic model to assess urban flood impacts on transport networks by incorporating stable climatic conditions and multiple traffic model assumptions in the city of Boston. Based on this, the city was assessed as resilient but did not mention how the resilience was achieved and on what terms was it determined. Pregnolato et al. (2017a) analyzed the flood impacts by using flood depth vs. vehicular traffic as a criteria to perform flood risk assessment; but this excluded the minor network nodes, which can affect the outcome.
Diakakis et al. (2020), Wang et al. (2020), and Tsang and Scott (2020) also used a traffic model to assess flash flood impacts, direct and tangible impacts, and the temporal scale of the analysis ranged from hours to days. In these articles, traffic data was considered as the base, but they did not identify the vulnerable areas/points in the network due to the flood. Instead, they focused on the physical impacts to the infrastructure, transport network, and emergency response times. Diakakis et al. (2020) is primarily focused on social aspects but the perspective of people was not represented (e.g., the evacuation methods, difficulties faced, evacuation time, etc.). If these factors were included, it would provide a better picture for the planning department to provide alternate relief options and improve mobility services. In the traffic models used for the above-mentioned articles, it is not specified how the time factor based on rerouting, speed reduction, canceled trips etc., was calculated and analyzed. One of the objectives of the integrated traffic model is to assess the indirect and intangible flood impacts by using the available data like increase in commute time, traffic congestion, lost trips, etc. But most of the articles assessed here apply the model primarily for direct, tangible, and intangible impacts. When multiple, interdependent infrastructure, and cascading effects are involved, the hybrid traffic model does not provide a clear assessment for the same impacts. These interdependent infrastructure can further complicate the process for providing a clear assessment because losses (like supply chain disruptions, accessibility to services, etc.) are difficult to estimate even in monetary terms. Multiple articles ignored this fact. Although combined/hybrid models that include a traffic model are used extensively, the assumptions made in the analyses can reduce the accuracy and affect the results. A few of the drawbacks that can be attributed to the traffic models are the time scale of the data, rerouting distance, flood duration, and the range of possible flood impacts/effects.
In the hybrid models, Höffken et al. (2020) used a hydrodynamic model for flood simulation and was one of the few works that defined the uncertainties in flood modeling, analysis, and data processing. Yin et al. (2016) analyzed the fluvial flood effects and risk assessment by using an integrated traffic model and probability assessment methods at a regional scale, but any increase in scale from regional may not yield the same type of results and may require more complex data and analysis. Evans et al. (2020) evaluated the impacts of pluvial flooding on urban transport networks by considering the traffic signal data during rush hour with a time scale of 2 h and teleportation rules. But uncertainty in traffic signal data and non-inclusion of post flood data limited the resulting analysis in terms of flood impacts.
Apart from the traffic models, GIS based models are also used extensively as part of hybrid/combined models to generate flood maps and assess flood impacts. To define and estimate the indirect and intangible effects of flash floods, Pyatkova et al. (2019) used an integrated GIS and traffic model method implemented with a flood depth model to analyse the closed and open road networks. But due to limitations in data, lost trips, and the timescale used of hours, the analysis could not provide accurate information on the indirect effects.
Analyses of the Literature
The general distribution of the methods used for flood impact assessment in the literature is shown in Figure 3A. Based on the articles assessed, 59% of the articles used hybrid models (integrated traffic model, flood depth vs. traffic speed, GIS mapping, etc.), 17% of the articles used graph theory, 5% used empirical methods, 15% used probabilistic methods, 2% of the articles used analytical approaches, and 2% of the articles used fuzzy logic for the flood assessment and impacts of flooding on transportation. Excluding the cases in which hybrid models were used for data collection and to perform a flood assessment, in the present analysis, multiple articles using more than one form of approach separately, were counted more than once in Figure 3A. For instance, the article (Pourghasemi et al., 2021) is counted once for short-term impacts in Figure 3C, counted twice in Figure 3D i.e., once for community network and once for urban city network and for flood impacts in Figure 3B, it is counted once. For the methods, as it uses hybrid model and fuzzy interference system, it is included in both the methods in Figure 3A. This counting method is also applied in the analysis of flood impacts in Figure 3B. The flood impact distribution of the assessed articles given in Figure 3B show that 64% of the articles focused on direct and tangible impacts, 5% on direct and intangible impacts, 28% on indirect and tangible, and only 3% on indirect and intangible. The temporal scale distribution is shown in Figure 3C. From the figure, it can be inferred that 50% of articles use short-term, 40% use medium-term, and 10% use long-term analysis.
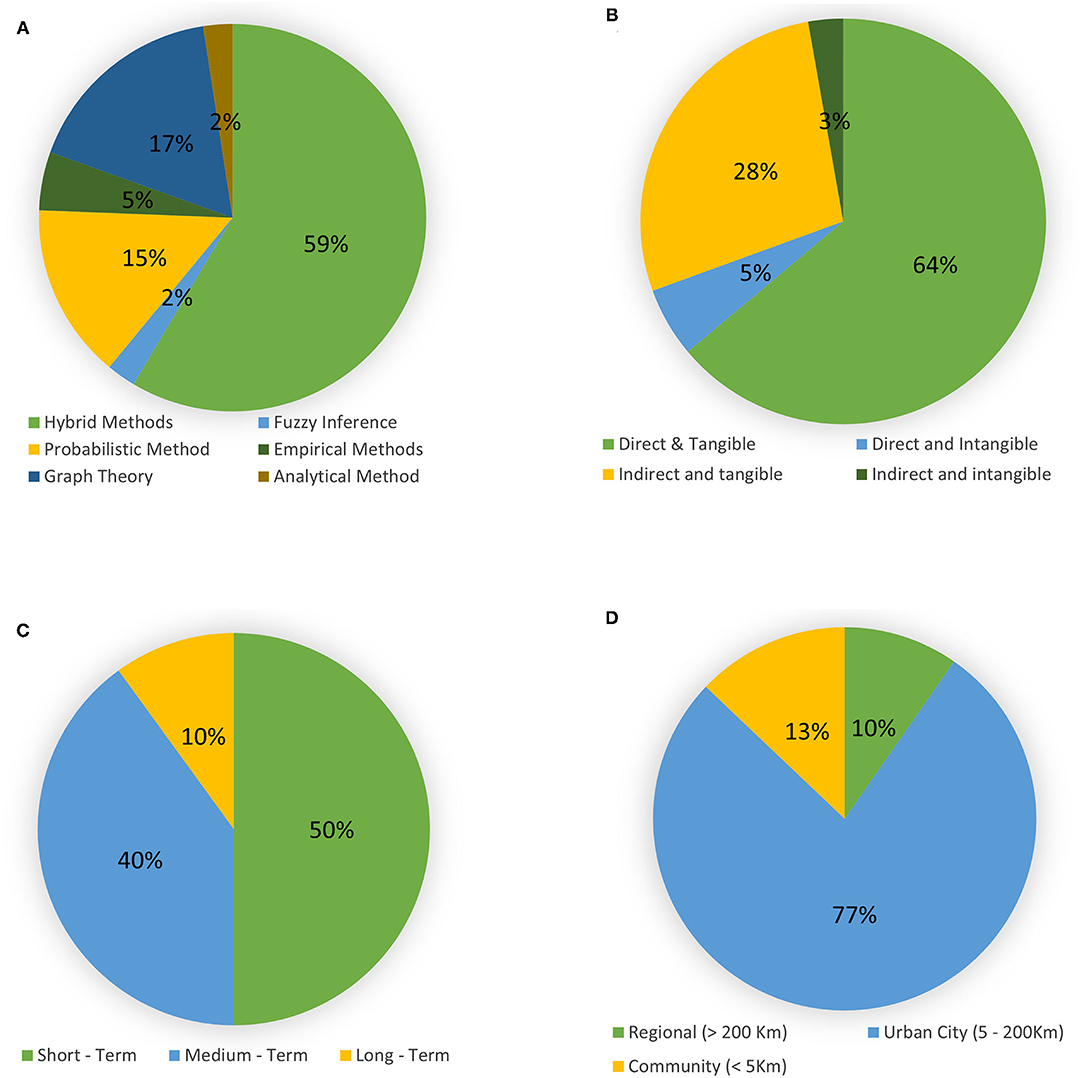
Figure 3. Distribution of (A) methods used for flood impact assessment, (B) articles assessing flood impacts, (C) articles assessing time scales, (D) articles assessing spatial scales.
Figure 3D provides a general assessment of the spatial scale networks seen in the analysis/assessment. From the figure, it can be inferred that 77% of the studies occur at the urban city scale, which is between 5 and 200 km. The smaller community, local spatial scale appears in 13% of the assessments and only 10% are conducted at the regional scale. Based on the literature, the majority of the spatial analysis used a single type of network—either an urban road or a highway. But there are limited articles that assess the flood impacts by integrating multiple transport networks of different types and scales. In the Supplementary Table 1 based on the assessed city, it is assumed that the urban network may also include local, small-scale residential road networks. The articles that specifically mention and analyse the residential network are noted in the “Comments” column.
A general distribution of flood impacts assessed in the literature, including the time scale and the assessment method applied, is shown in Figures 4A,B. In Figure 4B, the area of the circle increases with distribution of the assessed articles.
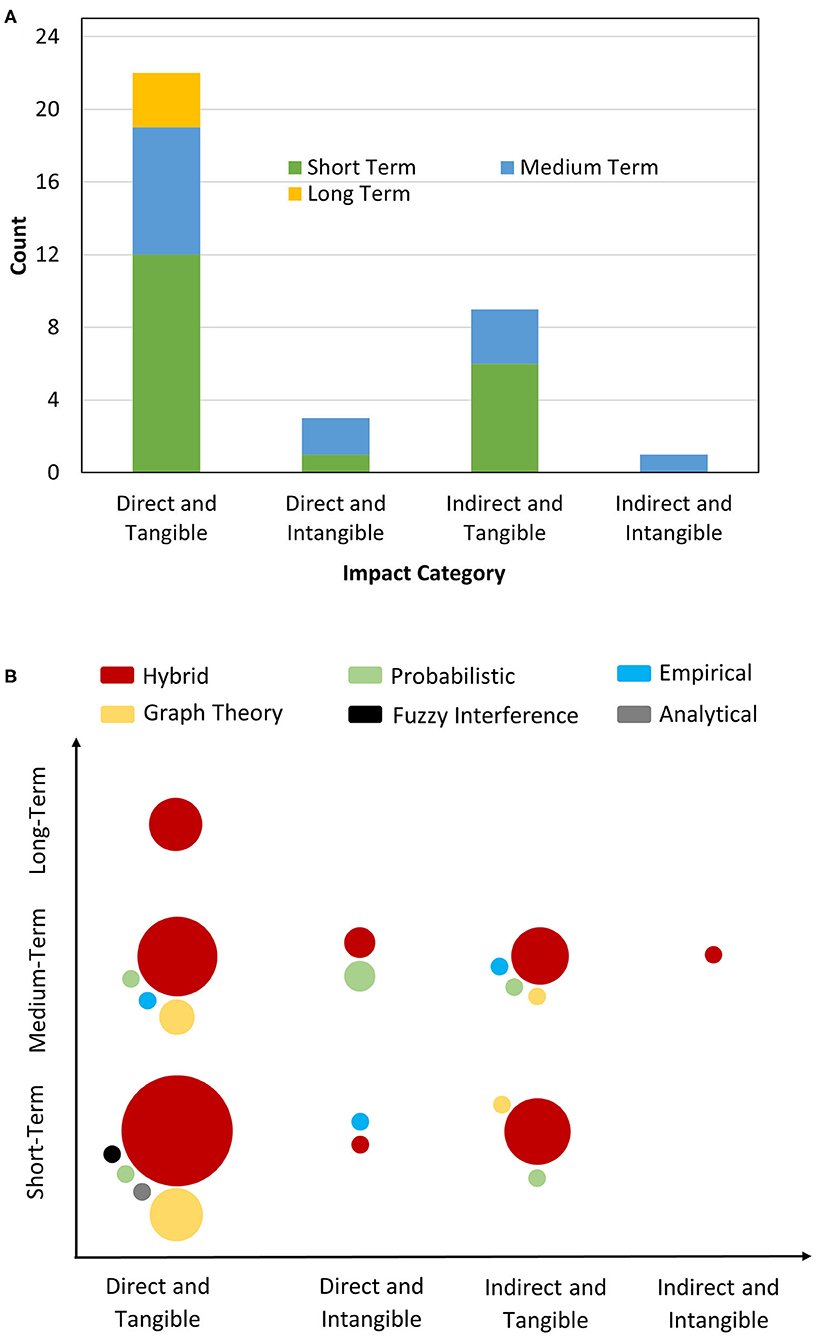
Figure 4. (A) Distribution of articles by flood impacts based and temporal scale (B) flood assessment method mapped over impact type and temporal scale.
Discussion
Flood modeling and resilience assessment requires precise data for accurate results, and this is difficult to achieve on a large spatial scale due to the assumptions in modeling techniques, uncertainties in modeling, the coarse data available at large spatial scales, and the sparsity of data at long time scales. But in comparison, local scales such as in controlled communities, can measure accurate data of multiple variables (including precipitation, climate change variations, traffic data etc.) with high resolution; thus, generating flood modeling maps for determining resilience with greater accuracy (Zischg and Bermúdez, 2020).
Rapid urbanization and increases in population have led to uncertainties in flood risk assessment like impacts in temporal and spatial variability, model formulation, and parameter estimation, which are difficult to quantify (Ahmad and Simonovic, 2013). In multiple scenarios, the flood inundation models/maps are not ideal for representing the effects of flooding on transportation systems because of the indirect impacts and cascading effects of water bodies on the roads. Advancement in computational and imaging programs such as GIS and geospatial technologies has resulted in modeling and flood forecasting for flood risk assessment use the intensive spatial and temporal databases available (Höffken et al., 2020). Modeling and simulation processes involve converting data such as precipitation into hydrographs for flood approximation or modeling through mathematical equations or physical means. Statistical analysis was frequently used for flood frequency estimation in the past but is now often accompanied by other methods due to the advancement of GIS techniques leading to the development of combined methodologies. The combined methodologies integrate multiple tools like GIS and remote sensing, with multiple models, simulations, statistical analyses or data, and machine learning methods to generate flood impact assessments (Diaconu et al., 2021). These assessments provide multiple flood scenarios that can be used to identify the vulnerability of an infrastructure and the possible affected areas in future scenarios and in turn, provide modifications for the network to reduce vulnerability to extreme events and increasing resilience.
Although most of the research focused on flood modeling and inundation, most of the floods that were analyzed had occurred almost a decade earlier with a few exceptions. But even with the possibility of multiple data being available, most of the articles analyzed the direct and tangible impacts and its subsequent effects on transportation and modeled future scenarios, which in turn can be used for flood resilience in urban areas.
The time scale range used for the flood duration, modeling, and analysis ranged from 60 to 200 min and the historical data leading to the flood (that is, rainfall, precipitation etc.) had a temporal range of 6 weeks before, and after the flood, with few articles using the historical data from the previous decade to predict future flood scenarios and incorporate flood resilience in the structures. Data collection through community mapping post-flood with a time span of 6 weeks provided an initial assessment of flood effects on small communities in the long-term. Although the time scale can predict the flood impacts with multiple return periods, it cannot provide an accurate description of the long-term impacts of the flood on the infrastructure network and its influence on the network resilience post flood recovery or years from the event.
In comparison to spatial scale analysis, limited research is conducted on temporal scale flood analysis. This can be attributed to the lack of data or assessment methodologies that can be applied to estimate the indirect and intangible impacts. With the repeated prediction of increases in floods in the coming years due to climate change, the need to make cities, transportation networks, and infrastructure resilient to extreme events is greater than ever. With the increase in urbanization and transportation networks expected, the vulnerable links in transportation are constantly changing, because the overall resilience of the network can be compromised. But a long-term post flood analysis with a temporal resolution ranging from months to years can potentially identify the existing vulnerabilities in the transport network. The results can be used to identify the measures to be taken to increase the resilience of the networks.
Few of the articles ignored the physical damage to the roads caused by the flow velocity and multiple articles included specific type of vehicles in their analysis due to which traffic scenario assumptions for full or partial road closure are applied. But, inclusion of a multitude of vehicle types like freight, public, and private transport, can provide a scenario where the increased traffic costs can be assessed accurately. In terms of resilience, it is not clearly specified if increasing the resilience of a few critical links can decrease the overall impact of floods on the transport network. Apart from this, they did not specify how the transport networks are impacted with change in intensity of flood and if the regional traffic models can be applied to national level analysis.
Even with multiple methods and studies, the complete evaluation and understanding of flood effects (specifically indirect and intangible) on transportation infrastructure and communities is limited due to the cascading effects and interdependence of multiple networks/infrastructures; but studies are on-going to address these. From Figure 3C, we can infer that one of the areas in which most of the articles do not focus on is the long-term effects of floods on transportation. As evident from Figure 3B, the majority of articles focus on flood modeling and direct flood impacts on transportation, and very few focusing on indirect and intangible impacts. Even the articles defining the indirect and intangible impacts do not provide any assessment and evaluation method for this impact. Also, the articles assessed have floods originating almost a decade before and few articles which assessed the same flood in recent times did not mention if the flood that occurred a decade earlier had any influence in present infrastructure shaping or resilience. Apart from these, the post flood recovery time period and its subsequent effects on the transportation network was not considered in the assessment.
One of the possible reasons why long-term temporal scales in flood assessment were not given importance thus far may be due to the general fact that in post flood recovery, most of the networks were able to function normally with little disturbances. This resulted in multiple works overlooking the possibility of flood impacts on the transportation system years or possibly decades after the flood. However, in recent years, increased perception toward transport networks and the cascading effects that arise from these events resulted in multiple researchers focusing on, and including, temporal effects in the assessments.
Even with increasing studies in flood modeling and flood resilience, the literature falls short in addressing the issues pertaining to vulnerability and resilience of transport networks. Although the primary focus is on the road transport network, transport modes like cycling, walking, etc., which form an integral part of transport network, are overlooked in the assessment. To reduce the vulnerabilities of a network, multiple short and long-term measures are adopted. In the socio-ecological context, vulnerabilities cannot be removed completely but can alter the configuration of infrastructure resources, implying a shift in space and time of vulnerabilities. One of the possible objectives to fill the gaps in the literature on flood assessments of transportation is by addressing the true cost of flooding by incorporating and/or exploring a methodology that considers the short-term, long-term, direct, indirect, tangible, and intangible impacts of floods all together. This can provide an estimate of the network and critical link damage and can be used as a base for planning or improving resilience. Additionally, other issues in the present literature are that there are not enough suggestions provided to increase the resilience of critical links to mitigate flood impacts. The few articles that suggested increasing resiliency to reduce the vulnerabilities of a network did not provide any assessment or possible discussion on the improved network. They also overlooked the changes in flood impacts and flood flow with the modified resilient network. For computing the intangible effects, incorporating data from multiple sources like insurance corporations in the probabilistic methods may provide better assessments.
Conclusions
Transportation, which is a critical infrastructure in the present economy is vulnerable to extreme events like floods. Direct flood impacts on the transportation network are an often-researched area in flood assessment criteria. In comparison, indirect and intangible flood impacts, which are defined vaguely and having no specific methodology, are difficult to estimate and are a less researched area. Flood impact assessments can be conducted using multiple methodologies like probabilistic, analytical, fuzzy logic/inference, graph theory, and empirical methods and the assessment varies by spatial and temporal scale and available data used. Even with the presence of multiple models and methods, the majority of research is concentrated on direct and tangible impact assessment by using spatial scale as a criterion. One of the aspects where the research falls short is the inclusion of temporal scale analysis (long-term specifically) in the flood modeling, and in computation and assessment of indirect and intangible impacts in monetary terms. This can be attributed to the uncertainties in modeling and coarse data availability. The inclusion of temporal scales with accurate data over the long-term in flood modeling can provide a better approach to monitor and model how the flood effects vary on road transportation over time. In addition, the inclusion of post flood recovery periods and its subsequent effects as part of indirect impacts can bridge the gap of information on the indirect impacts of floods.
Author Contributions
AR, CV, and JH contributed to conception and design of the study. AR assembled and organized the database, conducted the synthesis and analysis, and wrote the first draft of the manuscript. AR, CV, JH, and SS wrote sections of the manuscript. All authors contributed to manuscript revision, read, and approved the submitted version.
Funding
This research was funded through an NSERC CREATE Grant (CREATE/511060-2018) led by Prof. Lina Kattan of the University of Calgary.
Conflict of Interest
The authors declare that the research was conducted in the absence of any commercial or financial relationships that could be construed as a potential conflict of interest.
Publisher's Note
All claims expressed in this article are solely those of the authors and do not necessarily represent those of their affiliated organizations, or those of the publisher, the editors and the reviewers. Any product that may be evaluated in this article, or claim that may be made by its manufacturer, is not guaranteed or endorsed by the publisher.
Supplementary Material
The Supplementary Material for this article can be found online at: https://www.frontiersin.org/articles/10.3389/frsc.2021.732181/full#supplementary-material
References
Abdulla, B., and Birgisson, B. (2021). Characterization of vulnerability of road networks to random and nonrandom disruptions using network percolation approach. J. Comput. Civ. Eng. 35:04020054. doi: 10.1061/(asce)cp.1943-5487.0000938
Ahmad, S. S., and Simonovic, S. P. (2013). Spatial and temporal analysis of urban flood risk assessment. Urban Water J. 10, 26–49. doi: 10.1080/1573062X.2012.690437
Aziz, K., Rahman, A., Shamseldin, A. Y., and Shoaib, M. (2013). Co-active neuro fuzzy inference system for regional flood estimation in Australia co-active neuro fuzzy inference system for regional flood estimation in Australia 1. J. Hydrol. Environ. Res. 1, 11–19.
Bíl, M., Vodák, R., Kubeček, J., Bílová, M., and Sedoník, J. (2015). Evaluating road network damage caused by natural disasters in the Czech Republic between 1997 and 2010. Transp. Res. A Policy Pract. 80, 90–103. doi: 10.1016/j.tra.2015.07.006
Chelleri, L., Waters, J. J., Olazabal, M., and Minucci, G. (2015). Resilience trade-offs: addressing multiple scales and temporal aspects of urban resilience. Environ. Urban. 27, 181–198. doi: 10.1177/0956247814550780
Chen, G., Hou, J., Zhou, N., Yang, S., Tong, Y., Su, F., et al. (2020). High-resolution urban flood forecasting by using a coupled atmospheric and hydrodynamic flood models. Front. Earth Sci. 8:545612. doi: 10.3389/feart.2020.545612
de Moel, H., Jongman, B., Kreibich, H., Merz, B., Penning-Rowsell, E., and Ward, P. J. (2015). Flood risk assessments at different spatial scales. Mitig. Adapt. Strateg. Glob. Chang. 20, 865–890. doi: 10.1007/s11027-015-9654-z
Diaconu, D. C., Costache, R., and Popa, M. C. (2021). An overview of flood risk analysis methods. Water (Switzerland) 13, 1–13. doi: 10.3390/w13040474
Diakakis, M., Boufidis, N., Salanova Grau, J. M., Andreadakis, E., and Stamos, I. (2020). A systematic assessment of the effects of extreme flash floods on transportation infrastructure and circulation: the example of the 2017 Mandra flood. Int. J. Disaster Risk Reduct. 47:101542. doi: 10.1016/j.ijdrr.2020.101542
Dong, S., Esmalian, A., Farahmand, H., and Mostafavi, A. (2020). An integrated physical-social analysis of disrupted access to critical facilities and community service-loss tolerance in urban flooding. Comput. Environ. Urban Syst. 80:101443. doi: 10.1016/j.compenvurbsys.2019.101443
Douglas, E., Jacobs, J., Hayhoe, K., Silka, L., Daniel, J., Collins, M., et al. (2017). Progress and challenges in incorporating climate change information into transportation research and design. J. Infrastruct. Syst. 23:04017018. doi: 10.1061/(asce)is.1943-555x.0000377
Esposito, G., Matano, F., and Scepi, G. (2018). Analysis of increasing flash flood frequency in the densely urbanized coastline of the campi flegrei volcanic area, Italy. Front. Earth Sci. 6:63. doi: 10.3389/feart.2018.00063
Evans, B., Chen, A. S., Djordjević, S., Webber, J., Gómez, A. G., and Stevens, J. (2020). Investigating the effects of pluvial flooding and climate change on traffic flows in Barcelona and Bristol. Sustainability 12:2330. doi: 10.3390/su12062330
Fischer, S., and Schumann, A. (2020). Spatio-temporal consideration of the impact of flood event types on flood statistic. Stoch. Environ. Res. Risk Assess. 34, 1331–1351. doi: 10.1007/s00477-019-01690-2
Forero-Ortiz, E., Martínez-Gomariz, E., and Cañas Porcuna, M. (2020). A review of flood impact assessment approaches for underground infrastructures in urban areas: a focus on transport systems. Hydrol. Sci. J. 65, 1–13. doi: 10.1080/02626667.2020.1784424
Fournier Gabela, J. G., and Sarmiento, L. (2020). The effects of the 2013 floods on Germany's freight traffic. Transp. Res. Part D Transp. Environ. 82:102274. doi: 10.1016/j.trd.2020.102274
Hammond, M. J., Chen, A. S., Djordjević, S., Butler, D., and Mark, O. (2015). Urban flood impact assessment: a state-of-the-art review. Urban Water J. 12, 14–29. doi: 10.1080/1573062X.2013.857421
He, Y., Thies, S., Avner, P., and Rentschler, J. (2020). The Impact of Flooding on Urban Transit and Accessibility A Case Study of Kinshasa. Washington, DC. Available online at: https://openknowledge.worldbank.org/handle/10986/34981 (accessed November 2020).
Höffken, J., Vafeidis, A. T., MacPherson, L. R., and Dangendorf, S. (2020). Effects of the temporal variability of storm surges on coastal flooding. Front. Mar. Sci. 7:98. doi: 10.3389/fmars.2020.00098
Kalantari, Z., Cavalli, M., Cantone, C., Crema, S., and Destouni, G. (2017). Flood probability quantification for road infrastructure: data-driven spatial-statistical approach and case study applications. Sci. Total Environ. 581–582, 386–398. doi: 10.1016/j.scitotenv.2016.12.147
Kalantari, Z., Ferreira, C. S. S., Koutsouris, A. J., Ahmer, A. K., Cerdà, A., and Destouni, G. (2019). Assessing flood probability for transportation infrastructure based on catchment characteristics, sediment connectivity and remotely sensed soil moisture. Sci. Total Environ. 661, 393–406. doi: 10.1016/j.scitotenv.2019.01.009
Lyu, H. M., Wang, G. F., Shen, J. S., Lu, L. H., and Wang, G. Q. (2016). Analysis and GIS mapping of flooding hazards on 10 May 2016, Guangzhou, China. Water (Switzerland) 8, 1–17. doi: 10.3390/w8100447
Michielsen, A., Kalantari, Z., Lyon, S. W., and Liljegren, E. (2016). Predicting and communicating flood risk of transport infrastructure based on watershed characteristics. J. Environ. Manage. 182, 505–518. doi: 10.1016/j.jenvman.2016.07.051
Pant, R., Thacker, S., Hall, J. W., Alderson, D., and Barr, S. (2018). Critical infrastructure impact assessment due to flood exposure. J. Flood Risk Manag. 11, 22–33. doi: 10.1111/jfr3.12288
Pedrozo-Acuña, A., Moreno, G., Mejía-Estrada, P., Paredes-Victoria, P., Breña-Naranjo, J. A., and Meza, C. (2017). Integrated approach to determine highway flooding and critical points of drainage. Transp. Res. D Transp. Environ. 50, 182–191. doi: 10.1016/j.trd.2016.11.004
Petersson, L., ten Veldhuis, M. C., Verhoeven, G., Kapelan, Z., Maholi, I., and Winsemius, H. C. (2020). Community mapping supports comprehensive urban flood modeling for flood risk management in a data-scarce environment. Front. Earth Sci. 8:304. doi: 10.3389/feart.2020.00304
Pourghasemi, H. R., Amiri, M., Edalat, M., Ahrari, A. H., Panahi, M., Sadhasivam, N., et al. (2021). Assessment of urban infrastructures exposed to flood using susceptibility map and google earth engine. IEEE J. Sel. Top. Appl. Earth Obs. Remote Sens. 14, 1923–1937. doi: 10.1109/JSTARS.2020.3045278
Pregnolato, M., Ford, A., Glenis, V., Wilkinson, S., and Dawson, R. (2017a). Impact of climate change on disruption to urban transport networks from pluvial flooding. J. Infrastruct. Syst. 23:04017015. doi: 10.1061/(asce)is.1943-555x.0000372
Pregnolato, M., Ford, A., Robson, C., Glenis, V., Barr, S., and Dawson, R. (2016). Assessing urban strategies for reducing the impacts of extreme weather on infrastructure networks. R. Soc. Open Sci. 3:160023. doi: 10.1098/rsos.160023
Pregnolato, M., Ford, A., Wilkinson, S. M., and Dawson, R. J. (2017b). The impact of flooding on road transport: A depth-disruption function. Transp. Res. D Transp. Environ. 55, 67–81. doi: 10.1016/j.trd.2017.06.020
Pyatkova, K., Chen, A. S., Butler, D., Vojinović, Z., and Djordjević, S. (2019). Assessing the knock-on effects of flooding on road transportation. J. Environ. Manage. 244, 48–60. doi: 10.1016/j.jenvman.2019.05.013
Saidi, S., Kattan, L., Jayasinghe, P., Hettiaratchi, P., and Taron, J. (2018). Integrated infrastructure systems — a review. Sustain. Cities Soc. 36, 1–11. doi: 10.1016/j.scs.2017.09.022
Sämann, R., Graf, T., and Neuweiler, I. (2019). Modeling of contaminant transport during an urban pluvial flood event – the importance of surface flow. J. Hydrol. 568, 301–310. doi: 10.1016/j.jhydrol.2018.10.002
Schnebele, E., Cervone, G., and Waters, N. (2014). Road assessment after flood events using non-authoritative data. Nat. Hazards Earth Syst. Sci. 14, 1007–1015. doi: 10.5194/nhess-14-1007-2014
Serre, D., and Heinzlef, C. (2018). Assessing and mapping urban resilience to floods with respect to cascading effects through critical infrastructure networks. Int. J. Disaster Risk Reduct. 30, 235–243. doi: 10.1016/j.ijdrr.2018.02.018
Singh, P., Sinha, V. S. P., Vijhani, A., and Pahuja, N. (2018). Vulnerability assessment of urban road network from urban flood. Int. J. Disaster Risk Reduct. 28, 237–250. doi: 10.1016/j.ijdrr.2018.03.017
Suarez, P., Anderson, W., Mahal, V., and Lakshmanan, T. R. (2005). Impacts of flooding and climate change on urban transportation: a systemwide performance assessment of the Boston Metro Area. Transp. Res. D Transp. Environ. 10, 231–244. doi: 10.1016/j.trd.2005.04.007
Teng, J., Jakeman, A. J., Vaze, J., Croke, B. F. W., Dutta, D., and Kim, S. (2017). Flood inundation modelling: a review of methods, recent advances and uncertainty analysis. Environ. Model. Softw. 90, 201–216. doi: 10.1016/j.envsoft.2017.01.006
Tsang, M., and Scott, D. M. (2020). An integrated approach to modeling the impact of floods on emergency services: a case study of Calgary, Alberta. J. Transp. Geogr. 86:102774. doi: 10.1016/j.jtrangeo.2020.102774
Valeo, C., He, J., and Kasiviswanathan, K. S. (2021). Urbanization under a changing climate-impacts on hydrology. Water (Switzerland) 13, 3–6. doi: 10.3390/w13040393
Wang, S., and Reed, D. A. (2017). Vulnerability and robustness of civil infrastructure systems to hurricanes. Front. Built Environ. 3:60. doi: 10.3389/fbuil.2017.00060
Wang, W., Yang, S., Gao, J., Hu, F., Zhao, W., and Stanley, H. E. (2020). An integrated approach for assessing the impact of large-scale future floods on a highway transport system. Risk Anal. 40, 1780–1794. doi: 10.1111/risa.13507
Wang, W., Yang, S., Stanley, H. E., and Gao, J. (2019). Local floods induce large-scale abrupt failures of road networks. Nat. Commun. 10, 1–11. doi: 10.1038/s41467-019-10063-w
Wiśniewski, S., Kowalski, M., and Borowska-Stefańska, M. (2020). Flooding and mobility: a polish analysis. Environ. Hazards 20, 1–23. doi: 10.1080/17477891.2020.1810608
Yin, J., Yu, D., Yin, Z., Liu, M., and He, Q. (2016). Evaluating the impact and risk of pluvial flash flood on intra-urban road network: a case study in the city center of Shanghai, China. J. Hydrol. 537, 138–145. doi: 10.1016/j.jhydrol.2016.03.037
Zhang, N., and Alipour, A. (2019). Integrated framework for risk and resilience assessment of the road network under inland flooding. Transp. Res. Rec. 2673, 182–190. doi: 10.1177/0361198119855975
Zhou, Y., Huang, G., and Baetz, B. W. (2016). Multilevel factorial fractional programming for sustainable water resources management. J. Water Resour. Plan. Manag. 142:04016063. doi: 10.1061/(ASCE)WR.1943-5452.0000711
Zhou, Y., Huang, G., Wang, S., Li, Z., and Zhou, Y. (2015). Factorial fuzzy programming for planning water resources management systems. J. Environ. Plan. Manage. 59, 1855–1872. doi: 10.1080/09640568.2015.1093924
Keywords: transportation network, resiliency, flood impact assessment, temporal scales, spatial scales
Citation: Rebally A, Valeo C, He J and Saidi S (2021) Flood Impact Assessments on Transportation Networks: A Review of Methods and Associated Temporal and Spatial Scales. Front. Sustain. Cities 3:732181. doi: 10.3389/frsc.2021.732181
Received: 28 June 2021; Accepted: 18 August 2021;
Published: 21 September 2021.
Edited by:
Zoe Li, McMaster University, CanadaCopyright © 2021 Rebally, Valeo, He and Saidi. This is an open-access article distributed under the terms of the Creative Commons Attribution License (CC BY). The use, distribution or reproduction in other forums is permitted, provided the original author(s) and the copyright owner(s) are credited and that the original publication in this journal is cited, in accordance with accepted academic practice. No use, distribution or reproduction is permitted which does not comply with these terms.
*Correspondence: Caterina Valeo, dmFsZW9AdXZpYy5jYQ==