 Girish Rentala
 Yimin Zhu
 Supratik Mukhopadhyay2
- 1Department of Construction Management, Louisiana State University, Baton Rouge, LA, United States
- 2Department of Computer Science, Louisiana State University, Baton Rouge, LA, United States
Identification and quantitative understanding of factors that influence occupant energy behavior and thermal state during the design phase are critical in supporting effective energy-efficient design. To achieve this, immersive virtual environments (IVEs) have recently shown potential as a tool to simulate occupant energy behaviors and collect context-dependent behavior data for buildings under design. On the other hand, prior models of occupant energy behaviors and thermal states used correlation-based approaches, which failed to capture the underlying causal interactions between the influencing factors and hence were unable to uncover the true causing factors. Therefore, in this study, the authors investigate the applicability of causal inference for identifying the causing factors of occupant/participant energy behavioral intentions and their thermal states in IVE condition and compare those results with the baseline in-situ condition. The energy behavioral intentions here are a proximal antecedent of actual energy behaviors. A set of experiments involving 72 human subjects were performed through the use of a head-mounted device (HMD) in a climate chamber. The subjects were exposed to three different step temperatures (cool, neutral, warm) under an IVE and a baseline in-situ condition. Participants' individual factors, behavioral factors, skin temperatures, virtual experience factors, thermal states (sensation, acceptability, comfort), and energy behavioral intentions were collected during the experiments. Structural causal models were learnt from data using the elicitation method in conjunction with the PC-Stable algorithm. The findings show that the causal inference framework is a potentially effective method for identifying causing factors of thermal states and energy behavioral intentions as well as quantifying their causal effects. In addition, the study shows that in IVE experiments, the participants' virtual experience factors such as their immersion, presence, and cybersickness were not the causing factors of thermal states and energy behavioral intentions. Furthermore, the study suggests that participants' behavioral factors such as their attitudes toward energy conservation and perceived behavioral control to conserve energy were the causing factors of their energy behavioral intentions. Also, the indoor temperature was a causing factor of general thermal sensation and overall skin temperature. The paper also discusses other findings, including discrepancies, limitations of the study, and recommendations for future studies.
Introduction
Occupants interact with the components of building systems in a variety of ways to achieve their desired comfort level, thereby influencing the indoor environment and overall energy use of the buildings. These interactions differ greatly between individuals, resulting in wide variations in the conditions of indoor environments and building energy use (Clevenger et al., 2014; Delzendeh et al., 2017). State-of-the-art studies and extensive literature reviews confirm that accurate occupant energy behavior analysis during design is critical to closing the gap between expected and real building energy efficiency (Maier et al., 2009; Fabi et al., 2013b; Martinaitis et al., 2015; Schakib-Ekbatan et al., 2015; Calì et al., 2016; Yang et al., 2016). This energy behavior is influenced by many factors. Some are objective factors such as temperature and climate (Nisiforou et al., 2012); others are subjective factors such as occupant thermal states (e.g., sensation, comfort, and acceptability) (Nisiforou et al., 2012; Hong et al., 2015). Determining the influential factors in occupant energy behavior analysis is essential for achieving better sustainable building designs.
Many studies have developed methods and tools for analyzing occupant energy behavior and thermal states by considering various influencing factors (Frontczak and Wargocki, 2011; Yan et al., 2015). Multivariable models such as logistic regression, principal component analysis, and probit analysis have been applied to estimate the occupant's energy behavior using factors such as indoor and outdoor temperature, time of day, occupancy patterns, and occupants' individual characteristics (Rijal et al., 2008; Yun and Steemers, 2008; Zhang and Barrett, 2012; Fabi et al., 2013a; Van Der Lans et al., 2013; D'Oca et al., 2014; Ren et al., 2014; Gunay et al., 2018; Vogiatzi et al., 2018; Belazi et al., 2019; Bruce-Konuah et al., 2019). Whereas for analyzing the occupant thermal states, a non-linear multiple regression model was developed with influential factors such as mean skin temperature and time differences (Takada et al., 2013), and a logistic regression model was developed with influential factors such as indoor temperatures, air quality, and noise levels (Alm et al., 1999; Wong et al., 2008; Lai et al., 2009). Probit and linear regression analysis were also used to evaluate participants' comfort in a climate chamber as a function of operative temperatures, perceived air quality, and noise decibel level (Clausen et al., 1993). Furthermore, existing predictive approaches such as deep learning (Goodfellow et al., 2016; Chokwitthaya et al., 2019, 2021; Liu et al., 2019) only captured associations. Also, statistical tests such as t-tests and correlation coefficients allowed the comparison of thermal sensation between real and virtual environments using indoor air and skin temperatures (Yeom et al., 2019a). Overall, the conventional modeling methods of occupant energy behavior and thermal states discussed above are based on the existing paradigm focusing on associations between influential factors and outcome (such as behavior or thermal states).
Associations such as correlations are typically made up of a mix of causal relationships and non-causal relationships (Aldrich, 1995). A causal relationship exists between two factors if the occurrence of the first causes the occurrence of the second. The first event is referred to as the cause, while the second event is referred to as the effect (Pearl, 2009a; Morgan and Winship, 2014). Causal inference determines true causal relationships by blocking all non-causal relationships in correlations under certain conditions. This is important because correlations only record the co-occurrence of influential factors and the outcome and rarely provide a reasonable interpretation for predictions (Hofman et al., 2017). For example, there may be a strong correlation between occupant gender and thermostat set-point adjustment, making gender a useful predictor of thermostat behavior (Andersen et al., 2009). However, gender may not provide a reasonable interpretation for thermostat behavior because it is not always a direct cause (Abrahamse and Steg, 2011). In fact, the causes of thermostat behavior, such as indoor air temperature (Gunay et al., 2018), could provide a reasonable interpretation for the prediction of thermostat behavior. Furthermore, the correlation-based statistical models assume non-multicollinearity among the influential factors implying that the influential factors should be independent of each other. However, occupant energy behavior and thermal states are mutually influenced by environmental, physiological, and individual factors (Schweiker et al., 2020). The important causal interactions between those factors, which contribute to the behavior and thermal states, have been overlooked in existing studies. As a result, more integrated modeling tools are needed to enhance decision-making by providing fresh insights into the interactions between behavior, thermal states, environmental, physiological, and individual factors. Causal models are appropriate for this task because they graphically represent the dependencies between factors using probability distributions generated from empirical data or domain (expert) knowledge. This makes it easier to identify the causal interactions among a diverse set of influential factors and outcomes (Korb and Nicholson, 2010; Nabijiang et al., 2019). Moreover, causal models permit the updating of prior knowledge based on the new evidence (experimental or field data) and help researchers develop study designs by establishing specific guidelines for determining which factors should be included/controlled for (Yao et al., 2020).
In the last few years, the application of immersive virtual environments (IVEs) to investigate the influence of design decisions on occupants has emerged (Maldovan et al., 2006; Vilar et al., 2014; Kuliga et al., 2015). In IVEs, the participants are completely immersed in a simulated representation of the real world, through which they can interact with and picture real world actions and situations (Niu et al., 2016). Thus, the use of IVE technologies could be highly advantageous to explore human behavior in buildings under design in terms of cost/time performance and producing context-aware data for occupant energy behavior studies (Kuliga et al., 2015). Applications of IVEs in building design and operation have shown to be successful, particularly for studying occupant thermal states (Yeom et al., 2019a,b), daylight (Heydarian et al., 2015; Chamilothori et al., 2016, 2019), and energy simulations (Bahar et al., 2013). IVEs have also been used to simulate sound and acoustics levels in new infrastructures (Ruotolo et al., 2013) and to explore the occupant's evacuation waiting times and exit choices using elevators during an emergency (Andrée et al., 2016). Yet, it is crucial to verify if the occupant/participant responses in the IVEs are comparable to those in in-situ environments when using IVEs for analyzing energy behaviors and thermal states. However, the above IVE studies, specifically the thermal state and daylight studies, used parametric/non-parametric statistical tests and correlation analyses to validate if the participant responses in IVEs were comparable to those in the in-situ environments. These studies did not use causal models to investigate the causal relationships and check if the causing factors of occupant energy behaviors and thermal states in IVEs were comparable to those in in-situ. Also, the existing IVE studies failed to examine the causal relationships between the virtual experience factors (such as presence, cybersickness, and immersive tendencies in IVEs) and energy behaviors and thermal states.
In this paper, the authors intend to study the application of causal inference to identify the causing factors of occupant energy behavioral intentions and thermal states in both IVE and in-situ conditions and understand their effects quantitatively. To the best of the author's knowledge, such a framework has not been applied before in IVE based occupant energy behavior studies. The major contributions of this study include:
• A causal inference framework to coherently integrate major steps for creating, validating, and interpreting structure causal models (SCMs). This framework is flexible and adaptive because it is data-driven and can encompass a wide range of factors, and
• Application of the causal inference framework to identify the causing factors of occupant/participant thermal states and energy behavioral intentions in both IVE and in-situ conditions. Consequently, the application supports causal analysis for each condition and a comparison of causal analyses results between them.
This paper is organized as follows: in Background section, the authors first discuss relevant factors that influence occupant energy behaviors, thermal states, and the users' virtual environment experience. In Overview of Causal Inference Framework section, the authors discuss the causal inference framework, which includes five key steps, i.e., initial factor selection and description, causal model specification, causal effect estimation, causal model validation, and interpretation of results. In Data Collection Tools, Recruitment and Experiment Procedure section, the authors describe the data collection tools, recruitment, and experiment procedure. In Application of Causal Inference section, the authors discuss the implementation of the framework on the experimental data. Finally, the authors in Results Interpretation and Discussion, Limitations and Conclusions interpret and discuss the results, limitations, conclusions, and future work, respectively.
Background
This section summarizes the key factors driving occupant energy behaviors and thermal states along with their common modeling approaches.
Key Factors Affecting Occupant Energy Behavior
The most important impacts on occupant energy behaviors are environmental factors such as indoor air temperature (Parsons, 2002; Cui et al., 2013; ANSI/ASHRAE, 2017). Several studies have reported that indoor air temperature has a substantial impact on occupant energy behaviors like thermostat adjustments for heating/cooling (Bae and Chun, 2009; Lin et al., 2016), turning on/off AC (Bae and Chun, 2009; Ren et al., 2014), window opening/closing (Haldi and Robinson, 2008, 2009; Yun and Steemers, 2008; Yun et al., 2008, 2009), drinking cold/hot beverages (Haldi and Robinson, 2008, 2011), desk fan usage (Haldi and Robinson, 2008), adjusting body posture (Schweiker et al., 2017), and adjusting clothing (Haldi and Robinson, 2008). Occupant thermal sensations under different indoor air temperatures also affect their energy behavior (Bonte et al., 2014). Individual factors of occupants, which are further classified into psychological and social factors, significantly impact occupant energy behavior and thermal comfort, and they have been thoroughly researched. Individual factors affecting occupant energy behavior include users' knowledge of energy matters, gender, employment, family size, and ethnicity (Wei et al., 2013; Martinaitis et al., 2015). People's education levels and psychology, such as their attitudes toward energy consumption, also impacted their energy related behaviors (Janda, 2011). However, the above studies followed conventional modeling approaches, and the results are interpreted as correlations rather than causation.
Furthermore, to analyze the factors affecting human behaviors, various theories such as the Theory of Planned Behavior (TPB) (Ajzen, 1991) have been applied widely to address individuals' energy behavior (Vlek and Steg, 2007; Tetlow et al., 2015). The Theory of Planned Behavior is a well-known theory that predicts the intention of a person to engage in a behavior. The three major elements of this theory consist of the attitudes toward performing the behavior (i.e., the point to which a behavior is regarded favorably or unfavorably), the social norms or pressure to perform the behavior (i.e., social pressure coming from people's immediate social network), and the perceived behavioral control (i.e., beliefs about the existence of factors that can aid or hinder the success of the behavior). A combination of these elements determines the behavioral intention, as well as the final action. For example, in building energy behavior research, TPB factors were used to explain the differences in the intentions of employees' to perform pro-environmental activities like recycling, switching off electrical appliances while leaving their desks, and using teleconference instead of traveling (Greaves et al., 2013). Another study indicated that viewpoints toward conserving energy together with perceived behavioral control strongly determine the propensity to conserve energy within low-income houses throughout the USA (Chen et al., 2017). Therefore, in this study, the factors of TPB will also be applied to analyze occupant energy behavioral intentions as a proximal antecedent of actual energy behavior in IVEs.
Key Factors Affecting Thermal States
Researchers analyzed occupant thermal states since they also significantly affect their energy behavior (Hong et al., 2015). The thermal states of the occupants usually include sensation, acceptability, and comfort. Thermal sensation is defined as the apparent sensation that people have in relation to their surrounding environment and is usually measured using a 7-point Likert scale (−3-cold sensation, +3-hot sensation) of ASHRAE Standard 55 (de Dear and Brager, 1998; ASHRAE, 2013). Whereas thermal comfort refers to “the condition of mind which expresses satisfaction with the thermal environment” (ASHRAE, 2013), and thermal acceptability defines whether a particular environmental condition is acceptable or not. Comfort and acceptability are also measured using surveys such as 6-point Likert scales (−3-totally unacceptable, +3-totally acceptable; −3-very uncomfortable, +3-very comfortable) (Zhang, 2003; Goto et al., 2006; Zhang and Zhao, 2008; Zhang et al., 2016). Similar to the factors affecting occupant energy behavior, the occupant thermal states are also affected by environmental, individual, and physiological factors. Factors such as indoor air temperature and overall quality of environment were correlated with thermal sensation and comfort (Clausen et al., 1993; Alm et al., 1999). Some studies have indicated that there are variations between different groups of people, i.e., gender, age, and body mass index (BMI) on thermal preferences (Lan et al., 2008; Schweiker and Shukuya, 2009, 2010; Chow et al., 2010; Indraganti and Rao, 2010; Indraganti et al., 2015; Rupp et al., 2018). Furthermore, physiological factors such as skin temperatures and heart rates are the most important indicators of thermoregulation of the human body (Arens and Hui, 2006; Yao et al., 2008; Choi et al., 2012; Choi and Yeom, 2017, 2019; Nkurikiyeyezu et al., 2018). These physiological factors will help maintain body temperature equilibrium in different thermal environments and play a vital role in determining thermal states, which in turn affects occupants' energy behaviors (Bulcao et al., 2000).
Virtual Experience Factors
The virtual experience factors are a collection of characteristics that indicate the quality of experience in immersive virtual environments (IVEs). These characteristics are usually grouped into three main factors, i.e., presence, cybersickness, and immersive tendencies. Presence is described as being the “psychological state of 'being there' mediated by an environment that activates our senses, captures our attention, and promotes our active participation” (Ijsselsteijn et al., 2000; Witmer et al., 2005). Igroup Presence Questionnaire (IPQ) (Schubert et al., 1999) is a frequently used questionnaire to quantify the users' presence. This 13-item questionnaire has four factors, i.e., general presence, spatial presence, involvement, and experienced realism. The questions are gauged on a 5-point Likert scale that ranges between 1-strongly disagree; 5-strongly agree. On the other hand, cybersickness is a collection of unpleasant sensations that impair users' interaction with a virtual world (LaViola, 2000). The Simulator Sickness Questionnaire (SSQ) (Kennedy et al., 1993) has been extensively utilized for determining motion sickness. This questionnaire contains 16 items that include four factors, i.e., nausea, oculomotor, disorientation, and total cybersickness. The total cybersickness is the summation of the responses of the remaining three factors. All the questions in the SSQ are gauged on a 4-point scale that ranges between 0-none; 3-severe. Immersive tendencies are defined as a users' proclivity to become absorbed in a simulated world (Slater and Wilbur, 1997). They are thought to be one of the crucial factors affecting a users' sensation of presence and cybersickness, with a high level of immersion predicting a high level of presence (Lessiter et al., 2001; Banerjee et al., 2002) and a higher level of cybersickness (Bangay and Preston, 1998). Immersive tendencies are usually measured using the ITQ questionnaire (Witmer and Singer, 1998). It is a questionnaire of 18 items that consists of four factors, i.e., focus (indicates the level of focus in the virtual world), involvement (indicates the level of involvement in the virtual world), emotion (indicates the level of emotion during and after exposure to the virtual world), and entertainment (indicates the level of entertainment while in the virtual world). The responses to these factors are on a 7-point Likert scale (1 = never; 4 = occasionally; 7 = often). The total number of points represents a users' immersive tendency.
Past evidence suggests that the aforementioned virtual experience factors will impact the users' physiological factors. For example, various studies have reported that presence influences the degree of stress in a virtual world (Bouchard et al., 2008), and cybersickness influences heart rates (Nalivaiko et al., 2015), respiratory rates (Dennison et al., 2016), skin conductance (Gavgani et al., 2017), and skin temperatures (Kim et al., 2005). Individual factors like age, gender, and ethnicity also influence presence and cybersickness (Klosterhalfen et al., 2005; Schuemie et al., 2005; Felnhofer et al., 2012; Paillard et al., 2013). Furthermore, the literature presented in Key Factors Affecting Occupant Energy Behavior and Key Factors Affecting Thermal States sections suggests that the physiological and individual factors influence occupant energy behaviors and thermal states. Consequently, a pathway may exist from virtual experiences to occupant energy behaviors and thermal states through individual and physiological factors. Therefore, when using IVEs for occupant energy behavior and thermal state experiments, it is necessary to investigate whether the virtual experience factors would influence those experiments outcomes.
Overview of Causal Inference Framework
The term “causality” is called cause and effect, where the cause is accountable for the effect, and the effect depends on the cause (Yao et al., 2020). Causality analysis can discover the causal mechanisms underlying the data-generating process to explain the relationships between the explanatory factors and outcome. For example, would a change in indoor room temperature causes a change in the occupant's skin temperature? These types of questions can be answered by applying causal inference methods (Rubin, 1990; Peters et al., 2017). In this section, a causal inference framework for inferring causality from data is presented in detail. The framework involves five main steps (1) factor selection and description; (2) causal model specification that accurately depicts the domain knowledge; (3) estimation of the causal effects (i.e., magnitude of change in the distribution of outcome for any change in the distribution of input factor); (4) validation of the causal model; (5) interpretation of the results.
Initial Factor Selection and Description
The first step of a causal inference process is to select and describe the factors of a study. Two types of factors are usually included in a causality study. They are the treatment factor (or cause) and the outcome factor (or effect) (Tsapeli and Musolesi, 2015). A treatment factor is an influential or independent factor that impacts the values of the outcome factor; whereas, the outcome factor or effect is a dependent factor that can be modified by varying the treatment factor. A series of questions can be asked to identify an initial set of potential treatment factors, such as (1) what circumstances lead to the occurrence of the problem or the outcome? (2) What other problems exist in the context of the core problem's occurrence? On the basis of such questions, a literature search can be performed to uncover an initial set of treatment factors for analyzing the outcome (Petersen and van der Laan, 2014).
Once the treatment factors are identified, typically, they are coded in binary format, indicating whether or not a research item is subjected to treatment. However, if various levels of treatments are considered, a treatment factor may also be categorical. Continuous treatment or outcome factors are often discretized into categorical factors because the algorithms performing approximate causal inference function well on categorical data (Spirtes et al., 2000; Jensen et al., 2009; Nanda et al., 2016; Tosun et al., 2017). Discretization also makes the findings easier to interpret.
Causal Model Specification
A causal model can define a formal representation of potential causal relationships between the key factors. A causal model is an arithmetic concept that explains the causal relationships between factors in quantitative terms (Guo et al., 2018). Different types of causal models exist, such as Granger causality (Granger, 1969) and potential outcome framework (Rubin, 1974; Maldonado and Greenland, 2002), among which structural causal models (SCMs) or causal graphs have demonstrated their ability to identify the causal relationships between various factors of a study (Pearl, 1988; Judea and Dana, 2018). SCMs provide a visualization of the interactions between the factors by representing the factors as nodes and connecting those nodes with arcs to show the interactions (Glymour et al., 2019). They can naturally deal with missing data. They offer a strategy for avoiding data overfitting, and they enable data to be combined with prior literature knowledge to create more accurate models (Heckerman, 1995; Scutari et al., 2017). Furthermore, SCMs can readily be coupled with decision-making tools to assist management (Uusitalo, 2007). As such, SCMs were chosen in this study to identify the factors causing energy behavioral intentions and thermal states.
An SCM G = (F, A) is represented by a directed acyclic graph (DAG) (i.e., graphs with no directed paths that begin and end at the same node) (Pearl, 2009b). An SCM (G) depicts the causal relationships between factors, with F being a set of nodes (or vertices) and A ⊆ F × F is the set of arcs (or edges). Each node in an SCM represents a treatment factor, outcome factor, and other observed or unobserved factors. The arcs represent the causal links between them. Figure 1 shows an example of a structural causal model representing the causal dependencies between OUTCOME and a collection of factors (FAC or Treatment) that may influence OUTCOME. The nodes have a hierarchical structure which is determined by the way the arcs are directed. For example, in Figure 1, X1 and X3 are connected by an arc, then node X1 is the ancestor or immediate parent of X3 and X3 is the descendant or child of X1. A directed arc X3 → OUTCOME means that if the distribution of X3 is altered, it will alter the distribution of the OUTCOME. However, if there is an absence of arc between X3 and OUTCOME, it indicates that any change in the distribution of X3 will not change the distribution of OUTCOME.
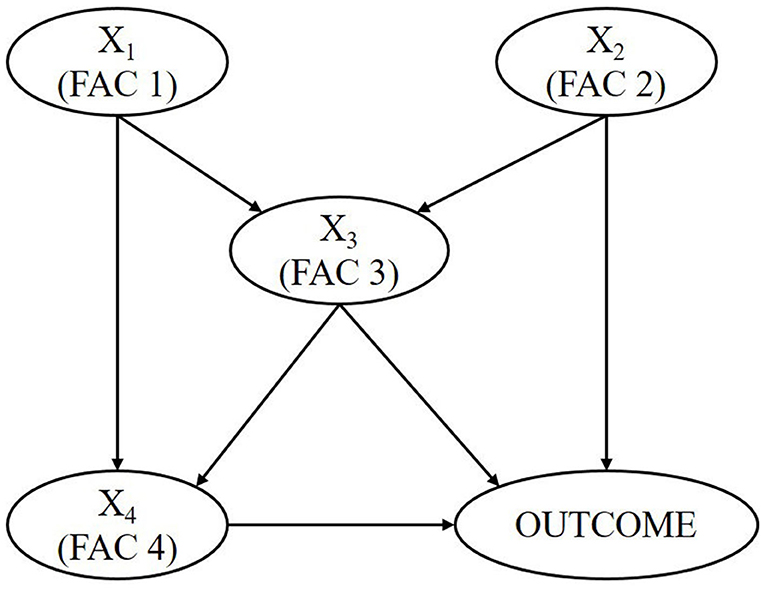
Figure 1. Example of a structural causal model.
One of the advantages of SCMs is identifying back-door paths and confounding factors that are useful in blocking non-causal paths during causal effect estimation. The following sub-sections provide a brief description of confounding and learning of SCMs.
Confounding and Back-Door Paths in SCMs
In an SCM, a path between the treatment and outcome factors can be a direct path or a back-door path (Greenland et al., 1999; Robins, 2001). A direct path is a path in which all the arcs point forward. For example, in Figure 1, the path X4 → OUTCOME is a direct path representing the effect of X4 on OUTCOME. In contrast, a back-door path is a path that flows backward out of a treatment factor. For example, in Figure 1, the path X4 ← X3 → OUTCOME is a back-door path because the direction of the arc from X4 to X3 is backward. Also, this back-door path is confounding because, in this path, X3 is the common cause (or confounding factor) of X4 and OUTCOME since it has direct arcs to both X4 and OUTCOME. This confounding in the back-door paths conceals the true causal effect of a treatment factor. Thus it should be identified and blocked during causal analysis. This process is known as conditioning. One can block the backdoor paths by conditioning on the confounding factors in the path using the back-door criterion (Yao et al., 2020). In the above example, the back-door path X4 ← X3 → OUTCOME can be blocked by conditioning the confounder X3, which breaks the association between X4 and OUTCOME. Thus, blocking the back-door path ensures that all the paths linking the treatment factors with the outcome are causal in nature.
Learning Structural Causal Models
There are two types of approaches to building a structural causal model for causal inference. The first approach, dubbed “elicitation,” comprises domain experts who use their knowledge to structure a graph by including or excluding the relationships between the factors (Neil et al., 2000). Multiple experts can elicit structural causal models by considering their individual opinions and then combine them or reach a group agreement (Martin et al., 2012). The elicitation method may be helpful when there is a scarcity of data or measurements from a field survey. However, selecting experts and elicitation techniques can be a difficult task (Kuhnert et al., 2010).
In the second approach, causal discovery algorithms are used to produce SCMs automatically from the available data. This approach is useful when there is no expert information available on the interplay of the relationships between the treatment factors and outcome. The score-based (Magliacane et al., 2016) and constraint-based algorithms (Zhang, 2008; Colombo et al., 2012) are the two major algorithms that can be used to create an SCM. The score-based algorithms use a goodness-of-fit score to generate the best possible network graph, which might be an NP-hard problem for high-dimensional data (Chickering et al., 1994). On the other hand, constraint-based algorithms use conditional independence tests to identify causal relationships among factors. The oldest and most widely used constraint-based algorithm to learn an SCM is the PC algorithm (Spirtes et al., 2000). This algorithm is highly reliable under independent and identically distributed sampling (Glymour et al., 2019), executes in polynomial time, and is computationally efficient in handling high-dimensional data with up to thousands of factors (Kalisch and Buehlmann, 2005). There are two phases to the PC algorithm. The skeleton identification stage is the first phase: The algorithm starts with the complete graph and tries to find a conditional independence X ⫫ Y | F for each pair of factors X and Y. The separating set F is then cached after the corresponding arc is removed using the results of conditional independence tests (Spirtes et al., 2000). The orientations phase is the second phase, where the cached conditioning sets are used to orient the arcs. However, the performance of the PC algorithm depends on the order as it is affected by the order in which the factors are presented, and conditional independence tests are performed. Therefore, a new modified version called the PC-stable algorithm was developed, which is order-independent and results in fewer errors compared to the original PC algorithm (Colombo and Maathuis, 2014). This algorithm also works in two steps. First, the algorithm considers all triples (X, Y, F) where the pair (X, Y) is adjacent, and the pair (Y, F) is adjacent, but the pair (X, F) is not. The algorithm guides both edges toward Y (X → Y ← Z) for all such triples iff Y did not belong to the conditioning set that caused the removal of the arc connecting X and F. The structure X → Y ← F is known as a collider. A set of colliders are then extracted in the second step, and any remaining undirected edges are oriented using a set of rules known as Meek rules (Meek, 2013).
Additionally, the performance of the algorithmic learning methods can be improved by including prior knowledge about a part of the structure while learning (Mansinghka et al., 2012; Xu et al., 2015). This ensures that the algorithm learns the structure more efficiently by capturing the prior distribution present in the data that would otherwise be overlooked. This can be achieved by combining the algorithmic-based methods with the elicitation methods where the latter helps include or exclude the relationships between some factors based on the prior or expert knowledge, and the former learns the structure between the other factors from the available data. As a result of the preceding discussion, the elicitation method, in conjunction with a PC-Stable algorithm, was used to learn the SCMs to identify the factors causing energy behavioral intentions and thermal states.
Causal Effects Estimation
The causal effect exercised by a treatment factor X over an outcome factor Y refers to the magnitude of change in the probability distribution associated with the factor Y with respect to change in the probability distribution associated with X. In other words, it is a measure of how different the outcome is when the subject received the treatment compared to that when the subject did not receive the treatment (Rubin, 1974; Maldonado and Greenland, 2002). For example, in Figure 1, assume X2 as indoor room temperature with two treatment levels, i.e., hot and cold temperature and OUTCOME as occupant's skin temperature. We would like to know what is the causal effect of hot indoor temperature versus cold indoor temperature on an occupant's skin temperature. Since there are two treatment levels, there will be two outcomes, i.e., the occupant's skin temperature under hot indoor temperature and their skin temperature under cold indoor temperature. The causal effect of the indoor room temperature on the occupant's skin temperature is then determined by taking the difference between those two outcomes. The above definition is known as individual causal effect (ICE), which applies to a single individual. However, the average causal effect (ACE) is used based on ICE to find the causal effects on a target population. ACE can be defined as the approximation of ICE over the entire target population.
There are two types of causal effects in an SCM; direct and indirect causal effects. Direct causal effects are those that occur when they go directly from one factor to another. Indirect causal effects occur when one or more factors mediate the relationship between two factors. For example, in Figure 1, X2 affects OUTCOME both in a direct and indirect way via its direct impact on X3. The magnitude of the direct causal effect can be determined by computing the coefficient between X2 and OUTCOME. The indirect effects can be determined by computing the product of the coefficients between X2 and X3 and between X3 and OUTCOME. The combined effect is obtained by adding the direct and indirect impacts of X2 on OUTCOME. Regression analysis is one way of determining the coefficients as an average causal effect estimate by training the model with the outcome as dependent factor and treatments as independent factors (Bellemare et al., 2017; Luo et al., 2017). The coefficients can be either positive or negative. The positive coefficients imply that the event is more likely to occur at a treatment factor's group level than at its reference level; whereas, negative coefficients imply that the event is more likely to occur at the reference level of the treatment factor than at its group level.
Furthermore, if there are back-door paths and confounding factors between treatment and outcome, those back-door paths must be blocked by conditioning on the confounding factors. Common methods of conditioning confounding factors and estimating causal effects for SCMs include Parametric G-computation (Zhang et al., 2018), Targeted Maximum Likelihood Estimation (TMLE) (van der Laan and Rubin, 2006), and Inverse Probability Weighting (IPW) (Rosenbaum and Rubin, 1983).
Model Validation
The performance and the accuracy of the causal models can be validated using several metrics such as receiver operating characteristics, error rates and scoring rules, and cross-validation (Marcot et al., 2006). In this study, cross-validation (Boyce et al., 2002) is chosen as the method for validating the SCMs (Barthelmes et al., 2017). Cross-validation decomposes the data into k disjoint subsets known as folds of approximately the same size. Each fold is considered unseen data, whereas the rest of k−1 folds are considered seen data. One trains the model on the seen data and validates against the unseen data to find the model's goodness-of-fit. This method reveals the degree to which a model is robust by preventing overfitting and how accurate the model is at classifying new or unique data.
Results Interpretation
The final step of the causal inference framework is to interpret the results. In a structural causal model (SCM), we can look at the direction of network arcs that flow from one factor to another to interpret the causal relationship between them. Furthermore, the causal effect estimate will indicate the strength of the causal relationships between the factors. Since the causal effects are computed using regression, they can be interpreted the same way the regression coefficients are interpreted. For example, an SCM was developed to study substance abuse, and with the help of regression coefficients, the authors found that taking marijuana causes the odds of taking heroin to be 23 times more than that of people who didn't take marijuana (Lewis and Kuerbis, 2016). In another study, an SCM was developed to identify causes that affect the results of coronally advanced flap procedure (Nieri et al., 2009). Factors such as patients' age and complete root coverage had a negative causal effect on their root canal sensitivity. In contrast, factors such as gender had a positive causal effect on deeper average recessions. Two alternative SCMs were developed to estimate the causal effect of exclusive breastfeeding (EBF) on early childhood caries (ECC) for Ugandan kids aged 5 (Birungi et al., 2017). Based on the regression coefficients, EBF showed considerable impact on ECC in the first SCM, and EBF with marital status showed significant impact on ECC in the second SCM.
Data Collection Tools, Recruitment and Experiment Procedure
Data Collection Tools
Individual Factors
The participants' individual factors such as gender, age, ethnicity, BMI, level of education, and status of employment are collected before the experiment.
Indoor Room Temperature
The Vernier surface temperature sensing device (range: −25°C to 125°C; accuracy: 0.5°C; resolution: 0.1°C) was used to measure the indoor room temperature. This sensor was installed at the height of 24′′ from the floor as recommended by ASHRAE (2013) because of its closeness to the center of the participants' height when they were seated during the experiments. Logger Pro 13 was used to record the temperature data.
Overall Skin Temperature
The skin temperatures are also measured using the Vernier surface temperature sensors and recorded using Logger Pro 13. The sensors are taped to the participants' eight local skin sites, i.e., at forehead, neck, chest, upper back, forearm, hand, calf, and foot.
The following equation was used to compute the overall skin temperature (OST):
where Sfh, Sn, Sch, Su, Sfo, Sh, Sca, Sft, represent the forehead, neck, chest, upper back, forearm, hand, calf, and foot skin temperature, respectively. The weighting factors of the local sites reported in these studies (ISO, ISO, ISO 9886:2004, 2004; ISO, ISO 9920:2007, 2007; Gagge and Nishi, 2011; Liu et al., 2014; Xiong et al., 2016) were used to derive this formula.
Behavioral/TPB Factors
Behavioral factors were acquired through the use of the Theory of Planned Behavior (TPB) questionnaire specifically developed to predict pro-environmental behaviors (Macovei, 2015). This questionnaire consists of 24 items, out of which 11 items are related to the three TPB factors (attitudes, social norms, and perceived behavioral control). The participants' attitudes toward energy conservation and perceived behavioral control are measured using four items, whereas their social norms are measured using three items. The responses to all the 11 items are obtained using a 5-point Likert scale (1-strongly disagree; 5-strongly agree). The final scores for attitude, social norms, and perceived behavioral control are obtained by averaging the responses across the items corresponding to those factors. A higher average score for each factor indicates that the participant is highly inclined toward pro-environmental behavior.
Immersive Tendencies
Participants' immersive tendencies such as focus, involvement, emotion, and entertainment were collected using the modified version of the Immersive Tendencies Questionnaire (ITQ) (Witmer and Singer, 1998). The responses for each factor are obtained through a 7-point Likert scale (1-never, 4-occasionally; 7-often). The final score for each factor is a percentage value, that is, the sum of the responses multiplied by 100 and then divided by the product of the number of items and the Likert scale points (7 in this case), respectively. The higher the score, the more is the level of immersion in IVEs.
Presence and Cybersickness
Presence is obtained through the use of the Igroup Presence Questionnaire (IPQ) (Schubert et al., 1999). The responses are obtained using a 5-point Likert scale (1- strongly disagree; 5-strongly agree). The score for presence is computed using the same method used to compute values for immersive tendencies. The higher the score, the higher is the presence level in IVEs. Cybersickness is acquired through the use of the Simulator Sickness Questionnaire (SSQ) (Kennedy et al., 1993). It consists of three factors (nausea, oculomotor, disorientation, and total cybersickness) and is measured using a 4-point Likert scale (0-none, 3-severe). The following is the methodology for computing the score for each factor: Nausea is calculated as [A] times 9.54, Oculomotor is calculated as [B] times 7.58, Disorientation is calculated as [C] times 13.92, and Total Cybersickness is calculated as ([A] + [B] + [C]) times 3.74, where [A], [B], [C] denotes the sum of the responses to nausea, oculomotor and disorientation items respectively. A higher score indicates a high level of cybersickness in IVEs.
Energy Behavioral Intentions
The participants' energy behavioral intentions are one of this study's outcome factors and are collected using a questionnaire. This questionnaire consists of several energy and non-energy related behavioral intention choices. Energy related behavioral intention choices include using a handheld fan, switching on/off fans or heaters, blocking air diffusers, and using HVAC controls. Non-energy related behavioral intention choices include adjusting clothing, changing posture, changing activity, eating hot/cold foods, consuming hot/cold drinks, relocating to a new place within the office/building, opening/closing windows, and opening/closing window blinds.
Thermal States
The other outcome factors are the participants' self-reported perceptions of their thermal states, i.e., their general thermal sensation, acceptability, and comfort under different environmental conditions. A 7-point Likert scale [cold (−3); cool (−2); slightly cool (−1); neutral (0); slightly warm (+1); warm (+2); hot (+3)] developed by ASHRAE was used to measure general thermal sensation (de Dear and Brager, 1998; ASHRAE, 2013); whereas, a 6-point Likert scale was used to assess both general thermal comfort [very uncomfortable (−3); uncomfortable (−2); slightly uncomfortable (−1); slightly comfortable (+1); comfortable (+2); very comfortable (+3)] (Rentala et al., 2021; Saeidi et al., 2021) and general thermal acceptability [totally unacceptable (−3); unacceptable (−2); slightly unacceptable (−1); slightly acceptable (+1); acceptable (+2); totally acceptable (+3)] (Rentala et al., 2021; Saeidi et al., 2021).
Recruitment
The study was approved by the university's Institutional Review Board (IRB). Seventy-two participants were enlisted using posters and oral communication. Monetary incentives ($10/h) were offered for their participation in the study. The participants' demographic distributions are as follows:
• Age: 24.01 years was the mean age, and 5.83 years was the standard deviation
• Gender: 51.3% were males (n = 37) and 48.6% were females (n = 35)
• Ethnicity: 50% were White (n = 36), 13.8% were Asian (n = 10), 11.1% were Middle Eastern (n = 8), 9.72% were Hispanic or Latino (n = 7), 12.5% were Others (n = 9) and 2 preferred not to answer
• BMI: 2.7% were underweight (n = 2), 65.2% were normal (n = 47), 16.6% were obese (n = 12), and 22.2% were overweight (n = 16)
• Education level: 25% were high-school graduates (n = 18), 37.5% were some college (n = 27), 25% were college graduates (n = 18), and 12.5% were post-graduates (n = 9).
• Employment status: 15.2% had full-time employment (n = 11), 13.8% had part-time employment (n = 10), 62.5% were students (unemployed) (n = 45), and 8.33% were unemployed looking for work (n = 6).
Experiment Procedure
The experiments (both IVE and in-situ sessions) were performed in a climate chamber using the experimental procedure described in previous studies (Rentala et al., 2021; Saeidi et al., 2021). The details of the climate chamber and its IVE model have also been explained in those earlier studies. Following the submission of their signed consent forms, the immersive tendencies and TPB questionnaires were sent to the participants. After completing these questionnaires, the participants were asked to arrive at the climate chamber dressed in a long-sleeved shirt or T-shirt, trousers, socks, and shoes. Then they were asked to sit in the resting area of the chamber (temperature and humidity set at 75°F/23.8°C and 55% respectively), where they were screened for cigarette or alcohol consumption and vigorous physical activity before the experimental sessions. This session took about 10 mins, and the participants were excluded from the experiments if any of the above were discovered. During this session, the participants' individual factors were also recorded. After the screening, they entered the control area of the chamber, sat in a chair, and got the temperature sensors taped to the surface of their skin.
The experiments were conducted from December 2019 to March 2020 following the experiment procedure shown in Figure 2. Each IVE and in-situ experiment had a cooling sequence or a heating sequence. The IVE and in-situ experiments were conducted on the same day, but the heating and cooling sequence experiments were conducted at least 2 weeks apart. To offset and reduce the order effect, participants were arbitrarily allocated to each of the experimental conditions. The IVE experiments were conducted using an HTC Vive HMD device where the 3D model of the chamber was displayed using Unreal Engine 4 (for details and pictures, refer to previous studies). During an IVE experiment, participants only view the chamber's virtual environment through an HMD (no interaction), while the climate chamber controls the environmental conditions. The heating sequence started from 65°F/18.3°C and then increased to 75°F/23.8°C and finally to 85°F/29.4°C. The cooling sequence started from 85°F/29.4°C and then decreased to 75°F/23.8°C and finally to 65°F/18.3°C. The psychrometric chart of ASHRAE (Bhattacharya and Milne, 2009) was used to select these step temperatures. In this chart, for both summer and winter seasons, 75°F/23.8°C falls in the comfort zone range, while 65°F/18.3°C and 85°F/29.4°C fall outside the comfort zone range. The humidity and CO2 levels were maintained at 55% and 1,000 ppm during the experiments, respectively.
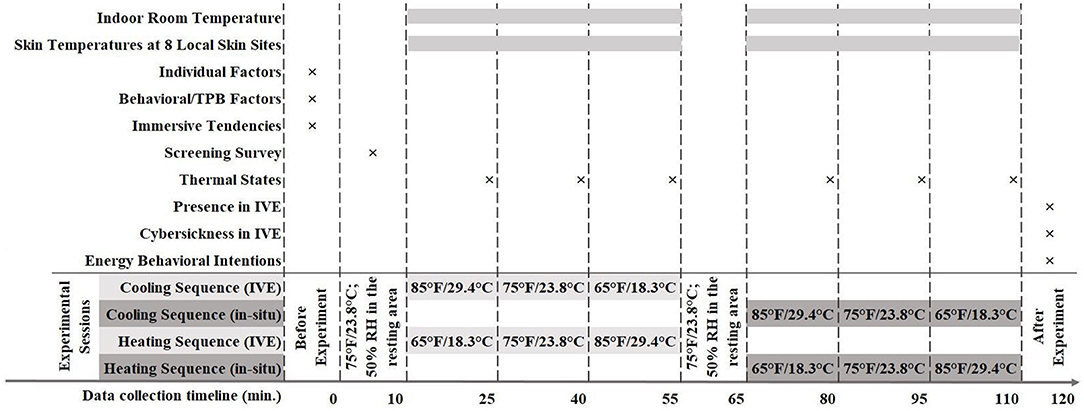
Figure 2. Experiment and data collection procedure.
The indoor room temperature around the participants and their skin temperatures were continuously measured at the one-second interval. After each temperature step change, the participants' thermal state responses (i.e., thermal sensation, comfort, and acceptability) were recorded after the temperature stabilized. Throughout the experiments, the participants' were constrained to sedentary physical activity levels. Furthermore, the participants completed the presence and cybersickness questionnaires inside the chamber after an IVE experimental session. Finally, the participants' energy behavioral intentions (i.e., their three most preferred behavioral choices) were collected after exposure to the cool discomfort condition, i.e., 65°F/18.3°C in cooling sequence in both IVE and in-situ (referred to as Cool/IVE and Cool/in-situ conditions). The behavioral intentions were also collected after exposure to the warm discomfort condition, i.e., 85°F/29.4°C in heating sequence in both IVE and in-situ (referred to as Warm/IVE and Warm/in-situ conditions). The energy behavioral intentions are collected in discomfort conditions because the occupants usually react to thermal discomfort situations to maintain thermal comfort.
The raw data (i.e., indoor room and skin temperatures) collected from the sensors were averaged by taking into account data from the precise start time when the indoor room temperature stabilized at the target step temperature through the end of the thermal state questionnaires. Furthermore, to ensure that the actual range of the indoor room temperature represents the corresponding step temperature zone, the data was cleaned by comparing the averaged indoor room temperature between IVE and in-situ settings and removing those data points whose differences were more than ±3°F/1.7°C. This threshold was selected based on the fact that an individual may be unaware of a temperature increase of 4–5°C (7.2–9°F) when the rate of change of temperature is <0.5°C (0.9°F) per min (Darian-Smith and Johnson, 1977). In the climate chamber used in this study, a temperature change of about 0.5°C/1°F frequently takes 1 min or more. At this rate, it was assumed that the participants were unaware of at least a 3°F/1.7°C change in about 10 mins (10 mins is the estimated time to rise/fall for 5.6°C/10°F).
Application of Causal Inference
Causal inference is applied to the experimental data to learn the SCMs and estimate the average causal effects. Figure 3 illustrates the methodology used to generate and validate the SCMs. The process starts with identifying initial factors, data segmentation and factor assignment based on the in-situ and IVE settings, and factor discretization. Next, the experimental data are randomly divided into two parts, i.e., seen and unseen data based on a 50:50 ratio. The seen data is utilized to learn the structure of the causal models using the elicitation method in conjunction with the PC-Stable algorithm, identify back-door paths and confounding factors, and estimate the average causal effects of treatment factors on outcomes. In contrast, unseen data is utilized for validation. In the following sub-sections, each process is described in detail.
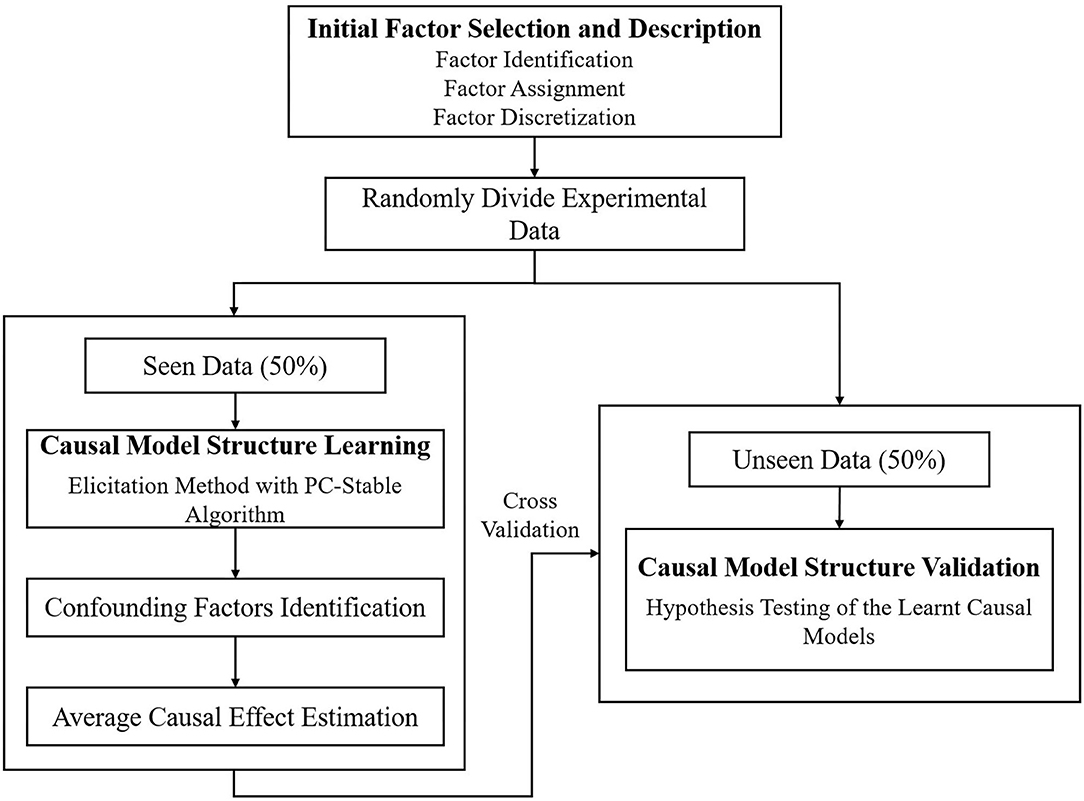
Figure 3. Overview of the methodology.
Initial Factor Selection
This study selected the key treatment factors that may affect the behavioral intentions and thermal states (Table 1) based on the current domain knowledge and the models reviewed from various peer-reviewed occupant energy behavior and thermal state literature (Background section). It must be noted that the participants' other individual factors such as age, BMI, ethnicity, education levels, and employment status were not included in the model because the samples in those factor groups were not evenly distributed.
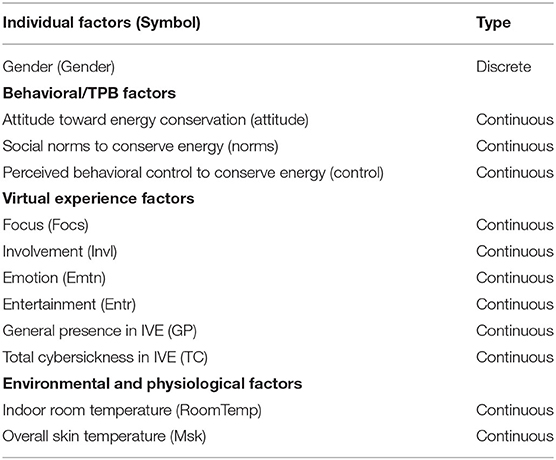
Table 1. Key treatment factors along with their abbreviations and data types.
The outcome factors of this study are the participants' energy behavioral intentions (EBI) and their thermal states, i.e., general thermal sensation (GTS), general thermal acceptability (GTA), and general thermal comfort (GTC).
Factor Assignment
As described in Experiment Procedure section, the energy behavioral intention data were collected outside the comfort zone range, i.e., at 65°F/18.3°C (cool discomfort condition) and 85°F/29.4°C (warm discomfort condition). In contrast, the thermal state data was collected under all three-step temperatures (both inside and outside comfort zone range). Thus, for analyzing energy behavioral intentions (EBI), the data is segmented based on cool and warm discomfort conditions in IVE and in-situ, and appropriate treatment factors such as gender, TPB, and virtual experience factors are assigned (Figure 4). For analyzing thermal states, the data is segmented based on IVE and in-situ conditions only, and factors such as indoor room temperature (all three levels), overall skin temperature, and virtual experience factors are assigned as treatment factors (Figure 5).
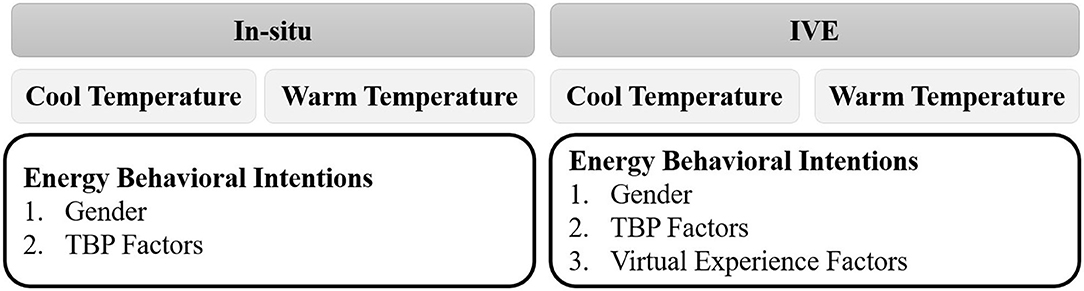
Figure 4. Data segmentation and factor assignment for analyzing behavioral intentions.
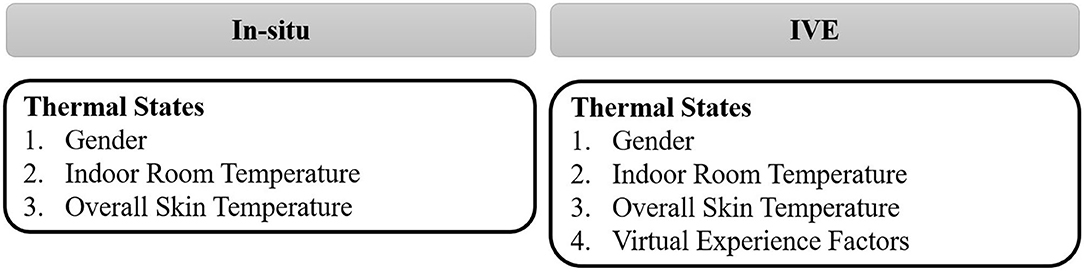
Figure 5. Data segmentation and factor assignment for analyzing thermal states.
Factor Description and Discretization
After factor assignment, the continuous data are discretized into categories, as shown in Table 2. Data discretization was performed because the algorithms used for structure learning and approximate causal inference work well with the categorical data. The entire discretization process is explained in detail in the following sections.
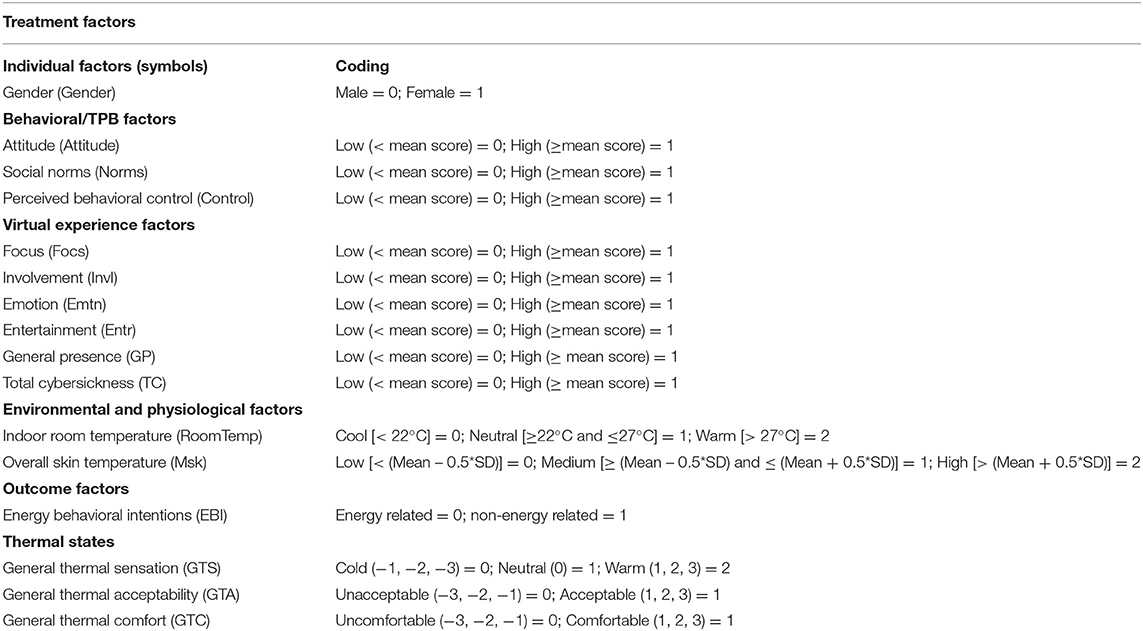
Table 2. Discretization of the treatment and outcome factors.
Individual Factors
The participants' individual factor gender was discretized into two categories, i.e., male and female.
Indoor Room Temperature
Indoor room temperature was discretized into cool, neutral, and warm temperature categories according to ASHRAE psychrometric chart (Bhattacharya and Milne, 2009), which shows that the comfort zone range falls between 22 and 27°C. Therefore, the cool category consists of temperature values <22°C; the neutral category consists of temperature values between 22 and 27°C; and the warm category consists of temperature values >27°C.
Overall Skin Temperature
Existing studies typically provide the mean and standard deviation of the skin temperatures corresponding to an indoor environmental condition (Choi and Yeom, 2017, 2019; Zuo et al., 2020). Furthermore, the intervals of discretized bins were derived using mean and standard deviation (Jacobsen et al., 2012; Wall et al., 2015; Huang et al., 2017). Therefore, the overall skin temperature (Msk) was discretized into three categories using Mean ± 0.5*SD. The value of 0.5 was chosen based on the data range and to ensure that the three categories had balanced samples. The first category consists of values less than Mean – 0.5*SD, the second category consists of values between Mean – 0.5*SD and Mean + 0.5*SD and the third category consists of values greater than Mean + 0.5*SD.
Behavioral/TPB Factors
Researchers often report the mean of the final scores of the TPB factors to convey the level of intention to perform a particular behavior (Greaves et al., 2013). Thus, the three TPB factors in this study were discretized into two categories based on the mean score values, i.e., all the values less than the mean score were discretized into the low pro-environmental behavior category, and values exceeding or equal to the mean score were discretized into the high pro-environmental behavior category.
Immersive Tendencies Factors
The mean scores of the immersive tendencies' factors are typically reported in the literature (Walkowiak et al., 2015) to compare with available mean scores in order to assess the reliability of IVEs. As a result, the immersive tendencies factors were discretized into two categories based on the mean score values, i.e., all the values less than the mean score were discretized into the low immersion category, and the values exceeding or equal to the mean score were discretized into high immersion category.
General Presence and Total Cybersickness in IVE
Similar to the immersive tendencies' factors, the general presence and total cybersickness scores are also compared with available mean scores to check the reliability of IVEs (Hartanto et al., 2014; Kinateder et al., 2014). Therefore, the presence and cybersickness scores were also discretized into two categories based on the mean scores. All the values less than the mean score were discretized into the low presence and low cybersickness category and values exceeding or equal to the mean score were discretized into the high presence and high cybersickness category.
Energy Behavioral Intentions
The top three energy behavioral intention choices selected by the participants were converted into a single factor and discretized into two categories, i.e., energy related and non-energy related categories. If any of the two choices out of three belonged to the energy related behaviors, then all three choices were grouped into energy related behavior intention category. In contrast, if any of the two choices out of three belonged to the non-energy related behaviors, then all three choices were grouped into the non-energy related behavior intention category. For example, a participant selected “adjusting clothing”, “changing posture”, and “operating HVAC controls” as the three most preferred choices. Since two out of three choices belong to non-energy related behaviors, all choices were grouped into this participant's non-energy related behaviors category.
Thermal States
The 7-point Likert scale responses for the general thermal sensation were discretized into three categories as follows: the votes −3, −2, and −1 are grouped into the cool category; the vote 0 is grouped into the neutral category and the votes 1, 2, and 3 are grouped into warm category. Similarly, the 6-point Likert scale responses for acceptability and comfort were discretized into two categories: the votes −3, −2, and −1 are grouped into the unacceptable and uncomfortable category, and the votes 1, 2, and 3 are grouped into the acceptable and comfortable category.
Specification of Causal Model
Based on the discussions presented Casual Model Specification section, the elicitation method, in conjunction with a PC-Stable algorithm, was used to learn the SCMs from the experimental data. First, the data were randomly divided into two datasets assuming a 50:50 ratio. The first 50% of the data is the seen data on which the SCMs were learnt, and the other 50% of the data is the unseen data that was used for validating the causal models learnt on the seen data. The following sub-sections describe the structure learning process in detail.
Elicitation of Relationships Between Factors
In this step, the prior knowledge available from the literature was inserted in the structure learning process by blocking the relationships that are known to be impossible. In particular, the following relationships were blocked:
a. Overall skin temperature to indoor room temperature and individual factors
b. Participants individual factors to indoor room temperature
c. Participants TPB factors to indoor room temperature, overall skin temperature, individual and virtual experience factors.
d. Participants virtual experience factors to indoor room temperature, individual and TPB factors.
In addition, the immersive tendencies positively affect both presence and cybersickness and not vice versa, i.e., a person having higher levels of immersion will have a feeling of more presence in the virtual environment and may experience more cybersickness symptoms (Bangay and Preston, 1998; Banerjee et al., 2002). So, the relationships from the participants' general presence and total cybersickness to their immersive tendencies are also blocked.
Structure Learning With PC-Stable Algorithm
After blocking the relationships between the factors, the PC-Stable algorithm was applied to the seen data for learning the SCMs. The PC-Stable algorithm employs conditional independence tests to add or remove the arcs between the factors. The chi-square test with a level of significance of α = 0.05 was used in the PC-Stable algorithm to test the conditional independencies. Figures 6, 7 show the SCMs for energy behavioral intentions, while Figure 8 shows the SCM for thermal states in in-situ and IVE conditions.
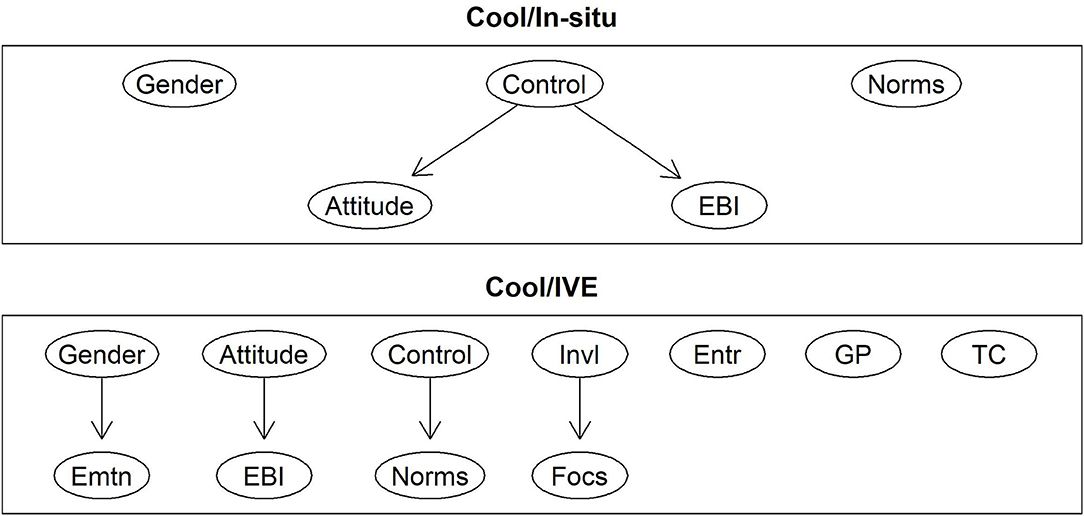
Figure 6. SCM for EBI in cool/in-situ (top) and Cool/IVE (bottom) condition.
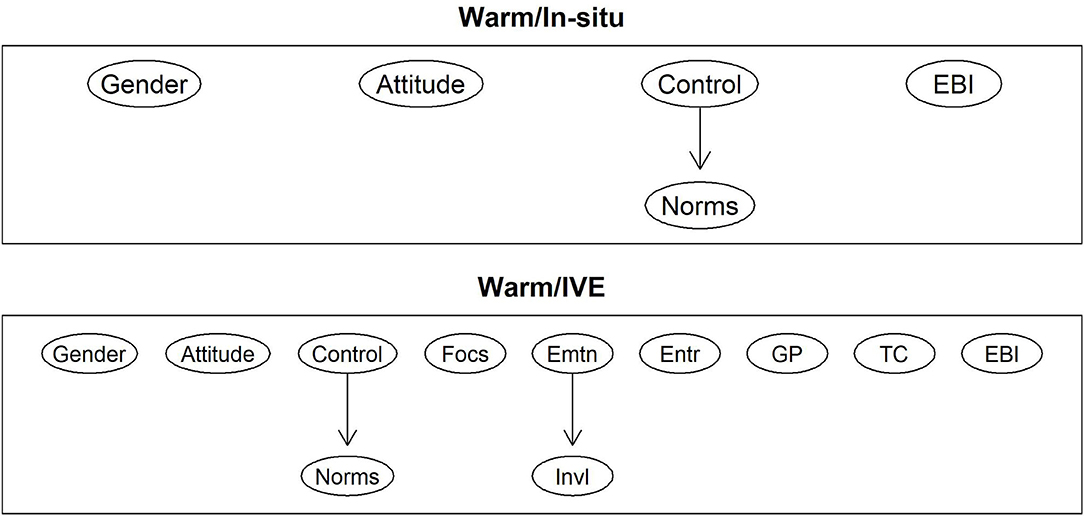
Figure 7. SCM for EBI in warm/in-situ (top) and Warm/IVE (bottom) condition.
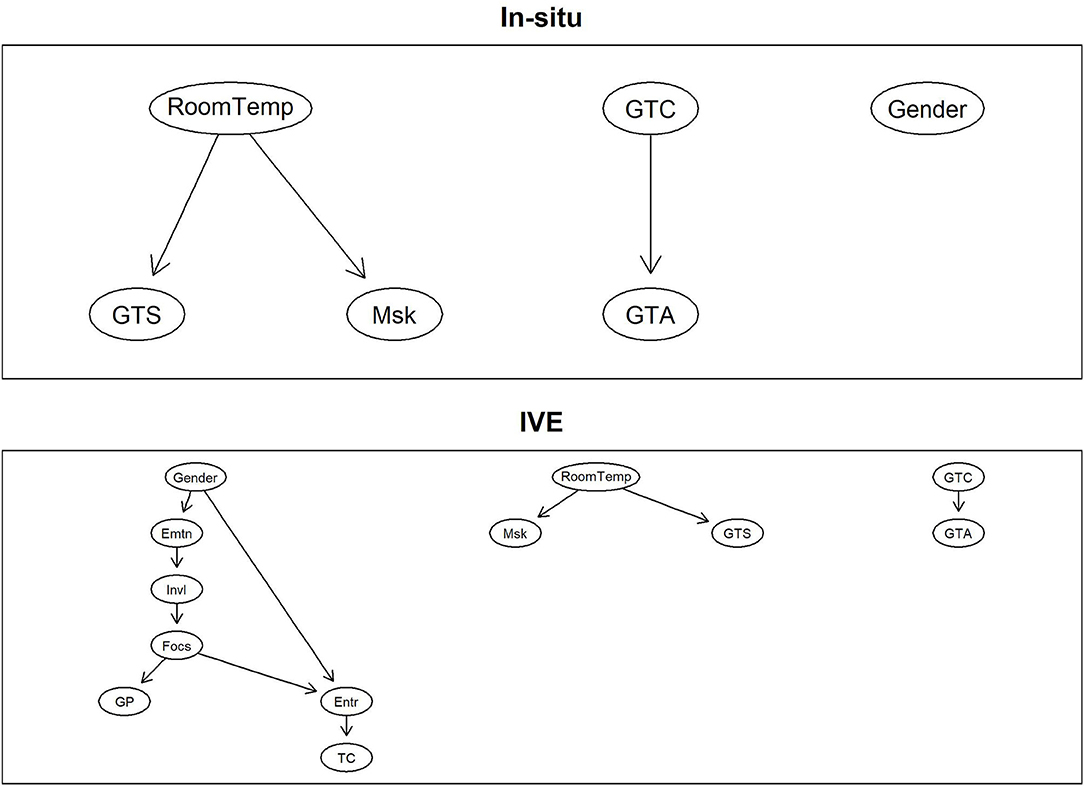
Figure 8. SCM for thermal states in in-situ (top) and IVE (bottom) conditions.
Identifying Back-Door Paths and Confounding Factors
After learning the SCMs, an additional step was performed to identify the confounding factors. First, every treatment factor was paired with the outcome factor to identify the direct and back-door paths between them. Then, the identification of the confounding factors was made using the back-door criterion for only those treatment factors which have both direct and back-door paths. After applying the back-door criterion, no confounding factors were found for EBI, GTS, GTA, and GTC outcome factors in all SCMs because no back-door paths led to those four outcomes from any of the treatment factors. For example, in both Warm/in-situ and Warm/IVE conditions (Figure 7), there are no paths from any of the treatment factors to EBI. Similarly, in Cool/in-situ and Cool/IVE (Figure 6), there are only direct paths to EBI. Also, in Figure 8, there are only direct paths to GTS and GTA.
Causal Effect Estimation
Given the causal relationships encoded in the SCMs, the average causal effects (ACE) of only those treatment factors that have a direct path to the outcome factors, i.e., direct average causal effects, were estimated using logistic regression on the seen data. The causal risk odds ratio obtained from the logistic regression coefficients is used to represent the average causal effect. If the causal risk odds ratio is not equal to 1, the factors have a causal effect. The logistic regression equation is given below:
Where, P(Oi = o|Ti) is the probability of the outcome Oi given the treatment factor Ti, α denotes the intercept, and β is the coefficient of the treatment factor.
Since there are no confounding factors between the treatment and outcomes, the average causal effects of treatment factors with only direct paths to the outcome were estimated by regressing the former directly on the latter. Since the outcome factors of EBI, GTA, and GTC had two levels, binomial logistic regression was used. In contrast, multinomial logistic regression (Menard, 2002) was used for estimating the average causal effect of treatment factors on GTS, which has three levels.
The SCM shown in Figure 6 suggests that in Cool/in-situ and Cool/IVE, there is a causal relationship from Control to EBI and Attitude to EBI, respectively. In contrast, SCM shown in Figure 7 suggests that in Warm/in-situ and Warm/IVE, there are no causal relationships from any of the treatment factors to EBI. In Figure 8, the SCM suggests that in in-situ and IVE conditions, there is a causal relationship from RoomTemp to GTS and from GTC to GTA. Tables 3, 4 show the average causal effects of those treatment factors on the outcomes. Since there are no paths from any of the treatment factors to EBI in Warm/in-situ and Warm/IVE, the average causal effects on EBI were not estimated in those conditions.
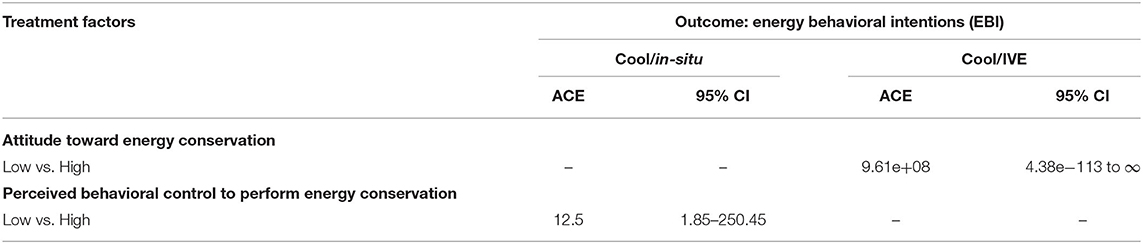
Table 3. Average causal effect estimates of treatment factors influencing EBI.
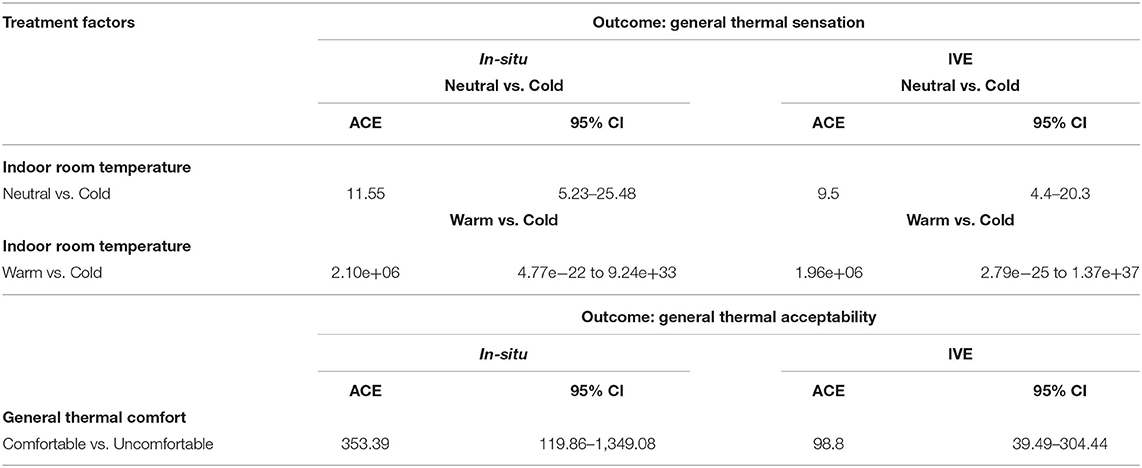
Table 4. Average causal effect estimates of treatment factors influencing GTS and GTA.
Causal Model Structure Validation
Validation is essential for testing the strength of causal models. In this study, a two-fold cross-validation process was applied where the data was randomly divided based on a 50:50 ratio into seen data (50%) and unseen data (50%). The choice of a two-fold with a 50:50 ratio was based on the need for simplicity and consistency in the results of the hypothesis tests, which depend on the sample size. The relationships identified by SCMs learnt on the seen data are cross-validated against the previously unseen data. The SCMs provide relationships between the factors in the form of testable implications, and these implications can be verified by performing hypothesis tests. The following steps describe the validation process:
1. First, the testable implications (i.e., relationships between two factors) are identified from the SCMs learnt on the seen data.
2. The identified implications are a set of hypotheses that are then tested against the previously unseen data.
Depending on the direction of the arcs, the implications test the null hypothesis that a factor does not affect another factor. The alternate hypothesis states that a factor affects another factor. The null hypothesis is accepted if the p-value is larger than α = 0.05; otherwise, it is rejected. Since all the factors are categorical and depend on the number of levels in a factor, binomial and multinomial logistic regression with Type II tests were used to test the hypotheses. The “Type II tests” test for the significance of each independent factor (treatment) on the outcome, under the assumption that there are no interactions between the factors (Langsrud, 2003). The Type II tests will provide the Wald chi-square statistic and its associated p-value.
A total of 22 testable implications were identified from the causal models, and Type II tests were performed for each of those implications. The validation results (p-values) are shown in Tables 5, 6. Out of 22 Type II tests, 19 were significant, i.e., the p-values were below 0.05. Thus the null hypothesis was rejected in all those cases. However, there were only three cases, one in Cool/In-situ, one in Warm/IVE, and one in IVE condition, respectively, where the p-values exceeded 0.05, indicating that those relationships were inconsistent against the unseen data. Therefore, the 2-fold cross-validation results revealed that the SCMs have a high accuracy of about 86.3% in identifying the causal relationships in the unseen data.
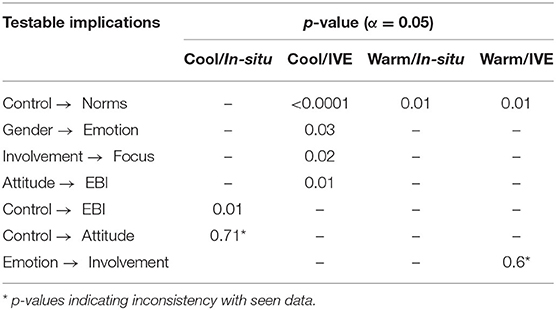
Table 5. Cross-validation results of the hypothesis tests in EBI analysis.
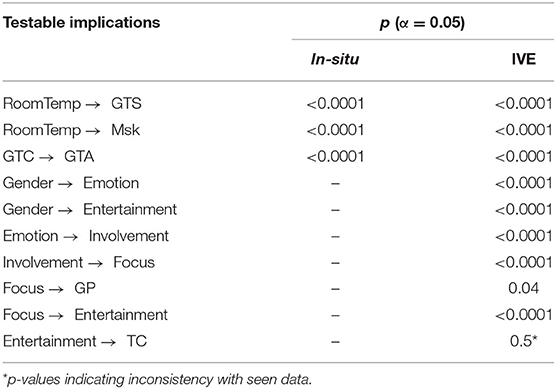
Table 6. Cross-validation results of the hypothesis tests in thermal state analysis.
Results Interpretation and Discussion
Based on the average causal effects, the results suggest that in both Cool/in-situ and Cool/IVE conditions, the TPB factors have a significant average causal effect on the participants' EBI (Table 3). Notably, in the Cool/in-situ condition (Figure 6), the participants perceived behavioral control to conserve energy has an average causal effect of higher magnitude on EBI. Stated differently, when the participants have high levels of behavioral control to conserve energy, the odds of them choosing non-energy-related behavioral intentions is about 12.5 times greater than that of participants who have lower behavioral control levels. Whereas, in the Cool/IVE condition (Figure 6), the participant's attitude toward energy conservation has an average causal effect of significantly higher magnitude on EBI, i.e., when the participants have high levels of attitude toward energy conservation, the odds of them choosing non-energy related behavioral intentions is about 9.61e+08 times greater than that of participants who have lower attitude levels. To the best of our knowledge, this study provided support for a causal effect of these TPB factors on occupants' EBI in IVEs. Furthermore, in both Cool/in-situ and Cool/IVE, there is an average causal effect from Control to Attitude and Control to Norms, respectively, which is consistent with the TPB theory (Ajzen, 1991). However, the outcome factors from Control were different, i.e., Attitude in in-situ and Norms in IVE. This difference is because there was no association between Control and Norms in in-situ (Supplementary Table SI-1). In contrast, a significant association was observed between those two factors in IVE (Supplementary Table SI-2). The causal theory states that if there is no association between two factors, there will be no causation between them (Altman and Krzywinski, 2015). So, the non-association between the factors explains the non-causation. The discrepancy may be related to the data samples collected in different conditions and at different times.
Interestingly, in the Warm/in-situ condition (Figure 7), there were no causal effects on EBI from both TPB factors and gender because there were no associations between those factors and EBI (Supplementary Table SI-5). Similarly, there were no causal effects on EBI from any treatment factors in the Warm/IVE condition (Figure 7), despite associations between gender, TPB factors, and EBI. However, in both Warm/in-situ and Warm/IVE conditions, Control has both a causal effect and an association with Norms (Supplementary Tables SI-3, 4), which is also consistent with the TPB theory. Additionally, the participant's gender had no causal effect on EBI in both Cool/in-situ and Cool/IVE conditions because of no association between those two factors (Supplementary Table SI-5). It is also worth noting that the TPB factors that cause EBI also have associations, which aligns with the previous findings (Abrahamse and Steg, 2011; Chen et al., 2017). The discrepancy between Cool and Warm conditions is likely caused by the participants' different EBI selections. The cause of such difference is yet to be investigated.
Furthermore, in thermal state analysis, the indoor room temperature has an average causal effect on the participants' general thermal sensation (GTS) (Table 4) in IVE as well as in the in-situ condition (Figure 8). When the participants experienced neutral indoor temperature, the odds of them voting neutral thermal sensation is 11.5 and 9.5 times greater than that of participants who experienced the cool indoor temperature in in-situ and IVE conditions, respectively. This indicates that the participants always had a neutral sensation under neutral indoor temperature regardless of their IVE experience. Similarly, when the participants experienced warm indoor temperature, the odds of them voting warm thermal sensation was significantly high than that of participants who experienced cool indoor temperature in both IVE and in-situ conditions indicating that the participants always felt warm under warm indoor temperature regardless of their IVE experience. Existing thermal state studies in IVEs reported associations between indoor temperature and thermal sensation (Yeom et al., 2019a,b). Thus, this study provides additional evidence of a causal effect between those two factors in IVE as well as in the in-situ condition. Indoor temperature also had an average causal effect on the participants' overall skin temperatures in both in-situ and IVE conditions. This finding also represents an extension of a previous study's results where associations were found between participants' skin and indoor temperatures for both IVE and in-situ conditions (Yeom et al., 2019a). Table 4 also shows the average causal effect of general thermal comfort (GTC) on general thermal acceptability (GTA) in both IVE and in-situ conditions. When the participants are comfortable under certain temperature conditions (i.e., cold, neutral, and warm), the odds of them accepting that temperature condition is 353.4 and 98.8 times greater than that of participants who felt uncomfortable in those same temperature conditions. This finding can be considered an extension of previous studies where the authors reported associations between thermal acceptability and comfort (Zhang and Zhao, 2008).
In contrast to the above results, the indoor temperature did not have a causal effect on either general thermal acceptability and comfort in both IVE and in-situ conditions. However, there were associations between indoor temperature, acceptability, and comfort. The exclusion of additional influencing factors like relative humidity, air velocity, and heart rate (Frontczak and Wargocki, 2011; Nkurikiyeyezu et al., 2018) in this study, which may act as mediators between indoor temperature and acceptability/comfort, might be a possible reason. Similarly, there was no causation nor association (Supplementary Tables SI- 6-8) between participant's gender and thermal states in both IVE and in-situ conditions. Previous findings remain inconclusive in this regard, i.e., some studies reported no associations between gender and thermal states (Liu et al., 2011), while some studies reported that females are likelier than males to be dissatisfied (Lan et al., 2008). Thus, the current result (i.e., no causation between gender and thermal states) can be considered a partial extension of the previous findings. Participants' overall skin temperature also did not have a causal effect on their thermal states. However, associations were observed between skin temperature and sensation, but not between skin temperature and acceptability/comfort (Supplementary Tables SI-6-8).
Regarding the effect of virtual experience factors, none of them had a causal effect on EBI or thermal states. A further examination revealed that there are also no associations between virtual experience factors and EBI or thermal states (Supplementary Tables SI-5-8). Therefore, it can be concluded that the participants' virtual experience did not have an influence on their energy behavioral intentions in both cool and warm discomfort conditions as well as on their thermal states in IVE conditions. This conclusion is conditioned on the fact that the virtual experience is in a favorable range. Furthermore, in thermal state analysis for the IVE condition (Figure 8), immersive tendency factors have a causal effect on general presence and total cybersickness, which is consistent with a previous study (Jerome and Witmer, 2002). However, in Cool/IVE and Warm/IVE conditions, there are no causal effects from any immersive tendency factors to the general presence and total cybersickness because of no associations between them (Supplementary Tables SI-9, 10). Comparing the SCMs in all IVE conditions, causal effects were observed between immersive tendencies, i.e., from involvement to focus in both Cool/IVE and IVE, and from emotion to involvement in both Warm/IVE and IVE conditions. Finally, the SCMs in Cool/IVE (Figure 6) and IVE (Figure 8) suggest that participants' gender had a causal effect on their immersive tendencies (i.e., emotion and entertainment). However, no causal effect was found between gender and immersive tendencies in Warm/IVE (Figure 7) because of no associations (Supplementary Tables SI-11).
Limitations
Despite the importance of the findings, they might have been influenced by some limitations. First, this study considered only a limited set of influential factors with a closed-world assumption (Keet, 2013), i.e., the factors represent complete information necessary to cause the outcomes, but, in fact, they are not sufficient. There could be additional factors other than those considered in this study that may cause the outcomes. Secondly, the results are dependent on the data discretization process used in this study, which may result in information loss (Dojer, 2016) and the possibility of different results if the discretization process is changed. For example, the participants' TPB factors in the current data sample were mostly leaning toward pro-environmental behavior, with a very small number of samples having non-pro-environmental behavior. Thus, the results are biased toward the participants having pro-environmental behavior.
Conclusions
Several main conclusions can be made based on the results of the analysis:
1. The causal inference framework is a potentially effective method for analyzing occupant/participant energy behavioral intentions and thermal states, as well as identifying previously unknown causing factors. The SCMs developed with elicitation method in conjunction with PC-Stable algorithm helped identify causing factors of EBI and thermal states.
2. Gender was not the causing factor of EBI or thermal states in the context of this study. Furthermore, participants' virtual experiences such as their immersive tendencies, presence, and cybersickness were not the causing factors of EBI or thermal states when those factors were in a favorable range. Thus, when a virtual model is well designed to provide adequate presence and minimal cybersickness, the technology itself will not become a causing factor of the outcome of experiments using virtual reality. The analysis also reveals that gender is a causing factor of immersive tendencies.
3. The comparisons of IVE and in-situ settings provide mixed results. Concerning EBI, while consistency is observed in warm discomfort conditions, discrepancies exist in cool discomfort conditions and also between cool and warm discomfort conditions. For example, consistency was observed in both Warm/IVE and Warm/in-situ conditions where control was a causing factor of norms. Whereas in Cool/IVE and Cool/in-situ conditions, the TPB factors were the causing factors of EBI, and in Warm/IVE and Warm/in-situ conditions, the TPB factors were not the causing factors of EBI. Also, in the Cool/IVE condition, control was the causing factor of EBI, and in the Cool/in-situ condition, attitude was the causing factor of EBI. Regarding thermal states, consistency was observed in both IVE, and in-situ conditions where indoor room temperature was the causing factor of general thermal sensation and overall skin temperature and general thermal comfort was a causing factor of general thermal acceptability. Additionally, the indoor room temperature was not a causing factor of general thermal acceptability or comfort in both IVE and in-situ conditions.
Future studies should consider using an extensive set of influential factors such as different environmental, physiological, and psycho-social as well as time-dependent environmental and physiological factors to build a causal model to supplement this study. The range of the factors should also be increased, in particular, collecting data of people with non-pro-environmental behaviors and people with different age groups, BMI, education, employment, and income levels. Finally, we need further studies to analyze the impact of collecting data under various experimental conditions and time periods and the sources of discrepancies between different comparisons as observed in this study.
Data Availability Statement
The raw data supporting the conclusions of this article will be made available by the authors, without undue reservation.
Ethics Statement
The studies involving human participants were reviewed and approved by Louisiana State University IRB. The patients/participants provided their written informed consent to participate in this study.
Author Contributions
GR developed the methodology, performed data curation and formal analysis, and prepared the original draft. YZ and SM supervised the research and the methodology along with reviewing and editing the original draft. All authors contributed to the article and approved the submitted version.
Funding
This research was partially supported by the National Science Foundation (Grant No.: CBET-1805914).
Author Disclaimer
Any opinions, findings, and conclusions or recommendations expressed in this material are those of the author(s) and do not necessarily reflect the views of the National Science Foundation.
Conflict of Interest
The authors declare that the research was conducted in the absence of any commercial or financial relationships that could be construed as a potential conflict of interest. The handling editor declared a past co-authorship with the author YZ.
Publisher's Note
All claims expressed in this article are solely those of the authors and do not necessarily represent those of their affiliated organizations, or those of the publisher, the editors and the reviewers. Any product that may be evaluated in this article, or claim that may be made by its manufacturer, is not guaranteed or endorsed by the publisher.
Acknowledgments
The authors would like to thank Dr. Sanaz Saeidi and Ms. Samantha Chacon for helping with the data collection.
Supplementary Material
The Supplementary Material for this article can be found online at: https://www.frontiersin.org/articles/10.3389/frsc.2021.730474/full#supplementary-material
References
Abrahamse, W., and Steg, L. (2011). Factors related to household energy use and intention to reduce it: the role of psychological and socio-demographic variables. Hum. Ecol. Rev. 18, 30–40.
Ajzen, I. (1991). The theory of planned behavior. Organ. Behav. Hum. Decis. Process. 50, 179–211. doi: 10.1016/0749-5978(91)90020-T
Aldrich, J. (1995). Correlations genuine and spurious in Pearson and Yule. Stat. Sci. 10, 364–376. doi: 10.1214/ss/1177009870
Alm, O., Witterseh, T., Clausen, G., Toftum, J., and Fanger, P. O. (1999). “The impact of human perception of simultaneous exposure to thermal load, low-frequency ventilation noise and indoor air pollution,” in 8th International Conference on Indoor Air Quality and Climate (pp. 270–275). Construction Research Communications, Ltd.
Altman, N., and Krzywinski, M. (2015). Association, correlation and causation. Nat. Methods 12, 899–900. doi: 10.1038/nmeth.3587
Andersen, R. V., Toftum, J., Andersen, K. K., and Olesen, B. W. (2009). Survey of occupant behaviour and control of indoor environment in Danish dwellings. Energy Build. 41, 11–16. doi: 10.1016/j.enbuild.2008.07.004
Andrée, K., Nilsson, D., and Eriksson, J. (2016). Evacuation experiments in a virtual reality high-rise building: exit choice and waiting time for evacuation elevators. Fire Mater. 40, 554–567. doi: 10.1002/fam.2310
ANSI/ASHRAE (2017). ANSI/ASHRAE Standard 55-2017: Thermal Environmental Conditions for Human Occupancy. Atlanta, GA: ASHRAE Inc., 66.
Arens, E., and Hui, Z. (2006). The skin's role in human thermoregulation and comfort. Therm. Moisture Transp. Fibrous Mater. 16, 560–602. doi: 10.1533/9781845692261.3.560
ASHRAE (2013). Standard 55-2013-Thermal Environmental Conditions for Human Occupancy. Atlanta: ASHRAE.
Bae, C., and Chun, C. (2009). Research on seasonal indoor thermal environment and residents' control behavior of cooling and heating systems in Korea. Build. Environ. 44, 2300–2307. doi: 10.1016/j.buildenv.2009.04.003
Bahar, Y. N., Landrieu, J., Père, C., and Nicolle, C. (2013). “Integration of thermal building simulation and VR techniques for sustainable building projects,” in Confere 2013, 1–8.
Banerjee, P., Bochenek, G. M., and Ragusa, J. M. (2002). Analyzing the relationship of presence and immersive tendencies on the conceptual design review process. J. Comput. Inf. Sci. Eng. 2, 59–64. doi: 10.1115/1.1486218
Bangay, S., and Preston, L. (1998). An investigation into factors influencing immersion in interactive virtual reality environments. Stud. Health Technol. Inform. 58, 43–51.
Barthelmes, V. M., Heo, Y., Fabi, V., and Corgnati, S. P. (2017). Exploration of the Bayesian Network framework for modelling window control behaviour. Build. Environ. 126, 318–330. doi: 10.1016/j.buildenv.2017.10.011
Belazi, W., Ouldboukhitine, S. E., Chateauneuf, A., and Bouchair, A. (2019). Experimental and numerical study to evaluate the effect of thermostat settings on building energetic demands during the heating and transition seasons. Appl. Therm. Eng. 152, 35–51. doi: 10.1016/j.applthermaleng.2019.02.020
Bellemare, M. F., Masaki, T., and Pepinsky, T. B. (2017). Lagged explanatory variables and the estimation of causal effect. J. Polit. 79, 949–963. doi: 10.1086/690946
Bhattacharya, Y., and Milne, M. (2009). “Psychrometric chart tutorial: a tool for understanding human thermal comfort conditions,” in 38th ASES Natl. Sol. Conf. 2009, Sol. 2009 8, 4628–4640.
Birungi, N., Fadnes, L. T., Kasangaki, A., Nankabirwa, V., Okullo, I., Lie, S. A., et al. (2017). Assessing causal effects of early life-course factors on early childhood caries in 5-year-old Ugandan children using directed acyclic graphs (DAGs): a prospective cohort study. Commun. Dent. Oral Epidemiol. 45, 512–521. doi: 10.1111/cdoe.12314
Bonte, M., Thellier, F., and Lartigue, B. (2014). Impact of occupant's actions on energy building performance and thermal sensation. Energy Build. 76, 219–227. doi: 10.1016/j.enbuild.2014.02.068
Bouchard, S., St-Jacques, J., Robillard, G., and Renaud, P. (2008). Anxiety increases the feeling of presence in virtual reality. Presence: Teleoper. Virt. Environ. 17, 376–391. doi: 10.1162/pres.17.4.376
Boyce, M. S., Vernier, P. R., Nielsen, S. E., and Schmiegelow, F. K. A. (2002). Evaluating resource selection functions. Ecol. Modell. 157, 281–300. doi: 10.1016/S0304-3800(02)00200-4
Bruce-Konuah, A., Jones, R. V., and Fuertes, A. (2019). Physical environmental and contextual drivers of occupants' manual space heating override behaviour in UK residential buildings. Energy Build. 183, 129–138. doi: 10.1016/j.enbuild.2018.10.043
Bulcao, C. F., Frank, S. M., Raja, S. N., Tran, K. M., and Goldstein, D. S. (2000). Relative contribution of core and skin temperatures to thermal comfort in humans. J. Thermal Biol. 25, 147–150. doi: 10.1016/S0306-4565(99)00039-X
Calì, D., Osterhage, T., Streblow, R., and Müller, D. (2016). Energy performance gap in refurbished German dwellings: lesson learned from a field test. Energy Build. 127, 1146–1158. doi: 10.1016/j.enbuild.2016.05.020
Chamilothori, K., Wienold, J., and Andersen, M. (2016). “Daylight patterns as a means to influence the spatial ambiance: a preliminary study,” in Proceedings of the 3rd International Congress on Ambiances, 117–122.
Chamilothori, K., Wienold, J., and Andersen, M. (2019). Adequacy of immersive virtual reality for the perception of daylit spaces: comparison of real and virtual environments. LEUKOS 15, 203–226. doi: 10.1080/15502724.2017.1404918
Chen, C., Xu, X., and Day, J. K. (2017). Thermal comfort or money saving? Exploring intentions to conserve energy among low-income households in the United States. Energy Res. Soc. Sci. 26, 61–71. doi: 10.1016/j.erss.2017.01.009
Chickering, D. M., Geiger, D., and Heckerman, D. (1994). Learning Bayesian Networks is NP-Hard. Citeseer.
Choi, J. H., Loftness, V., and Lee, D. W. (2012). Investigation of the possibility of the use of heart rate as a human factor for thermal sensation models. Build. Environ. 50, 165–175. doi: 10.1016/j.buildenv.2011.10.009
Choi, J. H., and Yeom, D. (2017). Study of data-driven thermal sensation prediction model as a function of local body skin temperatures in a built environment. Build. Environ. 121, 130–147. doi: 10.1016/j.buildenv.2017.05.004
Choi, J. H., and Yeom, D. (2019). Development of the data-driven thermal satisfaction prediction model as a function of human physiological responses in a built environment. Build. Environ. 150, 206–218. doi: 10.1016/j.buildenv.2019.01.007
Chokwitthaya, C., Collier, E., Zhu, Y., and Mukhopadhyay, S. (2019). “Improving prediction accuracy in building performance models using generative adversarial networks (GANs),” in Proc. Int. Jt. Conf. Neural Networks 2019-July. doi: 10.1109/IJCNN.2019.8852411
Chokwitthaya, C., Zhu, Y., and Mukhopadhyay, S. (2021). Robustness analysis framework for computations associated with building performance models and immersive virtual experiments. Adv. Eng. Inform. 50:101401. doi: 10.1016/j.aei.2021.101401
Chow, T. T., Fong, K. F., Givoni, B., Lin, Z., and Chan, A. L. S. (2010). Thermal sensation of Hong Kong people with increased air speed, temperature and humidity in air-conditioned environment. Build. Environ. 45, 2177–2183. doi: 10.1016/j.buildenv.2010.03.016
Clausen, G., Carrick, L., Fanger, P. O., Kim, S. W., Poulsen, T., and Rindel, J. H. (1993). A comparative study of discomfort caused by indoor air pollution, thermal load and noisec. Indoor Air 3, 255–262. doi: 10.1111/j.1600-0668.1993.00006.x
Clevenger, C. M., Haymaker, J. R., and Jalili, M. (2014). Demonstrating the impact of the occupant on building performance. J. Comput. Civ. Eng. 28, 99–102. doi: 10.1061/(ASCE)CP.1943-5487.0000323
Colombo, D., and Maathuis, M. H. (2014). Order-independent constraint-based causal structure learning. J. Mach. Learn. Res. 15, 3741–3782. doi: 10.5555/2627435.2750365
Colombo, D., Maathuis, M. H., Kalisch, M., and Richardson, T. S. (2012). Learning high-dimensional directed acyclic graphs with latent and selection variables. Ann. Stat. 40, 294–321. doi: 10.1214/11-AOS940
Cui, W., Cao, G., Park, J. H., Ouyang, Q., and Zhu, Y. (2013). Influence of indoor air temperature on human thermal comfort, motivation and performance. Build. Environ. 68, 114–122. doi: 10.1016/j.buildenv.2013.06.012
Darian-Smith, I., and Johnson, K. O. (1977). Thermal sensibility and thermoreceptors. J. Invest. Dermatol. 69. doi: 10.1111/1523-1747.ep12497936
de Dear, R. J., and Brager, G. S. (1998). Developing an adaptive model of thermal comfort and preference. ASHRAE Trans. 104, 1–18.
Delzendeh, E., Wu, S., Lee, A., and Zhou, Y. (2017). The impact of occupants' behaviours on building energy analysis: a research review. Renew. Sustain. Energy Rev. 80, 1061–1071. doi: 10.1016/j.rser.2017.05.264
Dennison, M. S., Wisti, A. Z., and D'Zmura, M. (2016). Use of physiological signals to predict cybersickness. Displays 44, 42–52. doi: 10.1016/j.displa.2016.07.002
D'Oca, S., Fabi, V., Corgnati, S. P., and Andersen, R. K. (2014). Effect of thermostat and window opening occupant behavior models on energy use in homes. Build. Simul. 7, 683–694. doi: 10.1007/s12273-014-0191-6
Dojer, N. (2016). Learning Bayesian networks from datasets joining continuous and discrete variables. Int. J. Approx. Reason. 78, 116–124. doi: 10.1016/j.ijar.2016.07.003
Fabi, V., Andersen, R. V., and Corgnati, S. P. (2013a). Influence of occupant's heating set-point preferences on indoor environmental quality and heating demand in residential buildings. HVAC R Res. 19, 635–645. doi: 10.1080/10789669.2013.789372
Fabi, V., Andersen, R. V., Corgnati, S. P., and Olesen, B. W. (2013b). A methodology for modelling energy-related human behaviour: application to window opening behaviour in residential buildings. Build. Simul. 6, 415–427. doi: 10.1007/s12273-013-0119-6
Felnhofer, A., Kothgassner, O. D., Beutl, L., Hlavacs, H., and Kryspin-Exner, I. (2012). “Is virtual reality made for men only? Exploring gender differences in the sense of presence,” in Proceedings of the International Society on Presence Research (Philadelphia, PA), 103–112.
Frontczak, M., and Wargocki, P. (2011). Literature survey on how different factors influence human comfort in indoor environments. Build. Environ. 46, 922–937. doi: 10.1016/j.buildenv.2010.10.021
Gagge, A. P., and Nishi, Y. (2011). “Heat exchange between human skin surface and thermal environment,” in Comprehensive Physiology (Hoboken, NJ, USA: John Wiley and Sons Inc.), 69–92. doi: 10.1002/cphy.cp090105
Gavgani, A. M., Nesbitt, K. V., Blackmore, K. L., and Nalivaiko, E. (2017). Profiling subjective symptoms and autonomic changes associated with cybersickness. Auton. Neurosci. 203, 41–50. doi: 10.1016/j.autneu.2016.12.004
Glymour, C., Zhang, K., and Spirtes, P. (2019). Review of causal discovery methods based on graphical models. Front. Genet. 10:524. doi: 10.3389/fgene.2019.00524
Goto, T., Toftum, J., De Dear, R., and Fanger, P. O. (2006). Thermal sensation and thermophysiological responses to metabolic step-changes. Int. J. Biometeorol. 50, 323–332. doi: 10.1007/s00484-005-0016-5
Granger, C. W. J. (1969). Investigating causal relations by econometric models and cross-spectral methods. Econometrica 37, 438. doi: 10.2307/1912791
Greaves, M., Zibarras, L. D., and Stride, C. (2013). Using the theory of planned behavior to explore environmental behavioral intentions in the workplace. J. Environ. Psychol. 34, 109–120. doi: 10.1016/j.jenvp.2013.02.003
Greenland, S., Pearl, J., and Robins, J. M. (1999). Causal diagrams for epidemiologic research. Epidemiology 10, 37–48. doi: 10.1097/00001648-199901000-00008
Gunay, H. B., Shen, W., Newsham, G., and Ashouri, A. (2018). Modelling and analysis of unsolicited temperature setpoint change requests in office buildings. Build. Environ. 133, 203–212. doi: 10.1016/j.buildenv.2018.02.025
Guo, R., Cheng, L., Li, J., Hahn, P. R., and Liu, H. (2018). A survey of learning causality with data: problems and methods. ACM Comput. Surv. 53, 1–37. doi: 10.1145/3397269
Haldi, F., and Robinson, D. (2008). On the behaviour and adaptation of office occupants. Build. Environ. 43, 2163–2177. doi: 10.1016/j.buildenv.2008.01.003
Haldi, F., and Robinson, D. (2009). Interactions with window openings by office occupants. Build. Environ. 44, 2378–2395. doi: 10.1016/j.buildenv.2009.03.025
Haldi, F., and Robinson, D. (2011). Modelling occupants' personal characteristics for thermal comfort prediction. Int. J. Biometeorol. 55, 681–694. doi: 10.1007/s00484-010-0383-4
Hartanto, D., Kampmann, I. L., Morina, N., Emmelkamp, P. G. M., Neerincx, M. A., and Brinkman, W. P. (2014). Controlling social stress in virtual reality environments. PLoS ONE 9:e92804. doi: 10.1371/journal.pone.0092804
Heckerman, D. (1995). A tutorial on learning with bayesian networks. Mach. Learn. 20, 197–243. doi: 10.1016/B978-1-55860-377-6.50079-7
Heydarian, A., Carneiro, J. P., Gerber, D., Becerik-Gerber, B., Hayes, T., and Wood, W. (2015). Immersive virtual environments versus physical built environments: a benchmarking study for building design and user-built environment explorations. Autom. Construct. 54, 116–126. doi: 10.1016/j.autcon.2015.03.020
Hofman, J. M., Sharma, A., and Watts, D. J. (2017). Prediction and explanation in social systems. Science 355, 486–488. doi: 10.1126/science.aal3856
Hong, T., D'Oca, S., Taylor-Lange, S. C., Turner, W. J. N., Chen, Y., and Corgnati, S. P. (2015). An ontology to represent energy-related occupant behavior in buildings. Part II: Implementation of the DNAS framework using an XML schema. Build. Environ. 94, 196–205. doi: 10.1016/j.buildenv.2015.08.006
Huang, S., Ramirez, C., Kennedy, K., and Mallory, J. (2017). A new approach to extrapolate forest attributes from field inventory with satellite and auxiliary data sets. For. Sci. 63, 232–240. doi: 10.5849/forsci.16-028
Ijsselsteijn, W. a., de Ridder, H., Freeman, J., and Avons, S. E. (2000). Presence: concept, determinants and measurement. Proc. SPIE Hum. Vis. Electron. Imaging V 31, 520–529. doi: 10.1117/12.387188
Indraganti, M., Ooka, R., and Rijal, H. B. (2015). Thermal comfort in offices in India: behavioral adaptation and the effect of age and gender. Energy Build. 103, 284–295. doi: 10.1016/j.enbuild.2015.05.042
Indraganti, M., and Rao, K. D. (2010). Effect of age, gender, economic group and tenure on thermal comfort: a field study in residential buildings in hot and dry climate with seasonal variations. Energy Build. 42, 273–281. doi: 10.1016/j.enbuild.2009.09.003
ISO, ISO 9886:2004 (2004). Ergonomics Evaluation of Thermal Strain by Physiological Measurements. Ergonomics of the Physical Environment, ISO Technical Committees, ISO/TC 159.
ISO, ISO 9920:2007 (2007). Ergonomics of the Thermal Environment. Estimation of Thermal Insulation and Water Vapour Resistance of a Clothing Ensemble. Geneva: International Organization for Standardization.
Jacobsen, M., Webster, M., and Vairavamoorthy, K. (2012). The Future of Water in African Cities: Why Waste Water? Washington, DC: World Bank Publications.
Janda, K. B. (2011). Buildings don't use energy: people do. Archit. Sci. Rev. 54, 15–22. doi: 10.3763/asre.2009.0050
Jensen, K. L., Toftum, J., and Friis-Hansen, P. (2009). A Bayesian Network approach to the evaluation of building design and its consequences for employee performance and operational costs. Build. Environ. 44, 456–462. doi: 10.1016/j.buildenv.2008.04.008
Jerome, C. J., and Witmer, B. (2002). Immersive tendency, feeling of presence, and simulator sickness: formulation of a causal model. Proc. Hum. Factors Ergon. Soc. Annu. Meet. 46, 2197–2201. doi: 10.1177/154193120204602620
Judea, P., and Dana, M. (2018). The Book of Why: The New Science of Cause and Effect. New York, NY: Basic Books
Kalisch, M., and Buehlmann, P. (2005). Estimating high-dimensional directed acyclic graphs with the PC-algorithm. J. Mach. Learn. Res. 8, 613–636. doi: 10.5555/1248659.1248681
Keet, C. M. (2013). “Closed world assumption,” in Encyclopedia of Systems Biology (New York, NY: Springer), 415–415. doi: 10.1007/978-1-4419-9863-7_731
Kennedy, R. S., Lane, N. E., Berbaum, K. S., and Lilienthal, M. G. (1993). Simulator sickness questionnaire: an enhanced method for quantifying simulator sickness. Int. J. Aviat. Psychol. 3, 203–220. doi: 10.1207/s15327108ijap0303_3
Kim, Y. Y., Kim, H. J., Kim, E. N., Ko, H. D., and Kim, H. T. (2005). Characteristic changes in the physiological components of cybersickness. Psychophysiology 42, 616–625. doi: 10.1111/j.1469-8986.2005.00349.x
Kinateder, M., Ronchi, E., Gromer, D., Müller, M., Jost, M., Nehfischer, M., et al. (2014). Social influence on route choice in a virtual reality tunnel fire. Transp. Res. Part F Traffic Psychol. Behav. 26, 116–125. doi: 10.1016/j.trf.2014.06.003
Klosterhalfen, S., Kellermann, S., Stockhorst, U., Hall, G., and Enck, P. (2005). Effects of ethnicity and gender on motion sickness susceptibility. Aviat. Space. Environ. Med. 76, 1051–1057.
Korb, K. B., and Nicholson, A. E. (2010). Bayesian Artificial Intelligence, Second Edn. Boca Raton: CRC Press doi: 10.1201/b10391
Kuhnert, P. M., Martin, T. G., and Griffiths, S. P. (2010). A guide to eliciting and using expert knowledge in Bayesian ecological models. Ecol. Lett. 13, 900–914. doi: 10.1111/j.1461-0248.2010.01477.x
Kuliga, S. F., Thrash, T., Dalton, R. C., and Hölscher, C. (2015). Virtual reality as an empirical research tool—exploring user experience in a real building and a corresponding virtual model. Comput. Environ. Urban Syst. 54, 363–375. doi: 10.1016/j.compenvurbsys.2015.09.006
Lai, A. C. K., Mui, K. W., Wong, L. T., and Law, L. Y. (2009). An evaluation model for indoor environmental quality (IEQ) acceptance in residential buildings. Energy Build. 41, 930–936. doi: 10.1016/j.enbuild.2009.03.016
Lan, L., Lian, Z., Liu, W., and Liu, Y. (2008). Investigation of gender difference in thermal comfort for Chinese people. Eur. J. Appl. Physiol. 102, 471–480. doi: 10.1007/s00421-007-0609-2
Langsrud, Ø. (2003). ANOVA for unbalanced data: Use Type II instead of Type III sums of squares. Stat. Comput. 13, 163–167. doi: 10.1023/A:1023260610025
LaViola, J. J. (2000). A discussion of cybersickness in virtual environments. ACM SIGCHI Bull. 32, 47–56. doi: 10.1145/333329.333344
Lessiter, J., Freeman, J., Keogh, E., and Davidoff, J. (2001). A cross-media presence questionnaire: the ITC-sense of presence inventory. Presence Teleoperators Virtual Environ. 10, 282–297. doi: 10.1162/105474601300343612
Lewis, M., and Kuerbis, A. (2016). An overview of causal directed acyclic graphs for substance abuse researchers. J. Drug Alcohol Res. 2016. doi: 10.4303/jdar/235992
Lin, B., Wang, Z., Liu, Y., Zhu, Y., and Ouyang, Q. (2016). Investigation of winter indoor thermal environment and heating demand of urban residential buildings in China's hot summer—cold winter climate region. Build. Environ. 101, 9–18. doi: 10.1016/j.buildenv.2016.02.022
Liu, H., Liao, J., Yang, D., Du, X., Hu, P., Yang, Y., et al. (2014). The response of human thermal perception and skin temperature to step-change transient thermal environments. Build. Environ. 73, 232–238. doi: 10.1016/j.buildenv.2013.12.007
Liu, Q., Basu, S., Ganguly, S., Mukhopadhyay, S., DiBiano, R., Karki, M., et al. (2019). DeepSat V2: feature augmented convolutional neural nets for satellite image classification. Remote Sens. Lett. 11, 156–165. doi: 10.1080/2150704X.2019.1693071
Liu, W., Lian, Z., Deng, Q., and Liu, Y. (2011). Evaluation of calculation methods of mean skin temperature for use in thermal comfort study. Build. Environ. 46, 478–488. doi: 10.1016/j.buildenv.2010.08.011
Luo, W., Zhu, Y., and Ghosh, D. (2017). On estimating regression-based causal effects using sufficient dimension reduction. Biometrika 104, 51–65. doi: 10.1093/biomet/asw068
Macovei, O.-I. (2015). Applying the theory of planned behavior in predicting pro-environmental behavior: the case of energy conservation. Acta Univ. Danubius. Œcon. 11, 15–32.
Magliacane, S., Claassen, T., and Mooij, J. M. (2016). Ancestral causal inference. Adv. Neural Inf. Process. Syst., 4473–4481.
Maier, T., Krzaczek, M., and Tejchman, J. (2009). Comparison of physical performances of the ventilation systems in low-energy residential houses. Energy Build. 41, 337–353. doi: 10.1016/j.enbuild.2008.10.007
Maldonado, G., and Greenland, S. (2002). Estimating causal effects. Int. J. Epidemiol. 31, 422–438. doi: 10.1093/ije/31.2.422
Maldovan, K. D., Messner, J. I., and Faddoul, M. (2006). “Framework for reviewing mockups in an immersive environment,” in Convr 2006, 6th.
Mansinghka, V., Kemp, C., Griffiths, T., and Tenenbaum, J. (2012). “Structured Priors for Structure Learning,” in Proc. 22nd Conf. Uncertain. Artif. Intell. UAI 2006, 324–331.
Marcot, B. G., Steventon, J. D., Sutherland, G. D., and McCann, R. K. (2006). Guidelines for developing and updating Bayesian belief networks applied to ecological modeling and conservation. Can. J. For. Res. 36, 3063–3074. doi: 10.1139/x06-135
Martin, T. G., Burgman, M. A., Fidler, F., Kuhnert, P. M., Low-Choy, S., Mcbride, M., et al. (2012). Eliciting Expert Knowledge in Conservation Science. Conserv. Biol. 26, 29–38. doi: 10.1111/j.1523-1739.2011.01806.x
Martinaitis, V., Zavadskas, E. K., Motuziene, V., and Vilutiene, T. (2015). Importance of occupancy information when simulating energy demand of energy efficient house: a case study. Energy Build. 101, 64–75. doi: 10.1016/j.enbuild.2015.04.031
Meek, C. (2013). Causal inference and causal explanation with background knowledge. Proc. Elev. Conf. Uncertain. Artif. Intell. 403–410.
Menard, S. W. (2002). Applied Logistic Regression Analysis. Thousand Oaks, California: Sage Publications.
Morgan, S. L., and Winship, C. (2014). Counterfactuals and Causal Inference. Cambridge: Cambridge University Press.
Nabijiang, A., Mukhopadhyay, S., Zhu, Y., Gudishala, R., Saeidi, S., and Liu, Q. (2019). Why Do You Take That Route? arXiv.
Nalivaiko, E., Davis, S. L., Blackmore, K. L., Vakulin, A., and Nesbitt, K. V. (2015). Cybersickness provoked by head-mounted display affects cutaneous vascular tone, heart rate and reaction time. Physiol. Behav. 151, 583–590. doi: 10.1016/j.physbeh.2015.08.043
Nanda, R., Saguna, S., Mitra, K., and Åhlund, C. (2016). “BayesForSG: A Bayesian model for forecasting thermal load in smart grids,” in Proceedings of the ACM Symposium on Applied Computing (New York, NY: Association for Computing Machinery), 2135–2141. doi: 10.1145/2851613.2853127
Neil, M., Fenton, N., and Nielsen, L. (2000). Building large-scale Bayesian networks. Knowl. Eng. Rev. 15, 257–284. doi: 10.1017/S0269888900003039
Nieri, M., Rotundo, R., Franceschi, D., Cairo, F., Cortellini, P., and Pini Prato, G. (2009). Factors affecting the outcome of the coronally advanced flap procedure: a Bayesian network analysis. J. Periodontol. 80, 405–410. doi: 10.1902/jop.2009.080146
Nisiforou, O. A., Poullis, S., and Charalambides, A. G. (2012). Behaviour, attitudes and opinion of large enterprise employees with regard to their energy usage habits and adoption of energy saving measures. Energy Build. 55, 299–311. doi: 10.1016/j.enbuild.2012.08.034
Niu, S., Pan, W., and Zhao, Y. (2016). A virtual reality integrated design approach to improving occupancy information integrity for closing the building energy performance gap. Sustain. Cities Soc. 27, 275–286. doi: 10.1016/j.scs.2016.03.010
Nkurikiyeyezu, K. N., Suzuki, Y., and Lopez, G. F. (2018). Heart rate variability as a predictive biomarker of thermal comfort. J. Ambient Intell. Humaniz. Comput. 9, 1465–1477. doi: 10.1007/s12652-017-0567-4
Paillard, A. C., Quarck, G., Paolino, F., Denise, P., Paolino, M., Golding, J. F., et al. (2013). Motion sickness susceptibility in healthy subjects and vestibular patients: effects of gender, age and trait-anxiety. J. Vestib. Res. 23, 203–209. doi: 10.3233/VES-130501
Parsons, K. C. (2002). The effects of gender, acclimation state, the opportunity to adjust clothing and physical disability on requirements for thermal comfort. Energy Build. 34, 593–599. doi: 10.1016/S0378-7788(02)00009-9
Pearl, J. (1988). Probabilistic Reasoning in Intelligent Systems: Networks of Plausible Inference. San Francisco, CA: Judea Pearl Morgan Kaufmann Publishers Inc.
Pearl, J. (2009a). Causal inference in statistics: An overview. Stat. Surv. 3, 96–146. doi: 10.1214/09-SS057
Pearl, J. (2009b). Causality: Models, Reasoning and Inference, 2nd Edn. Cambridge: Cambridge University Press.
Peters, J., Janzing, D., and Schölkopf, B. (2017). Elements of Causal Inference: Foundations and Learning Algorithms. Cambridge, MA: MIT Press
Petersen, M. L., and van der Laan, M. J. (2014). Causal models and learning from data. Epidemiology 25, 418–426. doi: 10.1097/EDE.0000000000000078
Ren, X., Yan, D., and Wang, C. (2014). Air-conditioning usage conditional probability model for residential buildings. Build. Environ. 81, 172–182. doi: 10.1016/j.buildenv.2014.06.022
Rentala, G., Zhu, Y., and Johannsen, N. M. (2021). Impact of outdoor temperature variations on thermal state in experiments using immersive virtual environment. Sustainability 13:10638. doi: 10.3390/su131910638
Rijal, H. B., Tuohy, P. G., Nicol, J. F., Humphreys, M. A., Samuel, A., and Clarke, J. (2008). Development of adaptive algorithms for the operation of windows, fans, and doors to predict thermal comfort and energy use in Pakistani buildings. ASHRAE Trans. 114, 555–573.
Robins, J. M. (2001). Data, design, and background knowledge in etiologic inference. Epidemiology 12, 313–320. doi: 10.1097/00001648-200105000-00011
Rosenbaum, P. R., and Rubin, D. B. (1983). The central role of the propensity score in observational studies for causal effects. Biometrika 70, 41–55. doi: 10.1093/biomet/70.1.41
Rubin, B. D. (1990). Comment: Neyman (1923) and causal inference in experiments and observational studies. Stat. Sci. 5, 472–480. doi: 10.1214/ss/1177012032
Rubin, D. B. (1974). Estimating causal effects of treatments in randomized and nonrandomized studies. J. Educ. Psychol. 66, 688–701. doi: 10.1037/h0037350
Ruotolo, F., Maffei, L., Di Gabriele, M., Iachini, T., Masullo, M., Ruggiero, G., et al. (2013). Immersive virtual reality and environmental noise assessment: an innovative audio-visual approach. Environ. Impact Assess. Rev. 41, 10–20. doi: 10.1016/j.eiar.2013.01.007
Rupp, R. F., Kim, J., de Dear, R., and Ghisi, E. (2018). Associations of occupant demographics, thermal history and obesity variables with their thermal comfort in air-conditioned and mixed-mode ventilation office buildings. Build. Environ. 135, 1–9. doi: 10.1016/j.buildenv.2018.02.049
Saeidi, S., Rentala, G., Rizzuto, T., Hong, T., Johannsen, N., and Zhu, Y. (2021). Exploring thermal state in mixed immersive virtual environments. J. Build. Eng. 44:102918. doi: 10.1016/j.jobe.2021.102918
Schakib-Ekbatan, K., Çakici, F. Z., Schweiker, M., and Wagner, A. (2015). Does the occupant behavior match the energy concept of the building?—Analysis of a German naturally ventilated office building. Build. Environ. 84, 142–150. doi: 10.1016/j.buildenv.2014.10.018
Schubert, T., Friedmann, F., and Regenbrecht, H. (1999). Embodied presence in virtual environments. Vis. Represent. Interpret. 1999, 269–278. doi: 10.1007/978-1-4471-0563-3_30
Schuemie, M. J., Abel, B., and Emmelkamp, P. M. G. (2005). “The effect of locomotion technique on presence, fear and usability in a virtual environment,” in Proceedings of Euromedia (Toulouse), 129–135.
Schweiker, M., Ampatzi, E., Andargie, M. S., Andersen, R. K., Azar, E., Barthelmes, V. M., et al. (2020). Review of multi-domain approaches to indoor environmental perception and behaviour. Build. Environ. 176:106804. doi: 10.1016/j.buildenv.2020.106804
Schweiker, M., Carlucci, S., Andersen, R. K., Dong, B., and O'Brien, W. (2017). “Occupancy and occupants' actions,” in Exploring Occupant Behavior in Buildings: Methods and Challenges (Berlin: Springer International Publishing), 7–38. doi: 10.1007/978-3-319-61464-9_2
Schweiker, M., and Shukuya, M. (2009). Comparison of theoretical and statistical models of air-conditioning-unit usage behaviour in a residential setting under Japanese climatic conditions. Build. Environ. 44, 2137–2149. doi: 10.1016/j.buildenv.2009.03.004
Schweiker, M., and Shukuya, M. (2010). Comparative effects of building envelope improvements and occupant behavioural changes on the exergy consumption for heating and cooling. Energy Policy 38, 2976–2986. doi: 10.1016/j.enpol.2010.01.035
Scutari, M., Auconi, P., Caldarelli, G., and Franchi, L. (2017). Bayesian networks analysis of malocclusion data. Sci. Rep. 7, 1–11. doi: 10.1038/s41598-017-15293-w
Slater, M., and Wilbur, S. (1997). A framework for immersive virtual environments (FIVE): speculations on the role of presence in virtual environments. Presence Teleoperators Virtual Environ. 6, 603–616. doi: 10.1162/pres.1997.6.6.603
Spirtes, P., Glymour, C., and Scheines, R. (2000). Causation, Prediction, and Search, ed R. S. Peter Spirtes (Cambridge, MA: MIT Press).
Takada, S., Matsumoto, S., and Matsushita, T. (2013). Prediction of whole-body thermal sensation in the non-steady state based on skin temperature. Build. Environ. 68, 123–133. doi: 10.1016/j.buildenv.2013.06.004
Tetlow, R. M., van Dronkelaar, C., Beaman, C. P., Elmualim, A. A., and Couling, K. (2015). Identifying behavioural predictors of small power electricity consumption in office buildings. Build. Environ. 92, 75–85. doi: 10.1016/j.buildenv.2015.04.009
Tosun, A., Bener, A. B., and Akbarinasaji, S. (2017). A systematic literature review on the applications of Bayesian networks to predict software quality. Softw. Qual. J. 25, 273–305. doi: 10.1007/s11219-015-9297-z
Tsapeli, F., and Musolesi, M. (2015). Investigating causality in human behavior from smartphone sensor data: a quasi-experimental approach. EPJ Data Sci. 4:24. doi: 10.1140/epjds/s13688-015-0061-1
Uusitalo, L. (2007). Advantages and challenges of Bayesian networks in environmental modelling. Ecol. Modell. 203, 312–318. doi: 10.1016/j.ecolmodel.2006.11.033
van der Laan, M. J., and Rubin, D. (2006). Targeted maximum likelihood learning. Int. J. Biostat. 2:1043. doi: 10.2202/1557-4679.1043
Van Der Lans, A. A. J. J., Hoeks, J., Brans, B., Vijgen, G. H. E. J., Visser, M. G. W., Vosselman, M. J., et al. (2013). Cold acclimation recruits human brown fat and increases nonshivering thermogenesis. J. Clin. Invest. 123, 3395–3403. doi: 10.1172/JCI68993
Vilar, E., Rebelo, F., and Noriega, P. (2014). Indoor human wayfinding performance using vertical and horizontal signage in virtual reality. Hum. Factors Ergon. Manuf. 24, 601–615. doi: 10.1002/hfm.20503
Vlek, C., and Steg, L. (2007). Human behavior and environmental sustainability: problems, driving forces, and research topics. J. Soc. Issues 63, 1–19. doi: 10.1111/j.1540-4560.2007.00493.x
Vogiatzi, C., Gemenetzi, G., Massou, L., Poulopoulos, S., Papaefthimiou, S., and Zervas, E. (2018). Energy use and saving in residential sector and occupant behavior: a case study in Athens. Energy Build. 181, 1–9. doi: 10.1016/j.enbuild.2018.09.039
Walkowiak, S., Foulsham, T., and Eardley, A. F. (2015). Individual differences and personality correlates of navigational performance in the virtual route learning task. Comput. Human Behav. 45, 402–410. doi: 10.1016/j.chb.2014.12.041
Wall, D., Bonino, S., Savona, E., Riccardi, M., and Berlusconi, G. (2015). Organized Crime Infiltration of Legitimate Businesses in Europe: A Pilot Project in Five European Countries. Final Rep. Proj. ARIEL – Assess. Risk Infiltration Organ. Crime EU MSs Legitimate Econ. a Pilot Proj. 5 EU Ctries.
Wei, S., Buswell, R., and Loveday, D. (2013). Factors affecting “end-of-day” window position in a non-air-conditioned office building. Energy Build. 62, 87–96. doi: 10.1016/j.enbuild.2013.02.060
Witmer, B. G., Jerome, C. J., and Singer, M. J. (2005). The factor structure of the presence questionnaire. Presence Teleoperators Virtual Environ. 14, 298–312. doi: 10.1162/105474605323384654
Witmer, B. G., and Singer, M. J. (1998). Measuring presence in virtual environments: a presence questionnaire. Presence: Teleoper. Virtual Environ. 7, 225–240. doi: 10.1162/105474698565686
Wong, L. T., Mui, K. W., and Hui, P. S. (2008). A multivariate-logistic model for acceptance of indoor environmental quality (IEQ) in offices. Build. Environ. 43, 1–6. doi: 10.1016/j.buildenv.2007.01.001
Xiong, J., Zhou, X., Lian, Z., You, J., and Lin, Y. (2016). Thermal perception and skin temperature in different transient thermal environments in summer. Energy Build. 128, 155–163. doi: 10.1016/j.enbuild.2016.06.085
Xu, J. G., Zhao, Y., Chen, J., and Han, C. (2015). A structure learning algorithm for Bayesian network using prior knowledge. J. Comput. Sci. Technol. 30, 713–724. doi: 10.1007/s11390-015-1556-8
Yan, D., O'Brien, W., Hong, T., Feng, X., Burak Gunay, H., Tahmasebi, F., et al. (2015). Occupant behavior modeling for building performance simulation: current state and future challenges. Energy Build. 107, 264–278. doi: 10.1016/j.enbuild.2015.08.032
Yang, J., Santamouris, M., and Lee, S. E. (2016). Review of occupancy sensing systems and occupancy modeling methodologies for the application in institutional buildings. Energy Build. 121, 344–349. doi: 10.1016/j.enbuild.2015.12.019
Yao, L., Chu, Z., Li, S., Li, Y., Gao, J., and Zhang, A. (2020). A survey on causal inference. ACM Trans. Knowl. Discov. Data 15, 1–46.
Yao, Y., Lian, Z., Liu, W., and Shen, Q. (2008). Experimental study on physiological responses and thermal comfort under various ambient temperatures. Physiol. Behav. 93, 310–321. doi: 10.1016/j.physbeh.2007.09.012
Yeom, D., Choi, J.-H., and Zhu, Y. (2019b). Investigation of the physiological differences between immersive virtual environment and indoor enviorment in a building. Indoor Built Environ. 28, 46–62. doi: 10.1177/1420326X17731945
Yeom, D., Choi, J. H., and Kang, S. H. (2019a). Investigation of the physiological differences in the immersive virtual reality environment and real indoor environment: focused on skin temperature and thermal sensation. Build. Environ. 154, 44–54. doi: 10.1016/j.buildenv.2019.03.013
Yun, G. Y., and Steemers, K. (2008). Time-dependent occupant behaviour models of window control in summer. Build. Environ. 43, 1471–1482. doi: 10.1016/j.buildenv.2007.08.001
Yun, G. Y., Steemers, K., and Baker, N. (2008). Natural ventilation in practice: linking facade design, thermal performance, occupant perception and control. Build. Res. Inf. 36, 608–624. doi: 10.1080/09613210802417241
Yun, G. Y., Tuohy, P., and Steemers, K. (2009). Thermal performance of a naturally ventilated building using a combined algorithm of probabilistic occupant behaviour and deterministic heat and mass balance models. Energy Build. 41, 489–499. doi: 10.1016/j.enbuild.2008.11.013
Zhang, H. (2003). Indoor Environmental Quality (IEQ) Title Human Thermal Sensation and Comfort in Transient and Non-Uniform Thermal Environments. Berkeley: University of California.
Zhang, J. (2008). On the completeness of orientation rules for causal discovery in the presence of latent confounders and selection bias. Artif. Intell. 172, 1873–1896. doi: 10.1016/j.artint.2008.08.001
Zhang, Y., and Barrett, P. (2012). Factors influencing the occupants' window opening behaviour in a naturally ventilated office building. Build. Environ. 50, 125–134. doi: 10.1016/j.buildenv.2011.10.018
Zhang, Y., Chen, H., Wang, J., and Meng, Q. (2016). Thermal comfort of people in the hot and humid area of China—impacts of season, climate, and thermal history. Indoor Air 26, 820–830. doi: 10.1111/ina.12256
Zhang, Y., Young, J. G., Thamer, M., and Hernán, M. A. (2018). Comparing the effectiveness of dynamic treatment strategies using electronic health records: an application of the parametric g-formula to anemia management strategies. Health Serv. Res. 53, 1900–1918. doi: 10.1111/1475-6773.12718
Zhang, Y., and Zhao, R. (2008). Overall thermal sensation, acceptability and comfort. Build. Environ. 43, 44–50. doi: 10.1016/j.buildenv.2006.11.036
Keywords: immersive virtual environments, thermal states, correlation, causal inference, occupant energy behavioral intentions
Citation: Rentala G, Zhu Y and Mukhopadhyay S (2021) Application of Causal Inference to the Analysis of Occupant Thermal State and Energy Behavioral Intentions in Immersive Virtual Environments. Front. Sustain. Cities 3:730474. doi: 10.3389/frsc.2021.730474
Received: 25 June 2021; Accepted: 02 November 2021;
Published: 29 November 2021.
Edited by:
Marilena De Simone, University of Calabria, ItalyReviewed by:
Mehdi Ashayeri, Southern Illinois University Carbondale, United StatesElie Azar, Khalifa University, United Arab Emirates
Copyright © 2021 Rentala, Zhu and Mukhopadhyay. This is an open-access article distributed under the terms of the Creative Commons Attribution License (CC BY). The use, distribution or reproduction in other forums is permitted, provided the original author(s) and the copyright owner(s) are credited and that the original publication in this journal is cited, in accordance with accepted academic practice. No use, distribution or reproduction is permitted which does not comply with these terms.
*Correspondence: Yimin Zhu, eWltaW56aHVAbHN1LmVkdQ==