 Amit Kumar Mishra
 Prashant Rajput
 Amit Singh
 Chander Kumar Singh
 Rajesh Kumar Mall
95% of researchers rate our articles as excellent or good
Learn more about the work of our research integrity team to safeguard the quality of each article we publish.
Find out more
ORIGINAL RESEARCH article
Front. Sustain. Cities , 29 September 2021
Sec. Climate Change and Cities
Volume 3 - 2021 | https://doi.org/10.3389/frsc.2021.705051
This article is part of the Research Topic The Role of Climate and Air Pollution in Human Health and Urban Chemistry in Asian Cities View all 11 articles
The COVID-19 pandemic has affected severely the economic structure and health care system, among others, of India and the rest of the world. The magnitude of its aftermath is exceptionally devastating in India, with the first case reported in January 2020, and the number has risen to ~31.3 million as of July 23, 2021. India imposed a complete lockdown on March 25, which severely impacted migrant population, industrial sector, tourism industry, and overall economic growth. Herein, the impacts of lockdown and unlock phases on ambient atmospheric air quality variables have been assessed across 16 major cities of India covering the north-to-south stretch of the country. In general, all assessed air pollutants showed a substantial decrease in AQI values during the lockdown compared with the reference period (2017–2019) for almost all the reported cities across India. On an average, about 30–50% reduction in AQI has been observed for PM2.5, PM10, and CO, and maximum reduction of 40–60% of NO2 has been observed herein, while the data was average for northern, western, and southern India. SO2 and O3 showed an increase over a few cities as well as a decrease over the other cities. Maximum reduction (49%) in PM2.5 was observed over north India during the lockdown period. Furthermore, the changes in pollution levels showed a significant reduction in the first three phases of lockdown and a steady increase during subsequent phase of lockdown and unlock period. Our results show the substantial effect of lockdown on reduction in atmospheric loading of key anthropogenic pollutants due to less-to-no impact from industrial activities and vehicular emissions, and relatively clean transport of air masses from the upwind region. These results indicate that by adopting cleaner fuel technology and avoiding poor combustion activities across the urban agglomerations in India could bring down ambient levels of air pollution at least by 30%.
A novel infectious disease for the first time was identified in Wuhan, China, in late December 2019 and was named as 2019 novel corona virus and later on renamed as the COVID-19 (Chen et al., 2020) on February 11, 2020 by the International Committee on Taxonomy of Viruses. Later on in January 2020, the World Health Organization (WHO) revealed human transmission of COVID-19 through respiratory droplets (WHO, 2020), which subsequently got spread throughout the China, and the outbreak was turned into an epidemic (Dutheil et al., 2020). On January 30, 2020, the WHO declared the COVID-19 as a global pandemic. Subsequently, the transmission of pandemic COVID-19 via airborne pathway was recognized by the WHO. After the severe acute respiratory syndrome coronavirus (SARS-CoV) in 2002, which influenced around 37 countries and the Middle East respiratory syndrome coronavirus (MERS-CoV) in 2012, the COVID-19 is the third major zoonotically spread calamity of the current century.
To slow down the rate of spread of virus, almost all the countries have followed partial-to-complete lockdown practice (Tosepu et al., 2020). Globally, the economic activities were ceased, and stock markets plunged along with the falling carbon emission. The industrial activities were shut down globally due to the imposed lockdown. The informal economic sector suffered a major fall along with the transport sector as most of the countries imposed complete lockdown. Global fossil fuel demand dropped down severely, as industrial and transport sectors came to a halt for a while across the world. As far as the scenario of COVID-19 in India is concerned, the first COVID-19 incidence in India was registered on January 30, 2020, in the state of Kerala, and the travel restrictions to several countries were imposed from March 11, 2020 soon after a steep rise in the number of incidences on March 4, 2020. From March 16 onward, all places of public gathering were shut down across India. The first nationwide lockdown, on a trial mode, was witnessed on March 22, 2020, and subsequently, from March 24, 2020 a nationwide complete lockdown for 21 days was announced by the Central Government of India. The different phases of lockdown and unlock in India are given in Table 1.
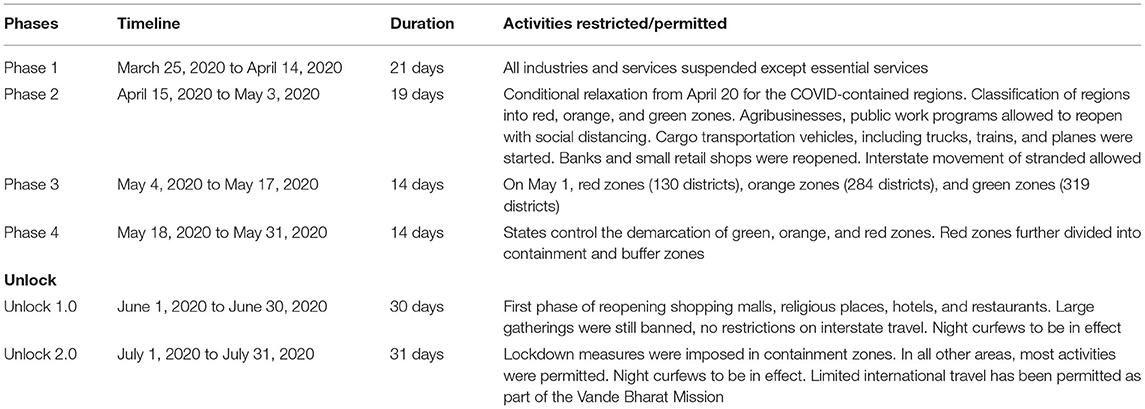
Table 1. Different timelines that India adopted for lockdown and unlock phases.
Significant impacts of lockdown were observed on air quality across the world (Berman and Ebisu, 2020; Nakada et al., 2020; Venter et al., 2020) and in India (Kumar, 2020; Kumar, 2020; Sarfraz et al., 2020; Sharma et al., 2020; Dumka et al., 2021). A positive association between COVID-19 cases and meteorological parameters has also been shown recently (Kumar, 2020). Dumka et al. (2021) has shown that more than 50% reduction in PM2.5 and NO2 concentrations occurred over Delhi—NCR, mainly due to restrictions in traffic-related activities. Nationwide lockdown amid the COVID-19 pandemic had a significant impact on the air quality index. Thus, a quantitative assessment of air quality variables is needed to understand the impact of lockdown on anthropogenic emission source impact and their reframe mitigation policies in India. The major objective of the present study was to assess the changes in ambient air quality during lockdown and in the subsequent unlock phases across India.
To assess the impact of nationwide lockdown on ambient air quality in India, we have chosen 16 major cities (Chandigarh, Delhi, Jaipur, Lucknow, Patna, Kolkata, Gandhinagar, Bhopal, Nashik, Mumbai, Nagpur, Hyderabad, Bengaluru, Chennai, Visakhapatnam, and Thiruvananthapuram) across the country (Figure 1). The selection of these cities is based on the level of urbanization linked to air pollution, implementation of lockdown policy, coverage of typical major cities in the country, and availability of data set of air pollution and meteorological parameters. The daily average (and median) along with minimum, maximum, and standard deviation of each of the air pollutants and meteorological parameters during January 1 to June 30 for 4 years (2017–2020) were retrieved from the World Air Quality Index (WAQI) Project (https://aqicn.org/data-platform/covid19/) having data source (for Indian region) originally from India's Central Pollution Control Board (cpcb.nic.in/), U.S. Embassy and Consulates' Air Quality Monitor in India (in.usembassy.gov/embassy-consulates/new-delhi/air-quality-data/), Delhi Pollution Control Committee (dpccairdata.com/), and India Meteorological Department (www.imd.gov.in/). The daily average air pollutants and meteorological data set for each of the cities have been deduced from the average of the respective data recorded from monitoring stations located in that city. The key air pollutant species such as particulate matter with aerodynamic diameter ≤2.5 and ≤10 μm (PM2.5 and PM10), nitrogen dioxide (NO2), sulfur dioxide (SO2), carbon monoxide (CO), and tropospheric ozone (O3) along with the meteorological parameters [relative humidity (RH), near surface air temperature (T), and wind speed (WS)] have been assessed herein.
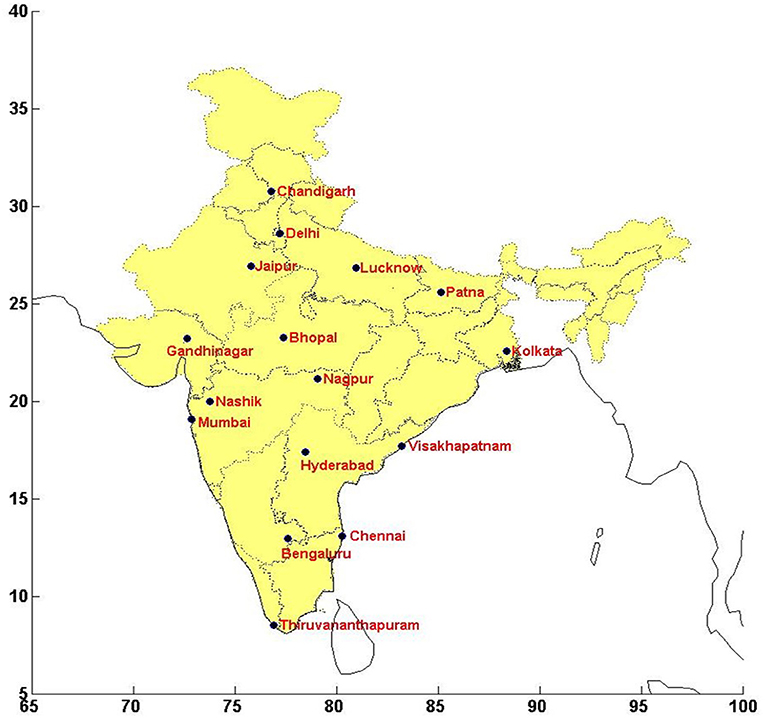
Figure 1. Map of India showing the geographical location of all the 16 cities studied herein.
All air pollutants reported in this study were converted with respect to the United States Environmental Protection Agency (US EPA) standard (Mintz, 2018). The first step is to identify the highest concentration of pollutants among all of the monitors within each locations and then truncate it as PM2.5 (μg/m3) to one decimal place, PM10 (μg/m3) to integer, CO (ppm) to one decimal place, SO2 (ppb) to integer, NO2 (ppb) to integer, and O3 (ppm) to three decimal places. Subsequently, with the aid of the two breakpoints, the concentration was summarized (Supplementary Table 1). Finally, the index was calculated using the following equation:
where, Ip is the index of a pollutant p, Cp is the truncated concentration of that pollutant p, BPHi is the concentration breakpoint ≥Cp, BPLo is the concentration breakpoint ≤Cp, IHi is the AQI value corresponding to BPHi, and ILo is the AQI value corresponding to BPLo. The details of AQI estimation for different pollutants have been provided elsewhere (Bishoi et al., 2009; Mintz, 2018).
The concentration of the ambient air pollutant not only depends on the intensity of its emission but also on meteorological conditions. Therefore, in order to see the net change due to restrictions on emission sources, we need to normalize the concentration of the pollutant with meteorology. There are various methods existing to account for (or normalize) meteorological effects on the concentration of the ambient air (Dai et al., 2020; Petetin et al., 2020; Falocchi et al., 2021). In this study, we have used the ventilation coefficient (VC) to normalize the meteorological influence (Dai et al., 2020) on ambient AQI. The hourly wind vector at 2 m (above the ground) and mixing-layer height data over all studied 16 cities (during March to June, 2017–2020) have been obtained from ERA5 global reanalysis products (Hersbach et al., 2020). The daily mean VC is estimated by taking the product of the daily mean mixing-layer height and wind speed for each of the cities during the study period. Furthermore, climatological or the long-term mean of VC (VCmean) specific to each city has been estimated by taking the average of daily VCs during the study period (2017–2020). The influence of meteorological dispersion on observed AQI has been removed by normalizing the AQI data of each pollutant with VCmean for every city using the following equation (2) as given by Dai et al. (2020).
where AQIVC, i is meteorology normalized AQI for the ith day, AQIi is the AQI measured on the ith day, and VCi is the ventilation coefficient on the ith day. Furthermore, meteorologically normalized (hereafter represented as “met normalized”) AQI data of each pollutant has been used to see the relative changes in AQI during the lockdown period compared with the reference period across the 16 Indian cities.
The wind speed and direction are important parameters that significantly impact the concentration of the pollutants in ambient air. We have analyzed the wind rose maps for reference and lockdown period for each city. Supplementary Figure 1 shows the prevailing wind direction and speeds in selected cities in north India for the study period. The suffixes “Ref” and “Cov” refer to reference period (in 2017, 2018, and 2019) and lockdown period due to COVID (in 2020) trends, respectively. The legend colors represent increasing wind speed from top to bottom. The wind rose plots for other cities are provided in the Supplementary Material for western Indian cities (Supplementary Figure 2) and south Indian cities (Supplementary Figure 3) in our study. Briefly, we have not found any significant change in prevailed wind directions during the COVID year with respect to reference period over any city. In other words, we can say that both the periods have a similar kind of wind pattern over the Indian cities. Furthermore, Table 2 shows the mean values of meteorological parameters (RH, T, and WS) during the reference and lockdown period for the 16 major cities of India. In general, the lockdown period was, on an average, characterized by relatively high humidity and lower mean temperature compared with the reference period. The wind speed appeared to be nearly similar during lockdown as well as the reference period. Nevertheless, the day-to-day variability in meteorological parameters for 1 year to another could be quite significant, and thus, taking into account for meteorological variability, while comparing pollutant concentrations is of utmost importance (Dandotiya et al., 2019; Nandi, 2020).
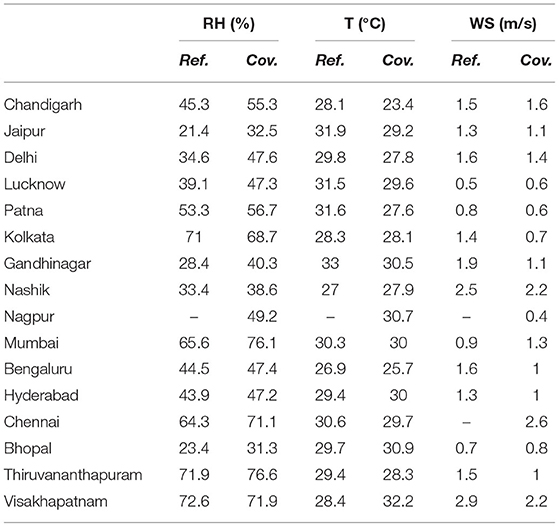
Table 2. Mean values of meteorological parameters during complete lockdown period (in 2020, as Cov.) and reference period (as Ref.).
Table 1 shows the different phases of lockdown and unlock period practiced in India to control the spread of COVID-19. Lockdown period was imposed in four phases: P1 (March 25 to April 14), P2 (April 15 to May 3), P3 (May 4 to May 17), and P4 (May 18 to May 31) (Saha and Chouhan, 2021). P1 and P2 were the periods of complete nationwide lockdown, whereas P3 and P4 were the periods of partial lockdown. In order to assess the maximum reduction in anthropogenic contribution to AQI, we choose the complete lockdown period. The mean USEPA standardized AQI values (with and without normalization to meteorological parameter) of various air pollutants averaged during March 25 to May 3 for the reference and lockdown period for the 16 major cities of India are shown in Table 3. Figure 2 shows city-specific percent change of key pollutants (with and without normalization to meteorological parameter viz. VC) averaged over complete lockdown period (phase 1 and phase 2: March 25 to May 3, 2020) compared with the reference time-period for the 16 major cities across India. Table 3 shows that the AQI values of key air pollutants get substantially increased after met normalization during the reference period over almost all Indian cities, whereas minimal effect has been observed during the lockdown period. Moreover, percent changes in key pollutants averaged over the complete lockdown period (Figure 2) show higher reduction for met normalized data compared with that of without met normalization. If we take only without met normalized data, on an average, more than 30% decrease has been observed in PM2.5 (−35% averaged over all cities), PM10 (−37% averaged over all cities), and CO (−32% averaged over all cities) over most of the cities in India. The maximum negative change is found in NO2 AQI over all the cities with about −42% averaged over India. From Figure 2 and Table 3, it is obvious that the average difference in values for with and without met normalization of air pollutants is 11 ± 3%. Furthermore, in general, with met normalized values were lower than without met normalized values. In the further discussion, we would be utilizing with met normalized values of AQI of air pollutants.
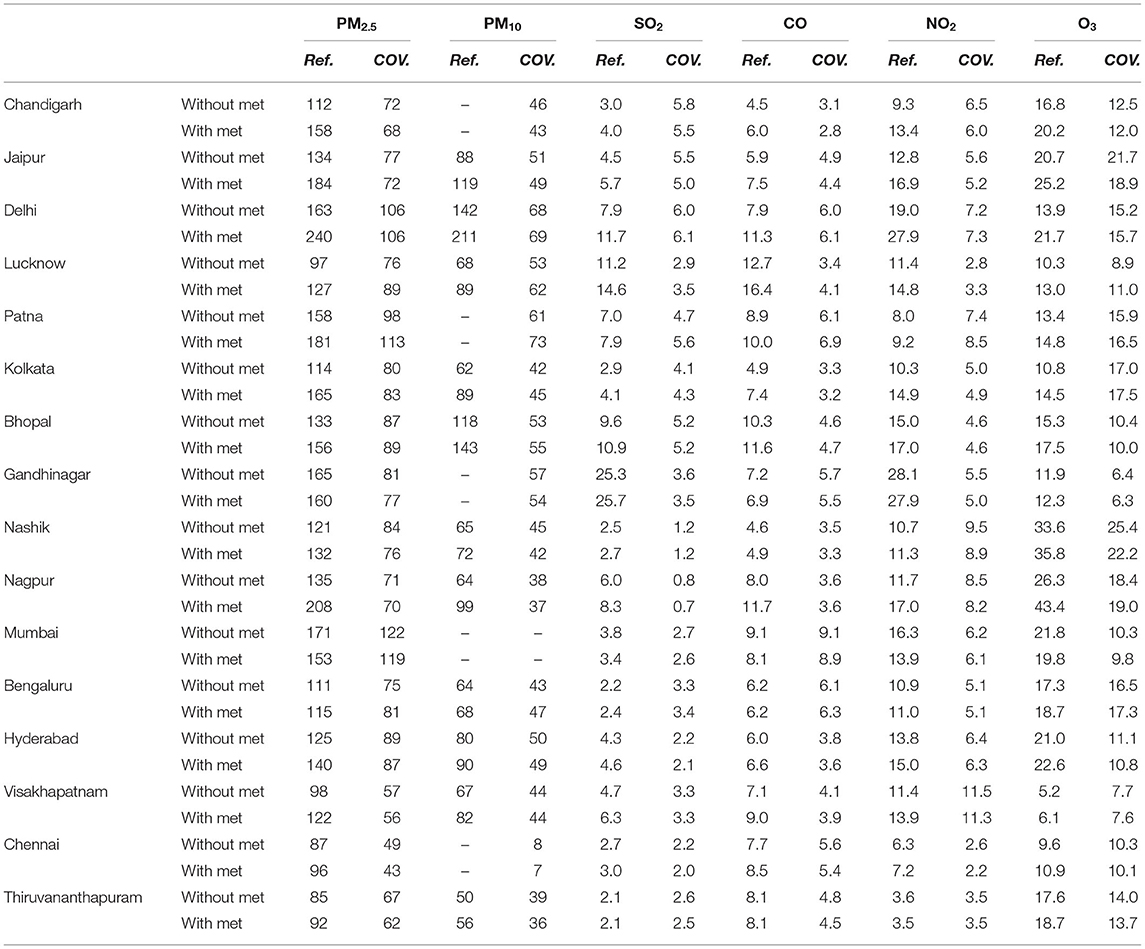
Table 3. Mean EPA AQI values of various air pollutants (with and without normalization to meteorological parameter) during complete lockdown period (in 2020, as Cov.) and reference period (as Ref.).
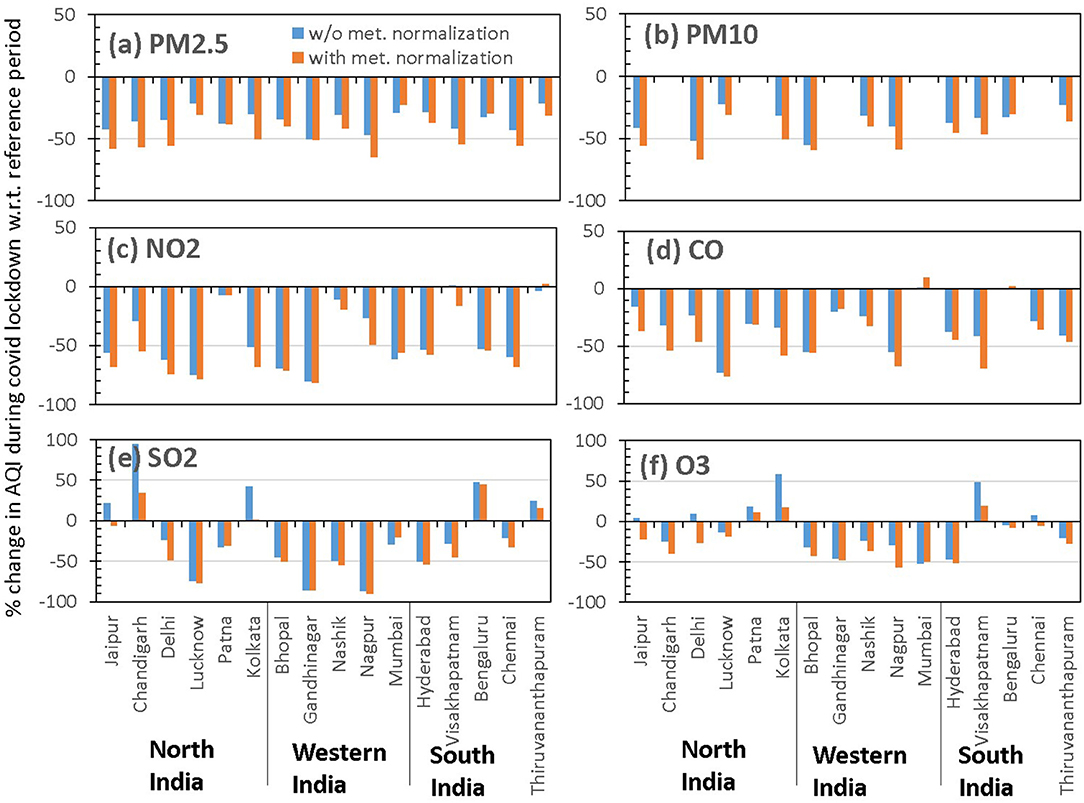
Figure 2. City-specific percent change of key pollutants (with and without meteorology normalization) during complete lockdown with respect to the reference time-period.
In general, all the air pollutants (met normalized) showed a substantial decrease in AQI values during COVID period compared with the reference period for almost all the assessed cities across India. On an average (over all cities), more than 24% decrease has been observed for all the AQI of the pollutant; PM2.5 decreased by 45%, PM10 decreased by 48%, and CO decreased by 41%. The maximum decrease has been found for NO2 AQI over all the cities with an overall decrease of 52% when averaged for all 16 cities. The decrease in PM pollution and gaseous pollutants (CO and NO2) clearly reflects the impact of ceased industrial and vehicular activities during lockdown. SO2 and O3 were also decreased in the lockdown period compared with the reference period, except over a few cities wherein these species showed an increase in their concentration during the lockdown period with respect to the reference period. For example, the SO2 AQI showed a statistically significant increase in Chandigarh (34.4%, from 4.0 ± 2.0 to 5.5 ± 3.2; two-tailed t-value: 3.5), Bengaluru (45%, from 2.4 ± 1.0 to 3.4 ± 1.5; two-tailed t-value: 4.8), and Thiruvanthapuram (15.4%, from 2.1 ± 0.8 to 2.5 ± 1.0; two-tailed t-value: 2.6) in the COVID period compared with the reference period. Mor et al. (2021) has also reported an increase of 2–20% in SO2 concentration during different lockdown phases compared with the pre-lockdown period over Chandigarh. The increased concentration was attributed to atmospheric transport of SO2 emissions from coal-based thermal power plants upwind of the measurement location (Mor et al., 2021).
To investigate further about the increase in SO2 during COVID lockdown in our study over these three cities, we have analyzed the bivariate polar plots for the reference period and COVID period (Figure 3). Polar plots suggest that neither the wind speed nor the wind direction was significantly different at Chandigarh, Bengaluru, and Thiruvanthapuram during the COVID year with respect to the reference period. However, the AQI of SO2 was substantially higher during the lockdown period amid COVID-19 compared with the reference period (Figure 3). Though we could not find anywhere the energy demand estimations for these cities during the lockdown period, we have tried to collect the supporting information for the observed increase in SO2 levels during the lockdown period. In the wake of the COVID-19 pandemic, the Indian government, in collaboration with established textile industries, started domestic manufacturing of personal protective equipment (PPE) in India since March 2020 (Lakshmanan and Nayyar, 2020). Thermal energy consumption in textile manufacturing units is about 70–80% in India (Bhaskar et al., 2013). Moreover, these coal-based thermal power sources in textile industries is the major source of SO2 in the atmosphere (Rabbi, 2018; Niinimäki et al., 2020).
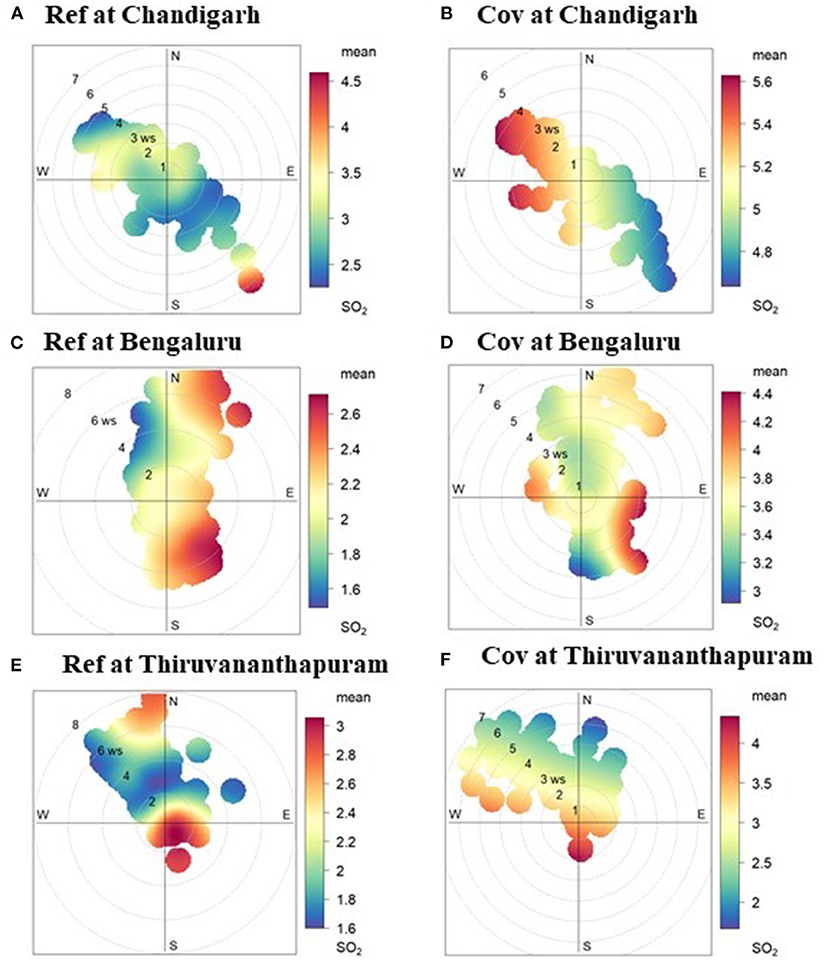
Figure 3. Bivariate polar plots of SO2 for (A,B) Chandigarh, (C,D) Bengaluru, and (E,F) Thiruvanthapuram during reference and lockdown period due to COVID, respectively. The color bars show SO2 AQI values for respective plots.
Since all other industries were shut down during the lockdown period, we therefore are attributing the textile industries, involved in PPE kit manufacturing, as the major energy consumption units in a particular city during the lockdown period. The major hubs identified for PPE kit manufacturing were Ludhiana, Bengaluru, and Ernakulum, among others (Kitex Garments ltd., 2020; The News Minute., 2020; The Tribune., 2021). Thus, it is logical to state here that there would have been higher energy consumption in Ludhiana, Bengaluru, and Ernakulum. The three cities in which we observed increased SO2 levels during lockdown were Chandigarh, Bengaluru, and Thiruvananthapuram. Ludhiana and Ernakulum are situated in the north-west direction of Chandigarh and Thiruvananthapuram, respectively. Thus, prevailed north-westerly winds would have favored the transport of SO2 to Chandigarh from power plants feeding the energy to textile industries in Ludhiana (Figure 3). Likewise, prevailed north-westerly winds would have favored the transport of SO2 to Thiruvananthapuram city from power plants feeding the energy to textile industries in Ernakulum. However, Bengaluru itself was one of the major hubs for the manufacturing of PPE kits in south India (The News Minute., 2020). This would have led to higher energy consumption in the city, which would have led to higher emissions of SO2 from nearby power plants, the effect of which was observed in our results.
We have also witnessed a significant increase in O3 over Kolkata (~18%, from 14.5 ± 4.5 to 17.5 ± 11.6; two-tailed t-value: 2.4) and Visakhapatnam (~20%, from 6.1 ± 2.2 to 7.6 ± 4.2; two-tailed t-value: 2.9) during the lockdown period compared with the reference period. Dumka et al. (2021) has shown about 4–8% increase in O3 concentration over Delhi—NCR, mainly related to NOx chemistry. Pathakoti et al. (2020) has shown a dip of ~17–18% in mean NO2 levels (with maximum reduction over Delhi ~54%) using satellite remote-sensing data over India during the lockdown period. Jain et al. (2021) has also shown a significant reduction (~50%) in short-lived gaseous air pollutants such as NO2 and SO2, whereas minimal reduction (~10%) in CO and O3 compared with that of 2019, which has direct as well as indirect impacts of anthropogenic emissions. Venter et al. (2020) has also shown an increase in satellite-based O3 concentrations over polluted regions of China and India and a decrease in other parts of the world during the lockdown period compared with 2019. These results may be understood as non-linear chemical interactions of volatile organic compounds (VOCs) and oxides of nitrogen (NOx = NO + NO2) in formation/destruction of tropospheric O3 under different environmental conditions (Sillman, 1999). Venter et al. (2020) has suggested that the VOC limited region may experience an increase in O3, whereas the NOx limited region experiences a decrease in O3. Thus, our findings on change in air pollution magnitude are consistent with the previous literature.
The aforementioned analysis indicates a significant impact of lockdown amid COVID-19 on improvement in ambient air quality in Indian cities, i.e., huge reduction in levels of air pollutants. These reductions in AQIs were manifestation of both the weak source intensity, atmospheric chemistry, and favorable meteorological condition. Similar findings for selected air pollutants have been reported for different cities of India and from different geographical locations across the globe (Kumar et al., 2020; Mahato et al., 2020; Otmani et al., 2020; Venter et al., 2020; Dumka et al., 2021).
Since most of the cities are showing near similar trends of change in levels of air pollutants, it would be reasonable to group them regionwise and assess the improvement in air quality due to lockdown amid COVID-19 on a regional basis. We have grouped different cities into three broad regions, viz., north, western, and south India. North India was represented by Chandigarh, Jaipur, Delhi, Lucknow, Patna, and Kolkata, whereas western India was represented herein by Nashik, Gandhinagar, Mumbai, Nagpur, and Bhopal in our study. Hyderabad, Bengaluru, Chennai, Visakhapatnam, and Thiruvananthapuram were grouped as south India. Subsequently, we have averaged the data set of respective cities on a regional basis (north, west, and south) to assess the regionwise change in levels of air pollutants during pre-lockdown (Pre-Lock), lockdown (LockP1, LockP2, LockP3, and LockP4), and post-lockdown (Unlock 1) period over India. Figure 4 shows the percent change of different air pollutants during different phases [Pre-Lock, Lockdown (P1, P2, P3, and P4) and Unlock 1] over (a) north, (b) west, and (c) south India. It shows that by-and-large, the concentrations of all pollutants were decreased (except for some species during P4) over different regions of India in the lockdown period compared with the reference period. The reduced levels of air pollutants during pre-lockdown in India may be explained on the basis of worldwide lockdown leading to reduced long-range transport or transboundary impact of air pollutants (Venter et al., 2020) as many European and Asian countries had complete to partial lockdown during January–March 2020.

Figure 4. Percent change of different air pollutants averaged on a regional basis: (A) north, (B) western, and (C) south India during different prelockdown, lockdown (P1–P4), and unlock phases. The spread bars show standard deviation.
The temporal variability in percentage change of different pollutants shows maximum reduction during lockdown phases over all three regions. However, different interphase (lockdown phases P1, P2, P3, and P4) trends were observed across different regions. In general, maximum reductions (for almost all pollutants) were observed in the first three phases of lockdown (P1, P2, and P3) over west and south India. The increase in residential mobility during lockdown compared with that in pre-lockdown is reported, which steadily decreases from P1 to P4 (~31 to 18%) over India (Saha and Chouhan, 2021). North India, having the highest air pollution in normal days among regions assessed herein, shows a quite unique pattern where we see large reductions during P2 and P3, and thereafter buildup of pollution in P4 and a drastic decrease during unlock 1 period. This result can be explained on the basis of large temporal variability in the concentration of the pollutant during a short period of P4, as evident by larger error bars in Figure 4A. Thus, our analysis shows that the first three phases of lockdown were considerably associated with decreased levels of air pollutants and further relax in lockdown starts building up of pollution over all three Indian cities. In other words, it indicates a quick replenishment of air pollution soon after the lift of lockdown. This is likely due to the increase in economic activities and transportation across the country.
Overall, maximum reduction in SO2 was observed over west India (~61%) and in NO2 (~59%) over north India, and minimum reduction in almost all pollutants has been observed over south India during the lockdown period. Higher reductions in certain species during the lockdown period amid COVID-19 could be attributed to the shutdown of its major polluting source. For example, the maximum reduction (49%) of PM2.5 in this study has been observed over north India. Pathakoti et al. (2020) has also observed maximum reduction in aerosol levels over the IGP region with an average reduction of ~24% over India. A similar kind of spatiotemporal variability in aerosol optical depth has been reported over India using satellite measurements (Soni, 2021). Nigam et al. (2021) has also found an increase in air pollution over western industrial cities of India, while restrictions were relaxed in P4 and unlock period.
In this study, we have made an attempt to assess the effect of lockdown amid COVID-19 on the improvement in ambient air quality in the year 2020 over 16 Indian cities. Thus how, this study covers a wide spatial coverage in ambient air quality assessment from north to south in the Indian subcontinent. In general, all the air pollutants assessed herein exhibit a remarkable decline in their abundance during the lockdown period compared with their concentrations during the previous period in the years 2017–2019 (termed as reference period). Averaging over different regions of India, the air quality showed about 30–50% reduction for PM2.5, PM10, and CO, and a maximum reduction of 40–60% for the NO2 with significant spatial variability. The concentrations of SO2 and O3 exhibited both the decline as well as rise in their abundance pattern during the lockdown period compared with the reference period plausibly highlighting the role of atmospheric chemistry in regulating these reactive chemical species in the urban airshed under ambient atmospheric condition. Furthermore, we have also assessed the effect of ambient meteorology on observed reduction in air pollution using meteorologically normalized AQI values. Around 10% further reduction during lockdown period compared with the reference period was contributed only due to meteorological condition. The spatiotemporal variability of different air pollutants across India emphasizes the existence of different strengths and/or nature of emission sources in north, west, and south India. Maximum fine particulate matter reduction was observed over north India during the lockdown period. The buildup of air pollution was observed in the later phase of lockdown and unlock due to relaxed restrictions on anthropogenic activities (industrial and transport). This study urges that by adopting cleaner fuel technology and avoiding poor combustion activities (e.g., crude open biomass burning) in the urban agglomerations and rural areas within India, the ambient air pollution could be reduced by around 30–60% compared with business-as-usual levels.
Publicly available datasets were analyzed in this study. This data can be found here: https://aqicn.org/data-platform/covid19/.
AM, AS, and CS collected the required data. Data analysis and interpretation is done by AM and PR. AM and PR drafted the manuscript and final editing is done by all authors. All authors contributed to the article and approved the submitted version.
The authors declare that the research was conducted in the absence of any commercial or financial relationships that could be construed as a potential conflict of interest.
All claims expressed in this article are solely those of the authors and do not necessarily represent those of their affiliated organizations, or those of the publisher, the editors and the reviewers. Any product that may be evaluated in this article, or claim that may be made by its manufacturer, is not guaranteed or endorsed by the publisher.
AM would like to thank DST Purse Grant and DST INSPIRE Faculty Grant (DST/INSPIRE/04/2015/003253) for providing the necessary funds for the analysis cost. PR acknowledges funding support from DST-MCECCR. The authors thank two reviewers for their fruitful comments and suggestions.
The Supplementary Material for this article can be found online at: https://www.frontiersin.org/articles/10.3389/frsc.2021.705051/full#supplementary-material
Berman, J. D., and Ebisu, K. (2020). Changes in US air pollution during the COVID-19 pandemic. Sci. Total Environ. 739:139864. doi: 10.1016/j.scitotenv.2020.139864
Bhaskar, M. S., Verma, P., and Kumar, A. (2013). Indian textile industries towards energy efficiency movement. Int. J. Envir. Sci. Deve. Mon. 4, 36–39.
Bishoi, B., Prakash, A., and Jain, V. K. (2009). A comparative study of air quality index based on factor analysis and US-EPA methods for an urban environment. Aerosol Air Qual. Res. 9, 1–17. doi: 10.4209/aaqr.2008.02.0007
Chen, H., Guo, J., Wang, C., Luo, F., Yu, X., Zhang, W., et al. (2020). Clinical characteristics and intrauterine vertical transmission potential of COVID-19 infection in nine pregnant women: a retrospective review of medical records. Lancet 395, 809–815. doi: 10.1016/S0140-6736(20)30360-3
Dai, Q., Liu, B., Bi, X., Wu, J., Liang, D., Zhang, Y., et al. (2020). Dispersion normalized PMF provides insights into the significant changes in source contributions to PM2. 5 after the COVID-19 outbreak. Environ. Sci. Technol. 54, 9917–9927. doi: 10.1021/acs.est.0c02776
Dandotiya, B., Jadon, N., and Sharma, H. K. (2019). Effects of meteorological parameters on gaseous air pollutant concentrations in urban area of Gwalior City, India. Environ. Claims J. 31, 32–43. doi: 10.1080/10406026.2018.1507508
Dumka, U. C., Kaskaoutis, D. G., Verma, S., Ningombam, S. S., Kumar, S., and Ghosh, S. (2021). Silver linings in the dark clouds of COVID-19: improvement of air quality over India and Delhi metropolitan area from measurements and WRF-CHIMERE model simulations. Atmospher. Pollut. Res. 12, 225–242. doi: 10.1016/j.apr.2020.11.005
Dutheil, F., Baker, S. J., and Navel, V. (2020). COVID-19 as a factor influencing air pollution? Environ. Pollut. 263:114466. doi: 10.1016/j.envpol.2020.114466
Falocchi, M., Zardi, D., and Giovannini, L. (2021). Meteorological normalization of NO2 concentrations in the Province of Bolzano (Italian Alps). Atmosp. Environ. 246:118048. doi: 10.1016/j.atmosenv.2020.118048
Hersbach, H., Bell, B., Berrisford, P., Hirahara, S., Horányi, A., Muñoz-Sabater, J., et al. (2020). The ERA5 global reanalysis. Quart. J. R. Meteorol. Soc. 146, 1999–2049. doi: 10.1002/qj.3803
Jain, C. D., Madhavan, B. L., Singh, V., Prasad, P., Krishnaveni, A. S., Kiran, V. R., et al. (2021). Phase-wise analysis of the COVID-19 lockdown impact on aerosol, radiation and trace gases and associated chemistry in a tropical rural environment. Environ. Res. 194:110665. doi: 10.1016/j.envres.2020.110665
Kitex Garments ltd. (2020). Available online at: http://www.kitexgarments.com/wp-content/uploads/2020/07/KGL_CoVID_19_FY20.pdf (accessed August 20, 2021).
Kumar, P., Hama, S., Omidvarborna, H., Sharma, A., Sahani, J., Abhijith, K. V., et al. (2020). Temporary reduction in fine particulate matter due to 'anthropogenic emissions switch-off'during COVID-19 lockdown in Indian cities. Sustain. Cities Soc. 62:102382. doi: 10.1016/j.scs.2020.102382
Kumar, S. (2020). Effect of meteorological parameters on spread of COVID-19 in India and air quality during lockdown. Sci. Total Environ. 745:141021. doi: 10.1016/j.scitotenv.2020.141021
Lakshmanan, R., and Nayyar, M. (2020). Personal Protective Equipment in India: An INR 7,000 Cr industry in the making. Strategic Investment Research Unit, Invest India. Available online at: https://www.investindia.gov.in/siru/personal-protective-equipment-india-INR-7000-cr-industry-in-the-making (accessed August 20, 2021).
Mahato, S., Pal, S., and Ghosh, K. G. (2020). Effect of lockdown amid COVID-19 pandemic on air quality of the megacity Delhi, India. Sci. Total Environ. 730:139086. doi: 10.1016/j.scitotenv.2020.139086
Mintz, D. (2018). Technical Assistance Document for the Reporting of Daily Air Quality-the Air Quality Index (AQI): US Environmental Protection Agency. Office of Air Quality Planning and Standards, Research Triangle Park, NC: Air Quality Assessment Division. Publication No. EPA-454/B-18-007.
Mor, S., Kumar, S., Singh, T., Dogra, S., Pandey, V., and Ravindra, K. (2021). Impact of COVID-19 lockdown on air quality in Chandigarh, India: understanding the emission sources during controlled anthropogenic activities. Chemosphere 263:127978. doi: 10.1016/j.chemosphere.2020.127978
Nakada, L. Y. K., and Urban, R. C. (2020). COVID-19 pandemic: impacts on the air quality during the partial lockdown in São Paulo state, Brazil. Sci. Total Environ. 730:139087. doi: 10.1016/j.scitotenv.2020.139087
Nigam, R., Pandya, K., Luis, A. J., Sengupta, R., and Kotha, M. (2021). Positive effects of COVID-19 lockdown on air quality of industrial cities (Ankleshwar and Vapi) of Western India. Sci. Rep. 11, 1–12. doi: 10.1038/s41598-021-83393-9
Niinimäki, K., Peters, G., Dahlbo, H., Perry, P., Rissanen, T., and Gwilt, A. (2020). The environmental price of fast fashion. Nat. Rev. Earth Environ. 1, 189–200. doi: 10.1038/s43017-020-0039-9
Otmani, A., Benchrif, A., Tahri, M., Bounakhla, M., El Bouch, M., and Krombi, M. H. (2020). Impact of Covid-19 lockdown on PM10, SO2 and NO2 concentrations in Salé City (Morocco). Sci. Total Environ. 735:139541. doi: 10.1016/j.scitotenv.2020.139541
Pathakoti, M., Muppalla , A., Hazra, S., Venkata , M. D., Lakshmi, K. A., Sagar, V. K., et al. (2020). An assessment of the impact of a nation-wide lockdown on air pollution-a remote sensing perspective over India. Atmosp. Chem. Phys. Discus. 21, 1–16. doi: 10.5194/acp-2020-621
Petetin, H., Bowdalo, D., Soret, A., Guevara, M., Jorba, O., Serradell, K., et al. (2020). Meteorology-normalized impact of the COVID-19 lockdown upon NO2 pollution in Spain. Atmosph. Chem. Phys. 20, 11119–11141. doi: 10.5194/acp-20-11119-2020
Rabbi, M. A. (2018). Assessment of nitrogen oxides and sulphur dioxide content in the ambient air near the garments industries of Bangladesh. J. Environ. Soc. Sci. 5, 1–4.
Saha, J., and Chouhan, P. (2021). Lockdown and unlock for the COVID-19 pandemic and associated residential mobility in India. Intern. J. Infect. Dis. 104, 382–389. doi: 10.1016/j.ijid.2020.11.187
Sarfraz, M., Shehzad, K., and Shah, S. G. M. (2020). The impact of COVID-19 as a necessary evil on air pollution in India during the lockdown. Environ. Pollut. 266:115080. doi: 10.1016/j.envpol.2020.115080
Sharma, S., Zhang, M., Gao, J., Zhang, H., and Kota, S. H. (2020). Effect of restricted emissions during COVID-19 on air quality in India. Sci. Total Environ. 728:138878. doi: 10.1016/j.scitotenv.2020.138878
Sillman, S. (1999). The relation between ozone, NOx and hydrocarbons in urban and polluted rural environments. Atmos. Environ. 33, 1821–1845. doi: 10.1016/S1352-2310(98)00345-8
Soni, P. (2021). Effects of COVID-19 lockdown phases in India: an atmospheric perspective. Environ. Dev. Sustainab. 1–12. doi: 10.1007/s10668-020-01156-4
The News Minute. (2020). Available online at: https://www.thenewsminute.com/article/bengaluru-emerges-hub-ppe-manufacturing-50-kits-india-centre-123408 (accessed August 20, 2021).
The Tribune. (2021). Available online at: https://www.tribuneindia.com/news/punjab/punjab-emerges-as-manufacturing-hub-for-covid-protective-kits-82757 (accessed August 20, 2021).
Tosepu, R., Gunawan, J., Effendy, S. D., Ahmad, A. I., Lestari, H., Bahar, H., et al. (2020). Correlation between weather and Covid-19 pandemic in Jakarta, Indonesia. Sci. Total Environ. 725:138436. doi: 10.1016/j.scitotenv.2020.138436
Venter, Z. S., Aunan, K., Chowdhury, S., and Lelieveld, J. (2020). COVID-19 lockdowns cause global air pollution declines. Proc. Natl. Acad. Sci. 117, 18984–18990. doi: 10.1073/pnas.2006853117
WHO (2020) Novel Coronavirus (2019-nCoV) Situation Report - 10. Available online at: https://www.who.int/emergencies/diseases/novel-coronavirus-2019
Keywords: lockdown, COVID-19, air quality, Indian cities, mitigation
Citation: Mishra AK, Rajput P, Singh A, Singh CK and Mall RK (2021) Effect of Lockdown Amid COVID-19 on Ambient Air Quality in 16 Indian Cities. Front. Sustain. Cities 3:705051. doi: 10.3389/frsc.2021.705051
Received: 04 May 2021; Accepted: 27 August 2021;
Published: 29 September 2021.
Edited by:
Yuli Shan, University of Groningen, NetherlandsReviewed by:
Sarvan Kumar, Veer Bahadur Singh Purvanchal University, IndiaCopyright © 2021 Mishra, Rajput, Singh, Singh and Mall. This is an open-access article distributed under the terms of the Creative Commons Attribution License (CC BY). The use, distribution or reproduction in other forums is permitted, provided the original author(s) and the copyright owner(s) are credited and that the original publication in this journal is cited, in accordance with accepted academic practice. No use, distribution or reproduction is permitted which does not comply with these terms.
*Correspondence: Amit Kumar Mishra, YW1pdC5taXNocmEuam51QGdtYWlsLmNvbQ==; YW1pdG1pc2hyYUBtYWlsLmpudS5hYy5pbg==
Disclaimer: All claims expressed in this article are solely those of the authors and do not necessarily represent those of their affiliated organizations, or those of the publisher, the editors and the reviewers. Any product that may be evaluated in this article or claim that may be made by its manufacturer is not guaranteed or endorsed by the publisher.
Research integrity at Frontiers
Learn more about the work of our research integrity team to safeguard the quality of each article we publish.