 Debby Veillette
 Jean Rouleau
 Louis Gosselin
- Department of Mechanical Engineering, Université Laval, Quebec City, QC, Canada
Energy consumption and thermal comfort in residential buildings are highly influenced by occupant behavior, which exhibits a high level of day-to-day and dwelling-to-dwelling variance. Although occupant behavior stochastic models have been developed in the past, the analysis or selection of a building design parameter is typically based on simulations that use a single “average” occupant behavior schedule which does not account for all possible profiles. The objective of this study is to enhance the understanding of how window-to-wall ratio (WWR) of a residential unit affects heating demand and thermal comfort when considering occupant behavior diversity through a parametric analysis. To do so, a stochastic occupant behavior model generates a high number of possible profiles, which are then used as input in an energy simulation of the dwelling. As a result, one obtains probability distributions of energy consumption and comfort for different WWR values. The paper shows that the shape of the probability distributions is affected by WWR and dwelling orientation, and that the influence of different occupant behavior aspects on performance also varies with WWR. This work could help designers to better assess the impact of WWR for a large spectrum of possible occupant behavior profiles.
Introduction
In order to reduce building energy consumption, many studies explored improvements of the envelope, fenestration, mechanical systems and heat recovery technologies. Thanks to these efforts to improve building performance, the efficiency of modern equipment and systems tend to get closer and closer to their theoretical physical limits. As a result, further improvement in building performance must also include other elements. In the past few years, it has been recognized by several studies that occupant behavior strongly influences energy consumption and thermal comfort (Chen et al., 2021).
Many papers demonstrated the energy reduction potential of occupant-oriented building design and control strategies. For example, Nguyen and Aiello (2013) reviewed different intelligent buildings in which the attention was focused on energy saving and user activity recognition. They have concluded that proper occupant-oriented strategies could lead to up to 40% saving in both HVAC and lighting systems. Accordingly, “real-time occupancy information and occupants' individual lighting preferences should be used” as well as smart thermostats based on occupancy pattern prediction. On the other side, Georgievski et al. presented an innovative Hierarchical Task Network (HTN), based on user activity recognition, for lighting control in office buildings. Their method produced an 80% energy saving (Georgievski et al., 2017). The impact of unoccupied flats on the thermal discomfort and energy demand in a residential multi-unit building has also been studied (Oliveira et al., 2020). O'Brien (2013) argues that robust building designs that cope with various weather conditions and occupant behavior patterns is the key of success, rather than trying to modify occupant behavior, which has only shown modest success. However, the best way to do that is still up for discussion.
Furthermore, Karjalainen performed numerical simulations of an office where three types of behavior (“careless,” “normal,” and “conscious”) and two types of design (“ordinary” and “robust”) were considered. The author concluded that 75–79% less energy was consumed with the robust solutions rather than with the ordinary solutions (Karjalainen, 2016).
Occupant behavior models with various levels of complexity have been developed to simulate how occupants interact with building systems. In literature, probabilistic and stochastic models gained in popularity over deterministic models, since the first ones depict occupant actions in a more accurate matter (Carlucci et al., 2020; Putra et al., 2021). In fact, occurrence probabilities of actions like occupancy, window opening, domestic hot water and appliances usage, lighting and others can be determined from monitoring campaigns. The resulting massive datasets can include interior and exterior conditions (temperature, relative humidity, etc.), occupant presence or movement, or operation conditions such as window opening, lighting, appliances use, temperature setpoints, heating demand, and more. Among the different models proposed in literature (Yan et al., 2017), some treated individual aspects like occupants' movements and presence (Arslan et al., 2019) DHW, electricity, window opening (Rouleau and Gosselin, 2020) or a combination of some of them (Rouleau et al., 2019b). Rouleau et al. (2019a) studied robustness of energy consumption and comfort in a high-performance residential building with respect to occupant behavior. Their occupant behavior model covered occupancy, hot water and electricity consumption, heating, temperature setpoint and window opening. The results show the great variability in heating demand (average coefficient of variation of 49.2%), total energy use (27.6%) and hours of discomfort (74.0%) due to occupants. Despite these advances and possibilities in the representation of diverse occupants in building energy models, such models are still seldomly used for decision-making in practice. For example, multi-objective optimization approaches that consider multiple performance metrics and robustness indicators have been proposed by different authors, but without considering the variability of occupant behavior (Kotireddy et al., 2019; Wang et al., 2020).
Besides, one of the most important design features in terms of energy consumption and comfort is the fenestration ratio. For example, Marino et al. (2017) proposed ideal window-to-wall ratios (WWR) that minimize overall energy consumption, according to climate conditions, insulation features of the façade or luminaries input power change. A typical office building representing those found in Italy was modeled and simulated using EnergyPlus, for 12 different climate zones and three building designs. Optimum average WWR of 23.5% for the least insulated building and of 25.9% for the most insulated building were proposed. However, occupant diversity was not considered in their simulations, and aspects such as indoor thermal comfort, occupancy, lighting, and equipment usage were defined by schedules from Italian and European standards. Guo and Bart (2020) also studied the influence of multiple parameters such as WWR on heating demand and thermal comfort for diverse locations in China. They have concluded that in the coldest location (Changchun), where the minimal exterior temperature is −14.4°C, WWR between 20 and 28% were acceptable values. Higher values of WWR led to thermal discomfort. On the contrary, thermal comfort was not significantly affected in warmer zones like Beijing, where the minimal exterior temperature is −2.9°C. Again, one of the limits of their work is that occupant behavior diversity was not considered. Ashrafian and Moazzen have studied the impact of WWR and window configuration considering total energy consumption, daylight availability and human comfort simultaneously (Ashrafian and Moazzen, 2019). They used a typical school building located in in Eskisehir, Turkey, for simulation purposes. Their conclusion is that a value between 40 and 50% of WWR yielded the best performance, again based on static schedules representing one specific occupant behavior pattern.
Moreover, Chaturvedi et al. (2020) worked on the design optimization of a mid-income apartment building located in a hot and dry (Köppen climate classification: BSh) region of India. They first developed a building simulation model with EnergyPlus, and then performed a multi-objective building design optimization using the non-dominated sorting genetic algorithm (NSGA II). Six WWRs were compared from 10 to 60%. Small window sizes ranging between 10 and 20% WWR with the installation of triple glazed windows were recommended for residential buildings situated in dry and arid regions. From their point of view, decision-makers should “adopt a more human centric approach for building optimization by considering many possibilities for building operation.” On the other hand, Hong et al. concentrated their efforts on occupant satisfaction with respect to the sense of inner space and visual comfort for different window sizes (Hong et al., 2019). They concluded, through a survey and virtual reality modeling, that sense of inner space tends to increase as the WWR increases, especially between 15 and 30% WWR. In addition, participants tend to perceive less visual comfort when the WWR was 15% rather than 45 or 60%. Again, these studies relied on a single “typical” occupant behavior and did not account for the variety of possible occupants.
As can be seen, there is a lack of investigations on how building performance is affected by design variables when accounting for the diversity of possible occupant profiles. In other words, would design and decision-making be different if one attempted to include many occupant behavior profiles? This question is particularly important, given that in the design process, one usually does not really know the behavior of the future building users. In line with this challenge, the objective of the present study is to evaluate how the window-to-wall ratio (WWR) of a residential unit affects performance when considering a high number of possible occupant behavior profiles with a Monte Carlo approach. Performance was characterized by thermal comfort and energy consumption. Since many occupant behavior profiles were simulated, performance distribution curves were obtained instead of single values. As the literature review showed, the best choice of WWR depends on multiple factors such as climate conditions, but also on occupant behavior. There is thus a need to better understand how different WWRs influence performance for different occupants. Even though some authors proposed multi-objective optimization approach for building design, doing so while considering the full spectrum of occupant behavior would pose several challenges. For example, many objective functions would be possible since performance distributions are obtained (e.g., minimizing average, median, extreme, standard deviation of energy consumption and discomfort). Furthermore, this would have a high computational cost with a Monte Carlo approach given that obtaining the performance for a design requires a large number of simulations. Before doing that, it is necessary to better understand how building design affects the performance distribution curves, which is what this paper is attempting to do. Accordingly, this study suggests a parametric analysis to appreciate the impact of WWR and building orientation when accounting for many different occupant behaviors.
In Section Materials and Methods, we present the methodology, including a description of the test-case building and the related dataset, a presentation of the occupant behavior and energy simulation models, and an explanation about the Monte Carlo approach employed to achieve estimations of the energy consumption and comfort probability distributions. Section Results presents the impact of window-to-wall ratio in terms of thermal comfort and heating demand. An analysis of how occupant behavior aspects such as temperature setpoint, electricity consumption and window opening affect building performances is presented. The impact of building orientation is then evaluated. Finally, a sensitivity analysis based on linear regressions offers a quantitative point of view as to the impact of the different occupant behavior factors for two different WWRs. Section Discussion brings to light how this study could help designers to better account for occupant behavior when sizing building fenestration, before concluding on the main highlights of this research.
Materials and Methods
In order to calibrate the different submodels that will be described below (occupant behavior model in Section Probabilistic Occupant Behavior Generator and energy model in Section Building Energy and Comfort Simulation), a residential multi-family building was used as a case study. Section Building Monitoring describes the building and the dataset. Lastly, the Monte Carlo procedure is presented in Section Monte Carlo Procedure.
Building Monitoring
The test-case building is a four-storey 40-unit social housing building located in Quebec City (Canada) (Rouleau et al., 2018). Energy consumption and environmental conditions have been monitored since 2015 when the building was constructed. The area of the dwellings varies between 55 and 75 m2. The window-to-wall ratio (WWR) is 0.13. The building was meant to be highly energy performant with an RSI value of the wall assembly of 6.32. Space heating is done through hot water radiators. The source of heating for space heating and domestic hot water is a district heating network. No AC is installed, and occupants must rely of natural ventilation to cool off the building in summer. Deciduous trees located near the southwest façade provide more shading in the summer, but allow solar gains in winter.
Consumption of domestic hot water (DHW), electricity and space heating are monitored every 10 min, along with indoor environmental conditions (humidity and temperature). Window opening is also monitored, but at a 1-min frequency.
Data show that the average energy intensity (including space heating, DHW and electricity) was 137.8 kWh/m2, but that strong variations exist between units with energy intensity values ranging from 50 to 260 kWh/m2. Previous work indicated that occupant behavior was the main source explaining these strong differences.
Probabilistic Occupant Behavior Generator
An existing unified probabilistic model (Rouleau et al., 2019b) was used to simulate five aspects of occupant behavior in residential buildings: (i) occupancy; (ii) domestic hot water consumption; (iii) electricity consumption; (iv) temperature setpoint and (v) window opening. As the model was already detailed elsewhere, only a brief summary is provided here for the sake of clarity. The model was calibrated with data from the building mentioned in Section Building Monitoring, as explained in Rouleau et al. (2019a).
Figure 1 summarizes the calculation approach exploited in the present work, with the occupant behavior model framed with a dashed line. Yellow boxes display the software used in this methodology, their respective role and how they interact with each other. Blue boxes represent the parameters that were changed simulation-by-simulation.
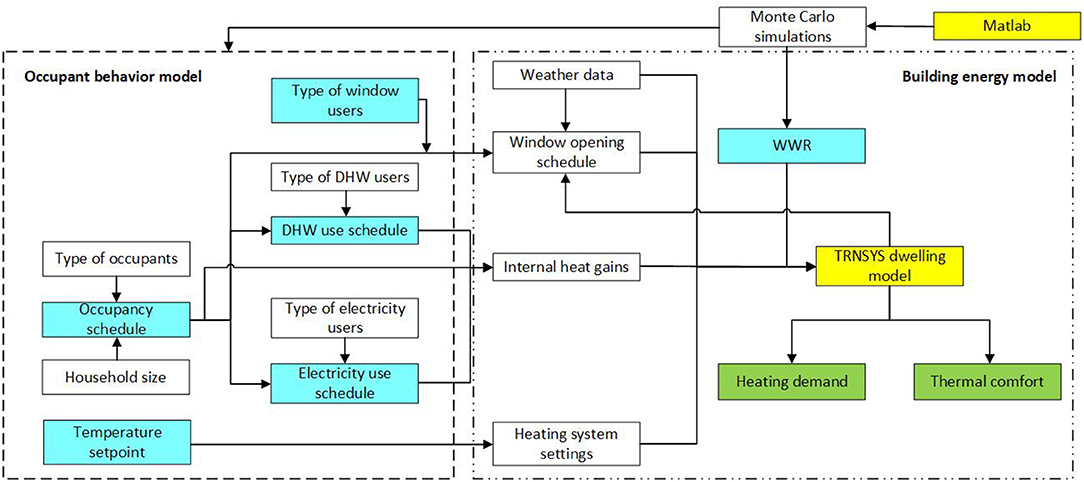
Figure 1. Workflow diagram illustrating the procedure used in this work, including the occupant behavior model, the building energy model and the Monte Carlo approach.
The model first assigns the number of occupants living in the simulated dwelling, which can range from one to five people. Then, the model decides the type of occupants (rarely, moderately or often at home) and the type of DHW and electricity users (low, moderate and heavy users) that these people are. All these parameters are randomly drawn from probability distributions based on measured data from Canadian households. From there, Markov-chains are used to generate stochastic schedules of the number of active occupants (i.e., awake and at home) for each simulated time step. This active occupancy schedule serves as the basis for the creation of the DHW and electricity use schedules as consumption of these two variables are scaled so that they are proportional to the number of active occupants (e.g., there cannot be a shower or a cooking activity when no occupant is active). For DHW, probability distribution functions (PDF) for five types of appliances (shower, bath, sink, clothes washer and dishwasher) determines when DHW events occur. For each DHW event, the duration and the water flow rate of the event is randomly drawn depending on the appliances that is used. For electricity, Markov chains create a schedule of the activities (cooking, watching TV, tidying…) undertaken by occupants. Each activity is linked to different sets of appliances (a total of 25 electrical appliances is considered) so that when an activity is occurring, there is a probability that the appliances associated with that activity can be activated.
The stochastic submodel for window opening also considers the various behaviors of window opening observed across dwellings. It calculates for each time step the probability of a change of state for each window. If the window was previously closed, it calculates the probability that there will be a window opening and vice versa. The probability is computed from a logit regression equation that accounts for the outdoor and indoor temperatures (Equation 1), where popen is the probability of a window being opened, Tin and Tout represent the independent variables considered by the model (indoor and outdoor temperatures) and ωin and ωout, their respective regression coefficients.
Generally, the warmer it is outside and inside, the higher the probability of observing an opened window will be. The coefficients in the regression equation vary from a dwelling to another, which means the effect of temperatures on window openings is different between different simulated households. These coefficients are drawn from probability distribution functions that were built from the observed variance seen in the case study building. The regression coefficients are drawn and provided to the building energy model (TRNSYS), which can then compute the probability of a window change of state based on its estimation on the outdoor and indoor temperatures. For a single dwelling, these coefficients remain fixed for the whole year.
The temperature setpoint distribution is chosen from observed values in Canadian dwellings (National Resources Canada, 2011).
The five outputs from the occupant behavior model, pictured in the dashed box in Figure 1, serve as inputs in the energy model that will be described in Section Building Energy and Comfort Simulation. Elements in the dotted box are related to the energy model hosted in TRNSYS (Klein, 2013).
The resulting schedules have a time step of 10 min, and a day-to-day variance characteristic of that observed in the building described above. Running the occupant behavior model many times allow to generate as many schedules as possible, with a dwelling-to-dwelling variability. This dwelling-to-dwelling variability is ensured by the various ‘type of users' parameters implemented in the model.
More details on the OB model could be found in Rouleau et al. (2019b).
Building Energy and Comfort Simulation
We developed an energy model of one of the dwellings from the monitored building mentioned above. The unit is oriented in the south-west direction and is located on the first floor. The model was implemented in TRNSYS and was calibrated based on the ASHRAE 140 standard. The details of the model are available in literature (Rouleau et al., 2019a).
Yearly simulations were performed with a time step of 10 min. The time step of 10 min for the building model fits with the time step of the schedules generated by the occupant behavior model. Preliminary simulations were also made to ensure that a time step of 10 min was sufficiently small to have accurate results. Outputs with time steps of 1 or 5 min did not yield different results. The model integrates the different schedules (occupancy, DHW, electricity), which in turn generate internal heat gains in the simulations affecting the heating demand. The year was separated in two periods: the heating season during which radiators adjust the amount of heat discharged in the unit in order to aim at reaching the setpoint, and a free running season (summer) during which the temperature in the building is not controlled by mechanical systems. At each time step, the energy model determines the indoor thermal conditions, which allows to determine from the logit regressions whether window states will be changed. As mentioned, window state changes are only allowed when an occupant is actively present in the unit.
In addition to calculating the energy consumption for heating at each time step, the model determines the level of comfort in the unit. During the heating season, the PMV/PPD approach is used. For the calculation of the PMV, TRNSYS used its own estimations of the indoor temperature, mean radiant temperature and relative humidity. The clothing factor was calculated with a linear equation that depends on the indoor temperature so that occupants use more clothing when it is getting colder inside (Song et al., 2018). The metabolic rate and air speed were kept constant, respectively, at 1.2 met and 0.1 m/s. When the PMV is below −0.5 during a given time step (cold), discomfort is assumed. Similarly, when the PMV is above 0.5, it is assumed that the dwelling is too hot (hot discomfort). During summer, the adaptive model from ASRHAE 55 determines whether the occupants are comfortable or not.
The TRNSYS model was fully operated from Matlab (Mathworks, 2019), which allowed to launch many sequential simulations in an automated way. For each simulation, Matlab first produces schedules using the occupant behavior model. These schedules are recorded in .txt files which are supplied to TRNSYS as inputs to the dwelling model. Matlab is then able to launch the TRNSYS simulations. Matlab can also directly modify the TRNSYS model to adjust window sizes so that they reach the required window-to-wall ratio.
Monte Carlo Procedure
We used a Monte Carlo approach to generate probability distributions of the energy consumption and comfort in a dwelling depending on occupant behavior. The Monte Carlo method relies on repeated random simulations to solve problems that involve probabilistic variables. Here, the probabilistic variable is the occupant behavior (occupancy, DHW and electricity use, window control and temperature setpoint), so the simulations are repeated by changing the occupant behavior in the building model. The Monte Carlo has been employed in literature to account for the uncertainties related to occupant behavior (Belazi et al., 2018; Hu and Xiao, 2020; Østergård et al., 2020). Again, the overall procedure is schematized in Figure 1.
First, the probabilistic occupant behavior generator introduced in Section Building Monitoring creates a series of N coherent schedules for occupancy, domestic hot water consumption and electricity consumption. Additionally, N temperature setpoint values are chosen from an established probability distribution. Finally, N sets of the regression coefficients characterizing the logit functions that control window openings and closings are also selected from predefined intervals. In the end, the occupant behavior generator thus yields N different possible scenarios of how the dwelling will be used and operated by occupants.
Second, these N scenarios are introduced into the building performance model described in Section Probabilistic Occupant Behavior Generator in order to calculate the energy consumption and number of hours of discomfort for each scenario. The distributions of these output values can then be analyzed statistically. Note that the same set of N occupant behaviors were used as inputs to the energy models when considering different building WWRs.
The impact of the number of profiles considered was studied in order to determine how many simulations were needed to achieve smooth and stable probability distributions. An example is reported in Figure 2, which shows the probability distribution of the number of hours of discomfort for five values of N. Similar figures were also plotted for different model outputs (e.g., energy consumption, etc.). It was found that a value of N = 1,000 was sufficient to achieve probability distributions that did not change significantly when N continued to increase. Therefore, the value of N = 1,000 was retained in the rest of this paper.
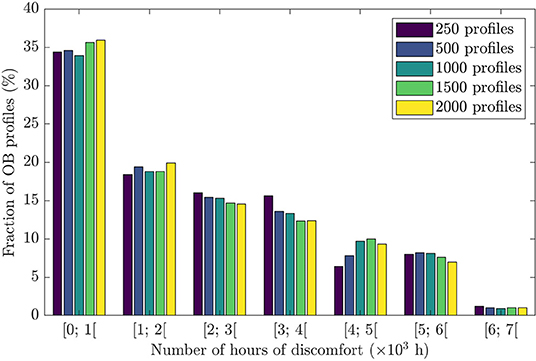
Figure 2. Impact of N, the number of occupant behavior (OB) profiles, on the probability distribution of the number of hours of discomfort.
Results
The impact of window-to-wall ratio will first be demonstrated in Section Impact of Window-to-Wall Ratio, before analyzing how each component of the occupant behavior model affects the performance of the building considering different WWR (Section Analysis of OB Factor Affecting Performance). The impact of building orientation will be discussed in Section Impact of Orientation. At last, a sensitivity analysis will be performed with the help of linear regressions (Section Sensitivity Analysis With Linear Regression).
Impact of Window-to-Wall Ratio
We used the Monte Carlo method introduced above to simulate the thermal comfort and space heating consumption of a unit under different possible occupant behavior profiles. This exercise was repeated for different window-to-wall ratios (WWRs). When changing the WWR, window sizes were increased proportionally to reach specific values (i.e., 20, 30, and 40%). The location of the windows was not changed. The original building has a WWR of 13%.
The resulting distribution of discomfort hours for different WWRs is reported in Figure 3. In these figures, the y-axis presents the number of hours of discomfort and the x-axis shows the cumulative fraction of the scenarios leading to that number of hours of discomfort. The first frame (Figure 3A) shows the number of hours of discomfort when people feel too hot, whereas the second frame reveals the hour of discomfort when people are too cold (Figure 3B). The last frame, Figure 3C, accounts for the summation of both types of discomfort.
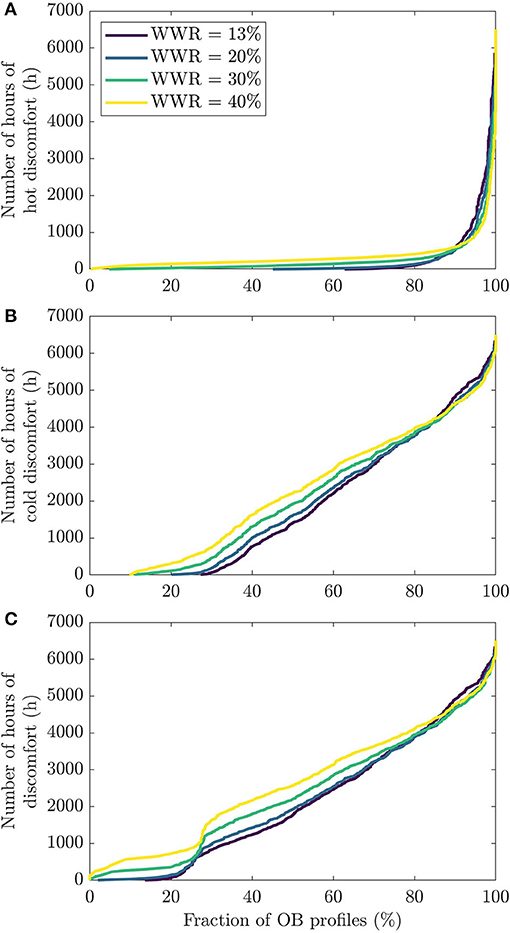
Figure 3. Cumulative fraction of possible occupant behavior scenarios with a specific number of hours of (A) hot discomfort, (B) cold discomfort , and (C) total discomfort.
The first thing to notice is that, as expected, occupant behavior has a strong impact on the level of comfort. A large variation of the number of hours of discomfort is observed throughout the simulations. The most problematic issue is related to when occupant feel too cold, since the number of hours of discomfort tends to be much higher in Figure 3B (cold discomfort) than Figure 3A (hot discomfort). For example, one can see that with the current WWR (i.e., with the 13% value), the median number of hours of hot and cold discomfort (corresponding to the horizontal line for 50%) are, respectively, 0.33 and 1,411 h.
The impact of the window-to-wall ratio is also visible in Figure 3. Gradually increasing the WWR value tends to generate more discomfort, both hot and cold. For example, the median value of the total hours of discomfort increases from 1,776 to 2,578 h, when WWR passes from 13 to 40%. This increase of discomfort is also observable strictly by looking at the proportion of occupant profiles that yield zero hour of discomfort. Figure 3C conveys that ~16% of the profiles had zero hour of discomfort for the whole year with the 13% WWR dwelling. With 20% WWR, this figure goes down to around 2% of the profiles. There is no profile with zero hour of discomfort for both the 30 and 40% WWR dwellings. The differences between the four WWR is even bigger for hot discomfort. It is also visible in Figure 3 that the lines for different WWR values cross in the right-hand side portion of the figures. This occurs because in the 10% of scenarios where occupants are the least comfortable, bigger windows seem to provide a slightly more comfortable environment than smaller windows.
In these more extreme scenarios with high discomfort, it seems that drastic solutions are needed to improve thermal comfort, hence the need for bigger windows. For dwellings with the highest frequency of hot discomfort, the dwelling is quite warm, and its indoor temperature should be reduced. Although increasing windows sizes brings in more solar radiation in the dwelling, it seems that the impact of this additional heat gain is minimal compared to the benefit of higher heat losses toward the outdoor via higher ventilation rate and an envelope that is less insulated. The presence of the trees probably explains this as there is more shading in summer, where overheating is expected. For cold discomfort, extreme discomfortable profiles have a substantially low indoor temperature, so increased solar gains help significantly. Again, cold discomfort is more frequent in winter, so deciduous trees do not interfere with solar gains.
Figure 4 provides another representation of the discomfort distribution as a function of WWR and reports the fraction of the scenarios in each bin of number of hours. Overall, the probability distributions have a decreasing exponential shape, but the shape is clearly affected by WWR. At high WWR (i.e., 40%), there is even a dip in the distribution in the second bin yielding a distribution that has two maxima. Table 1 provides a statistical overview of how the discomfort distribution shifts when changing WWR.
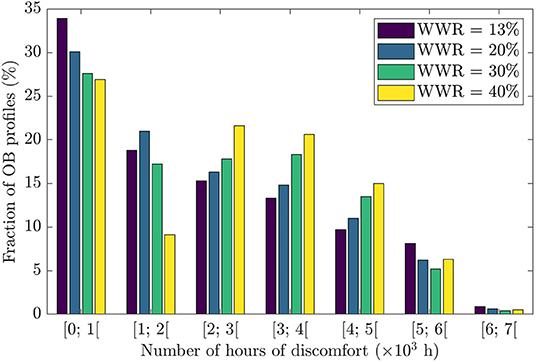
Figure 4. Probability distribution of number of hours of discomfort depending on occupant behavior and window-to-wall ratio.
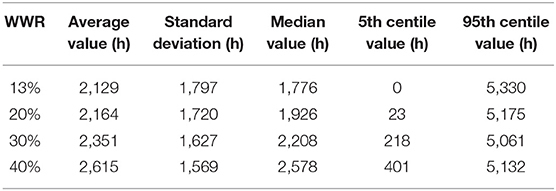
Table 1. Statistical summary of the distribution of the annual number of hours of discomfort for 1,000 occupant profiles when changing the window-to-wall ratio.
In Table 1, we see that although the mean and median values for discomfort are significantly smaller with the 13% WWR dwelling than with the 40% WWR one, the 95th centile value is actually higher for the design with a low fenestration rate. This again demonstrates that for the 10% of profiles that yielded the more discomfort, bigger windows offer a better performance in terms of thermal comfort. This explains why the standard deviation is higher with a WWR of 13% - this fenestration rate tends to perform worse for extreme behaviors.
The same procedure was applied to plot the distribution of possible space heating consumption for the different occupant behavior scenarios. The result is reported in Figures 5, 6. As for the discomfort level, there is a large range of possible values for the heating demand, from almost no heating up to 202 kWh/m2. Larger fenestration ratios lead to a higher heating demand. For example, the median value of heating needs varies from 24 to 34 kWh/m2 when WWR is increased from 13 to 40%. These statistics are reported in Table 2. The shape of the probability distribution shown in Figure 6 is similar to log-normal distributions for all WWRs. Note in Figure 5 that contrarily to its thermal comfort counterpart, the lines representing different WWRs never cross, which means that a 13% WWR has lower heating demand even for the 10% of scenarios that generated the most heating demand. This is also reflected in Table 2, where the 95th centile value is 75 kWh/m2 for the 13% WWR dwelling vs. 85 kWh/m2 for the 40% WWR. The standard deviation is also smaller with 13% WWR.
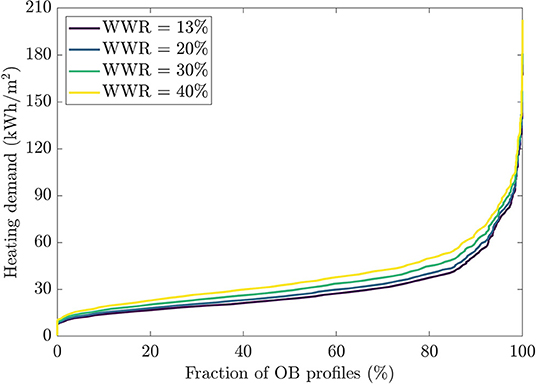
Figure 5. Cumulative fraction of possible occupant behavior scenarios with a specific heating demand.
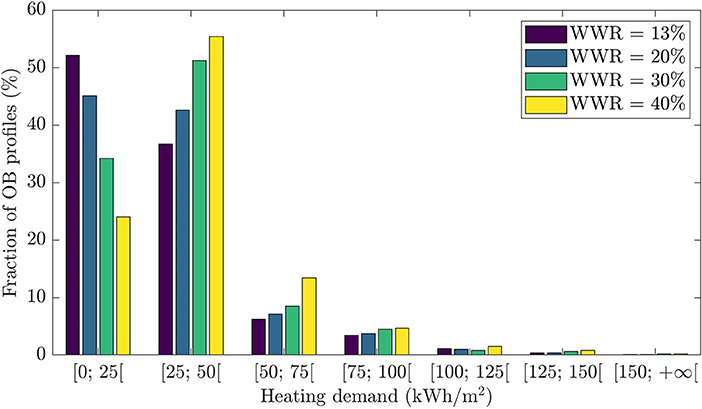
Figure 6. Probability distribution of heating demand depending on occupant behavior.
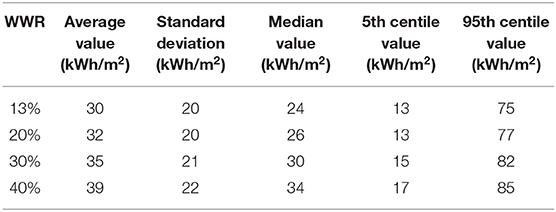
Table 2. Statistical summary of the distribution of the annual heating demand for 1,000 occupant profiles when changing the window-to-wall ratio.
Analysis of OB Factor Affecting Performance
In this section, we analyzed the impact of occupant behavior for the two extreme WWR values (i.e., 13 and 40%). More specifically, we assessed how each component of the occupant behavior model affected the performance of the building for these two fenestration ratios. We reported the energy-discomfort results of each occupant behavior scenario in Figures 7–9. In this set of figures, the x-axis shows the heating demand and the y-axis the number of hours of discomfort. Each point in this figure represents one occupant behavior from the set of 1,000 that was simulated. However, only 500 occupants were represented on each graph in order to increase visibility. The results for the lowest and highest WWRs are shown on the left and right frames, respectively. The points were colored according to different elements characterizing the occupant behavior profiles (i.e., temperature setpoint, electricity consumption, window opening). This allows to highlight how each building performance level correlates with occupant behavior as a function of the WWR.
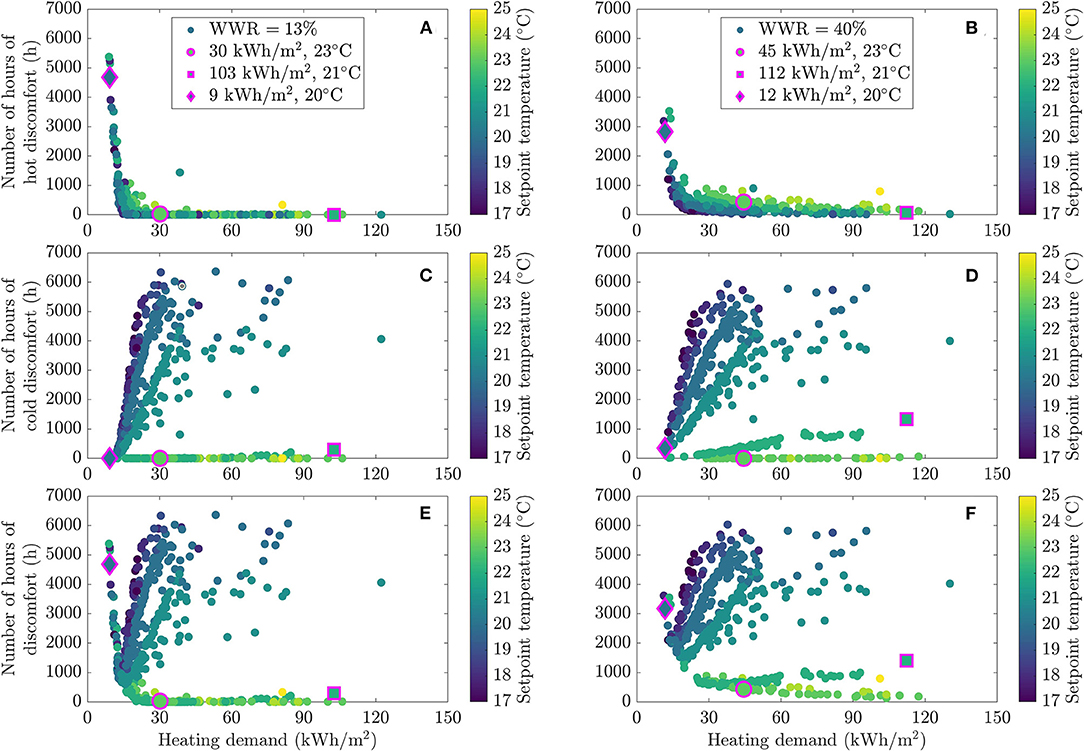
Figure 7. Energy and comfort performance in the dwelling for different occupant profiles, colored by heating setpoint temperature, reporting on hot discomfort (A,B), cold discomfort (C,D), and total discomfort (E,F) as a function of heating demand for two WWR values (13% on the left and 40% on the right).
In Figure 7, the points are colored as a function of the temperature setpoint. According to Figures 7A,B, occupants with the highest temperature setpoints (23–25°C) experiment more hours of discomfort when increasing the size of the window. The bigger windows led to more solar radiation entering the dwellings, which sometimes create uncomfortable conditions. However, profiles that generated the most discomfort had a lower frequency of discomfort with 40% WWR than with 13% WWR. Occupants with the lowest heating consumption (<60 kWh/m2) were also the most affected. As will be seen below, occupant profiles with low heating demand are correlated with behaviors that generate a large amount of internal heat gains (high occupancy and electricity consumption rates). In summer, these profiles are consequently more susceptible to overheating and occupants thus have no leverage to balance the heat gain from larger windows since there is no cooling system. It is evident in Figures 7C,D that the various lines drawn by the datapoints are explained by shifts in temperature setpoints. This showcases the high importance of the heating setpoint in the heating demand-cold discomfort dilemma. According to Figures 7C,D, one can say that high temperature setpoints lead to more cold discomfort when increasing WWR. This phenomenon is also amplified for higher heating consumers. Impact of WWR is minimized for low temperature setpoint since those occupants already experiment a lot of cold discomfort. To summarize, low heating consumers that usually experiment few hours of discomfort are penalized when increasing WWR, according to both hot and cold discomfort.
In order to better understand how WWR affects performance for a given occupant behavior profile, we selected three profiles among the 500 shown in Figure 7: (i) a profile resulting in high consumption/low comfort; (ii) one yielding medium consumption/medium comfort; and (iii) another exhibiting a low energy consumption and comfort level. These three profiles are, respectively, shown by a square, a circle and a diamond shape. It is thus possible to directly observe how performance changes for these three profiles when the WWR increases (i.e., when comparing the right-hand side frames to the left). For example, the profile with a consumption of 30 kWh/m2 and a 23°C setpoint experiments 405 more hours of discomfort per year with a 40% WWR than with a 13% WWR (circle in Figure 7). Since energy saving is a behavior to be promoted, a particular attention should be giving to these occupants to preserve their comfort when designing building. For both the low and high heating consumers (diamond and square shapes), larger windows increased the heating consumption. However, in the first case, it reduced discomfort, whereas in the later, it increased it.
A similar study was also performed by coloring performance points by electricity consumption, which includes both lighting and electrical appliances. The result is reported in Figure 8. Since electricity consumption generates heat gains, it affects both the heating need and the level of comfort. In summer, overheating conditions are clearly associated to high electricity consumption (>100 kWh/m2) for both fenestration ratios (see Figures 8A,B). On the contrary, these profiles with a high electricity usage exhibit a better comfort level in winter (see Figures 8C,D). Overall, they also have a lower heating demand.
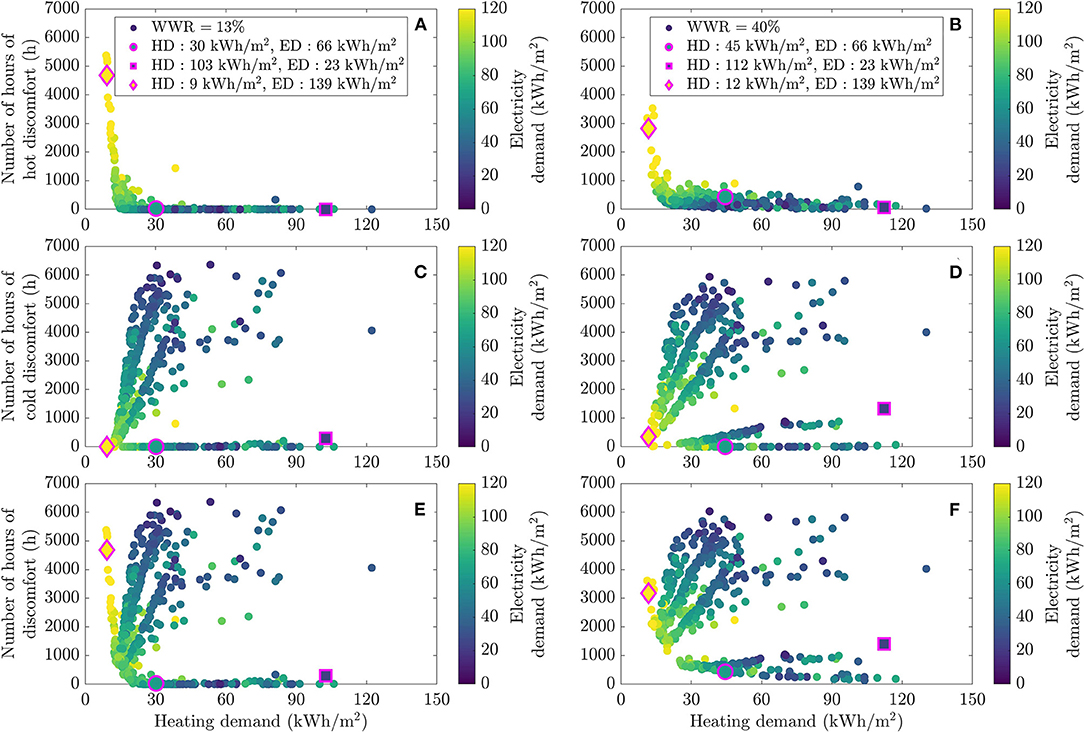
Figure 8. Energy and comfort performance in the dwelling for different occupant profiles, colored by electricity usage, reporting on hot discomfort (A,B), cold discomfort (C,D), and total discomfort (E,F) as a function of heating demand for two WWR values (13% on the left and 40% on the right).
Note that a figure similar to Figure 8, but with points colored with DHW consumption was also produced and yielded similar conclusion. It is not shown here for the sake of conciseness and since the impact of DHW consumption on energy and comfort is weaker.
Figure 9 reveals the impact of window opening on performance. Even though the stochastic window opening model is characterized by a series of coefficients that describe the probability of opening/closing depending on indoor and outdoor conditions, it was decided for the sake of clarity to color points in Figure 9 by the annual fraction of the time during which windows were opened in each scenario rather than by the coefficients themselves. Overheating is experienced during summer when windows tend to stay closed (Figures 9A,B) for both fenestration ratios. In winter, window opening seems to affect mostly the heating need and not so much the comfort level. This is likely due to the fact that the heating system was able to handle the additional air inflow due to window opening.
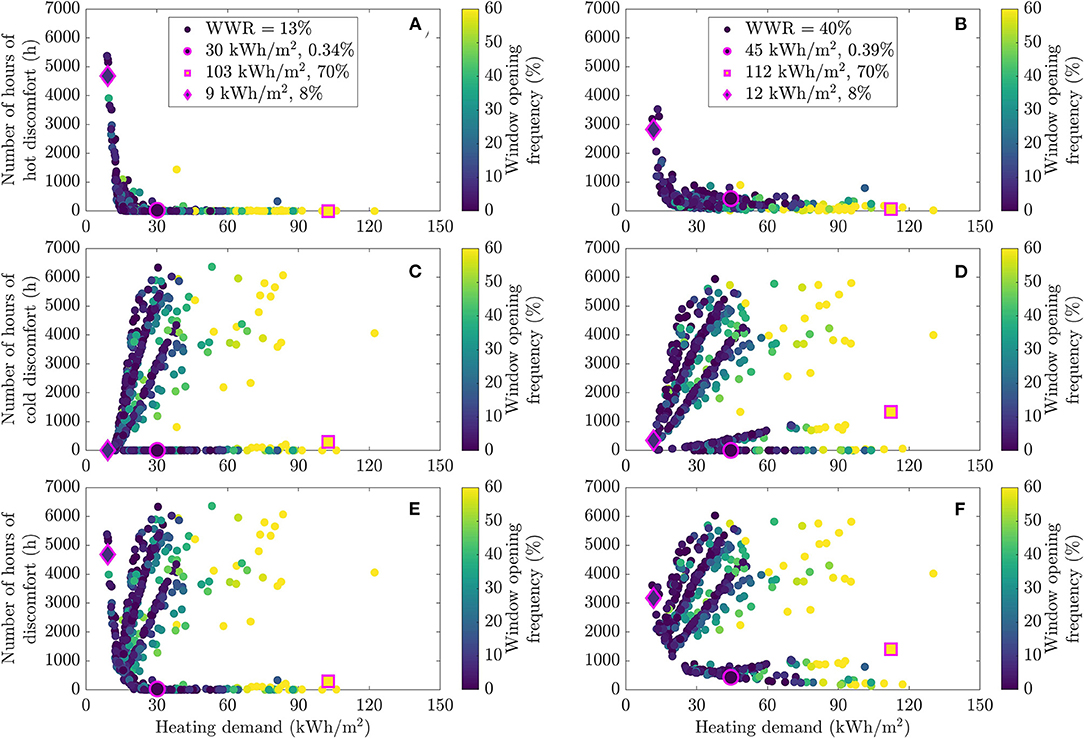
Figure 9. Energy and comfort performance in the dwelling for different occupant profiles, colored by annual window opening, reporting on hot discomfort (A,B), cold discomfort (C,D), and total discomfort (E,F) as a function of heating demand for two WWR values (13% on the left and 40% on the right).
Impact of Orientation
The previous results were obtained for a unit oriented toward the southwest façade in the test-case building presented in Section Materials and Methods. Since the orientation of the dwelling could influence the impact of WWR, we have repeated the analysis of the previous section for a dwelling from the other side of the building, i.e., oriented toward the northeast.
In Figure 10, we display how the discomfort distribution shifts when considering a northeast oriented unit for both the 13 and 40% WWR values. In terms of hot discomfort, there is reduction in discomfort for the design with 40% WWR (the average number of hours of discomfort goes from 356 to 75 h) whereas the change in thermal comfort is neglectable for the design with 13% WWR. In fact, with the northeast orientation, the 40% WWR dwelling has actually less overheating than the 13% WWR design. With an orientation that leads to less solar radiation, it appears that increasing window sizes is beneficial to fight overheating as it offers more options to evacuate the heat from the inside to the outside.
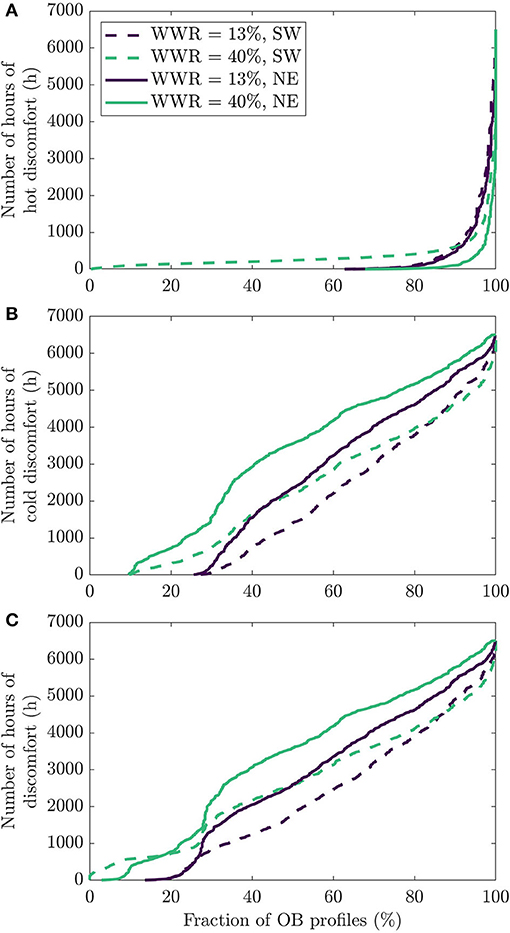
Figure 10. Cumulative fraction of possible occupant behavior scenarios with a specific number of hours of discomfort for two orientations (southwest and northeast) and two window-to-wall ratios (13% and 40%) for (A) hot discomfort, (B) cold discomfort, and (C) total discomfort.
It appears that a fenestration ratio of 13% is too small for the orientation to have an impact on hot discomfort, but this is not true for cold discomfort, as seen in Figure 10B. With the 13% WWR, the average number of hours of cold discomfort increases from 1,891 up to 2,454 h, meaning that there is 23% more discomfort for the dwelling on the northeast façade. With the 40% WWR dwelling, there is, on average, 30% more discomfort when changing the orientation of the façade from the southwest to the northeast. Windows typically allow more solar radiation to enter into the building, which offsets part of the additional heat losses generated by the windows (windows have lower u-value than external wall assemblies). With a northeast orientation, the amount of solar radiation is reduced, so the indoor environment gets colder and thus there is more discomfort. Unsurprisingly, the impact of switching the orientation of the dwelling is greater for designs with large windows as the larger windows accentuate this phenomenon.
In Figure 10C, we see the total discomfort for all simulated profiles. Overall, there is an average of 524 more hours of discomfort for the dwelling on the northeast façade with a 13% WWR. With the 40% WWR dwelling, there is, on average, 674 more hours of discomfort when changing the orientation of the façade from the southwest to the northeast. As discussed before, the lines for the southwest orientation (dashed lines) cross in the right-hand part of the figure for both hot and cold discomfort. With the northeast orientation (full lines), this does not happen.
As for space heating, there is also an increase when the dwelling is oriented toward the northeast, as shown in Figure 11. With the 13% WWR, the median heating demand goes from 24 kWh/m2 with the Southwest façade up to 30 kWh/m2 when the dwelling is located toward the north. These figures are, respectively, 34 and 48 kWh/m2 for the 40% WWR design. The explanations given for comfort still apply for the heating demand: by orienting the dwelling toward the northeast, there is less solar gains in the dwelling, so the heating system must provide more energy to compensate. The gap between the two dashed lines in Figure 11 (which represents results from the southwest façade) is smaller than the gap between the full lines (which represent results from the northeast façade). This means that the differences between the 13 and 40% WWR designs are larger when the dwelling is oriented toward Northeast. In fact, 13% WWR leads to a 15% increase in heating demand, compared to a 27% increase with the 40% WWR. Again, since a fenestration rate of 40% relies more on solar radiation to provide heat to the building than a ratio of 13%, reducing this radiation highly affects the overall quality of the envelope from a thermal balance standpoint.
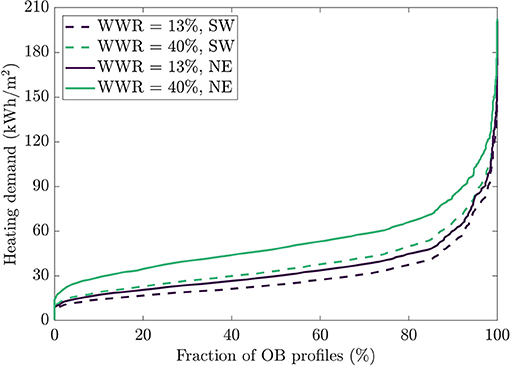
Figure 11. Cumulative fraction of possible occupant behavior scenarios with a specific heating demand for two orientations and two window-to-wall ratios.
Sensitivity Analysis With Linear Regression
In order to assess the influence of different occupant behavior aspects on the performance distribution curves for the two extreme WWR values, we developed linear regressions based on the set of 1,000 simulations mentioned above for each orientation. This allows to calculate the standardized coefficients of regression, which are a measure of the influence of a given parameter on performance (Montgomery et al., 2012). Standardized multivariate linear regression model takes the following form for a model with M independent variables:
where:
In these equations, y is an output of the model (e.g., energy consumption), and xj are the independent variables. Symbols with a bar are average, while σ is the standard deviation. Symbols with a star are standardized values. βj* represents the jth standardized regression coefficient and ε* expresses the model error (difference between predicted and observed data). Standardization allows to present regression coefficients in their dimensionless form. Figure 12 displays the seven parameters used in the regression models (heating, cold discomfort and hot discomfort) along with their related standardized coefficients. The R2 of these regressions are, respectively, 0.93, 0.71, and 0.50 for 13% WWR and 0.95, 0.78, and 0.55 for 40% WWR. The seven independent variables of the models characterize occupant behavior in a dwelling in addition to its orientation. The information related to orientation was expressed as a binary variable that is either zero or one (southwest façade = 0 and northeast façade = 1). Filled and blank bars express the standardized coefficients for WWR of 13 and 40%, respectively. Positive standardized coefficients convey that the given independent variable is proportional to the dependent variable, whereas a negative value means that both variables are inversely proportional.
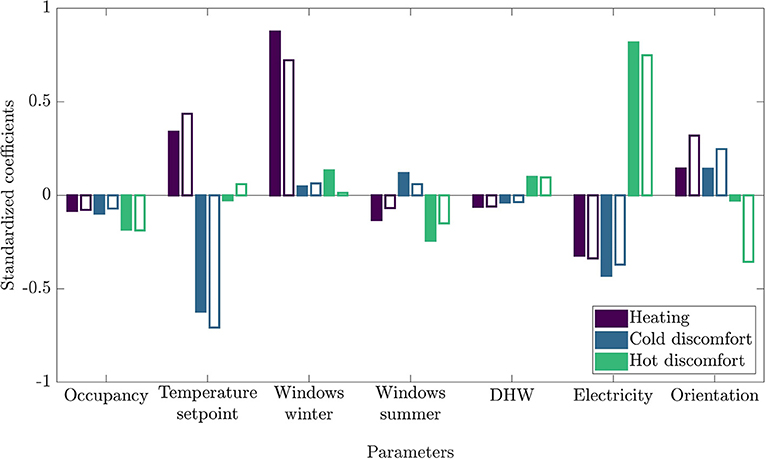
Figure 12. Standardized coefficients for each variables in the heating, energy and discomfort regression models for different WWR: filled = 13%, blank = 40%.
First, the temperature setpoint appears to be strongly correlated to heating and cold discomfort, but not to hot discomfort. As mentioned before, since there is no mechanical cooling and the heating system is not used during summer, the temperature setpoint does not influence the building thermal behavior during that season. On the other hand, one can clearly see that larger windows increase the correlation between temperature setpoint and heating demand because of higher thermal losses through glazing. Therefore, cold discomfort is more likely to occur with smaller setpoint temperature.
Then, the impact of window opening during winter diminishes with the increase of window size. Higher heating demand is already necessary to compensate for additional airflow induced by window opening. Consequently, the weight of window opening behavior on the global heating demand becomes less significant with a 40% WWR compared to a 13% WWR. On the other hand, hot discomfort is less common because of fresh air admission in the dwelling or simply because thermal losses are increased. In a similar vein, during summer, the standardized coefficient between hot discomfort and window opening moves from −0.24 to −0.15 for two reasons. First, overheating is directly influenced by window size. Second, larger windows guarantee a better air circulation for the same window opening habits.
About DHW and electricity consumption, the increase in WWR does not change significatively the strength of the actual correlation with the three model outputs. Indeed, occupant behavior regarding DHW and electricity does not change with window size, as currently modeled. The same case applies for occupancy.
Unsurprisingly, heating demand and discomfort coefficients are much more influenced by building orientation when WWR is high. In fact, the heating demand coefficient for 40% WWR is almost twice the one for 13% WWR (knowing that a positive coefficient is related to northeast orientation). Moreover, hot discomfort for southwest-oriented dwelling almost 13 times more correlated to orientation. A particular attention shall thus be paid to window size on southwest façade to minimize hot discomfort.
Discussion
This exploratory work shows that the influence of WWR on building performance can be different depending on occupant behavior. The probability distributions of the heating demand and discomfort hours moved when WWR changed, as evidenced by Figures 3–9 and Tables 1, 2. Furthermore, the relative importance of different OB aspects can change depending on the WWR values. For example, when windows are enlarged, window opening becomes less influential on the heating demand, but on the other hand the choice of temperature set point becomes more influential, as detailed in Section Sensitivity Analysis With Linear Regression. These results can help designers to better assess how WWR affects performance, considering the overall spectrum of occupant behavior. By looking at the whole spectrum of occupant behavior, one can see that simulations comparing the same building designs can lead toward different conclusions depending on the occupant behavior profiles that are used. For instance, for most occupant behavior profiles, dwelling with low WWRs lead to more comfortable results. However, for more extreme occupant profiles, it was actually the high WWR designs that offer better performances. Designs with low WWRs were more sensitive to occupant behavior. The ultimate choice of WWR value that a designer makes could then be based not only on their assessment of the relative importance of different design objectives (energy performance, comfort, etc.), but also on different possible occupant behaviors. Depending on the context, the priority could be to limit possible extreme situations, to design for the average or median occupant, to design to limit possible variability, etc. The tables and figures presented in this paper provides a synthetic way to obtain this information, at least in the context investigated.
It is important to recall that the present work relies on several assumptions and simplifications that could be studied and relaxed in further studies. We assumed that changing WWR had no impact on electricity consumption when in fact, more windows should bring in more natural lighting and thus reduced the need for artificial lighting. Furthermore, we could also introduce into the occupant behavior model other aspects, e.g., use of blinds to control solar heat gains. The methodology used in this work could be repeated for other design features (envelope insulation level, shading systems, HVAC systems, etc.). Our assessment of the performance of the various WWR is also only based on the thermal point-of-view. We strictly considered the engineer perspective as we evaluate the designs with their heating demand and thermal comfort. It would be interesting to consider additional objectives, for example by including a visual comfort assessment. Economical considerations would also be interesting to include. Moreover, this work was done for one building archetype in a single location. It is evident that results could vary for other scenarios.
We consider this work as a first step toward fully incorporating the occupant behavior diversity in building design. The objective of the paper was to assess whether considering various occupant behaviors could alter the performance of different WWR. The results presented in the paper suggests that, indeed, the selection of WWR for a building design could highly depend on the occupants that live in the building. The same approach could eventually be applied to other design variables, to better understand how they influence the performance probability distributions. While it is theoretically possible to replicate the Monte Carlo method used here in a multi-objective optimization process (provided that suitable objective functions can be defined to assess the performance distribution curves), it would be extremely time consuming. From there, a thinking process is needed to develop ways to better consider a diversity of occupants in building design optimization tools.
Conclusions
In this work, we introduced a stochastic occupant behavior model (considering occupancy, choice of temperature setpoint, DHW and electricity consumption and window opening) into an energy model of a residential unit. Then, the dwelling was simulated multiple times, considering each time a different occupant profile. In the end, this allows to generate a probability distribution of how much heating the unit will need and how comfortable the unit will be depending on occupant behavior. This method was applied to study the impact of the window-to-wall ratio on performance, again considering multiple possible occupant profiles. Results indeed demonstrate that changing the WWR value can have different impacts depending on occupant behavior, and that the most influential occupant behaviors on performance also changed with the WWR value.
Among the limitations of this work are the fact that only one building archetype, in one location, was studied. Furthermore, only energy consumption and discomfort were used to quantify performance. In future work, other building archetypes and cities could be investigated, and other metrics could also be looked at (e.g., daylighting, environmental footprint, etc.). The work that we performed for WWR could also be repeated with other design variables. A better understanding of how performance probability curves are affected by WWR (or other design variables) is a first step toward integrating OB diversity in building optimization tools. This would further require the development of relevant objective functions and strategies to reduce computational times.
Data Availability Statement
The raw data supporting the conclusions of this article will be made available by the authors, without undue reservation.
Author Contributions
JR and LG came up with the concept for the paper. JR first developed the model used in the paper, with later modifications made by DV. DV executes the simulations and did the results analysis, with the help of JR and LG and also wrote the first draft of the article, which was then revised by LG and JR. All authors contributed to the article and approved the submitted version.
Funding
This work was supported by the Fonds de recherche du Québec – Nature et Technologies (FRQNT).
Conflict of Interest
The authors declare that the research was conducted in the absence of any commercial or financial relationships that could be construed as a potential conflict of interest.
Publisher's Note
All claims expressed in this article are solely those of the authors and do not necessarily represent those of their affiliated organizations, or those of the publisher, the editors and the reviewers. Any product that may be evaluated in this article, or claim that may be made by its manufacturer, is not guaranteed or endorsed by the publisher.
Acknowledgments
The authors would like to express their gratitude to the Société d'habitation du Québec (SHQ) and the Office municipal d'habitation de Québec (OMHQ) for the dataset described in Section Materials and Methods.
References
Arslan, M., Cruz, C., and Ginhac, D. (2019). Understanding occupant behaviors in dynamic environments using OBiDE framework. Build. Environ. 166:106412. doi: 10.1016/j.buildenv.2019.106412
Ashrafian, T., and Moazzen, N. (2019). The impact of glazing ratio and window configuration on occupants' comfort and energy demand: the case study of a school building in Eskisehir, Turkey. Sustain. Cities Soc. 47:101483. doi: 10.1016/j.scs.2019.101483
Belazi, W., Ouldboukhitine, S.-E., Chateauneuf, A., and Bouchair, A. (2018). Uncertainty analysis of occupant behavior and building envelope materials in office building performance simulation. J. Build. Eng. 19, 434–448. doi: 10.1016/j.jobe.2018.06.005
Carlucci, S., De Simone, M., Firth, S. K., Kjærgaard, M. B., Markovic, R., Rahaman, M. S., et al. (2020). Modeling occupant behavior in buildings. Build. Environ. 174:106768. doi: 10.1016/j.buildenv.2020.106768
Chaturvedi, S., Rajasekar, E., and Natarajan, S. (2020). Multi-objective building design optimization under operational uncertainties using the NSGA II algorithm. Buildings 10:88. doi: 10.3390/buildings10050088
Chen, S., Zhang, G., Xia, X., Chen, Y., Setunge, S., and Shi, L. (2021). The impacts of occupant behavior on building energy consumption: a review. Sustain. Energy Technol. Assess. 45:101212. doi: 10.1016/j.seta.2021.101212
Georgievski, I., Nguyen, T. A., Nizamic, F., Setz, B., Lazovik, A., and Aiello, M. (2017). Planning meets activity recognition: Service coordination for intelligent buildings. Pervasive Mob. Comput. 110:134. doi: 10.1016/j.pmcj.2017.02.008
Guo, Y., and Bart, D. (2020). Optimization of design parameters for office buildings with climatic adaptability based on energy demand and thermal comfort. Sustainability 12:3540. doi: 10.3390/su12093540
Hong, T., Lee, M., Yeom, S., and Jeong, K. (2019). Occupant responses on satisfaction with window size in physical and virtual built environments. Build. Environ. 166:106409. doi: 10.1016/j.buildenv.2019.106409
Hu, M., and Xiao, F. (2020). Quantifying uncertainty in the aggregate energy flexibility of high-rise residential building clusters considering stochastic occupancy and occupant behavior. Energy 194:116838. doi: 10.1016/j.energy.2019.116838
Karjalainen, S.. (2016). Should we design buildings that are less sensitive to occupant behaviour? A simulation study of effects of behaviour and design on office energy consumption. Energy Effic. 9, 1257–1270. doi: 10.1007/s12053-015-9422-7
Klein, S. A.. (2013). TRNSYS 17: A Transient Systems Simulation Program. Madison, WI: Solar Energy Laboratory, University of Wisconsin. Available online at: http://sel.me.wisc.edu/transys
Kotireddy, R., Hoes, P.-J., and Hensen, J. L. M. (2019). Integrating robustness indicators into multi-objective optimization to find robust optimal low-energy building designs. J. Build. Perform. Simul. 12, 546–565. doi: 10.1080/19401493.2018.1526971
Marino, C., Nucara, A., and Pietrafesa, M. (2017). Does window-to-wall ratio have a significant effect on the energy consumption of buildings? A parametric analysis in Italian climate conditions. J. Build. Eng. 13, 169–183. doi: 10.1016/j.jobe.2017.08.001
Montgomery, D. C., Peck, E. A., and Vining, G. G. (2012). Introduction to Linear Regression Analysis, 5 Edn. Hoboken, NJ: Wiley.
National Resources Canada (2011). Survey of House Energy Use - Detailed Statistical Report (No. 978-1-100-23468–7). Ottawa, ON.
Nguyen, T. A., and Aiello, M. (2013). Energy intelligent buildings based on user activity: a survey. Energy Build. 56, 244–257. doi: 10.1016/j.enbuild.2012.09.005
O'Brien, W.. (2013). “Occupant-proof buildings: can we design buildings that are robust against occupant behaviour?,” in Presented at the 13th Conference of International Building Performance Simulation Association. Cambéry, 1746–1754.
Oliveira, R., Figueiredo, A., Vicente, R., and Almeida, R. M. S. F. (2020). Impact of unoccupied flats on the thermal discomfort and energy demand: case of a multi-residential building. Energy Build. 209:109704. doi: 10.1016/j.enbuild.2019.109704
Østergård, T., Jensen, R. L., and Mikkelsen, F. S. (2020). The best way to perform building simulations? One-at-a-time optimization vs. Monte Carlo sampling. Energy Build. 208:109628. doi: 10.1016/j.enbuild.2019.109628
Putra, H. C., Hong, T., and Andrews, C. (2021). An ontology to represent synthetic building occupant characteristics and behavior. Autom. Constr. 125:103621. doi: 10.1016/j.autcon.2021.103621
Rouleau, J., and Gosselin, L. (2020). Probabilistic window opening model considering occupant behavior diversity: a data-driven case study of Canadian residential buildings. Energy 195:116981. doi: 10.1016/j.energy.2020.116981
Rouleau, J., Gosselin, L., and Blanchet, P. (2018). Understanding energy consumption in high-performance social housing buildings: a case study from Canada. Energy 145, 677–690. doi: 10.1016/j.energy.2017.12.107
Rouleau, J., Gosselin, L., and Blanchet, P. (2019a). Robustness of energy consumption and comfort in high-performance residential building with respect to occupant behavior. Energy 188:115978. doi: 10.1016/j.energy.2019.115978
Rouleau, J., Ramallo-González, A. P., Gosselin, L., Blanchet, P., and Natarajan, S. (2019b). A unified probabilistic model for predicting occupancy, domestic hot water use and electricity use in residential buildings. Energy Build. 202:109375. doi: 10.1016/j.enbuild.2019.109375
Song, Y., Sun, Y., Luo, S., Tian, Z., Hou, J., Kim, J., et al. (2018). Residential adaptive comfort in a humid continental climate – Tianjin China. Energy Build. 170, 115–121. doi: 10.1016/j.enbuild.2018.03.083
Wang, R., Lu, S., and Feng, W. (2020). Impact of adjustment strategies on building design process in different climates oriented by multiple performance. Appl. Energy 266:114822. doi: 10.1016/j.apenergy.2020.114822
Yan, D., Hong, T., Dong, B., Mahdavi, A., D'Oca, S., and Gaetani, I. (2017). IEA EBC Annex 66: Definition and simulation of occupant behavior in buildings. Energy Build. 258:270. doi: 10.1016/j.enbuild.2017.09.084
Nomenclature
p, Probability T, Temperature (°C) x, Independent variable y, Dependent variable
Greek Letters
β, Regression coefficient ε, Regression model error ω, Logit regression coefficient
Subscripts
const, Constant in, Inside temperature open, Opened window out, Outside temperature
Keywords: occupant behavior, window-to-wall ratio, building performance, stochastic model, thermal comfort, Monte Carlo simulation
Citation: Veillette D, Rouleau J and Gosselin L (2021) Impact of Window-to-Wall Ratio on Heating Demand and Thermal Comfort When Considering a Variety of Occupant Behavior Profiles. Front. Sustain. Cities 3:700794. doi: 10.3389/frsc.2021.700794
Received: 26 April 2021; Accepted: 18 November 2021;
Published: 09 December 2021.
Edited by:
Marilena De Simone, University of Calabria, ItalyReviewed by:
Hirushie Karunathilake, University of Moratuwa, Sri LankaJiying Liu, Shandong Jianzhu University, China
Copyright © 2021 Veillette, Rouleau and Gosselin. This is an open-access article distributed under the terms of the Creative Commons Attribution License (CC BY). The use, distribution or reproduction in other forums is permitted, provided the original author(s) and the copyright owner(s) are credited and that the original publication in this journal is cited, in accordance with accepted academic practice. No use, distribution or reproduction is permitted which does not comply with these terms.
*Correspondence: Louis Gosselin, bG91aXMuZ29zc2VsaW5AZ21jLnVsYXZhbC5jYQ==