 May Woo
 Piers MacNaughton1,2
 Mohamed Boubekri
94% of researchers rate our articles as excellent or good
Learn more about the work of our research integrity team to safeguard the quality of each article we publish.
Find out more
ORIGINAL RESEARCH article
Front. Sustain. Cities, 08 September 2021
Sec. Health and Cities
Volume 3 - 2021 | https://doi.org/10.3389/frsc.2021.690055
While buildings are designed with expansive windows to allow for abundant daylight and views, in practice, they are frequently occluded to control for heat and glare. Electrochromic glass windows are a solution designed to maximize occupant access to daylight and views throughout the day, and previous research has demonstrated the benefits they can impart on sleep and cognition. We extend this research to quantify its impacts on the perceived physical and emotional wellbeing of occupants in an office environment. 30 office workers spent 5 days working in each of two West-facing offices that were identical with the exception of the window treatment: one with dynamic electrochromic windows and the other with functionally standard windows partially occluded by a fixed roller shade. When working in the office with electrochromic glass, participants were 8-fold more likely of report satisfaction with daylight conditions and 6.5-fold more likely to report satisfaction with views of the outside, were 48% less likely to report eyestrain, perceived a significant benefit to positive affect and were 77% less likely to report feeling depressed. This study adds to the growing body of research demonstrating the importance of daylighting strategies in designing spaces that support the physical and mental health of occupants.
Our physical environments are a key determinant of human health, on par with genetics and access to medical care (Schroeder, 2007). With people spending approximately 90% of their time indoors (Klepeis et al., 2001), buildings are the main mediator of people's exposures to environmental factors—their ventilation systems control the quality of the air indoors and their heating and cooling systems maintain indoor temperatures that keep us comfortable, irrespective of the conditions outside. Decades of research have demonstrated that the physical indoor environment is critical to multiple dimensions of occupant health and wellness. In an office setting, optimizing indoor environmental quality has been shown to benefit physical health by reducing sick building symptoms and improving sleep and circadian entrainment, mental health by improving mood and reducing feelings of depression, and performance by enhancing the productivity and cognitive function of employees (Edwards and Torcellini, 2002; Singh et al., 2010; Allen et al., 2016). Windows both control the amount of daylight entering the building and serve as the main mechanism for staying connected to the outside world, factors that ultimately impact the physical and mental health of occupants.
Providing access to daylight and views of the outside impacts physical health through non-visual and visual pathways. Previous research, largely conducted in controlled laboratory settings or among vulnerable populations such as the elderly, has shown that the qualities of daylight—the intensity, spectra and timing—provide circadian-effective lighting that ultimately drive various bodily functions such as sleep and metabolism through non-visual pathways (Paul et al., 2009; Tähkämö et al., 2018). Visually, daylight and views may shape perceptions of indoor environmental quality with outsized influence, given that the visual system dominates cognitive processes in both real-time and recall (Stokes and Biggs, 2014). Daylight impacts visual comfort, with small, too few, or occluded windows leading to fatigued and strained eyes (Simonson and Brozek, 1948; Cowling et al., 1990) and depriving occupants of a long-distance view, which can provide a point of relaxation for the eye's muscles (Wilkins et al., 1989). Expansive windows that let in too much daylight, on the other hand, can create the potential for glare and shadowed task areas that lead to excessive visual contrast (Hopkinson, 1971). Glare may be of particular concern for office workers or others who use screens for prolonged periods of time, as direct and reflective glare increases the likelihood of experiencing Computer Vision Syndrome, a common health issue hallmarked by eyestrain and often accompanied by other symptoms such as headaches (American Optometric Association, 2020).
Daylight and views through windows have also been demonstrated to impart psychological and mental health benefits. In an office setting, employees working in offices with windows or other biophilic elements have exhibited lower stress levels and increased workplace satisfaction (Kellert and Wilson, 1993; Yin et al., 2018). The relationship between daylight and mental health is especially evident in Seasonal Affective Disorder (SAD), where short daytime hours during the winter season result in a seasonal depression, and for which a common treatment includes light therapy that exposes the patient to intensities and wavelengths of light that mimic daylight (Howland, 2009). Research also suggests a physiological basis for this relationship; Matheson et al. (2015) found that seasonal longer periods of daylight were associated with higher availability of serotonin receptors among a sample of 40 healthy men (Matheson et al., 2015).
Given the health implications of both inadequate and uncontrolled daylight, building designers and engineers are challenged with creating indoor lighting conditions optimized for the occupant's circadian system, visual and thermal comfort, and mental health. Traditionally, this equilibrium is met by providing ample windows to maximize daylight penetration and outfitting them with blinds or shades to be used when a glare condition is present. However, this approach still forces the occupants to adjust the blinds on a sub-daily basis to account for the angle of the sun. In practice, occupants only adjust 6% of blinds daily and less than half of blinds are adjusted even once per year (Nezamdoost and Van Den Wymelenberg, 2017). A window technology called electrochromic (EC) glazing provides a solution to this problem by creating a dynamic façade that tints based on the solar conditions, thereby maintaining maximal access to circadian-effective daylight, glare mitigation, and consistent access to views to the outside throughout the day.
Previous studies have demonstrated that office workers in workplaces with EC glazing reported 51% less eyestrain and 63% fewer headaches (Hedge and Nou, 2018) and 25% higher moods (Choi et al., 2020) compared to workplaces with traditional windows and blinds. The current study aims to further investigate these physical and mental health benefits among a healthy adult population using a highly controlled, randomized crossover design conducted in a real-world office setting. In this study, 30 participants spent one week working in each of two offices, one with roller shades and the other with EC glazing. The objective of the study was to investigate how these two environments, differing only in the daylight conditions and window treatment, impact occupants' environmental perceptions, physical health, and emotional wellbeing.
This manuscript extends the findings of the EVOLV Study, which was conducted in Durham, North Carolina in the fall of 2019 (Boubekri et al., 2020). Briefly, the 4-week study utilized a crossover study design and involved the following: (1) one week during which the 30 participants worked from their typical office environment, (2) two weeks during which participants relocated to the study site where they experienced each of two study conditions in a randomly assigned order, and (3) one final week where they returned to their typical office environment. The study design is described in Figure 1. During the onsite portion of the study, participants continued to perform their normal work activities from 9:00 am to 5:00 pm and were asked to complete the daily surveys, wear a sleep-tracking device, and take semi-weekly cognitive assessments at the end of the workday. Across the two conditions, participants were assigned to the same desk within the office layout to control for the participant's distance from the window. The previous publication details the results related to sleep and cognition during the onsite portion of the study; this paper focuses on the self-reported questionnaire responses for physical and emotional health and incorporates information collected from the participants during the two weeks in their baseline office. Five unique datasets were collected and analyzed in the current paper:
(1) Window shading usage behavior in participants' typical office environments
(2) Environmental measures in the two study conditions (e.g., desk horizontal illumunance and retinal vertical illuminance, room temperature)
(3) Self-reported environmental perceptions (e.g., daylight satisfaction)
(4) Self-reported physical health symptoms (e.g., eyestrain, headache)
(5) Self-reported mental health indicators (e.g., PANAS instruments, feelings of depression).
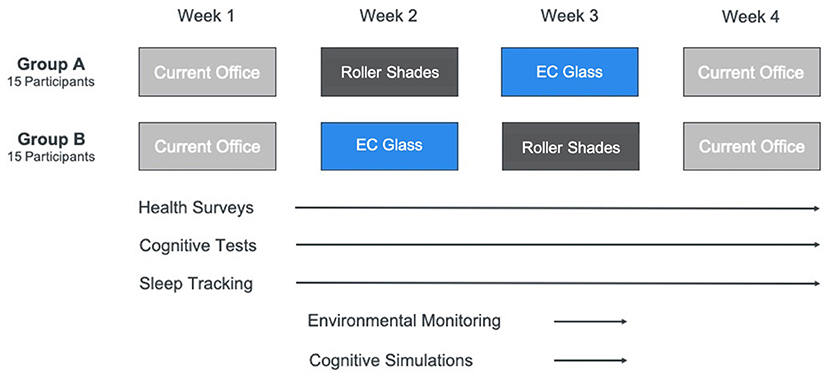
Figure 1. Crossover study design over four weeks, including two onsite study conditions: Roller Shades and EC Glass. Participation requirements of surveys, cognitive testing, sleep tracking, and environmental monitoring are described below the figure and represent activities from the overarching study. The current paper focuses on the health surveys which included environmental perceptions, physical health symptoms, and mental health indicators.
Participants were full-time office workers with an average age of 34 years (range: 23 to 55) and representing a mix of managerial (13%), professional (50%), technical (26%), and administrative (3%) job functions. Participant demographics were 63% male and 37% female, predominantly White (53% White, 23% Black, 13% Multiracial, 7% Asian, and 3% Hispanic), and nearly all had an educational attainment of college degree or higher (90% college degree or higher, 7% some college, 3% high school graduate). The demographic distributions of the two groups—the group assigned to the office with EC glass (“EC Glass”) first and the group assigned to the office with roller shades (“Roller Shades”) first were were statistically similar in terms of sex, age, education, race, job function, and baseline health characteristics as assessed by SF-36 and PSQI sleep questionnaires upon enrollment. Participants were not informed of the environmental conditions or hypotheses in any study correspondence. The study protocol was reviewed and approved by the University of Illinois at Urbana-Champaign Institutional Review Board. Further detail on participant recruitment and demographics can be found in the previously published manuscript (Boubekri et al., 2020).
The two-week onsite portion of the study involved working one work week in each of two offices that were identical in size, orientation (West-facing facade), layout, furniture setup, HVAC configuration and overhead and task lighting, with the only difference being the window treatment: one office was outfitted with roller shades, and the other with electrochromic glass (Figure 2A). Participants were randomly assigned their workstations and the order in which they occupied the two conditions. Participants maintained the same workstation location across the two conditions. The layout of the desks resulted in four rows that were 5, 10, 15, and 20 feet away from the window, respectively (Figure 2B).
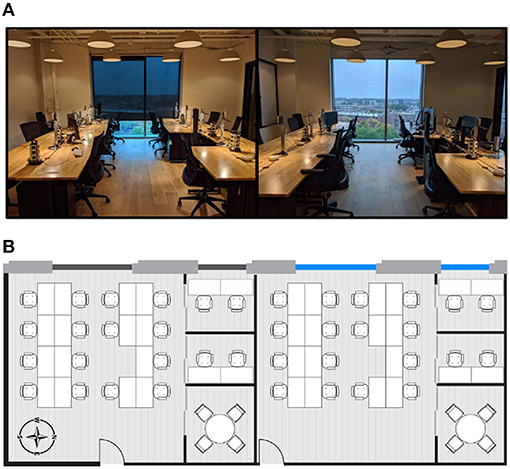
Figure 2. (A) Photographs of the two study conditions: Roller Shades (left) and EC Glass (right). (B) Furniture layout of the two study conditions: Roller Shades (left) and EC Glass (right).
In the Roller Shades office, functionally standard windows (58% visible transmittance glass) were occluded with 1.5% visible transmittance fabric roller shades fixed at 75% window area occlusion. The fixed positioning at 75% occlusion ensured that there would not be any direct solar glare on the workstations and aligns with both previous research indicating that when blinds are being used, they are deployed 75% of the way down or more in 63% of instances (Nezamdoost and Van Den Wymelenberg, 2017). The positioning also aligns with the blinds adjustment behavior reported by our study population while in their normal office environments during study Weeks 1 and 4. Of the participants with roller blinds or shades, which was the most common window shading mechanism, 60% reported that the general position of the blinds during those weeks was at least partially closed, and only 23% adjusted their blinds one or more times a day: 40% reported that the blinds were never adjusted during the week and 23% reported that they were adjusted one to two times that week (Table 1). In alignment with these reported behaviors, the shades at the study site were kept fixed throughout the study period. As evident in Figure 2, the shades were not completely opaque and did not completely obstruct a view of the outdoors.
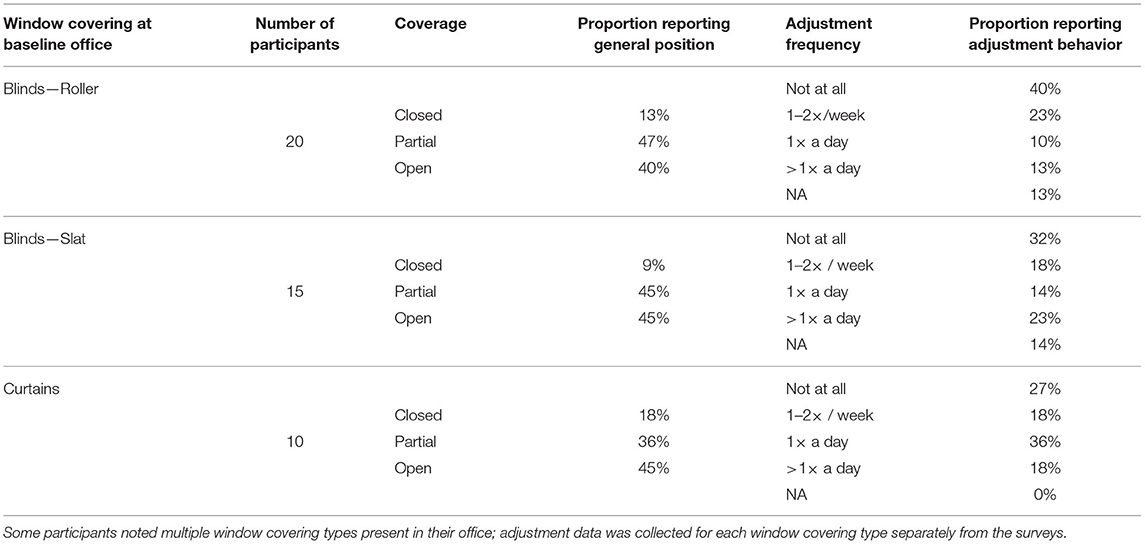
Table 1. Window occlusion and adjustment conditions reported by participants while in their typical office environment during Weeks 1 and 4.
In the EC Glass office, a predictive algorithm factors in the orientation of the window relative to the sun, local cloud cover, and solar conditions via a sensor located on the roof in order to tint the EC glass to one of four tint states. These tint states range from a visible transmittance of 58% down to 0.5%. As the office had a west orientation, the tint state of the glass was typically clear (58% light transmittance) from 9:00 am to 12:30 pm, at which time it would tint to its darkest tint state (0.5% light transmittance) over the course of 30 to 60 min. The afternoon tint state was dependent on the level of cloud cover on each day.
Awair Omni sensors were used to continuously monitor the environmental conditions at each participant's desk during the onsite portion of the study: temperature, relative humidity, air quality (CO2, PM2.5, and TVOCs), noise, and light levels every five minutes, with device orientation at eye level alternating such that half of the sensors measured horizontal illuminance and the other half measured vertical illuminance. A LI-COR model LI-180 spectrometer was also located centrally in each of the two offices to continuously measure illuminance (lux), correlated color temperature (CCT), color rending index, and photon flux density of the vertical light entering from the west façade. By design, other than the intensity, color, and timing of the vertical light entering the offices through the window façade, the other environmental conditions were similar across the two offices throughout the study period (Table 2). Overhead lighting was kept consistent in both offices and the workstations were also outfitted with task lighting set to a consistent brightness and color temperature. The electric lighting was designed to provide an adequate surface illuminance >150 lux in the absence of any daylight.
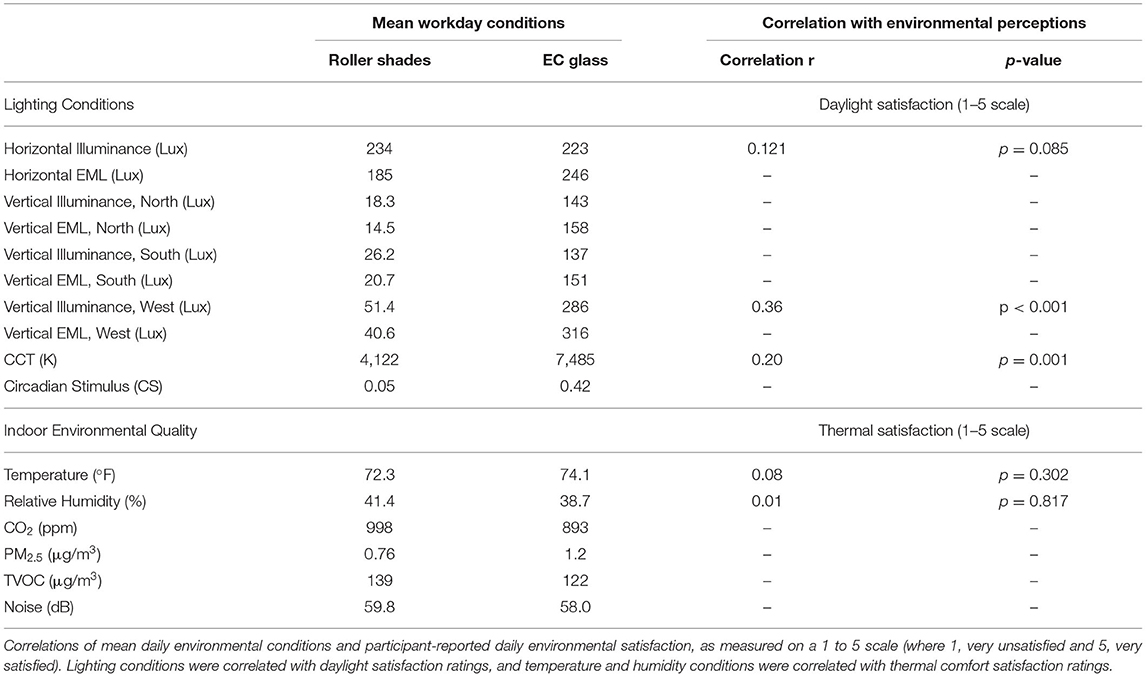
Table 2. Environmental conditions in the two office environments (Mean workday conditions), with values represent average conditions over the course of the study period during work hours (9 am−5 pm).
Table 2 summarizes the average measures of the environmental conditions over the course of the workday in each of the conditions. The daily variation in illuminance and equivalent melanopic lux in the two offices are described in Figure 3. A more detailed description of the environmental conditions in the two offices can be found in the previous manuscript (Boubekri et al., 2020).
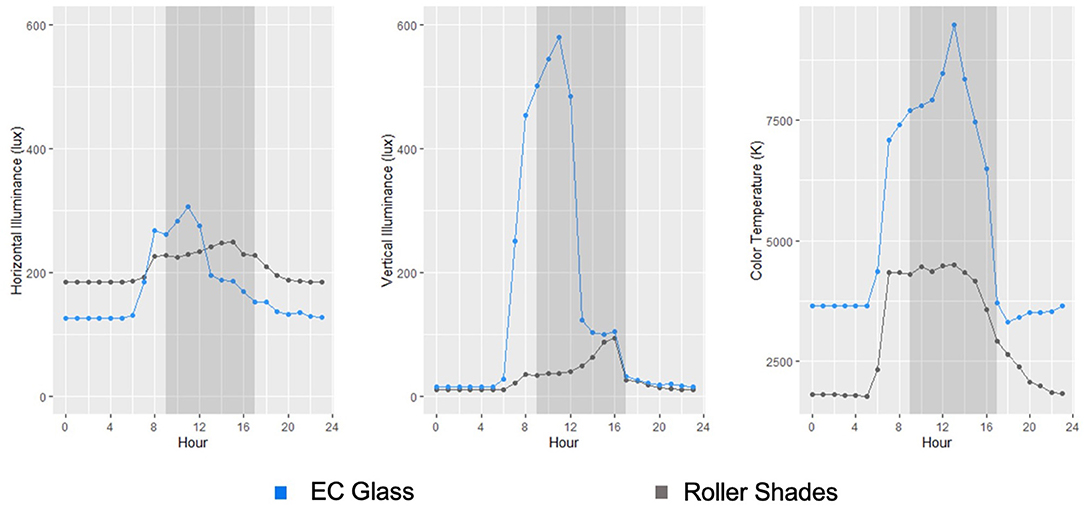
Figure 3. Mean hourly light conditions in the two study conditions: horizontal illuminance in lux (left), vertical illuminance in lux (middle), and correlated color temperature in Kelvin (right).
At the end of every workday, participants were asked to complete a survey prompting them with questions relating to their environmental perceptions, physical health, and emotional affect. These surveys were administered electronically using the Qualtrics survey platform. The survey also contained questions that captured whether they were at their workstation during each of the hours from 9:00 am to 5:00 pm that day, information that was used to subset the analysis to responses collected on days when the participant was at their workstation for at least 75% of the workday. To capture their lifestyle factors outside of their workday, they were asked about their commute, caffeine intake, eating schedule, evening screen use, evening exercise and use of any medications or supplements, as well as an open-ended comment section for participants to note any extenuating circumstances.
For questions relating to their environmental perceptions, participants were asked to rate their satisfaction with daylight conditions, temperature conditions, and access to the views of the outdoors each on a five-point Likert scale ranging from “very unsatisfied” to “very satisfied.” They were also asked on a daily basis whether or not they experienced any of the following visual discomfort perceptions during that workday (binary yes or no as response categories): the space feeling too dim, the space feeling too bright, the lack of daylight, the overabundance of daylight, an undesirable color of the lighting, and the perception of glare reflected off of computer screens or surfaces.
For questions relating to their general physical health, participants were asked whether they had experienced any of the following symptoms over the course of that workday (binary yes or no as response categories): tired or strained eyes, a headache, difficulty remembering things or concentrating, unusual fatigue, and tension or irritability.
For questions relating to their emotional well-being, the participants were administered the Positive and Negative Affect Schedule (PANAS) questionnaire, a widely used and highly validated scale for assessing mood, affect, and emotion (Watson et al., 1988). The PANAS scale prompts respondents with 10 items measuring positive affect (PA) and 10 measuring negative affect (NA) and asks them to rate the extent to which they experience each on a 5-point Likert scale (from “very slightly” to “very much”). The PA and NA scales are a sum of the ratings for the 10 items in each scale, ranging from 10 to 50. While the PA scale is a dimension of enthusiasm, alertness and engagement, the NA scale is a dimension of subjective distress and aversion (Wang and Boubekri, 2011). The daily surveys also contained a question asking whether the participant had experienced feelings of depression that workday (binary yes or no as response categories).
The relationship between environmental measurements as collected by the sensors at the desks and environmental satisfaction (daylight and temperature satisfaction) were analyzed using Pearson's product-moment correlation tests. Specifically, correlation tests were conducted between horizontal and west-facing illuminance levels and daylight satisfaction, and temperature and relative humidity levels and thermal comfort satisfaction.
Environmental perceptions on the scale of one to five were categorized as satisfied (score of four or higher) or not (score of three or lower). Generalized linear mixed models were used to test associations between the office condition and environmental perceptions, likelihood of reporting any of the physical symptoms, positive and negative affect scores, and likelihood of reporting feelings of depression. Participant ID was treated as a random intercept to control for interpersonal confounders in each model.
To model the impact of office condition on emotional affect, we introduced potential lifestyle predictors of affect identified a priori (including medication use and exercise) that may have varied across participant's day-to-day lives, utilizing a backward elimination approach with an inclusion alpha level of 0.25. The final models for positive affect and negative affect are described in Equations 1 and 2, respectively, where ui represents the random effect for each individual (i) and ei.j represents the error term for observations (j) within each individual (i). In the final model, positive affect was modeled as a function of the environmental condition (“Condition”), whether the participant had taken cold medication the night prior (“Cold Medication”), and the number of alcoholic drinks consumed the night prior (“Alcohol”) (Equation 1). Negative affect was modeled as a function of Condition and whether the participant had taken pain medication (“Pain Medication”) or any other medication the night prior (excluding sleep, cold, or pain medication; “Other Medication”) (Equation 2).
In addition, a factor analysis of the 20 PANAS items was conducted to determine the items with similar response patterns and to group them into factor groups. Analyses were conducted using the open-source statistical package R version 3.5.0 (R Project for Statistical Computing, Vienna, Austria).
West-facing illuminance levels and correlated color temperature measures were found to be positively correlated with daylight satisfaction ratings (r = 0.36, p < 0.001, and r = 0.20, p = 0.001, respectively). Neither temperature nor relative humidity were found to be correlated with thermal comfort satisfaction ratings (r = 0.08, p = 0.302, and r = 0.01, p = 0.8017, respectively) (Table 2).
On a scale of one to five (one being very unsatisfied, three being neutral, and five being very satisfied), participants rated the Roller Shades office as 2.6 for daylight satisfaction, 3.3 for electric lighting satisfaction, and 3.2 for thermal comfort satisfaction. Participants rated the EC Glass office as 3.3 for daylight satisfaction, 3.4 for electric lighting satisfaction, and 3.3 for thermal comfort satisfaction. Linear mixed effects models for likelihood of reporting satisfaction indicated that participants were 8 times more likely to be satisfied with daylight conditions and 6.5 times more likely to be satisfied with the view to the outdoors when they worked in the EC Glass office compared to when they worked in the Roller Shades office (Table 3). Participants did not find the EC Glass office to be neither too bright nor too dim, while participants were 87% more likely to report their workstations to be “too dim” when they worked in the Roller Shades office (OR = 0.13; 95% CI: 0.05–0.33; p < 0.001).
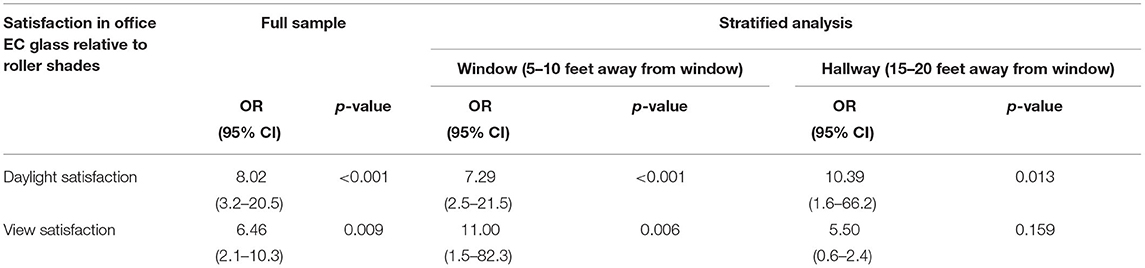
Table 3. Results of the linear mixed effects models quantifying the relative odds of reporting satisfaction with daylight and views while working in the office with electrochromic glazing compared to while working in the office with roller shades (OR: odds ratio).
Participant proximity to the window was considered in order to assess whether the benefits to improved environmental satisfaction were observed across the floorplate. Participants were assigned to two groups based on their workstation location: the two rows closest to the window (5–10 feet away, designated “Window”), and the two rows further from the window (15–20 feet away, designated “Hallway”). While the participants as a whole experienced a statistically significant increase in daylight and view satisfaction, those further from the window experienced a greater benefit to daylight satisfaction and those closer to the window experienced a greater benefit to view satisfaction (Table 3). There was no difference in satisfaction with the electric lighting and temperature conditions across the two conditions as these factors were held constant.
On average, participants reported a higher prevalence of eyestrain (35% in Roller Shades, 26% in EC Glass), fatigue (32% in Roller Shades, 21% in EC Glass), tension, and irritability (20% in Roller Shades, 16% in EC Glass), and difficulty remembering or forgetfulness (25% in Roller Shades, 18% in EC Glass) while working in the Roller Shades office compared to the EC Glass office (Figure 4).
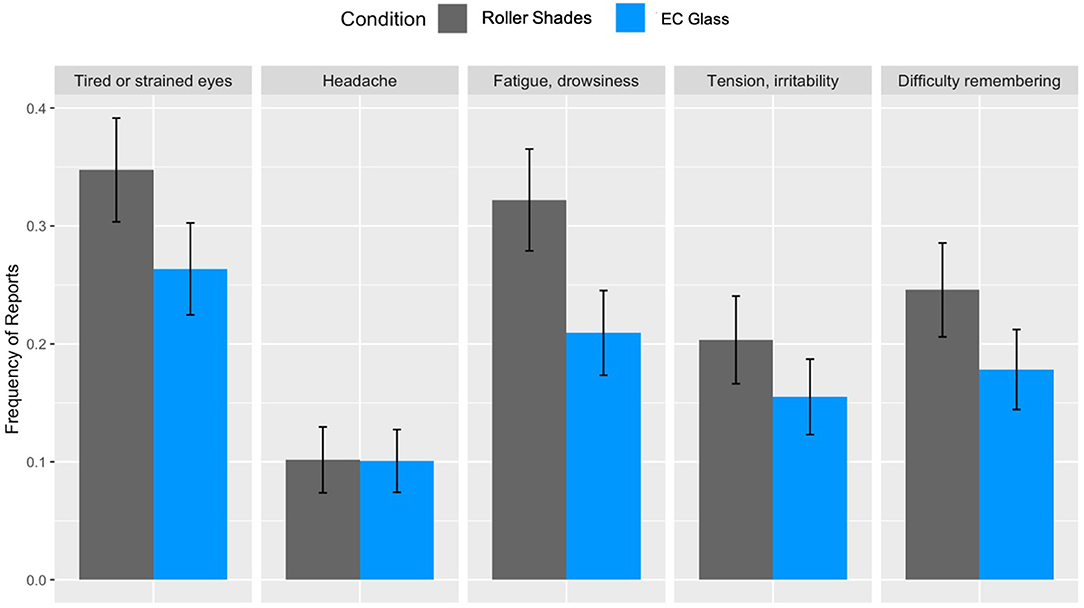
Figure 4. Frequency of reporting physical health symptoms while working in the Roller Shades and EC Glass offices. Error bars depict standard errors.
Statistical analyses (linear mixed effects models) indicated that the difference in eyestrain was statistically significant: participants were 48% less likely to report eyestrain during the workday when they worked in the EC Glass office compared to when they worked in the Roller Shades office (OR: 0.52; 95% CI: 0.50–0.61; p <0.001). While the frequency of other physical health symptoms was also lower in the EC Glass office, the differences were not statistically significant (Table 4).
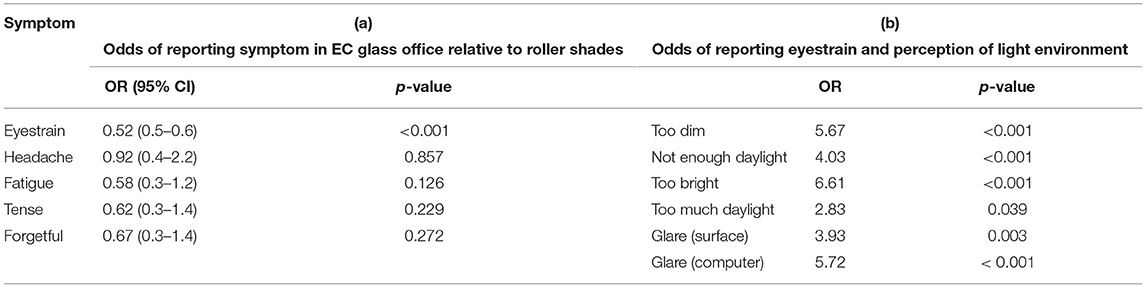
Table 4. Linear mixed effects model results for the (a) associations between self-reported physical health symptoms and office condition; and (b) associations between self-reported eyestrain and perceptions of lighting environment.
Regardless of which condition they were in, both the perceptions that the office environment was “too bright” as well as “too dim” were associated with higher odds of reporting eyestrain, indicating the importance of optimal lighting conditions for reducing eyestrain. In addition, perceptions of glare reflected off of surfaces and off of computer screens were associated with higher odds of reporting eyestrain (Table 4).
The average composite positive and negative affect scores across the 4 weeks of the study indicate that emotional affect of participants was most positive during the EC Glass condition compared to the Roller Shades condition or their regular office environment. As participants moved from their baseline work environments to the study site, their average positive affect score decreased by 0.4 points upon working in the Roller Shades office (28.1 to 27.8) and increased 0.6 points upon working in the EC Glass office (28.1 to 28.8). When they returned to their typical work environment, their positive affect scores returned to the level observed at baseline (28.2). Conversely, their negative affect scores decreased upon moving from their normal work environments and into the Roller Shades office (14.2 to 13.3) and more so upon moving into the EC Glass office (14.2 to 12.6). When the participants returned to their normal office, their average negative affect scores approached the level observed at baseline (13.4) (Figure 5).

Figure 5. Mean positive and negative affect scores in across the four study weeks.
A within-subject analysis of PANAS positive and negative affect scores indicated that working in the EC Glass office led to a 1.96 point higher positive affect score (95% CI: 0.64–3.28; p = 0.004) and a non-significant change in negative affect score, adjusting for other potential predictors of affect captured in the daily surveys as noted in Equations 1 and 2. The positive affective response was observed for both groups of participants, irrespective of the order of their conditions (positive affect benefit among those assigned to the Roller Shades office first: 1.73 points, 95% CI: 0.02–3.46; p=0.05; among those assigned to the EC Glass office first: 2.06 points, 95% CI: 0.07–4.06; p = 0.043).
A factor analysis was conducted in order to better understand the groups of emotions driving the observed effects of office condition on PANAS scores. The factor scores and corresponding factor loadings are listed in Table 5 below.

Table 5. Factor analysis of the 20 items in the PANAS scales.
The factor analysis indicated that the 20 PANAS items relate to four factors: two positive (Factors 1 and 3) and two negative (Factors 2 and 4), described by the following four equations (Equations 3–6):
The weighted scores for each of these four factors indicate that the differences in affect across office conditions was driven by the heightened scores for the positive PANAS items in Factor 3 and the decreased scores for the negative items in Factor 2. Thus, Factors 2 and 3, which observed large differences across office conditions, were characterized to represent extrinsic emotion—emotions that are more heavily influenced by the person's physical environment. Conversely, Factors 1 and 4, which observed slight differences across office conditions, were characterized to represent intrinsic emotion—emotions that relate to self-fulfillment and other personal factors. The factor analysis and subsequent weighted analysis of the 20 PANAS items indicate that while intrinsic emotions such as “excited,” “strong,” “proud,” “distressed,” and “upset” saw marginal benefits in the EC Glass office (6–8% benefit relative to the office with roller shades), the extrinsic emotions such as “interested,” “alert,” “attentive,” “scared,” and “nervous” observed large benefits in the EC Glass office (66–200% benefit relative to the office with roller shades) (Figure 6).
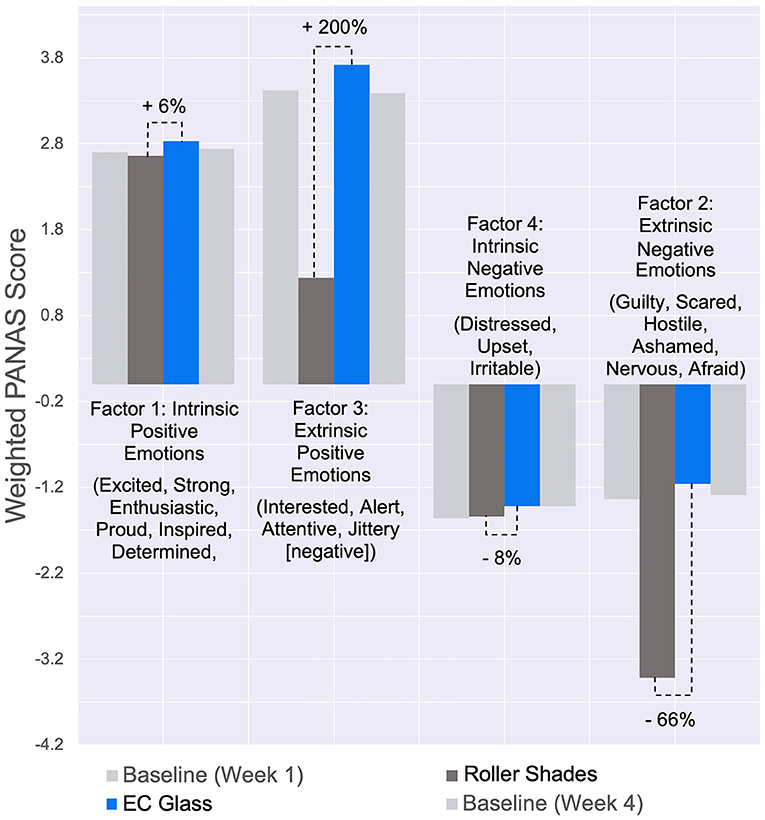
Figure 6. Weighted PANAS scores across the four study weeks, grouped by factors identified in the PANAS item factor analysis.
Supporting the observed benefit to emotional affect from working in the office with EC Glass as measured by the PANAS scale, surveys also revealed that participants were 77% less likely to report feeling depressed during the workday when they worked in the EC Glass office compared to when they worked in the Roller Shades office (OR = 0.23; 95% CI: 0.05–0.98; p = 0.05). These reports of feeling depressed correlated to the measured affect scores from the PANAS scale, with a 1-point increase in PANAS positive affect being associated with a lower odds of feeling depressed (OR = 0.56, 95% CI: 0.55–0.60; p < 0.001).
Participant reports of feeling depressed in the Roller Shades office was driven in part by their perceptions that the space was too dim and lacked daylight. Perceiving the space to as having “not enough daylight,” for example, was associated with an over ten-fold higher likelihood of feeling depressed (OR = 12.9; p < 0.001).
As evidenced in the present study, optimizing daylight and access to views in an office environment benefits multiple dimensions of occupant health: (1) environmental satisfaction, by improving perceived satisfaction with access to unobstructed views while optimizing daylight, (2) perceived physical health, by reducing self-reported symptoms of eyestrain, and (3) emotional wellbeing, by improving affect and reducing perceived feelings of depression—factors that are likely associated with cognition and sleep, outcomes measured in the previous paper.
Participants reported higher environmental satisfaction in the EC Glass office, reporting an eight and 6.5-fold higher likelihood of being satisfied with daylight and view conditions compared to when they worked in the office with roller shades. With further distance from the window, the benefit increased for daylight satisfaction and decreased for view quality, which may be a result of the window occupying more of the field of view when close to the window—providing more expansive views but also presenting the possibility of too much daylight.
The 48% reduction of eyestrain observed in the EC Glass office supports previous research demonstrating the impacts of daylighting on Computer Vision Syndrome symptoms and the importance of window views in providing a point of relaxation for the eyes (Aries et al., 2013; Ko et al., 2020). Research specifically focused on the impacts of EC glass technology has reported eyestrain reduction in the order of 50–75% (Hedge and Nou, 2018; Choi et al., 2020). In the present study, environmental perceptions demonstrated that the reduction in eyestrain was driven primarily by the dim conditions and lack of daylight perceived by participants in the office with roller shades, emphasizing the importance of providing occupants with ample daylight in an office environment on their physical health. Given that excessive daylight and glare can also cause eyestrain, designers and architects should aim to provide optimal levels of daylighting to avoid eyestrain and Computer Vision Syndrome.
Working in the EC Glass office resulted in a 1.96-point increase in PANAS positive affect and the 77% reduction in feelings of depression. These findings add to the existing body of literature quantifying the importance of access to daylight and views through windows on affect and mood (Aries et al., 2013; Ko et al., 2020) and research specifically investigating the impacts of EC glass. Choi et al. found that upon relocation into an office with EC glass technology, occupants reported significantly higher scores for positive responses such as “energized,” “happy,” and “calm” (Choi et al., 2020). The dimension of affect most positively impacted in the present study by working in the EC Glass condition related to emotions of interest, alertness, and attentiveness (+200%), and the dimension most negatively impacted related to emotions of nervousness, fear, and guilt (−66%). The 1.96 point increase in positive affect achieved by the EC Glass condition can be compared to previous studies that have found various wellness programs such as a weeklong yoga intervention, meditation exercises, walking in nature and mindfulness courses to impact positive affect on the order of 1–4 points using the same PANAS scale (Narasimham et al., 2011; Howells et al., 2014; de Brito et al., 2019; Beacham et al., 2020). Considering this context, simply where a person works during the day has the potential to benefit emotional affect in the same range as some active behavioral interventions such as yoga and meditation.
Limitations to this study include the subjective and self-report nature of many of the outcomes which lends itself to potential response bias. The surveys, however, were designed to minimize bias by using standard, validated instruments (e.g., PANAS questionnaire) and simple questions (e.g., “Did you experience any of the following today?”) carefully worded in such a way as to not encourage one answer or the other. In addition, response bias with self-reported outcomes may result from individual reporting tendencies (e.g., those who tend to respond agreeably to questions); however, the crossover study design and use of within-subject analyses sought to minimize such bias, as individual tendencies to respond in a certain way would theoretically be consistent across the two conditions. A second limitation was the small sample size of 30 office workers; however, the crossover study design and repeated measures allowed for a large sample size of observations and statistical power. In addition, while participants were not explicitly made aware of the study objectives, they were not blinded to test conditions as the difference in window treatment across the two rooms was visually apparent to participants. In addition, the analysis of their baseline weeks is limited in that we did not have detailed knowledge of their baseline environments, nor did we collect environmental measurements, during these weeks.
However, this study had several strengths, many of which are inherent to the study design. The highly controlled nature of the study site with regard to furnishings, layout, and environmental conditions allowed us to study the isolated impact of EC glass technology on occupant health and wellness. At the same time, the study site itself was a real-world office setting which adds to the generalizability of the results. Second, the crossover study design with randomized order of exposure allowed us to control for interpersonal variation, as each participant served as their own control, and ensured that the findings were not a result of external temporal factors such as weather conditions. Finally, while the baseline weeks were not controlled, it provided relevant and important context to the study design and findings.
This controlled crossover study found that electrochromic glass, a window technology that allows daylight access without sacrificing for glare or obstructed views, improves environmental satisfaction, physical health and emotional wellbeing of occupant—all of which are key drivers of performance. A physical workplace environment that fails to optimize for employee health can be costly for businesses, as illness-related absenteeism costs employers roughly $1,685 per employee per year in productivity (Stewart et al., 2003) and depression reduces cognitive performance 35% of the time (Lerner and Henke, 2008; Centers for Disease Control and Prevention (CDC), 2019), with even minor levels of depression having been associated with decrements in work effectiveness (Beck et al., 2011). This study adds to the literature demonstrating that optimizing for daylight and views using electrochromic glass is not only an energy efficiency measure, but a healthy building design element; these are important considerations for building owners, architects and tenants seeking to design or occupy spaces that promote the health of their people and the success of their organization.
The raw data supporting the conclusions of this article will be made available by the authors, without undue reservation.
The studies involving human participants were reviewed and approved by University of Illinois at Urbana-Champaign Institutional Review Board. The patients/participants provided their written informed consent to participate in this study.
MW, PM, BT, US, and MB contributed to the conception and design of the study and the fieldwork. MW, PM, JL, MB, and US contributed to data analysis. MW wrote the first draft of the manuscript. PM and MB wrote sections of the manuscript. All authors contributed to manuscript revision, read, and approved the submitted version.
This research was funded by View Inc. through sponsored research grants to the University of Illinois Urbana Champaign and SUNY Upstate Medical University.
MW, PM, and BT are employed by View Inc., the sponsor of the research study. Their contributions to the study included conceptualization, fieldwork, data analysis, and writing. View Inc. manufactures the electrochromic glazing system that was installed in the EC Glass condition.
The remaining authors declare that the research was conducted in the absence of any commercial or financial relationships that could be construed as a potential conflict of interest.
All claims expressed in this article are solely those of the authors and do not necessarily represent those of their affiliated organizations, or those of the publisher, the editors and the reviewers. Any product that may be evaluated in this article, or claim that may be made by its manufacturer, is not guaranteed or endorsed by the publisher.
The authors would like to thank the following individuals for their contributions: Lauren Schuyler, Bobby Koo, Galen Burrell, Ranojoy Dutta, and Rob Guglielmetti (View Inc.) for assistance with recruitment, fieldwork, and environmental sampling.
Allen, J. G., MacNaughton, P., Satish, U., Santanam, S., Vallarino, J., and Spengler, J. D. (2016). Associations of cognitive function scores with carbon dioxide, ventilation, and volatile organic compound exposures in office workers: a controlled exposure study of green and conventional office environments. Environ. Health Perspect. 124, 805–812. doi: 10.1289/ehp.1510037
American Optometric Association (2020). Computer Vision Syndrome. Available online at: https://www.aoa.org/patients-and-public/caring-for-your-vision/protecting-your-vision/computer-vision-syndrome (accessed May 21, 2020).
Aries, M. B., Aarts, P. J., and van Hoof, J. (2013). Daylight and health: A review of the evidence and consequences for the built environment. Light. Res. Technol. 47, 6–27. doi: 10.1177/1477153513509258
Beacham, A. O., Janosy, N., Brainard, A., and Reese, J. (2020). A brief evidence-based intervention to enhance workplace well-being and flourishing in health care professionals: feasibility and pilot outcomes. J. Well. 2, 1–7. doi: 10.18297/jwellness/vol2/iss1/7
Beck, A., Crain, A. L., Solberg, L. I., Unutzer, J., Glasgow, R. E., Maciosek, M. V., et al. (2011). Severity of depression and magnitude of productivity loss. Ann. Fam. Med. 6, 305–311. doi: 10.1370/afm.1260
Boubekri, M., Lee, J., MacNaughton, P., Woo, M., Schuyler, L., Tinianov, B., et al. (2020). The impact of optimized daylight and views on the sleep duration and cognitive performance of office workers. Int. J. Environ. Res. Public Health 17:3219. doi: 10.3390/ijerph17093219
Centers for Disease Control Prevention (CDC) (2019). Mental Health in the Workplace. Availabl online at: https://www.cdc.gov/workplacehealthpromotion/tools-resources/workplace-health/mental-health/index.html (accessed May 30, 2020)
Choi, J.-H., Loftness, V., Nou, D., Tinianov, B., and Yeom, D. (2020). Multi-season assessment of occupant responses to manual shading and dynamic glass in a workplace environment. Energies 13:60. doi: 10.3390/en13010060
Cowling, I., Coyne, S., and Bradley, G. (1990). Light in Brisbane Office Buildings: A Survey. Brisbane: Queensland University of Technology, Centre for Medical and Health Physics.
de Brito, J. N., Pope, Z. C., Mitchell, N. R., Schneider, I. E., Larson, J. M., Horton, T. H., et al. (2019). Changes in psychological and cognitive outcomes after green versus suburban walking: a pilot crossover study. Int. J. Environ. Res. Public Health 16:2894. doi: 10.3390/ijerph16162894
Edwards, L., and Torcellini, P. (2002). A Literature Review of the Effects Of natural Light On Building Occupants. Golden, Colorado: National renewable Energy Laboratory.
Hedge, A., and Nou, D. (2018). Worker reactions to electrochromic and low e glass office windows. Ergon. Int. J. 2:166. doi: 10.23880/EOIJ-16000166
Hopkinson, R. (1971). Glare from windows—Using the glare index in daylighting design. Constr. Res. Develop. J. 3, 23–28.
Howells, A., Ivtzan, I., and Eiroa-Orosa, F. J. (2014). Putting the 'app' in happiness: A randomised controlled trial of a smartphone-based mindfulness intervention to enhance wellbeing. J. Happiness Stud. 17, 163–185. doi: 10.1007/s10902-014-9589-1
Howland, R. H. (2009). Somatic therapies for seasonal affective disorders. J. Psychosoc. Nurs. Mental Health Therap. 47:07. doi: 10.3928/02793695-20090101-07
Klepeis, N. E., Nelson, W. C., Ott, W. R., Robinson, J. P., Tsang, A. M., Switzer, P., et al. (2001). The National Human Activity Pattern Survey (NHAPS): a resource for assessing exposure to environmental pollutants. J. Expo. Anal. Environ. Epidemiol. 11, 231–252. doi: 10.1038/sj.jea.7500165
Ko, W., Schiavon, S., Zhang, H., Graham, L. T., Bragre, G., Mauss, I., et al. (2020). The impact of a view from a window on thermal comfort, emotion, and cognitive performance. Build. Environ. 175:106779. doi: 10.1016/j.buildenv.2020.106779
Lerner, D., and Henke, R. M. (2008). what does research tell us about depression, job performance, and work productivity? J. Occupat. Environ. Med. 50, 401–410. doi: 10.1097/JOM.0b013e31816bae50
Matheson, G. J., Schain, M., Almeida, R., Lundberg, J., Cselenyi, Z., Borg, J., et al. (2015). Diurnal and seasonal variation of the brain serotonin system in healthy male subjects. Neuroimage 112, 225–231. doi: 10.1016/j.neuroimage.2015.03.007
Narasimham, L., Nagarathna, R., and Nagendra, H. R. (2011). Effect of integrated yogic practices on positive and negative emotions in healthy adults. Int. J. Yoga 4, 13–19. doi: 10.4103/0973-6131.78174
Nezamdoost, A., and Van Den Wymelenberg, K. (2017). “Blindswitch 2017: proposing a new manual blind control algorithm for daylight and energy simulation,” in 20117 IES Annual Conference Proceedings. Portland, OR: Illuminating Engineering Society.
Paul, K. N., Saafir, T. B., and Tosini, G. (2009). The role of retinal photoreceptors in the regulation of circadian rhythms. Rev. Endocr. Metabol. Disord. 10, 271–278. doi: 10.1007/s11154-009-9120-x
Schroeder, S. A. (2007). We can do better—improving the health of the American people. N. Eng. J. Med. 357, 1221–1228. doi: 10.1056/NEJMsa073350
Simonson, E., and Brozek, J. (1948). Effects of illumination level on visual performance and fatigue. J. Opt. Soc. Am. 38, 384–387. doi: 10.1364/JOSA.38.000384
Singh, A., Syal, M., Grady, S. C., and Korkmaz, S. (2010). Effects of green buildings on employee health and productivity. Am. J. Public Health 100, 1665–1668. doi: 10.2105/AJPH.2009.180687
Stewart, W. F., Ricci, J. A., Chee, E., and Morganstein, D. (2003). Lost productive work time costs from health conditions in the United States: results from the American productivity audit. J. Occup. Environ. Med. 45, 1234–1246. doi: 10.1097/01.jom.0000099999.27348.78
Stokes, D., and Biggs, S. (2014). “The dominance of the visual,” in Perception and its Modalities (Oxford: Oxford University Press), 350–378.
Tähkämö, L., Partonen, T., and Pesonen, A. (2018). Systematic review of light exposure impact on human circadian rhythm. Chronobiol. Int. 36, 151–170. doi: 10.1080/07420528.2018.1527773
Wang, N., and Boubekri, M. (2011). Design recommendations based on cognitive, mood, and preference assessments in a sunlit workplace. Light. Res. Technol. 43, 55–72. doi: 10.1177/1477153510370807
Watson, D., Clark, L. A., and Tellegen, A. (1988). Development and validation of the brief measures of positive and negative affect: the PANAS scales. J. Pers. Soc. Psychol. 54, 1063–1070. doi: 10.1037/0022-3514.54.6.1063
Wilkins, A. J., Nimmo-Smith, I., Slater, A. I., and Bedocs, L. (1989). Fluorescent lighting, headaches and eyestrain. Light. Res. Technol. 21, 11–18. doi: 10.1177/096032718902100102
Keywords: daylight, views, electrochromic glass, blinds, eyestrain, health, wellbeing
Citation: Woo M, MacNaughton P, Lee J, Tinianov B, Satish U and Boubekri M (2021) Access to Daylight and Views Improves Physical and Emotional Wellbeing of Office Workers: A Crossover Study. Front. Sustain. Cities 3:690055. doi: 10.3389/frsc.2021.690055
Received: 02 April 2021; Accepted: 11 August 2021;
Published: 08 September 2021.
Edited by:
Thomas Krafft, Maastricht University, NetherlandsReviewed by:
Zhonghua Gou, Wuhan University, ChinaCopyright © 2021 Woo, MacNaughton, Lee, Tinianov, Satish and Boubekri. This is an open-access article distributed under the terms of the Creative Commons Attribution License (CC BY). The use, distribution or reproduction in other forums is permitted, provided the original author(s) and the copyright owner(s) are credited and that the original publication in this journal is cited, in accordance with accepted academic practice. No use, distribution or reproduction is permitted which does not comply with these terms.
*Correspondence: May Woo, bWF5Lndvb0B2aWV3LmNvbQ==
Disclaimer: All claims expressed in this article are solely those of the authors and do not necessarily represent those of their affiliated organizations, or those of the publisher, the editors and the reviewers. Any product that may be evaluated in this article or claim that may be made by its manufacturer is not guaranteed or endorsed by the publisher.
Research integrity at Frontiers
Learn more about the work of our research integrity team to safeguard the quality of each article we publish.