 Madeleine Seatle
 Lauren Stanislaw
 Robert Xu
 Madeleine McPherson
95% of researchers rate our articles as excellent or good
Learn more about the work of our research integrity team to safeguard the quality of each article we publish.
Find out more
ORIGINAL RESEARCH article
Front. Sustain. Cities , 03 November 2021
Sec. Urban Energy End-Use
Volume 3 - 2021 | https://doi.org/10.3389/frsc.2021.674848
This article is part of the Research Topic Positive Energy Districts: Transforming Urban Areas into High Efficiency Districts with Local Renewable Generation and Storage View all 10 articles
In Canada, the majority of urban energy demand services the transportation or building sectors, primarily with non-renewable energy sources including gasoline and natural gas. As a result, these two sectors account for 70% of urban greenhouse gas (GHG) emissions. The objective of this paper is to explore the potential for co-benefits when simultaneously electrifying transportation and building demand sectors while expanding variable renewable energy (VRE) production. The investigation uses a novel integrated framework of the transportation, building, and electricity sectors to represent the operational implications of demand side flexibility on both the demand and supply side of the energy system. This original approach allows for very fine temporal and spatial resolution within models, while still performing a multi-sector analysis. First, the activity-based transportation model produces passenger travel demand profiles, allowing for investigation of potential electricity demand and demand response from electric vehicles with high spatial and temporal resolution. Second, the archetype-based building model predicts electricity demand of the residential building sector, allowing for investigation into demand-side management strategies such as load-shifting, building retrofits, and changes in appliance technology. Third, the electricity system production cost dispatch model is used to model the operations of Regina's electricity grid and has a spatial resolution capable of assessing individual and connected positive energy districts as well as VRE integration. Through linking of these three models, the effects of consumer flexibility in transportation and building energy demand are explored, especially in the context of introducing much needed flexibility for large-scale VRE integration. A utility-controlled demand response (DR) strategy is explored as means for Regina to reach their renewable target, along with battery storage. Various pathways to Regina's target are considered, based on the various proposed scopes of the target. The results show that Regina can meet their renewable target with large-scale rooftop solar and wind capacity. DR strategies are marginally effective in aiding toward the renewable target, but, when implemented in conjunction with battery storage, is able to get Regina to within 1% of their renewable target.
In Canada, end-use energy demand in the transportation and building sectors relies heavily on carbon-intensive sources. These sectors, which are collectively responsible for ~40% of Canada's greenhouse gas (GHG) emissions, mainly use motor gasoline and natural gas for fuel and heating (Natural Resources Canada, 2019). Some cities in North America have recognized this and committed to becoming renewable cities (Zuehlke, 2017; Eaton and Enoch, 2020). In 2018, the City Council of Regina, Saskatchewan made this decision as well, committing to using 100% renewable energy by 2050 (Tink and Folk, 2019). Though the decision was unanimous, City Council lacked clarity on the scope of the commitment, as well as an official plan for how to achieve it. More recently, three novel definitions of scope have been suggested by Bardutz and Dolter (2020):
• Scope 1 would encompass electricity used only by City owned buildings and operations;
• Scope 2 would encompass all electricity used by the City of Regina, including private residents; and
• Scope 3 would encompass all energy used by the City of Regina.
City Council has not yet finalized the scope of the commitment (Peterson, 2020). However, in October 2020, Regina City Council decided to move forwards with the development of an Energy and Sustainability Framework and Action Plan. This would include “details on how City and municipal wide action plans, with specific and aggressive timelines, could forward the commitment of a transition toward a 100% community-wide renewable Regina by 2050.” This suggests the city is interested in investigating pathways to reaching the Scope 3 target (Regina City Council, 2020). Meeting Regina's target would require increased use of renewable energy, likely including variable renewable energy (VRE) such as wind and solar. When introducing uncertainty and variability inherent to VRE generation on the supply side, flexibility on the demand side becomes a necessary ingredient to maintaining cost-effective grid reliability. Without demand side flexibility, integration of large-scale VRE generation can be challenging and result in undesirable outcomes, such as inability to meet demand and high curtailment rates (McPherson et al., 2018). Electrification, or a shift away from traditional fuel sources toward electricity powered technologies, can provide demand side flexibility when combined with management strategies (Mathiesen et al., 2015). With proper load management, technologies such as electric vehicles (EVs), electric space heating, and other electric appliances are able to time-shift their demand to match spikes in VRE generation (Dennis, 2015). If carefully designed and managed, there could be a positive feedback loop when electrification and VRE integration are implemented together: low-carbon on the supply side could power the decarbonization of demand sectors, while responsive loads could provide much needed flexibility to facilitate VRE integration.
Demand response (DR) programs can operationalize this positive feedback loop by changing consumers' electricity consumption patterns (McPherson and Stoll, 2020). This can be done through user-controlled electricity reduction, typically for industrial-scale electricity consumers (Alberta Electric System Operator, 2019; SaskPower, 2019; Hydro-Québec, 2020); time-of-use electricity pricing (Ontario Energy Board, 2021); or grid control of appliances, typically with financial incentives (Holy Cross Energy, 2016).
Regina is an ideal candidate for coupling electrification with VRE integration for several reasons: it currently relies on carbon-intensive electricity generation but has immense potential for electrification and exceptional renewable resources. Saskatchewan has the second-highest emitting electricity grid in Canada, due to its reliance on coal generation (Canada Energy Regulator, 2020a,b). Meanwhile, the EV penetration in Saskatchewan is near zero, while electric space and water heating are used in <10% of households (Natural Resources Canada, 2020). Electrification of the transportation and building sectors powered by renewable generation is possible due to Regina's location in one of the highest solar (Figure 1A) and wind (Figure 1B) potential areas in Canada (Canada Energy Regulator, 2020a).
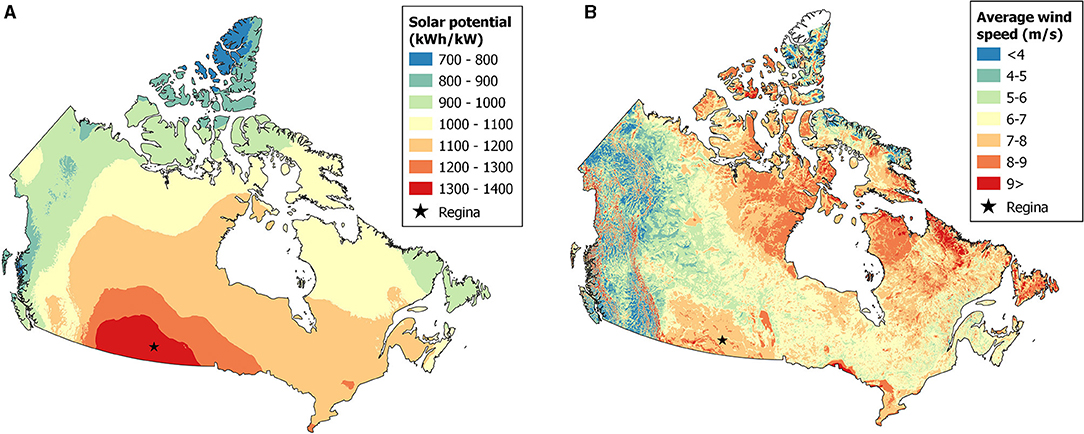
Figure 1. (A) Solar potential map (Government of Canada et al., 2020) (left) and (B) wind potential map (Global Wind Atlas, 2019) (right).
To investigate how a city such as Regina might meet an energy target such as their goal to be 100% renewable by 2050, it was necessary to have control over the types and scopes of policies that are able to be modeled; this is done by employing a novel integrated modeling paradigm. Energy transition models in Canada typically take a macroeconomic approach (Vaillancourt et al., 2014), which have simplistic specifications for energy demand, as well as being spatially and temporally aggregate. A general tendency within the formulation of macroeconomic models is the focus on the decision-making process of individual actors, thus the trade-off in the detail of energy, spatial, and temporal data. However, these simplifications and aggregations mean that highly variable, spatially, or temporally, constraints are not able to be assessed at the level of detail needed. Within city-scale energy modeling, there are models that are able to represent a city at a high spatial resolution, but do not provide the temporal resolution necessary to accurately model an electricity system with high VRE integration (Zuehlke, 2017; Crockett et al., 2019). There are also load models, which can model at the adequate temporal resolution for electricity systems but lack the ability to model the electricity system at the same spatial resolution (Salama et al., 2019). On the other end of the spectrum are micro-grid models (HOMER Energy, 2021), which are typically restricted in the size of the system they can model, thus making them unable to model the electricity grid for an entire city.
To capitalize on the strengths of multiple models, model linkage is a common practice, especially between load models and operational models. Within this space, there have been studies showing the value in model linkage between two sectors. Szinai et al. (2020) found that the linkage of a transportation model and an electricity system model was able to provide insights on the operational implications of the increased EV penetration and VRE utilization. It was found that on a solar dominant electricity grid, “smart” charging (DR program used to control charging time to provide the grid the most benefit) can reduce VRE curtailment and reduce grid operating costs (compared to unmanaged EV charging). Additionally, Deane et al. (2015) found that the linkage of a building model and an electricity system model can more accurately measure the capabilities of an electricity system to manage a more highly electrified load. The linking of the models was proven to leverage the strength of each model and provide complimentary insights that would not have been seen otherwise. However, even with the proven benefit of mode linkage between two sectors, there has yet to be a model that links the transportation, building, and electricity sectors at a high enough resolution to fully assess the co-benefits of electrification and VRE integration. As all three sectors are key in meeting Regina's energy target and, more generally, Canada's deep decarbonization goals, a linkage of models between these sectors is a current gap in the research field.
This paper combines the strengths of multiple approaches via a novel integrated model of the transportation, building, and electricity sectors, with a bidirectional linkage allowing DR strategies to be modeled at high degree of temporal and spatial resolution. SILVER, an electricity system model, currently operates at a high temporal resolution and has the ability to model highly granular spatial boundaries; however, linkages with individual transportation and building models can allow for further spatial granularity while keeping SILVER's computation time reasonable.
With Regina's potential for additional VRE generation and demand side electrification, there is a broad exploration space for future configurations of its energy system. Uncertainty can be explored by changing variables such as the electrification level, VRE capacity, storage, and DR. With the novel linkage between transportation, building, and electricity system models, these variables can be explored at a high temporal and spatial resolution.
Reducing emissions related to energy use is a main objective behind Regina's renewable energy goal. Evaluating the effect of demand side electrification on emissions requires the demand side models to pass information to the electricity system model. Investigating DR based on VRE generation requires information to be passed from the electricity system model to the demand side models. VRE curtailment is an indicator of system efficiency and design because lower curtailment indicates more demand is being met by VRE. Since VRE is non-polluting, bidirectional linkage is implemented by using curtailment reduction as a proxy for emissions reduction.
Figure 2 illustrates the novel linkage process; the solid arrows represent the linkage from the building and transportation sector models to the electricity system model, while the dashed arrows represent the linkage from the electricity system model to the demand side models. Once a scenario is selected, the building and transportation models—outlined in detail in the following sections—are run concurrently and output demand load curves. These are combined with a baseline demand to represent the total electrical load for Regina, which is then input directly into the electricity model. Although these models interact with each other while running a scenario, they are decoupled and individual insights are able to be drawn from each model individually, as well as from the linked outputs.
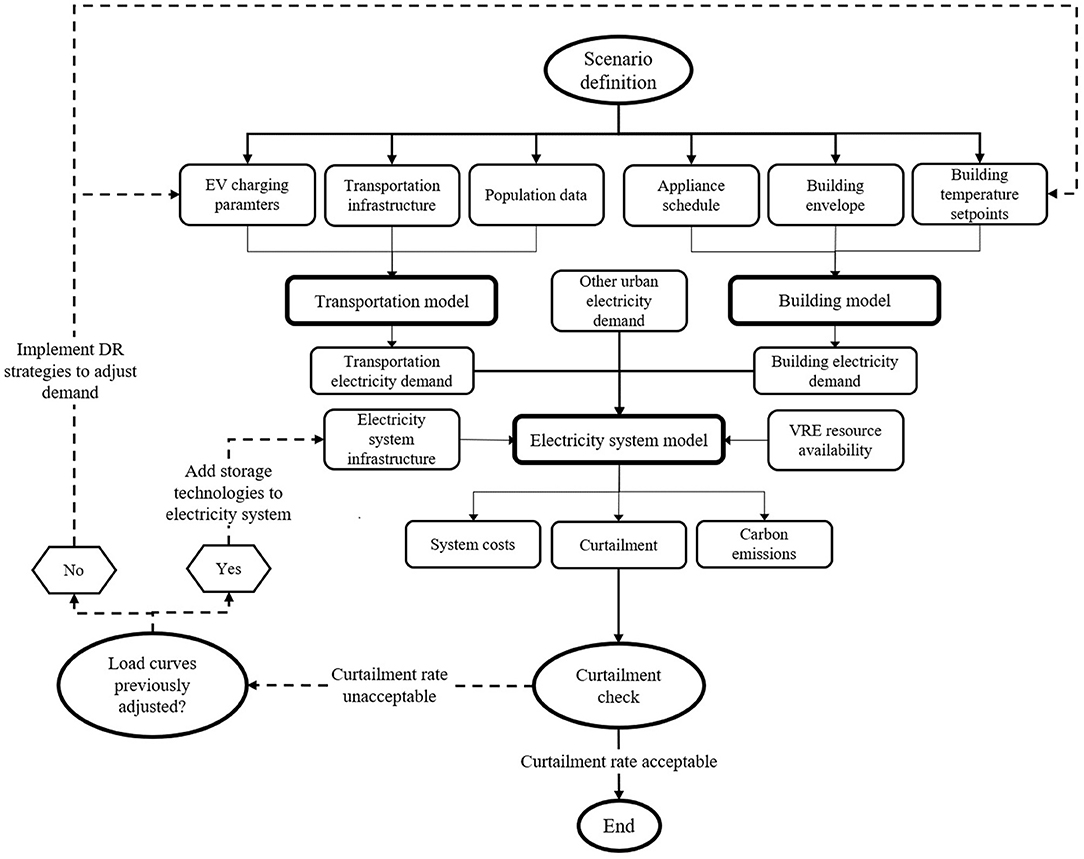
Figure 2. Bidirectional model framework with key inputs and outputs.
After the electricity model is run, the amount of VRE curtailment is assessed. DR is modeled to occur through utility control over EV charging and building temperature setpoints, allowing the utility to time-shift loads during periods of curtailment to take full advantage of VRE generation. Constraints are placed upon utility control to minimize the disruption to the customers. For example, EVs must charge if needed to get to their next destination, even if curtailment is not occurring. Similarly, the utility can only allow the temperature within a building to drop to a certain degree before allowing the heater to turn on. It is assumed that all electrified vehicles and buildings participate in DR.
The utility would decide how to allocate DR load to the building and transportation sectors; for simplicity, as it makes no difference to the overall system which sector uses electricity, every EV is charged until there is either no curtailment, or no remaining vehicles available to charge. The setpoints of all electrified buildings are then changed until there is either no curtailment, or all buildings have reached their maximum setpoint. This results in curtailment being minimized for that scenario. If the curtailment is still at unacceptable levels after the setpoints of all possible buildings have been changed, and the renewable target is not met, SILVER is rerun with storage technologies added.
To predict EV charging, the travel and charging behavior of individual vehicles are simulated. By understanding when and where individual vehicles are traveling, the spatiotemporal distribution and flexibility of EV charging can be estimated by aggregating the charging of individual vehicles.
TASHA, an activity scheduling model developed and maintained at the University of Toronto (Miller and Roorda, 2003), is used to model vehicle schedules. It is currently being used to forecast travel patterns and test policy decisions in the Greater Toronto Area (Miller et al., 2015). Selected for its ability to consider spatiotemporal and resource constraints, such as vehicle availability, TASHA is able to use this information to predict EV demand within the integrated model platform. A complete daily travel schedule is generated for each household resident in a synthetic population, but commercial and freight transportation is not considered. This and other limitations regarding the transportation model are elaborated in the Limitations section. Detailed steps for creating and calibrating a TASHA implementation are documented by the University of Toronto Travel Modelling Group (Travel Modelling Group, 2020). Specific details on the development of TASHA for the Regina case study, including input preparation and model calibration, are described in the Supplementary Information.
The data sources and processing flows for the Regina transportation and EV charging model are shown in Figure 3, where the output of TASHA is used as an input into the charging model. Without DR, EVs are assumed to charge as soon as they arrive to their destination, and this strategy is modeled for scenarios without DR. Charging is modeled by processing each vehicle's trip schedule in temporal order: when a vehicle departs from an activity, its battery level is updated based on the trip distance and depletion rate following the assumptions described in the transportation model assumptions section. The equations which describe EV charging without DR are included in the Supplementary Information.
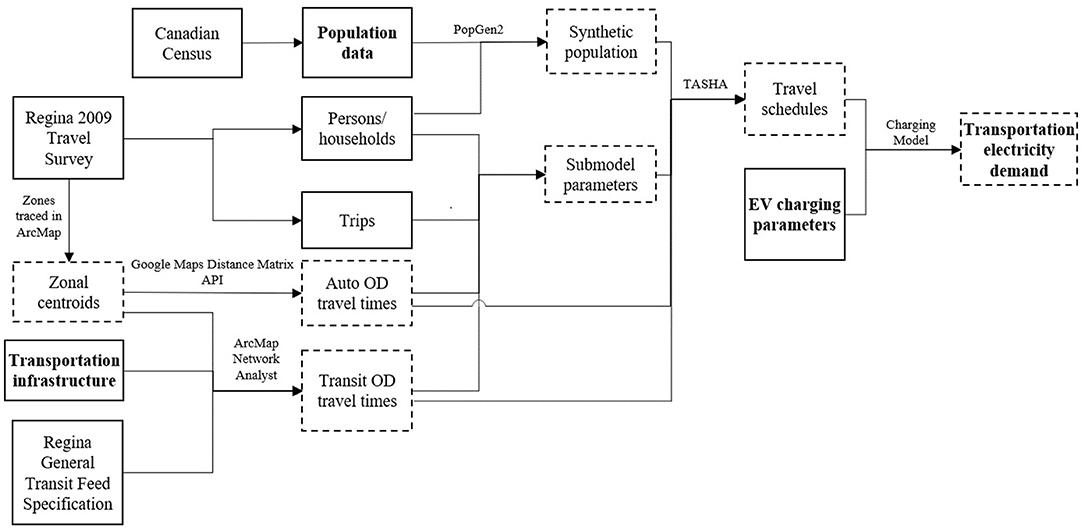
Figure 3. Transportation model processes, with solid boxes representing raw data inputs and dashes boxes representing a processed output. Note that bold text represents a direct tie-in to Figure 2.
DR implementation is modeled for EVs as utility-controlled charging (UCC), where the utility can control the charging status of individual vehicles. When DR is modeled, it is assumed that all EVs participate in DR and are required to communicate the following with the utility: time of next trip departure, desired battery state of charge at time of departure, and charging status (i.e., vehicle plugged in, vehicle charging). With UCC, participating vehicles follow the same travel schedules as with uncontrolled charging, but modify their charging behavior. Instead of charging immediately, EVs delay charging until the last possible moment such that the total energy charged during the activity is the same that would be charged without UCC. Because of this delay, the utility can charge EVs with excess renewable energy if it occurs. As previously mentioned, the VRE curtailment output from SILVER is used to guide UCC within the charging model; specifically, the utility tries to charge as many vehicles as possible (when curtailment occurs) to minimize curtailment and maximize use of VRE. Additional details on the implementation and modeling of UCC are included in the Supplementary Information.
A detailed representation of the relationship between building characteristics and the resulting energy usage is needed to investigate the effects of retrofit policies on building energy use. However, it is also necessary to keep data and computational requirements to a manageable level. Therefore, electrification of the residential building sector is modeled using an archetype-based engineering model, similar to that employed by Ballarini et al. (2014).
Under this modeling framework, heat exchange between individual buildings and their environment is calculated using EnergyPlus, a detailed thermodynamics simulator. For this, building properties relevant to heat transfer are specified, which include building shape, building size, construction materials, size and location of windows, and the living patterns of occupants (Swan and Ugursal, 2009). A large population of varied buildings are modeled by specifying these characteristics for a small number of archetypes, whose properties are representative of the population as a whole (Reinhart and Davila, 2019). Building policies are then simulated by changing specific details in each of the archetypes. For example, insulation retrofits in houses built before a specified date are modeled by changing the construction materials of the relevant archetype within the EnergyPlus simulation.
The process flows and data sources used within Regina specifically can be seen in Figure 4. Archetypes were defined based on census data for the city, and archetype annual load curves were aggregated up to a city scale by multiplying by the number of houses represented by each archetype. The simulation was then verified by visual comparison to historical load curve data. Further details on the development of the building model specifically for the Regina case study, including data sources used, specifications of each selected archetype, and technical details of the simulation, is described in the Supplementary Information.
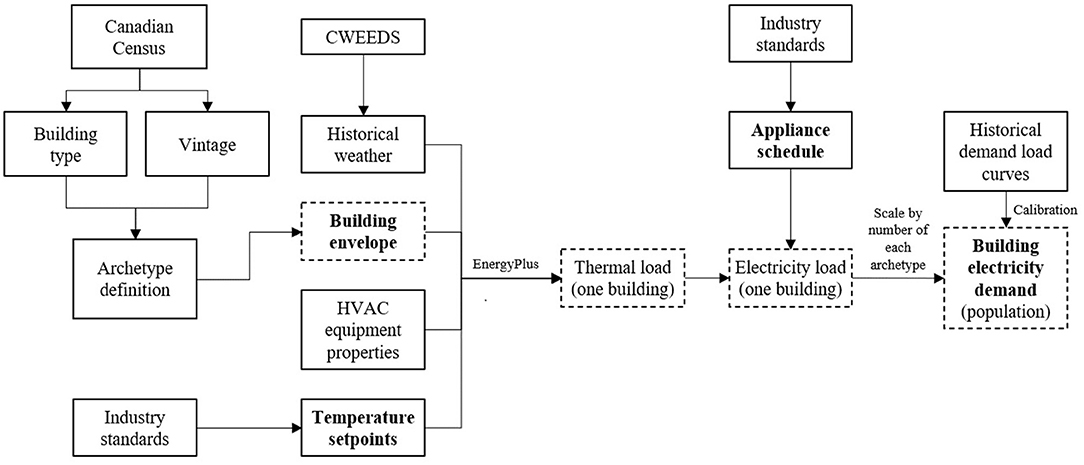
Figure 4. Building model processes, with solid boxes representing raw data inputs and dashes boxes representing a processed output. Note that bold text represents a direct tie-in to Figure 2.
DR was implemented in the model by manipulating the building setpoints for each hour based on whether VRE curtailment was occurring in that period. When the model is run without DR, all buildings are kept at a constant setpoint of 19°C for heating and 27°C for cooling, as per (SOURCE). In contrast, when DR is applied, building setpoints vary depending on if there is curtailment occurring, so that the buildings can be used as heat storage for the otherwise curtailed electricity. When curtailment is not occurring, setpoints relax to 18°C for heating and 28°C for cooling (i.e., lessening the electricity demand). During periods of curtailment, the heating and cooling setpoints change to the more restrictive values of 21°C and 26°C, respectively (i.e. increasing the electricity demand).
To effectively model a renewable city, it is crucial to develop a city-scale electricity system model. SILVER, a production-cost model (McPherson and Karney, 2017), was chosen as the electricity system model for the following reasons. First, though originally developed for analyses at the provincial level, it can also be applied at a city-scale (McPherson et al., 2018). Second, SILVER models an electricity system as defined by the user, including generation and transmission assets; generation operational constraints, costs, and carbon-intensity; VRE characteristics; and electricity demand. These inputs are then validated through transmission congestion checks, generation capacity checks, and flexibility checks before proceeding to the optimization module, which determines the least-cost dispatch of the electricity system (generation and transmission assets) needed to satisfy demand at every node and each timestep of the simulation (McPherson and Karney, 2017). Third, SILVER is conducive to DR implementation within the model linkage by synthesizing multiple load curves into one overall demand load and quantifying curtailment.
An overview of the data sources and model processes can be seen in Figure 5. In summary, the available electricity demand data came from SaskPower, the electricity distributor for most of the province of Saskatchewan; census population data came from the Canadian Census (Statistics Canada, 2017), and neighborhood boundary data came from the City of Regina (City of Regina, 2017). Boundary resolution and VRE resource analysis are discussed in detail in the Supplementary Information, while the processes within SILVER are outlined in more detail by McPherson and Karney (2017).
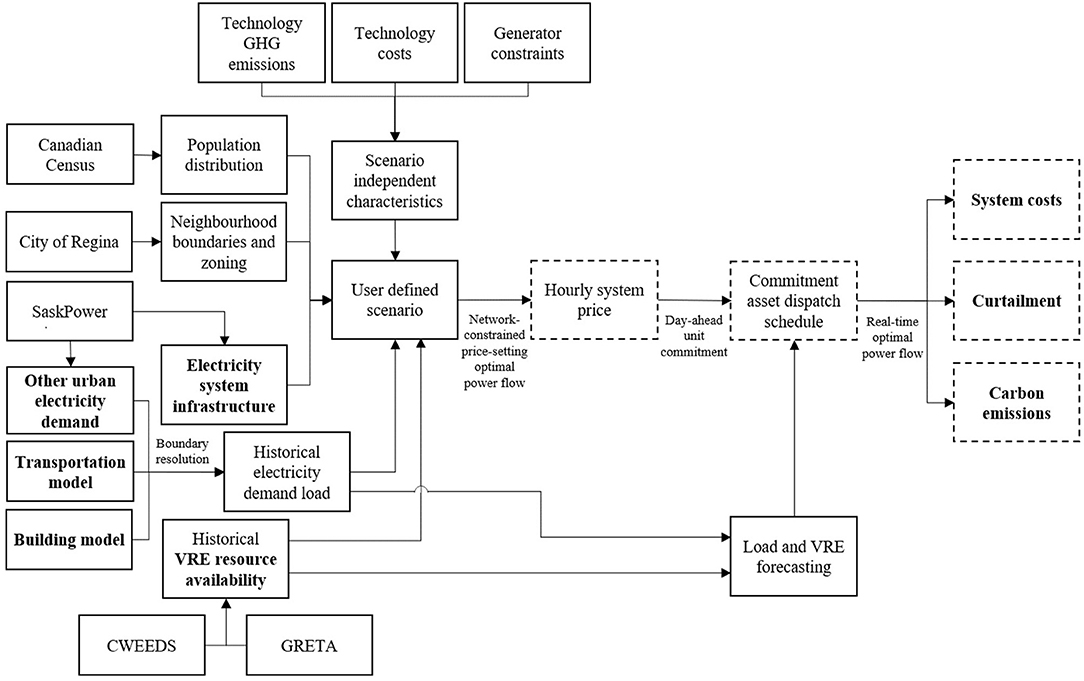
Figure 5. Electricity model processes, with solid boxes representing raw data inputs and dashes boxes representing a processed output. Note that bold text represents a direct tie-in to Figure 2.
For city-scale analysis, resolving spatial boundaries across data sources is a key priority; the high spatial resolution inherent to SILVER makes this especially important. As city-scale data is typically adopted from larger-scale data collection, there are discrepancies in spatial boundaries between data sets, as well as between the transportation and building model spatial boundaries. A detailed description of the assumption made within boundary resolution for Regina can be found in the Supplementary Information.
Due to Regina's high solar and wind potential, this analysis considers rooftop solar and wind. The hourly generation profiles are derived on a nodal level through capacity factor values. The wind capacity factor values were taken from the Global Renewable Energy Timeseries and Analysis (GRETA) online tool (McPherson et al., 2017). Due to the intricacies of solar capacity factor calculations in relation to rooftop solar and shading variabilities, the calculations were done based on local weather station data and the capacity factor procedure outlined by Masters (2004) and the GIS-work procedure outlined by Latif et al. (2012). Additionally, seasonal changes in sun position and rooftop slopes are accounted for by average annual rooftop shading factors. The related weather data came from the Canadian Weather Energy and Engineering Datasets (CWEEDS) (Environment and Climate Change Canada, 2015), while applicable GIS surface cover data came from various sources (City of Regina, 2017; Natural Resources Canada, 2020).
Regina currently draws its power entirely from the SaskPower grid, which is heavily dependent on coal (30% of generation capacity) and natural gas (43% of generation capacity) (SaskPower, 2021). The electricity demand on the grid is primarily commercial, industrial, and residential plug-load, with very little residential heating being electrified, nor significant EV load. With the current grid composition, electrifying residential building and transportation loads would lead to an increase in overall emissions. However, with an increasing share of VRE generation, the effects of electrification would allow for an overall reduction in city-wide emissions.
Utilizing the novel methodology to explore the simultaneous implementation of VRE integration and electrification is explored. In order to assess the feasibility of Regina's energy target, 10 different scenarios were developed (Table 1). Each scenario is run in three stages, where curtailment and system cost are evaluated at each stage: Stage A models the naive load curve as a result of the transportation and building electrification scenarios with renewable generation infrastructure added; Stage B adjusts the transportation and building demand by enacting DR strategies when renewable energy would otherwise be curtailed; and Stage C adds storage technologies, reducing curtailment while still maintaining high VRE implementation on the grid. Note that Stage B has the same parameters as Stage A, but a different model architecture.
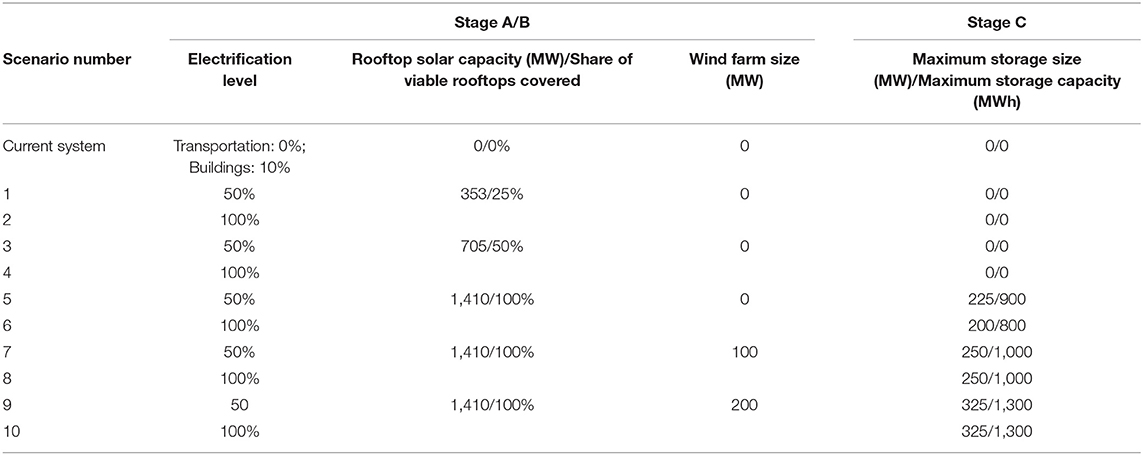
Table 1. Scenario parameters.
As future electrification rates are highly uncertain, electrification levels were chosen to explore as broad a space as possible to align with Regina's ambitious decarbonization goal. Levels of 50 and 100% electrification balance the computational burden of running multiple scenarios with representing pathways to Regina's target.
Electrification of the transportation sector focuses on the switch from combustion engines to battery EVs, which run exclusively on electricity. It should be noted that electrification of the building sector refers to both replacing natural gas-powered furnaces with electric ground source heat pumps (GSHPs), and upgrading window, wall, and roof insulation levels to match the highest tier of the BC Step Code (Robinson, 2018). The insulation upgrades support electrification by reducing the energy demand of affected buildings, making it more feasible for electrification to be powered by renewable sources.
Within the scenarios, transportation and building electrification levels are assumed to change concurrently1; an electrification level of 50%, as in Scenario 1, means that 50% of households use exclusively EVs, 50% of households switch to GSHP, and 50% of households increase their level of insulation. For simplicity, it is assumed that policies for these variables would be implemented at similar times, resulting in similar electrification levels across sectors. This allows for a greater focus on how electrification as a whole will affect the electricity grid, rather than the effect of specific sectors.
Regardless of the adoption level, there are several assumptions in the EV charging model which remain constant across scenarios:
• EVs charge at every destination (home, work, shopping, and other activities) and have a battery capacity of 40 kWh;
• EV adoption occurs uniformly distributed across Regina households;
• Charging occurs with a power of 2 kW and the battery depletion rate is a function of external temperature;
• Temperature is sampled monthly using average temperatures from (Environment Canada, 2020); and
• Battery depletion rate was estimated using the online tool provided by Geotab (2021), where a 2019 Nissan Leaf with a 40 kWh battery is assumed.
Building model parameters varied slightly based on the adoption level. For the fully electrified scenario, all homes were assumed to receive both GSHP and insulation upgrades. For the 50% electrification scenario, all buildings received one of the two upgrades, and each upgrade was performed on exactly half of the building stock. Upgrades were strategically distributed to reduce energy consumption as much as possible, resulting in the following distribution among the types of buildings modeled:
• Buildings constructed before 1975, and a portion of those constructed in 1975, received insulation upgrades, as they are assumed to have poorer insulation.
• Buildings constructed after 1975, and the remaining portion of those constructed in 1975, received GSHP, as they are assumed to consume more energy due to their larger floor area.
Rooftop solar integration is reflective of both residential and commercial implementation and is based on the percentage of usable2 rooftop space covered with photovoltaic (PV) panels. Rooftop solar integration levels were taken based on recent residential opinion survey conducted in Regina (Bardutz and Dolter, 2020):
• Twenty five percent of residents are willing and able to install rooftop solar without any financial incentives;
• Fifty percent of residents are willing and able to install rooftop solar with financial incentives;
• And 100% rooftop solar integration, though not directly taken from the survey data, relates to a best-case scenario of residents willing and able to install rooftop solar.
Though this data reflects only residential interest in rooftop solar, it is assumed to be consistent across commercial and industrial building owners as well.
Wind farms are assumed to be installed outside city limits, for which there is significant support (Bardutz and Dolter, 2020). A wind farm is assumed to be introduced into the generation mix in conjunction with 100% rooftop solar implementation scenarios. This was done so that scenarios with a wind farm could be directly compared. Currently, the largest wind farm in Saskatchewan3 is 200 MW, which was taken as the upper bound for the modeled wind farm. To explore the space further, scenarios were also modeled with a 100 MW wind farm.
Storage was introduced to six scenarios (Scenarios 5 through 10) that were identified as having the potential to meet the renewable target if curtailment was decreased further than found in the previous stage. This was based on the amount of curtailment and progress toward the target renewable usage after the DR strategy was implemented (further discussion can be found in discussion). The storage technology was assumed to be lithium-ion batteries with a 4-h discharge duration. The maximum capacity of the storage technology (equivalent to the storage size multiplied by the duration of the battery) was assumed to equal the maximum curtailment within each scenario.
Electrification of private vehicles and building heating, DR, and storage each have different effects on system cost, VRE curtailment, and the ability of Regina to meet its renewable energy target. In this section, detailed results from all three stages are discussed. Figures that are referred to across subsections are various generation mixes (Figure 6) and a comparison of annual average curtailment levels for each scenario in each stage (Figure 7).
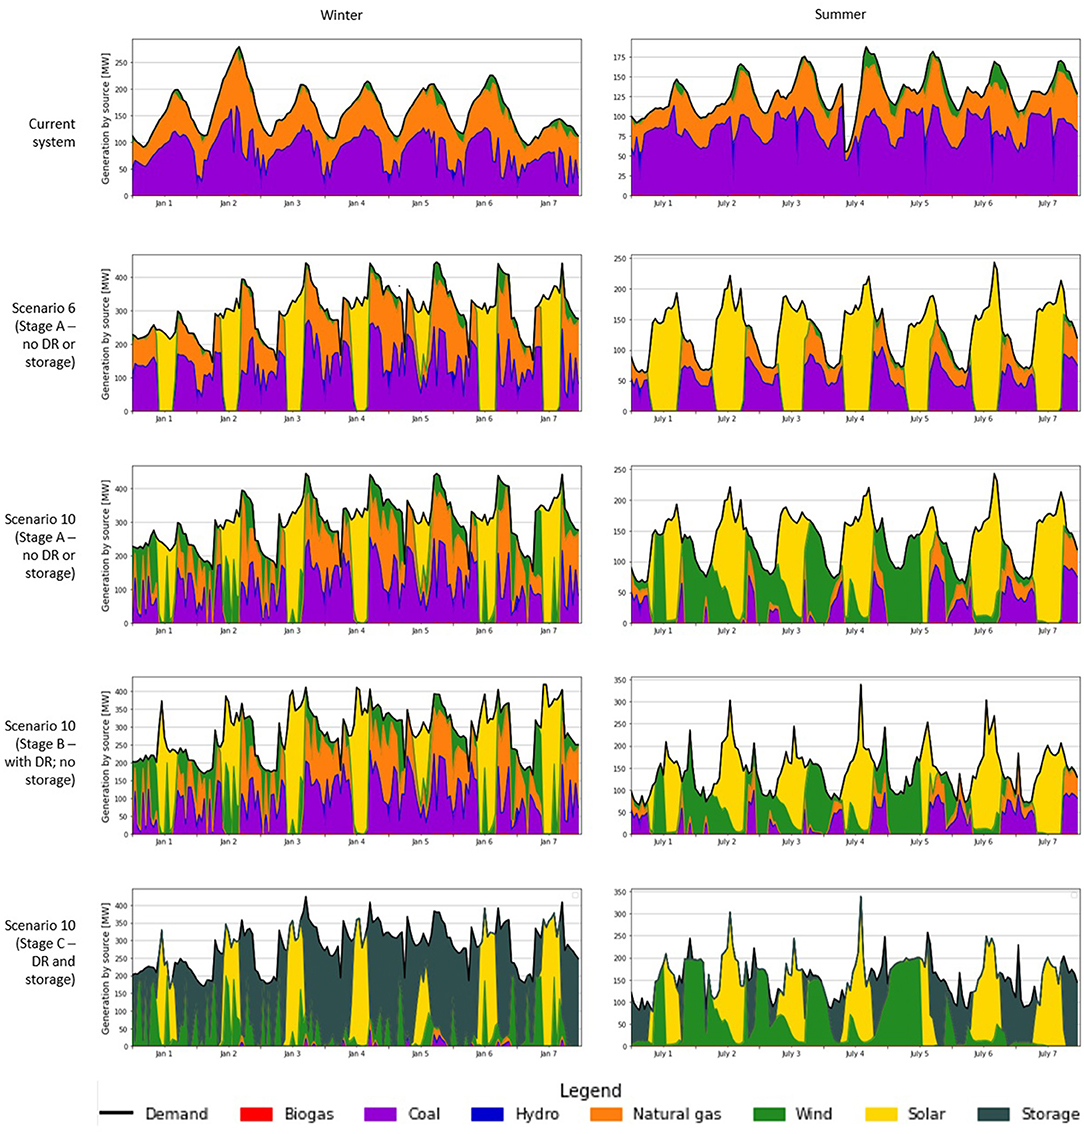
Figure 6. Generation mixes of various scenarios. Winter generation is seen from January 1–7 (left column) while summer generation is seen from July 1–7 (right column). As previously outlined, Scenario 6 has added rooftop solar capacity, and Scenario 10 has added rooftop solar and wind capacity.
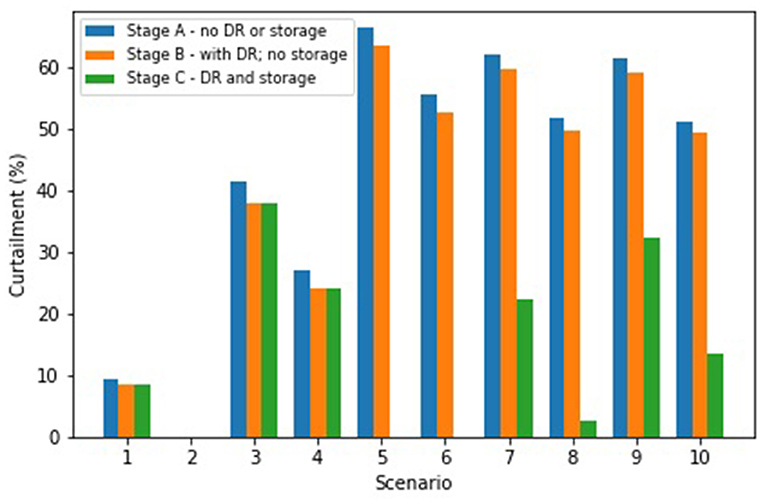
Figure 7. Annual average curtailment value across all scenarios and stages. Curtailment in Stage C of Scenarios 1 through 4 is identical to Stage B, as there is no storage capacity added to the system. Note that if scenarios appear to not have values for a particular stage it is due to that value being zero or near zero.
Scenarios are evaluated on two key criteria: levelized cost of electricity (LCOE) (International Renewable Energy Agency, 2020; Lazard, 2020) and ability to meet Regina's renewable target (Figure 8). Additionally, as these scenarios are looking ahead to 2050, when Regina's target is set to be achieved, the cost is also evaluated based on a carbon tax of 170 CAD, as per the federal carbon tax guidelines (Canada Energy Regulator, 2020b; Tasker, 2020). It should be noted that LCOE is only reflective of the cost of electricity and future analysis should include comparison to the cost of other energy sources. The costs reported here may not be representative of overall energy costs in any given scenario, as discussed further in current limitations.
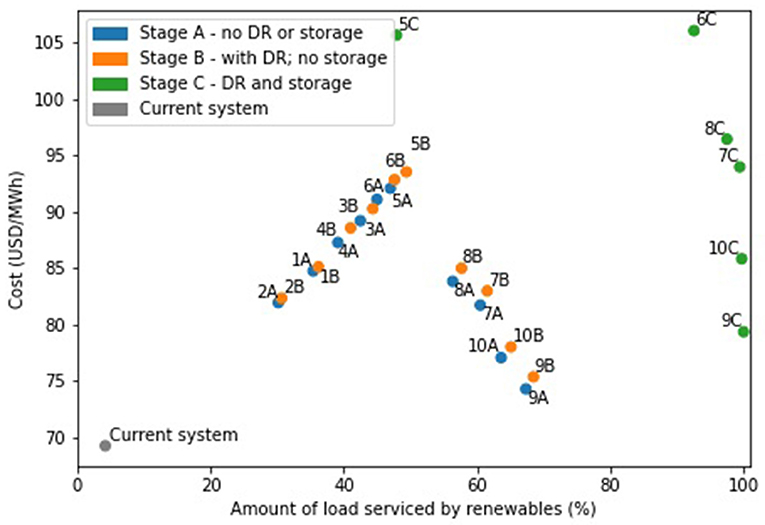
Figure 8. Modeled cost of electricity system per unit energy compared to ability to meet Regina's renewable target with a carbon tax of 170 CAD. As previously outlined, odd numbered scenarios have 50% electrification levels; even numbered scenarios have 100% electrification levels; and Scenarios 7 through 10 have additional wind capacity along with rooftop solar.
Electrification increases the annual peak demand by almost 50%, though the effects on overall electricity consumption varies by electrification level. An electrification level of 50%, along with building retrofits to make consumption more efficient, was found to decrease consumption by almost 18%, while an electrification level of 100% was found to increase consumption by 15% (Table 2). Buildings were shown to be the more significant source of the changes in consumption, with transportation contributing under 5% of the total for both 50 and 100% EV penetrations.
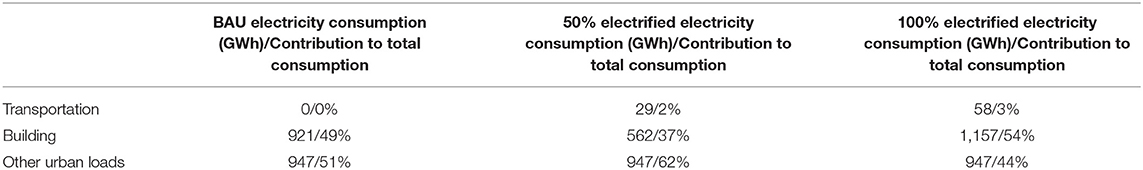
Table 2. Modeled annual electricity consumption by sector based on electrified share of personal vehicles and residential building heating.
The addition of rooftop solar allows Regina to be powered entirely by solar generation for periods in the summer (comparing Figure 6: Current system to Figure 6: Scenario 6A). Further, the deployment of wind allows for renewables to contribute to the generation mix at night (Figure 6: Scenario 10A), which is especially important in the winter electrification contributes significantly to overnight demand.
However, without DR or storage, Regina is unable to meet their target of 100% renewable energy across for the entire energy system. Only 65% of the energy demand is sourced from renewable energy, even when 100% of roofs are covered with solar PV (1,410 MW) and 200 MW of wind is installed, when DR and storage do not contribute to the grid balancing. In this scenario, 60% of the renewable energy is curtailed, which not only impedes reaching the target, but also indicates that the system is being operated inefficiently. Compared with the current system (composed of primarily not electrified loads), electrification of private vehicles and building heating and cooling results in a 7–33% higher LCOE (Figure 8). Assuming an LCOE of $40/MWh for wind and $126.5/MWh for rooftop solar, the addition of a wind farm tends to decrease the overall LCOE, as seen in the clustering of Scenarios 7A, 8A, 9A, and 10A in Figure 8.
As expected, curtailment in Stage A scenarios, when DR and storage are excluded from the system mix, is the highest. Curtailment peaks at almost 70% in Scenario 5A (refer to Figure 7) when there is 50% electrification and 100% rooftop solar penetration. In general, since electricity demand is higher in 100% electrification than 50% electrification scenarios, curtailment decreases between 9 and 15%, across all VRE penetrations. Without DR, EV charging demand follows a similar pattern day to day, when holding temperature constant. Lower efficiency in the winter results in longer charging events—because EVs arrive at their destinations with more depleted batteries than in the summer—and therefore a larger peak demand, as shown in Figure 9A. Temperature dependent efficiency was the only seasonal variation accounted for, but different seasonal travel patterns may also affect charging patterns and were not investigated. By disaggregating the EV charging curve by load type, it is seen that charging at work and home charging are responsible for the two peaks observed in EV charging (Figure 9B). However, it was assumed in this work that EV charging could take place at any location (i.e., work, home, shopping areas, etc.)—which would require widespread charging availability throughout the network. Such a scenario would result in infrastructure costs that were not quantified in this work.
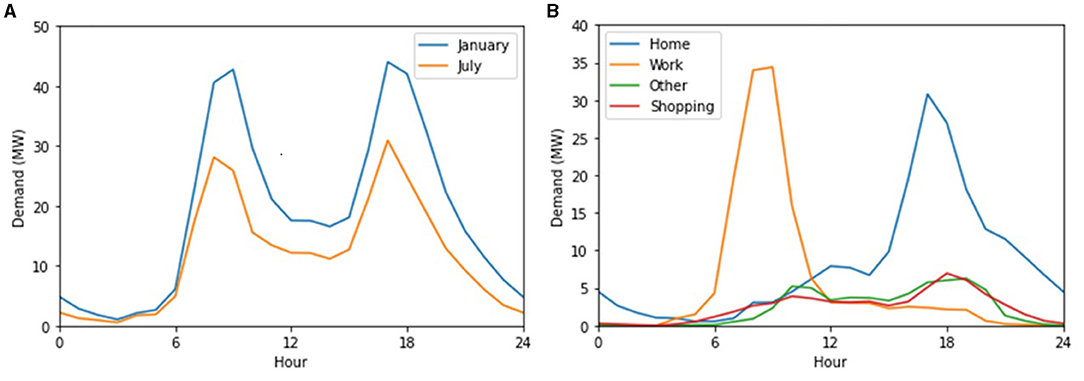
Figure 9. (A) EV charging demand load at 50% EV penetration compared seasonally (left) and (B) winter EV charging demand load for 50% EV penetration disaggregated by trip activity (right).
The building model also uses markedly more energy in the winter than the summer. As seen by comparing Figures 10A,B, winter peak loads are almost three times higher than summer peaks, while winter troughs are approximately equal to summer peaks. The magnitude of this seasonal variation underscores that Regina's climate is heavily heating-dominated, and that it is important to choose envelope retrofits that help retain heat and HVAC systems that are optimized for efficient heating.
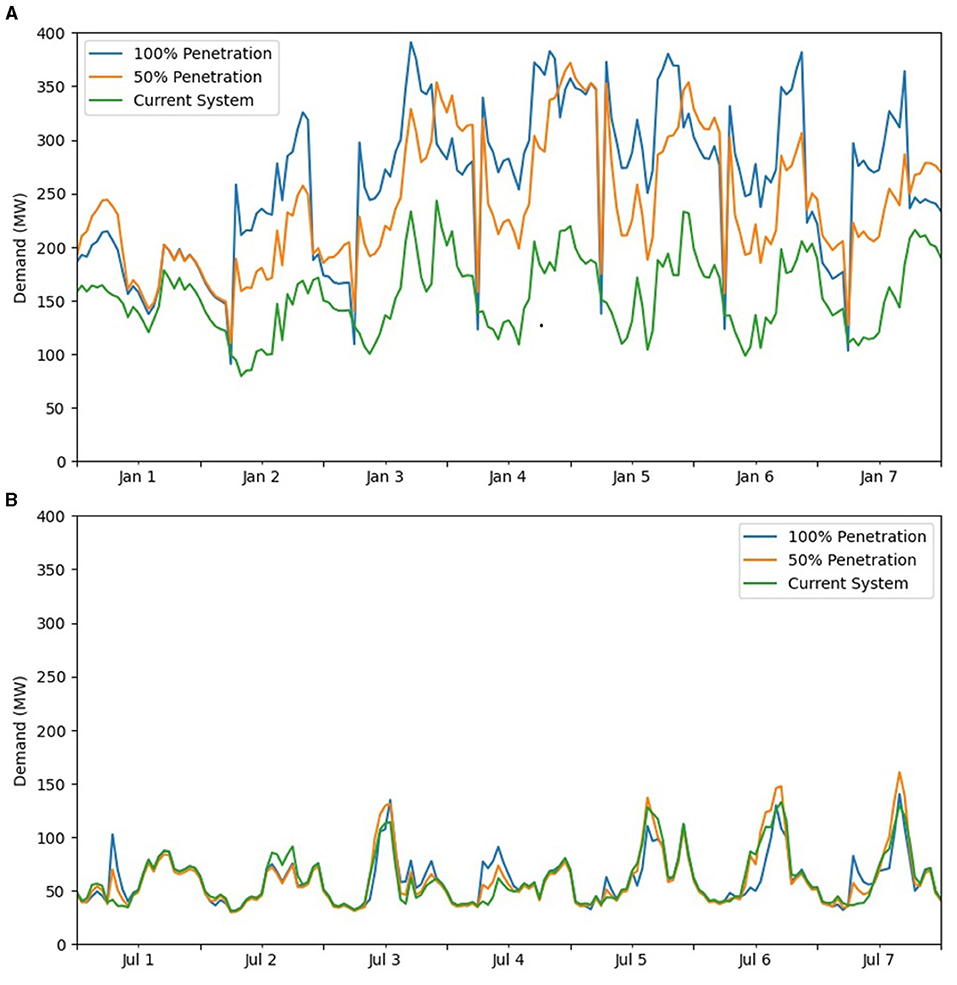
Figure 10. Building demand load in 50% and 100% penetration scenarios in (A) winter (top) and (B) summer (bottom).
Comparison between winter load curves in the 50% penetration scenario and the 100% penetration scenario (Figure 10A) shows that the two display a different temporal shape. In the 50% scenario, some of the electrified homes are powered by less-efficient electric heating systems, which are left over from the current system. This results in the 100% penetration scenario only using 20% more electricity over the course of the year, despite having twice as many homes contributing to the thermal load curve. From that, it can be seen that replacing gas-powered HVAC systems with more efficient systems can have a significant impact in terms of energy savings.
Implementing DR had a noticeable but small effect on VRE curtailment, which allowed for an increase in the percent of load serviced by renewable energy, as shown in Figure 8. Seen in Figure 7, the DR results in only a 1–3% reduction in curtailment. This is largely due to the dual effect of decreased energy requirements and increased solar generation in the summer overwhelming the ability for DR to meaningfully decrease VRE curtailment. Additionally, the implementation of DR continued to see scenarios with 50% electrification having consistently more curtailment than those with 100% electrification, as seen in Stage B scenarios in Figure 7.
As the LCOE of rooftop solar is higher than non-renewable generation, DR results in a marginal increase of overall LCOE. However, even in the best-case scenario (Scenario 9B with 50% electrification, 100% rooftop solar, and 200 MW wind farm), curtailment rate was 60%, impeding the contribution that renewables could make. Though 70% of the load was serviced with renewable energy; this is only marginally better than that achieved without DR (Scenario 9A).
Though it was seen that 50% electrification scenarios are better able to service their electricity demand from renewables (Figure 8), this is mainly due to the overall lower electricity demand when compared to 100% electrification scenarios. It should be noted that 50% electrification scenarios may be representing a different pathway to meeting the renewable target than 100% electrification scenarios, as other renewable energy needed to meet Scope 3 are not accounted for in this modeling work. To meet Regina's Scope 3 target, the 50% electrification scenarios must be implemented in conjunction with additional decarbonization strategies for the remaining energy sources.
Implementing DR on the demand-side transportation model causes EV charging demand to shift toward the beginning of the curtailment period. A visual comparison of EV demand and VRE curtailment shown in Figure 10 shows that no matter how DR is implemented, the amount of curtailment may be so large that fulfilling 100% of EV charging with excess VRE would still result in curtailment. This is shown in Figure 11 for Scenario 3B (50% rooftop solar penetration) in the winter and summer.
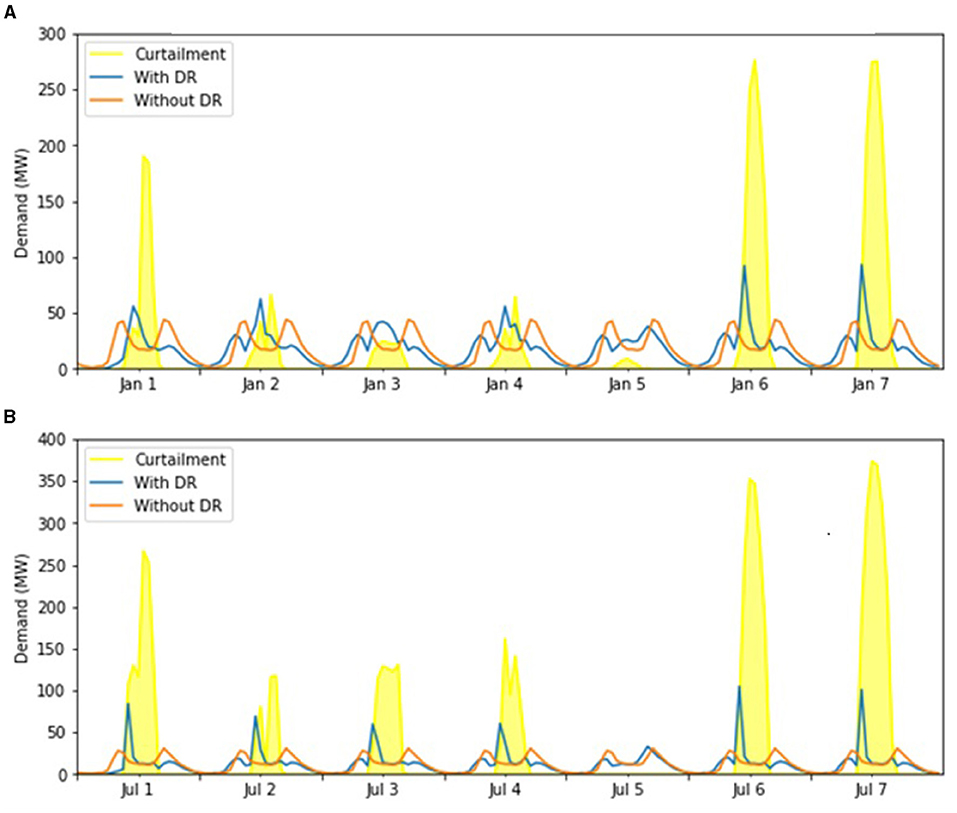
Figure 11. Time-shifting of EV demand load due to curtailment within Scenario 3B in the (A) winter (top) and (B) summer (bottom).
As an EV is simulated to charge to its maximum capacity before every departure, there is charging occurring at times when there is no curtailment. As a result, not all EV charging is fulfilled by VRE generation (Figure 12). Alternative charging strategies, such as those where a vehicle is not charged until it reaches a certain battery level, could potentially be used to further shift EV charging and utilize more excess VRE. As the focus of this work was on electrification, space of EV charging behavior was not explored. Implementing DR successfully for EVs also requires that the infrastructure for DR exists where vehicles are during curtailment times. This can be seen in Figure 12, which shows EV charging load in Scenario 3B for select days in the winter, disaggregated by activity. Work related charging experiences the greatest increase during curtailment times, suggesting that most vehicles are parked at work when curtailment occurs.
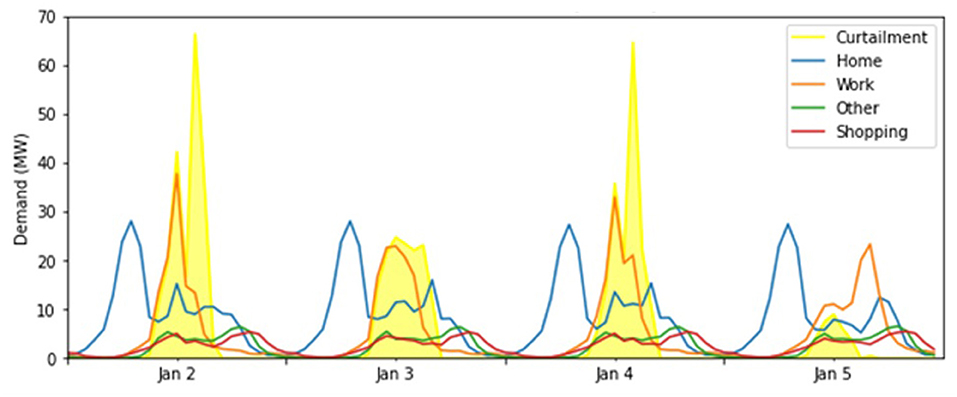
Figure 12. Time-shifting of EV demand load due to curtailment within Scenario 3B disaggregated by trip activity for select dates with low curtailment in the winter.
Similarly, the underwhelming effect of DR on building load shifting, as seen by the proximity of the curves in Figure 13, can be explained by the nature of the DR strategies investigated. Even in the winter (Figure 13A) when the thermal load is much higher, additional activities such as lighting, appliance usage, and water heaters contribute to the total electric load of buildings. Effective load-shifting on the building side therefore requires comprehensive DR programs that include as many electricity-consuming activities as possible. It is also worthwhile to investigate the inclusion of industrial and commercial buildings in these programs.
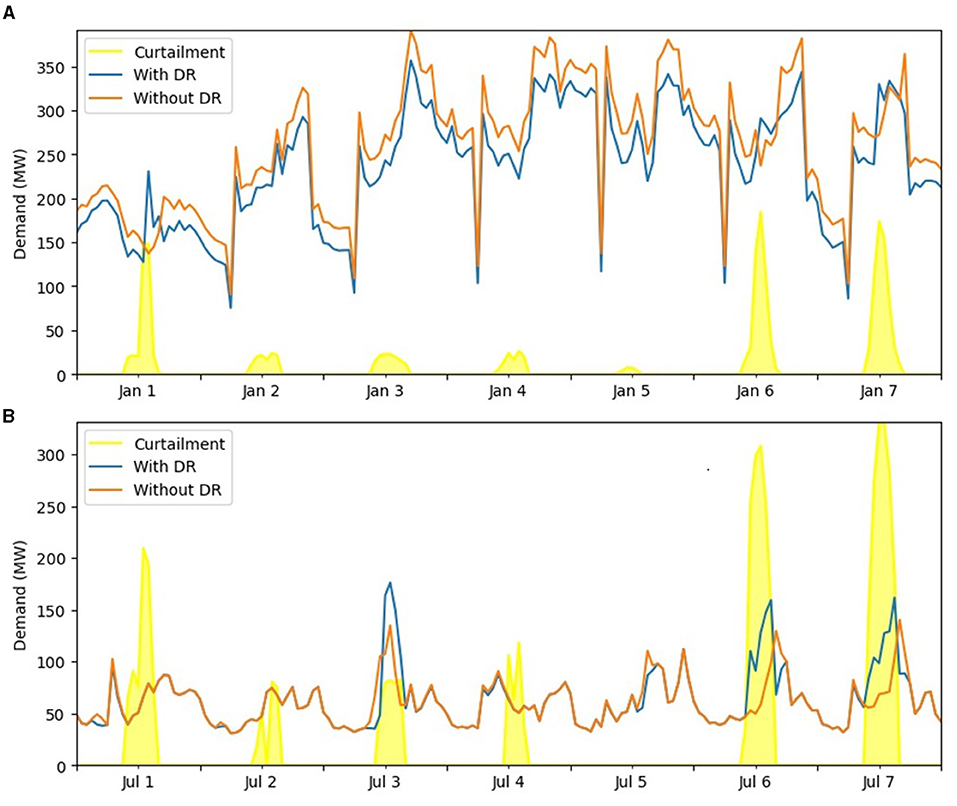
Figure 13. Time-shifting of building demand load due to curtailment within Scenario 3B in the (A) winter (top) and (B) summer (bottom).
As seen in Figure 6: Scenario 10C, the introduction of VRE storage changes the generation mix significantly. The ability to store renewable generation leads to a decrease in curtailment in all scenarios (Figure 7). Notably, adding storage to scenarios with 100% rooftop solar penetration but no added wind capacity (i.e., Scenarios 5C and 6C) reduce their curtailment to near zero. Though there is still curtailment within some of these scenarios (ex. Scenario 9C), the level falls within an acceptable range considering the amount of demand being met by renewables.
As seen in Figure 7, adding storage technology to the grid is the most successful strategy in reducing curtailment. Overall, reducing curtailment directly correlates to Regina's ability to meet their target, but there are scenarios that have significant curtailment even when the target has been met (i.e., Scenario 9C). This indicates that there is excess renewable generation within this scenario, meaning increasing storage capacity would not necessarily increase Regina's ability to meet their target. In this situation, excess VRE generation unable to be stored can be exported to the provincial grid and potentially used as a renewable credit toward the renewable target, which is discussed further in the discussion.
As can be seen comparing Figure 8, the current system will continue to be the least expensive option in terms of LCOE due to the relative low cost of carbon intensive generations, though it is comparable to scenarios that have 100% rooftop solar penetration and a 200 MW wind farm (i.e., Scenarios 9C and 10C) are able to meet over 99% of their demand load with renewables. However, there is potential for cost reduction in the method of renewable penetration chosen; rooftop solar had a significantly higher LCOE than utility scale solar or wind, the latter of which can be seen in the cost difference between Scenarios 6C and 10C. Both these options would be viable and realistic ways to decrease the cost of integrating large-scale renewables.
The integrated model platform developed was used to investigate the feasibility of electrifying private vehicles and homes to run on renewable energy from a system operation perspective. With the high spatial and temporal resolution of the operational perspective, the feasibility of future planning decisions can be evaluated, and insights from the operational model can be used to inform planning in the building, transportation, and electricity sectors.
Though it was shown that DR within the transportation and residential buildings sectors only slightly reduces curtailment levels (1–3%), they are comparable to results within other literature. On the transportation side, though it was not quantified, Wolinetz et al. (2018) found that utility-controlled charging of EVs alone may not be effective for integrating additional VRE into the generation mix. However, the authors only simulated capacity additions to the electricity system that would not result in excess VRE generation, while this analysis assumed fixed VRE capacity. In the building sector, Pedersen et al. (2017) noted that thermal DR strategies could shift roughly 30–47% of peak residential building load in a cold climate. This is consistent with the Stage B results showing 11–60% of peak load was reduced in winter curtailment events.
This analysis found that electrification and renewable energy integration could not meet Regina's target without adding a significant amount of energy storage. Two hundred and fifty MW could fully power Regina with renewable energy in the fully electrified scenario. While this level of storage is technically feasible, the scale is more consistent with utility-scale energy storage projects such as Sir Adam Beck Pump Generating Station (174 MW) (OPG, 2021) and Hornsdale Power Reserve (150 MW) (Hornsdale Power Reserve, 2021). These projects serve entire provinces, which may raise the question of whether such a large-scale storage system is reasonable for a single city. Nonetheless, Solomon et al. (2017) found that to integrate large-scale VRE into an electricity system, the optimal storage size is roughly equivalent to the daily average demand. Comparing storage size found within the scenarios to winter daily average demand shows that storage sizing is in line with these results, though it is over-sized in relation to summer demand.
Though no possible with battery storage alone, the fact that there are higher curtailment levels in the summer, paired with higher electrified demand loads in the winter, indicate that long-duration electricity storage may be beneficial in creating more reasonably sized storage systems (Albertus et al., 2020; Dowling et al., 2020). However, the logistics of this would prove complicated in regards to Regina specifically; the traditional long-duration electricity storage system is pumped hydro storage (PHS) (Albertus et al., 2020), though Regina is not located close enough to a major waterway to feasibly utilize PHS. This means that other long-duration electricity storage options would need to be considered [such as power-to-gas-to-power (Dowling et al., 2020)], or construct it where SaskPower grid resources would be needed to reach it. As SaskPower currently does not have any utility-scale storage technology on its grid (SaskPower, 2021), this option may not be feasible for Regina in the near future, though should be kept in mind for a time when long-duration storage plants are more accessible.
A possible alternative or complement to energy storage is exporting excess VRE to the provincial grid; this would allow for the City of Regina to act as a net generator at specific times of the day and create a revenue stream through the sale of excess electricity. This could contribute to Regina's target as a “renewable credit” to offset any non-renewable generation utilized. This option may be necessary if Regina's renewable target is at odds with the provincial utility grid's capacity expansion plan, resulting in Regina's generation mix being less carbon-intensive than the provincial mix. Adding capacity at a provincial-scale would be less expensive due to economies of scale but adding them at a city-scale may be required if the province and city have opposing views on renewable generation. Other options such as the use of renewable natural gas in the building sector and clean fuel standards in the transport sector may play a role in the energy future of Regina (Government of Canada, 2017). The latter is explored in more detail in the suggested further research.
This study has limitations within the results presented, the linkage architecture, as well as in the individual models. Firstly, LCOE results are only indicative of electricity and do not consider the cost benefits of offsetting gasoline and natural gas use in transportation and building sectors. Excluding these cost benefits would have over-reported the relative costs of meeting Regina's renewable target.
Currently the integrated model platform is unable to model either the electrified load or the DR capabilities of commercial and industrial sectors. This may have resulted in an under-representation of the effectiveness of DR. However, an area of inconsistency is that rooftop solar was assumed to be installed on commercial and industrial buildings in addition to residential.
Based on how the curtailment values are passed to the building and transportation models, the time-shifting of loads in DR adjustments may, with certain configurations, create new periods of curtailment. Though this did not occur within the scenarios analyzed, it can be addressed in future scenario configurations by changing the types of data passed from the electricity system model to the transportation and building models.
Finally, a limitation to the scenarios considered was that that they do not aim to capture the long-term planning and evolution of any of the systems modeled. Instead, the scenarios aimed to capture a snapshot of the system as it could optimally operate. This means that the degradation and replacement of equipment (EV batteries, HVAC equipment, etc.) was not considered within any costs or associated emissions.
A limitation of the transportation model is that it does not include a traffic assignment step. This may have affected the accuracy of travel and activity scheduling, resulting in different EV charging patterns. Similarly, the assumption that travel patterns of EV drivers are the same as non-EV drivers may limit accuracy of results. Further exploration of different charging strategies, including not charging at every activity, could improve the potential for utility-controlled charging to improve the use of VRE in EV charging.
As previously discussed, the archetype-based approach to constructing the building model under-represents the diversity actually seen in the building stock, which may lead to the model predicting higher peaks, lower troughs, and more fluctuations in the building load than would be observed in real life.
The electricity system model is assumed to import electricity from the provincial grid when it is unable to meet demand from local generation assets, but the hourly generation mix of the provincial grid may change if Regina is able to supply a significant amount of their peak demand. A linkage between a provincial electricity system model and a city-scale electricity system model would allow for these changes to be explored in more detail.
This study developed a baseline for evaluating Regina's ability to meet their Scope 3 renewable target through various pathways, but there is still potential for future research. Some suggestions can be seen below:
• As previously mentioned, the exploration of meeting the Scope 3 renewable target through renewable energy sources other than electrification can be done in conjunction with the 50% electrification scenarios evaluated. This may include increased demand side management strategies to reduce overall energy usage, as well as the introduction of renewable fuels into the transportation and building sectors.
• Further analyzing the ability of Regina to meet the Scope 3 renewable target may involve electrifying commercial and industrial buildings, as well as electrification of commercial transportation.
• As mentioned, the system was analyzed as it currently exists. Connecting this work to a capacity expansion model would give the justification to explore scenarios that have drastically different system configurations to meet energy targets.
• Finally, on the economic side, there are several avenues to be explored pertaining to rooftop solar panels or wind farm ownership. This may include, but not be limited to, city ownership; resident ownership (referring to rooftop solar panels) with or without net metering; or a combination of the two.
Several conclusions can be drawn from this exploration of the feasibility of Regina's energy target, ranging from immediately actionable results, to results that indicate further research is needed to fully understand what the impacts will be on the electricity system. The impacts of this study have a wide-range of applications within Regina, as well as the potential to be leveraged by other cities with similar VRE resources and/or are currently drawing electricity from a high-emitting grid.
It is feasible for Regina to meet Scope 3 of their renewable energy target, by considering electrification of private vehicles and households and integrating VRE.
Results from the integrated model platform show that Scope 3 of Regina's renewable energy target can be achieved through large-scale implementation of VRE capacity and storage technology. By adding 100% rooftop solar on residential, commercial, and industrial rooftops (equal to 1,410 MW of solar capacity), 100 MW of wind capacity, and 250 MW of storage, 95% of Regina's electricity demand could be met with renewable energy, even with 100% electrification of private vehicles and thermal residential building load.
Meeting the renewable target will slightly increase LCOE, but this does not capture savings from fuel switching.
Though some scenarios have comparable costs to the current system, there would still be an overall increase (15–50% cost increase across Stage C results) in the net cost of operating the electricity system. That given, scenarios with higher VRE and storage implementation had lower costs than those with lower VRE integration, indicating that it is more economical to commit to large-scale penetration strategies. Additionally, there is significant potential for further reduction in costs of scenarios that can meet Regina's renewable target through switching from rooftop solar to utility-scale solar, as well as increasing the wind capacity.
The addition of storage capacity was necessary when utilizing utility-controlled DR to reduce curtailment.
In lower VRE penetration scenarios, DR can help reduce curtailment to acceptable amounts, though this is due to the lower initial curtailment values (27 to 24% in Scenario 4). In higher VRE penetration scenarios, DR does not meaningfully reduce curtailment, making energy storage necessary to reduce curtailment and meet Regina's target. As the current demand trends exist within the building and transportation sectors, it is unlikely that the implementation of DR strategies alone would allow Regina to meet their target.
Implementing DR for EVs hinges on adequate charging infrastructure at work locations.
Particularly in scenarios with a significant amount of solar energy, charging at work is found to experience the greatest shift when DR is implemented. This indicates that many vehicles in Regina are parked at work when solar curtailment occurs. DR with large amounts of wind energy, which is less predictable, could potentially be implemented through charging infrastructure at home.
For buildings, utility-controlled thermal load shifting does not have a large impact on overall curtailment reduction.
Building thermal DR is found to be largely ineffective in the summer due to the low cooling load of Regina. In the winter, although clear differences can be seen before and after the implementation of DR, these changes are small compared to the total building load. This indicates a need for more comprehensive DR strategies that include additional loads such as water heating, appliances, or lighting.
The datasets presented in this article are not readily available. Most data is available upon request, but electricity demand data was acquired with an NDA and is unable to be distributed. Requests to access the datasets should be directed to SaskPower.
MS, LS, and RX completed the modeling work and wrote the first draft of the manuscript. MS performed final analysis of results. MM revised the manuscript. All authors contributed to conception and design of the study, and read and approved the submitted version.
This work was partially supported by the Mitacs Accelerate program, as well as the BC Graduate Scholarship and the Energy Modelling Initiative (EMI).
The authors declare that the research was conducted in the absence of any commercial or financial relationships that could be construed as a potential conflict of interest.
All claims expressed in this article are solely those of the authors and do not necessarily represent those of their affiliated organizations, or those of the publisher, the editors and the reviewers. Any product that may be evaluated in this article, or claim that may be made by its manufacturer, is not guaranteed or endorsed by the publisher.
The authors acknowledge the assistance of the University of Toronto Travel Modelling Group in the development of the transportation model and the David Suzuki Foundation for their continued support of our work with Regina.
The Supplementary Material for this article can be found online at: https://www.frontiersin.org/articles/10.3389/frsc.2021.674848/full#supplementary-material
1. ^Unless otherwise indicated, i.e., Current system scenario.
2. ^Usable rooftop space is defined as an area where the average annual solar capacity factor is at least 10% for a minimum of 25.5 m2, which is equivalent to a 5 kW PV array (Solar Calculator, 2020).
3. ^Golden South Wind Project is currently in the progress of being constructed and should be operational by 2021 (SaskPower, 2018).
Alberta Electric System Operator (2019). AESO Operating Reserves Program. Available online at: https://www.enelx.com/n-a/en/faq/eindustry/aeso-operating-reserves-program (accessed January 13, 2021).
Albertus, P., Manser, J. S., and Litzelman, S. (2020). Long-duration electricity storage applications, economics, and technologies. Joule 4, 21–32. doi: 10.1016/j.joule.2019.11.009
Ballarini, I., Corgnati, S. P., and Corrado, V. (2014). Use of reference buildings to assess the energy saving potentials of the residential building stock: the experience of TABULA project. Energy Policy 68, 273–284. doi: 10.1016/j.enpol.2014.01.027
Bardutz, E., and Dolter, B. (2020). Regina's 100% Renewable Energy Target: Survey Results Measuring Support for the Target and Related Actions. Technical Report. University of Regina.
Canada Energy Regulator (2020a). CER Provincial and Territorial Energy Profiles - Saskatchewan. Available online at: https://www.cer-rec.gc.ca/en/data-analysis/energy-markets/provincial-territorial-energy-profiles/provincial-territorial-energy-profiles-saskatchewan.html (accessed March 17, 2021).
Canada Energy Regulator (2020b). NEB Canadas Renewable Power Landscape 2017 Energy Market Analysis. Available online at: https://www.cer-rec.gc.ca/en/data-analysis/energy-commodities/electricity/report/2017-canadian-renewable-power/canadas-renewable-power-landscape-2017-energy-market-analysis-ghg-emission.html (accessed September 29, 2020).
City of Regina (2017). Transit Network. Available online at: http://open.regina.ca/dataset/transit-network (accessed May 4, 2017).
Crockett, D., Herbert, Y., de Jager, M., Hoffman, M., Hoffman, R., Murphy, J., et al. (2019). Modelling Urban Climate Mitigation in Canadian Municipalities.
Deane, J. P., Gracceva, F., Chiodi, A., Gargiulo, M., and Gallachir, B. (2015). “Soft-linking exercises between TIMES, power system models and housing stock models,” in Informing Energy and Climate Policies Using Energy Systems Models: Insights from Scenario Analysis Increasing the Evidence Base, Lecture Notes in Energy, eds G. Giannakidis, M. Labriet, B. Gallachir, and G. Tosato (Cham: Springer International Publishing), 315–331. doi: 10.1007/978-3-319-16540-0_18
Dennis, K. (2015). Environmentally beneficial electrification: electricity as the end-use option. Electricity J. 28, 100–112. doi: 10.1016/j.tej.2015.09.019
Dowling, J. A., Rinaldi, K. Z., Ruggles, T. H., Davis, S. J., Yuan, M., Tong, F., et al. (2020). Role of long-duration energy storage in variable renewable electricity systems. Joule 4, 1907–1928. doi: 10.1016/j.joule.2020.07.007
Eaton, E., and Enoch, S. (2020). Renewable Regina Putting Equity into Action. Technical Report. Available online at: https://www.policyalternatives.ca/sites/default/files/uploads/publications/Saskatchewan%20Office/2020/09/Renewable%20Regina%20Report.pdf
Environment Canada (2020). Regina, SK - 7 Day Forecast - Environment Canada. Available online at: https://weather.gc.ca/city/pages/sk-32_metric_e.html (accessed February 10, 2021).
Environment and Climate Change Canada (2015). Canadian Weather Energy and Engineering Datasets (CWEEDS) v_2016.
Geotab (2021). Temperature Tool for EV Range. Available online at: https://www.geotab.com/fleet-management-solutions/ev-temperature-tool/ (accessed January 28, 2021).
Global Wind Atlas (2019). Canada Wind Speed at 100 meters. Available online at: https://globalwindatlas.info (accessed February 8, 2021).
Government of Canada (2017). National Energy Use Database. Available online at: https://oee.nrcan.gc.ca/corporate/statistics/neud/dpa/data_e/databases.cfm#wb-info (accessed April 12, 2015).
Government of Canada Natural Resources Canada, and Federal Geospatial Platform. (2020). Photovoltaic Potential and Solar Resource Maps of Canada. Natural Resources Canada.
Holy Cross Energy (2016). Distribution Flexibility Program. Availablee online at: http://www.holycross.com/programs-overview/ (accessed January 13, 2021).
HOMER Energy (2021). HOMER - Hybrid Renewable and Distributed Generation System Design Software. Available online at: https://www.homerenergy.com/index.html (accessed January 22, 2021).
Hornsdale Power Reserve (2021). Hornsdale Power Reserve| South Australia's Big Battery. Available online at: https://hornsdalepowerreserve.com.au/ (accessed February 27, 2021).
Hydro-Québec (2020). Addenda: Electricity Rates 2019. Available online at: https://www.hydroquebec.com/data/documents-donnees/pdf/addenda-tarifs-electricite-decembre-2020-en.pdf (accessed February 28, 2021).
International Renewable Energy Agency (2020). Hydropower. Available online at: https://www.irena.org/costs/Power-Generation-Costs/Hydropower (accessed February 19, 2021).
Latif, Z. A., Zaki, N. A. M., and Salleh, S. A. (2012). “GIS-based estimation of rooftop solar photovoltaic potential using LiDAR,” in 2012 IEEE 8th International Colloquium on Signal Processing and its Applications (Malacca: IEEE), 388–392. doi: 10.1109/CSPA.2012.6194755
Masters, G. M. (2004). Renewable and Efficient Electric Power Systems. Hoboken, NJ: John Wiley & Sons. doi: 10.1002/0471668826
Mathiesen, B. V., Lund, H., Connolly, D., Wenzel, H., Stergaard, P. A., Mller, B., et al. (2015). Smart energy systems for coherent 100% renewable energy and transport solutions. Appl. Energy 145, 139–154. doi: 10.1016/j.apenergy.2015.01.075
McPherson, M., Ismail, M., Hoornweg, D., and Metcalfe, M. (2018). Planning for variable renewable energy and electric vehicle integration under varying degrees of decentralization: a case study in Lusaka, Zambia. Energy 151, 332–346. doi: 10.1016/j.energy.2018.03.073
McPherson, M., and Karney, B. (2017). A scenario based approach to designing electricity grids with high variable renewable energy penetrations in Ontario, Canada: development and application of the SILVER model. Energy 138, 185–196. doi: 10.1016/j.energy.2017.07.027
McPherson, M., Sotiropoulos-Michalakakos, T., Harvey, L., and Karney, B. (2017). An open-access web-based tool to access global, hourly wind and solar PV generation time-series derived from the MERRA reanalysis dataset. Energies 10:1007. doi: 10.3390/en10071007
McPherson, M., and Stoll, B. (2020). Demand response for variable renewable energy integration: a proposed approach and its impacts. Energy 197:117205. doi: 10.1016/j.energy.2020.117205
Miller, E. J., and Roorda, M. J. (2003). Prototype model of household activity-travel scheduling. Transport. Res. Record 1831, 114–121. doi: 10.3141/1831-13
Miller, E. J., Vaughan, J., King, D., and Austin, M. (2015). “Implementation of a next generation activity-based travel demand model: the Toronto case,” in 2015 Conference of the Transportation Association of Canada (Charlottetown).
Natural Resources Canada (2019). Energy Fact Book 2019 - 2020. Available online at: https://www.nrcan.gc.ca/sites/www.nrcan.gc.ca/files/energy/pdf/EnergyFactBook_2019_2020_web-resolution.pdf
Natural Resources Canada (2020). High Resolution Digital Elevation Model (HRDEM) - CanElevation Series - Open Government Portal. Available online at: https://open.canada.ca/data/en/dataset/957782bf-847c-4644-a757-e383c0057995 (accessed January 2, 2021).
Ontario Energy Board (2021). Managing Costs With Time-of-Use Rates. Available online at: https://www.oeb.ca/rates-and-your-bill/electricity-rates/managing-costs-time-use-rates (accessed January 13, 2021).
OPG (2021). Niagara Pump Generating Station Reservoir. Available online at: https://www.opg.com/strengthening-the-economy/our-projects/niagara-pump-reservoir/
Pedersen, T. H., Hedegaard, R. E., and Petersen, S. (2017). Space heating demand response potential of retrofitted residential apartment blocks. Energy Build. 141, 158–166. doi: 10.1016/j.enbuild.2017.02.035
Peterson, J. (2020). Regina administration to revisit renewable energy plan once more in September. CBC News.
Regina City Council (2020). CITY COUNCIL. Available online at: http://reginask.iqm2.com/Citizens/FileOpen.aspx?Type=1&ID=4136&Inline=True (accessed February 10, 2021).
Reinhart, C., and Davila, C. C. (2019). Urban building energy modeling. Build. Perform. Simul. Des. Opera. 696–722.
Robinson, S. (2018). British Columbia Building Code. Available online at: https://energystepcode.ca/ (accessed October 1, 2021).
Salama, M., Gaouda, A., and Nassar, M. E. (2019). A Cluster-Based load Model for a Resilient and Sustainable Community. Technical Report (QualSys Engco Inc.)
SaskPower (2018). Potentia Renewables to Build 200 Megawatt Wind Power Facility Near Assiniboia. Available online at: https://www.saskpower.com/about-us/media-information/news-releases/potentia-renewables-to-build-200-megawatt-wind-power-facility-near-assiniboia (accessed January 4, 2021).
SaskPower (2019). Demand Response Program. Available online at: https://www.saskpower.com/efficiency-programs-and-tips/saving-power-at-work/savings-programs/business-programs/demand-response-program
SaskPower (2021). System Map. Available online at: https://www.saskpower.com/Our-Power-Future/Our-Electricity/Electrical-System/System-Map (accessed February 28, 2021).
Solar Calculator (2020). Solar Panel System Size Calculator. Available online at: https://solarcalculator.com.au/solar-system-size/ (accessed January 4, 2021).
Solomon, A. A., Child, M., Caldera, U., and Breyer, C. (2017). How much energy storage is needed to incorporate very large intermittent renewables? Energy Procedia 135, 283–293. doi: 10.1016/j.egypro.2017.09.520
Statistics Canada (2017). Census Profile, 2016 Census - Toronto [Census metropolitan area], Ontario and Regina, City [Census subdivision], Saskatchewan. Available online at: https://www12.statcan.gc.ca/census-recensement/2016/dp-pd/prof/details/page.cfm?Lang=E&Geo1=CMACA&Code1=705&Geo2=PR&Code2=47&Data=Count&SearchText=Regina&SearchType=Begins&SearchPR=01&B1=All (accessed June 18, 2019).
Swan, L. G., and Ugursal, V. I. (2009). Modeling of end-use energy consumption in the residential sector: A review of modeling techniques. Renew. Sustain. Energy Rev. 13, 1819–1835. doi: 10.1016/j.rser.2008.09.033
Szinai, J., Sheppard, C., Abhyankar, N., and Gopal, A. (2020). Reduced grid operating costs and renewable energy curtailment with electric vehicle charge management. Energy Policy 136:111051. doi: 10.1016/j.enpol.2019.111051
Tasker, J. P. (2020). Ottawa to hike federal carbon tax to $170 a tonne by 2030. CBC News. Available online at: https://www.cbc.ca/news/politics/carbon-tax-hike-new-climate-plan-1.5837709 (accessed December 12, 2020).
Tink, C., and Folk, L. (2019). PPC19-4 Energy and Sustainability Framework - City of Regina, Saskatchewan CA. Available online at: http://reginask.iqm2.com/Citizens/Detail_LegiFile.aspx?Frame=&MeetingID=4593&MediaPosition=&ID=4218&CssClass= (accessed January 2, 2021).
Travel Modelling Group (2020). GTAModel V4.0 Introduction. Available online at: https://tmg.utoronto.ca/doc/1.4/gtamodel/index.html (accessed February 28, 2021).
Vaillancourt, K., Alcocer, Y., Bahn, O., Fertel, C., Frenette, E., Garbouj, H., et al. (2014). A Canadian 2050 energy outlook: analysis with the multi-regional model TIMES-Canada. Appl. Energy 132, 56–65. doi: 10.1016/j.apenergy.2014.06.072
Wolinetz, M., Axsen, J., Peters, J., and Crawford, C. (2018). Simulating the value of electric-vehiclegrid integration using a behaviourally realistic model. Nat. Energy 3, 132–139. doi: 10.1038/s41560-017-0077-9
Keywords: decarbonization, city-scale modeling, integrated energy modeling, variable renewable energy integration, electrification, demand response, storage
Citation: Seatle M, Stanislaw L, Xu R and McPherson M (2021) Integrated Transportation, Building, and Electricity System Models to Explore Decarbonization Pathways in Regina, Saskatchewan. Front. Sustain. Cities 3:674848. doi: 10.3389/frsc.2021.674848
Received: 02 March 2021; Accepted: 29 September 2021;
Published: 03 November 2021.
Edited by:
Matthias Haase, Zurich University of Applied Sciences, SwitzerlandReviewed by:
Edgar Antonio Barragán, Salesian Polytechnic University, EcuadorCopyright © 2021 Seatle, Stanislaw, Xu and McPherson. This is an open-access article distributed under the terms of the Creative Commons Attribution License (CC BY). The use, distribution or reproduction in other forums is permitted, provided the original author(s) and the copyright owner(s) are credited and that the original publication in this journal is cited, in accordance with accepted academic practice. No use, distribution or reproduction is permitted which does not comply with these terms.
*Correspondence: Madeleine Seatle, bXNlYXRsZUB1dmljLmNh
Disclaimer: All claims expressed in this article are solely those of the authors and do not necessarily represent those of their affiliated organizations, or those of the publisher, the editors and the reviewers. Any product that may be evaluated in this article or claim that may be made by its manufacturer is not guaranteed or endorsed by the publisher.
Research integrity at Frontiers
Learn more about the work of our research integrity team to safeguard the quality of each article we publish.