
95% of researchers rate our articles as excellent or good
Learn more about the work of our research integrity team to safeguard the quality of each article we publish.
Find out more
ORIGINAL RESEARCH article
Front. Sustain. Cities , 29 April 2021
Sec. Urban Energy End-Use
Volume 3 - 2021 | https://doi.org/10.3389/frsc.2021.662822
This article is part of the Research Topic Positive Energy Districts: Transforming Urban Areas into High Efficiency Districts with Local Renewable Generation and Storage View all 10 articles
 Bahador Samadzadegan†
 Soroush Samareh Abolhassani†
 Sanam Dabirian
 Saeed Ranjbar
 Hadise Rasoulian
 Azin Sanei
 Ursula Eicker*
The growing urban population globally leads to higher greenhouse gas (GHG) emissions and stress on the electricity networks for meeting the increasing demand. In the early urban design stages, the optimization of the urban morphology and building physics characteristics can reduce energy demand. Local generation using renewable energy resources is also a viable option to reduce emissions and improve grid reliability. Notwithstanding, energy simulation and environmental impact assessment of urban building design strategies are usually not done until the execution planning stage. To address this research gap, a novel framework for designing energy systems for zero-carbon districts is developed. An urban building energy model is integrated with an urban energy system model in this framework. Dynamic prediction of heating and cooling demand and automatic sizing of different energy system configurations based on the calculated demands are the framework's primary capabilities. The workability of the framework has been tested on a case study for an urban area in Montreal to design and compare two different renewable energy systems comprising photovoltaic panels (PV), air-source, and ground source heat pumps. The case study results show that the urban building energy model could successfully predict the heating and cooling demands in multiple spatiotemporal resolutions, while the urban energy system model provides system solutions for achieving a zero-carbon or positive energy district.
Many cities worldwide have a climate strategy to become carbon neutral by 2050 (Dominković et al., 2016). Currently, 54% of the world's population lives in urban areas, and this figure will rise to 66% by 2050 (Pless and Polly, 2018). Buildings' energy consumption account for about 30% of the world's energy consumption, and 60% of this is due to heating and cooling demand (Lizana et al., 2017). Based on Natural Resources Canada's data, the residential sector accounts for 13% of the end-use consumption in Canada, while this share is 20% in Quebec (Government of Canada, 2020). The successful implementation of net-zero energy buildings has led to applying this concept to a group of buildings and, finally, developing zero-carbon or even ositive energy districts. These zero-carbon or positive energy districts have several advantages, including economies of scale, an opportunity to use waste heat from one building in another, and sharing energy resources (Pless and Polly, 2018).
In the sustainable development of cities toward carbon neutrality, municipalities' role, efficient energy system design, and buildings' energy consumption should be considered (Wiseman, 2018). Municipalities' plans and goals define the scope of changes and enhancements in different sectors. To evaluate different scenarios for municipalities or private developers' decision-making, dynamic energy demand simulation is beneficial to optimally size the urban renewable energy system to achieve a zero-carbon district. Urban Building Energy Modeling (UBEM) is a physics-based approach to analyze and predict a group of buildings' energy consumption considering the indoor and outdoor conditions (Hong et al., 2018). Urban Building Energy Modeling is a novel tool to support and improve sustainable development and energy efficiency measures in districts or cities which considers the thermal load diversity of a group of buildings to design on-site renewable energy systems, estimate CO2 emission, and predict building energy use (Johari et al., 2020).
An appropriate energy system should be designed and sized to supply those demands after calculating a building or a building cluster's energy demand. Utilizing renewable energy systems is a solution to decarbonize buildings' consumption and reduce the urban ecological footprint. There are several tools under development to ease the process of modeling multiple buildings. City Energy Analyst is a modeling framework to integrate the spatiotemporal analysis of building energy performance, local energy potential assessment, and energy system optimization and analysis in neighborhoods and city districts for urban planning and policymaking (Fonseca et al., 2016). TEASER is a design-driven reduced-order UBEM platform for energy performance analysis on network efficiency and management on different spatial scales (Remmen et al., 2018). Besides, TEASER is integrated with the urban energy systems design to optimize energy systems and networks for both building and urban scales (Ferrando and Causone, 2020).
A reliable and accurate energy system modeling framework can help compare different technical and environmental indicators of the proposed energy system alternatives. Due to the uncertainties, modeling renewable urban energy systems, whether in a standalone configuration or hybrid mode, is a more complex procedure than conventional energy systems. According to Yazdanie and Orehounig (2021), many studies in urban energy system modeling (UESM) suffer from the lack of detailed input data. Therefore, there is a need for a comprehensive and detailed UBEM to provide load input data for UESM. Many detailed UBEM software such as UMI and City Energy Analyst are developed and available, but they do not contain comprehensive UESM, nor are they explicitly designed for such purpose (Fonseca et al., 2016; Reinhart and Cerezo Davila, 2016).
Numerous studies are focusing on integrating different energy sources, including renewable energies, into energy system design. To name a few, Petkov and Gabrielli (2020) developed a framework to design, select, and size a low carbon Multi-Energy System. Their objective was to minimize the annual costs and emissions. They showed that emissions could decrease by 90% if a renewable energy system with short-term storage is used. The same objective functions were used by Tabar et al. (2021) to use waste heat recovery, power to gas, and carbon capture technologies in an energy system framework. In simulation models, the aim is to predict the energy system's performance, such as TRNSYS (Li et al., 2015; Soutullo et al., 2016). Yuan et al. used TRNSYS to design and assess a distributed energy system serving a University campus (Yuan et al., 2020). The proposed system consisted of an internal combustion engine, absorption chiller, thermal energy storage unit, heat pump (HP), and boiler. They realized that integrating thermal storage and distributed energy system leads to higher primary energy efficiency.
Furthermore, Hsieh et al. used quasi-steady state simulation models to study short-term and long-term TES integration with solar collectors in different scales from single buildings to neighborhoods (Hsieh et al., 2017). They reported that using decentral short-term and long-term storage for each building has the best performance, with 48% of the energy being covered by solar energy. Dominković et al. (2016) investigated a methodology in the transition to carbon-free and 100% renewable energy in South-Eastern Europe. Their results show that a single renewable energy source typically has no more than 30% share in an energy system. Usually, a variety of technologies is needed to supply the demand. Pilpola et al. developed a techno-economic model at the national and city-level scale to investigate the possibility of using different renewable energy systems to achieve low and zero-carbon goals in Finland and specifically the town of Helsinki (Pilpola et al., 2019). After coupling multiple technologies, each scenario's cost efficiency is discussed and considered as a variable to compare the proposed scenario's overall efficiency.
Also, there are studies trying to point out the required framework and features of a suitable workflow. Eicker et al. discussed the required concepts of an urban energy modeling platform to model the energy demand and intricate urban renewable energy systems design (Eicker et al., 2020b). The platform will include models of buildings, transportation, energy and distribution systems, food, and water infrastructure to compare different energy system operation scenarios. In another study, Weiler et al. proposed an automated method to calculate central energy generation and supply scenarios using the simulated heating demand based on a CityGML-based model (Weiler et al., 2019). Although several UBEM models have been proposed, they are mostly still in prototype status, and a reliable urban energy simulation model is still a challenge.
For the current study, the role of energy system design and UBEM in the transition to energy-efficient districts are studied. This paper aims to investigate the challenges of a developed integrated UBEM and energy system design workflow. A novel automated framework combining a Python-based UBEM model with a renewable energy system model is developed to calculate and predict new or existing districts' energy demand and then design a renewable energy system. In this work, photovoltaic panels (PV) have been coupled with ground source and air source HPs for covering the heating and cooling demands for a district.
This work uses a detailed UBEM workflow based on 3D urban geometry with different energy-related data from various sources with different formats to calculate the heating and cooling demand. The developed UBEM is highly flexible in providing relevant input data for energy system sizing in any spatiotemporal scale from a thermal zone to a district and hourly to annual results. This allows combining the building demand modeling with international database sources on construction or occupancy, which is often a limitation in urban modeling tools. Furthermore, designing energy systems with considering component-level details has added a higher value to the proposed UESM's flexibility as well as accuracy. Introducing a sufficiently detailed and comprehensive model as a substitute to the high-level energy system design in an urban context increased modeling resolution by capturing the impact of components' performance on other components and the system's efficiency. In addition to the detailed design of a PV system, HPs have been modeled with varying coefficients of performance (COP) to cover the gaps in many previous studies (Rinne and Syri, 2013; Lund et al., 2016), that have considered a fixed monthly or annual value COPs.
The following sections describe the integrated workflow of the UBEM and UESM. Figure 1 illustrates an overview of the methodology used in this paper.
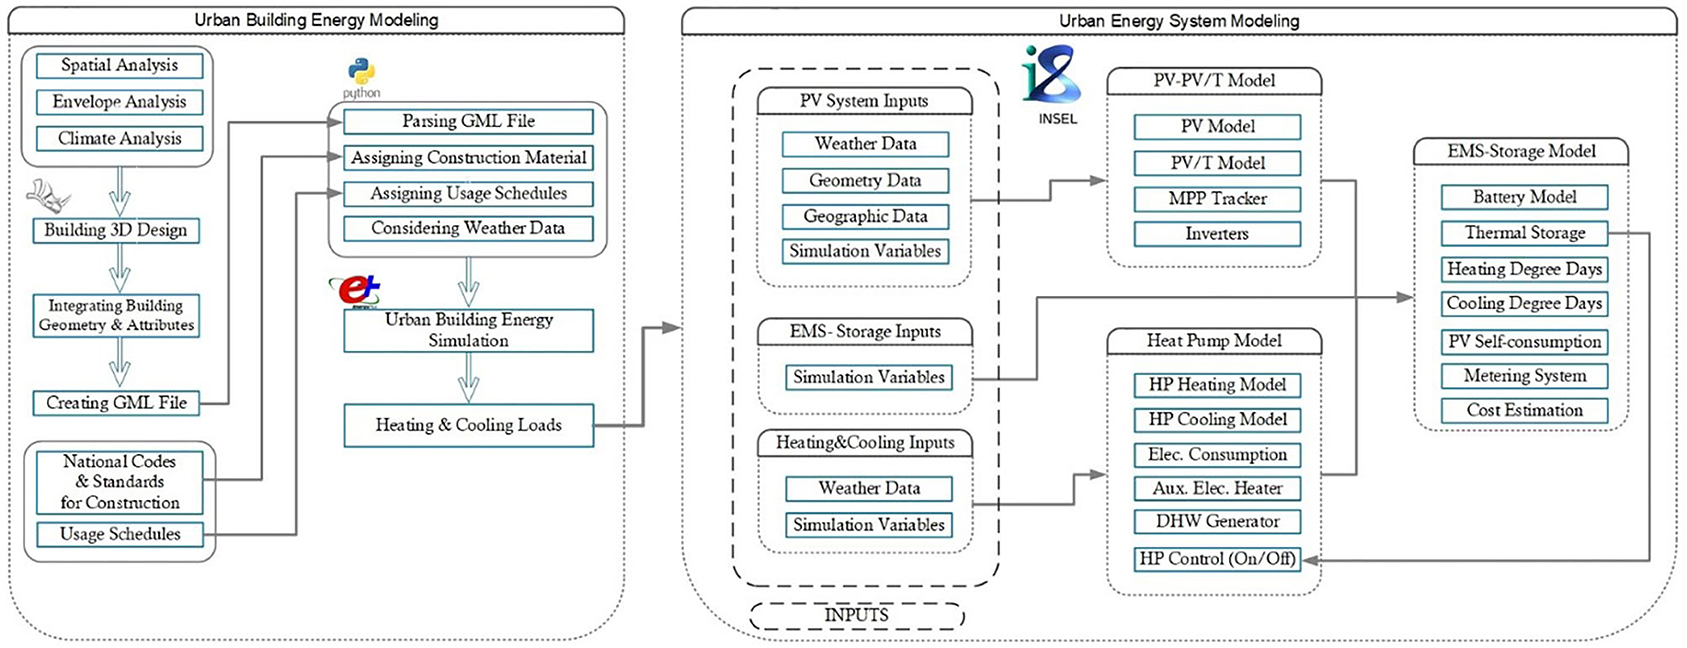
Figure 1. Methodology overview.
The importance of a correct pre-design process for a successful design at the building or city scale is undeniable. Overviewing the site's limitations and the client requests cannot be executed without a feasibility study. The feasibility study shows what is possible for the project based on the site, existing conditions, zoning, building codes, local regulations, and other legal restrictions (Green, 2018). The site and climate analysis are also part of the pre-design process. These analyses focus on potentials and conditions around the site (Spreiregen and Beatriz, 2007). The site analysis aims to provide external information about the site, limitations, and assets and connect them to the design's internal needs (Halil et al., 2016). Looking at the neighborhood context, vegetation, climate, historical factors, and many others is part of this process. Spatial design or building massing helps to make a better connection between the site and future buildings. Early-stage building shadow studies, wind flow or radiation analysis, and any other analysis related to urban comfort and façade control, can be executed in this stage. Then the process continues reaching the building design. In this stage, the building's location, orientation, and massing form are defined, so the project reaches to more detailed design like adding façade detail, form detail, or shading properties.
A novel, highly flexible, and dynamic python-based UBEM workflow is developed in the current study. The proposed model can cover all aspects of the building energy modeling in detail and dynamically change all input parameters based on building use-type. Due to the massive amount of input parameters in UBEM models, high computational cost, and considerable uncertainty involved in simulation, it remains a challenge to have a practical and accurate UBEM model. The energy system sizing is highly dependent on building energy demand results and energy demand changes based on building use-type. Thus, all input parameters of the developed UBEM model change based on building use-type to increase the model's accuracy by using more relevant input parameters for each building use-type.
Simulating the urban building energy system requires coupling with an accurate UBEM (Hong et al., 2018). The urban energy system sizing, especially PV system sizing, is highly dependent on the building's roof shape and area (Mohajeri et al., 2018). Most previous studies simplified the building geometry for energy demand calculation which can cause high uncertainty in their building energy demand and energy system sizing calculation (Strzalka et al., 2011). The roof shape and area from the architectural design step are used for energy system sizing in the current study. It is necessary to use the same roof shape in urban building energy demand and energy system sizing calculation to have a compatible and accurate model. In the developed UBEM, buildings and mostly the roofs are modeled in detail and close to reality. The main advantage and contribution of the proposed UBEM model is its compatibility with the energy system sizing. Many downsides of energy system sizing in the previous studies are studied and rectified through the proposed UBEM model.
City Geographic Markup Language (CityGML) (Gröger et al., 2012) was used as an open data model similar to an XML format suitable for storing the geospatial information of the 3D buildings. The CityGML files are parsed, and building coordinates and attributes are extracted using a python code, and the building objects are stored in a python dictionary hierarchically based on the following order:
a) Building ID
b) Building use-type
c) Building coordinates (x,y,z).
Using hierarchical building characteristics in the python dictionary makes it possible to add all the other building information based on the surface type and building use-type. In the next step, the high performance building materials and constructions (standard 189.1-2009) are extracted based on the building use-type from the National Renewable Energy Laboratory (NREL) (NREL, 2018; Building Component Library 2021) and stored in a JSON format called JCM. The JCM file is parsed and embedded in a python dictionary called building construction archetypes (BCA). Each polygon in the building coordinate's part is categorized into the wall surface, roof surface, and ground surface and are stored as a subcategory of building 3D coordinates (Figure 2). The construction and material archetypes are assigned to each surface based on its type (roof, ground, or wall) and related building use-type. Consequently, each surface can be added to the building energy simulation software with its construction and material features automatically using python code.

Figure 2. The building characteristics dictionary (BCD).
EnergyPlus is used as the building energy simulation program to simulate the energy demand considering the effect of the built environment, the interaction between buildings, and internal gains (Chowdhury et al., 2016; Rao et al., 2018). By iterating through the building characteristics dictionary (BCD), the first item (building IDs) is used for defining building zones. In the next step, the building surface information should be added to EnergyPlus. Hence, the surface coordinates are the successive objects that should be added to EnergyPlus. The coordinates of each building surface are mapped, and the coordinates' connection leads to the creation of the 3D model of buildings and, subsequently, the 3D urban building model in EnergyPlus. Next, the construction and material are assigned to each surface. As each surface is connected to a building use-type in the BCD, a python code is written to search for each surface based on the building use-type related to the surface type in BCD. The information is extracted from the JCM based on surface building-related use-type and surface type obtained from the BCD search in the last step. Finally, each surface construction archetype obtained from the NREL JSON search is assigned to each surface and are added to EnergyPlus.
The urban buildings' geometry enriched with materials and construction features is only part of the urban building energy analysis and energy system sizing. To improve the accuracy of the urban building energy demand calculation, building usage schedules need to be considered as follows:
1) Occupancy schedule
2) Lighting schedule
3) Electrical equipment schedule
4) Ventilation schedule.
These schedules significantly affect energy demand and, consequently, on energy system sizing (Happle et al., 2018); however, most of the time, a fixed schedule for different building use-types is used, which increases the uncertainty of the urban energy demand calculation. Hence, it is necessary to define the schedules based on the building use-type. Usage schedules (e.g., occupancy parameters, lighting, electrical equipment, and ventilation) have been created by the Department of Energy (DOE). They are available for 16 different building use-types on the DOE website (US DOE, 2013). All schedules are extracted from the EnergyPlus IDF files provided on the DOE website for four different building use-types, including large office, secondary school, small office, and midrise apartment.
In this work, a district case study in Montreal, Canada, has been chosen. These Lachine district case study's building use-types are civic center, school, commercial, residential, and office, which are not the same as the DOE building use-types. Therefore, the chosen building use-types for extracting the DOE website schedules are based on their similarities to the real building use-types in the Lachine district. After extracting the schedules, each schedule of occupancy, lighting, electrical equipment, and ventilation is automatically assigned to each building in the district based on the building use-types. All schedules are fed into EnergyPlus along with the 3D urban model and construction archetypes to calculate the heating and cooling demand in the last step. All the other settings of EnergyPlus for the UBEM model are shown in Table 1. Occupancy, electrical equipment, lighting, and ventilation are set through comparison with other studies (Kim et al., 2013; Signelković et al., 2016; Sarfraz et al., 2018). The simulated heating and cooling demand are input to the UESM model.
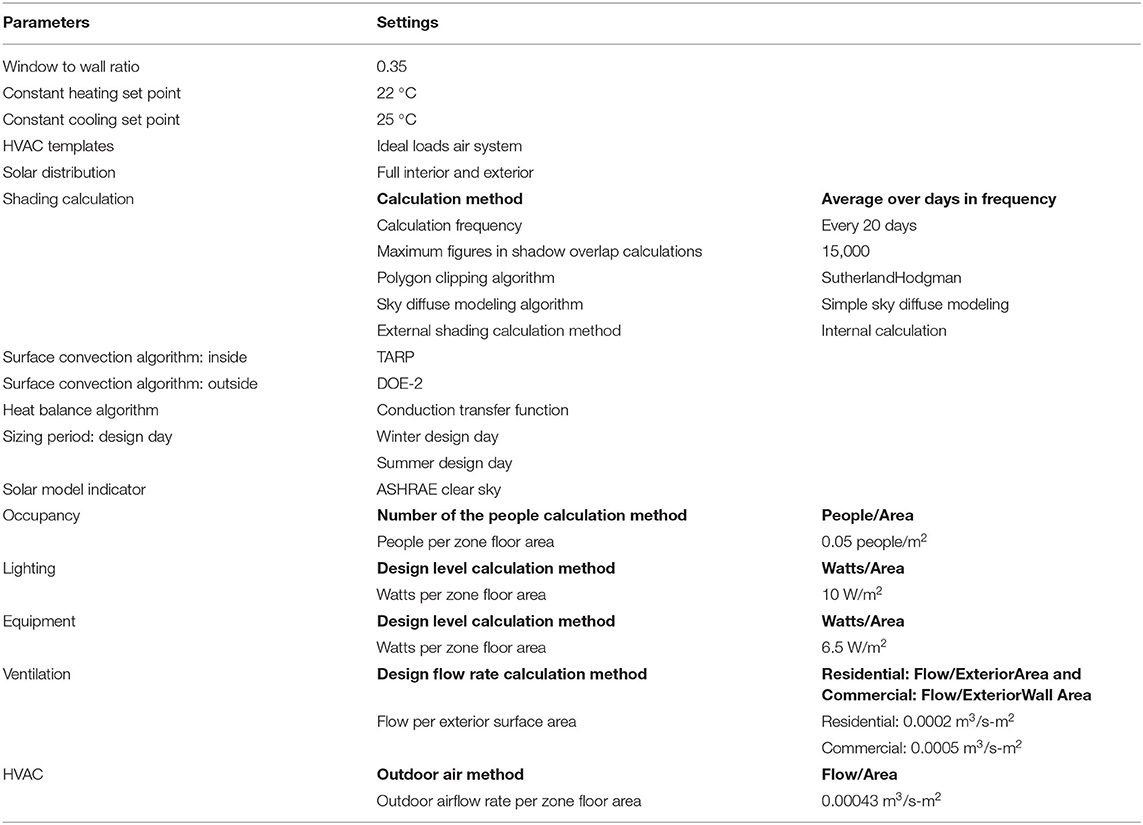
Table 1. EnergyPlus setting parameters for UBEM.
Designing energy systems is of great importance for achieving higher efficiency for a single building, let alone a district or an urban area. Accurate demand forecasting and calculation should be accompanied by an appropriately sized, designed, and installed energy system to have a complete cycle of a sustainable and energy-efficient project. The proposed energy system analysis includes renewable energy sources to reduce carbon and greenhouse gas (GHG) emissions, embodied carbon, and fossil fuel usages. The positive energy concept goes further in utilizing more renewable resources than is consumed while minimizing demand and energy losses and maximizing energy efficiency.
Urban energy system modeling is a block-based simulation model using INSEL 8.2. (Integrated Simulation Environment Language), which comprises many models programmed as independent modular such as meteorological models, PV systems, HPs, battery and thermal storage, controllers, auxiliary electrical heaters, and more. In this study, the general workflow of UESM will be discussed as well as PV, HP, metering, and auxiliary electrical heater sections. Eventually, the results of a case study will be provided and discussed.
Integrated Simulation Environment Language (INSEL) is a graphical programming language using blocks with a focus on renewable energy systems. Its usage domain includes but is not limited to building modeling and meteorology. The graphical environment made it easy for users with limited coding experience to implement their ideas using pre-existing blocks to create system models or even prepare their own user blocks. User-defined blocks can be written in different languages, including Fortran and C, and in the next software versions Python, which adds flexibility to the INSEL block concept (Weiler et al., 2019; Eicker et al., 2020a). Moreover, INSEL comes with a comprehensive library for a few energy system components such as PV panels and inverters, which saves the time required for gathering data from manufacturers.
The UESM workflow starts with acquiring hourly demand (heating, cooling, hot water, and plug load) from the UBEM section as input and calculating solar energy parameters, PV panels potential, HP performance, HP energy output, and energy metering. The high-level connection between different sections is illustrated in Figure 3. Internal connections and links between models and blocks are not shown for the clearance of the general concept.
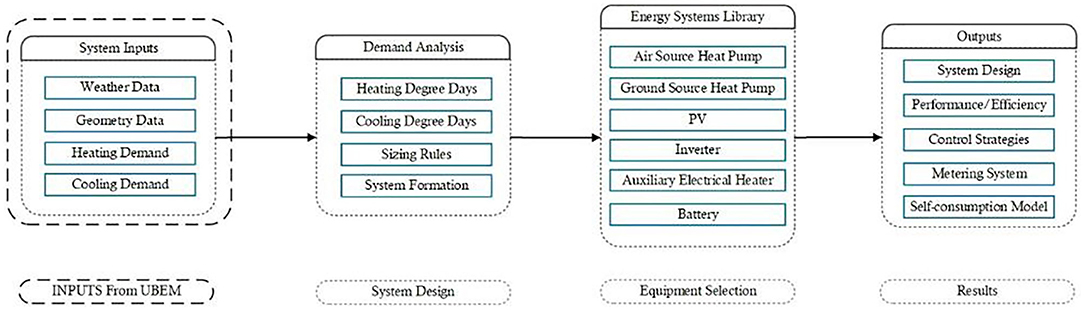
Figure 3. Modified UESM flow diagram showing categories of inputs, demand analysis, energy systems, and outputs.
By taking the roof surface area information from UBEM, the PV system model can automatically select the PV placement (by width or length) to maximize the PV generation based on the panel dimensions available in the INSEL PV library. To do so, a rectangular surface (a portion of the roof available for PV panels, which we assumed as 65% of the total area) with a given length and width is considered. PV panels will be placed by both the short and long sides, and the formation with the highest number of PV panels will be selected. The gap between PV rows is determined with the highest strictness to minimize PVs' shadowing effect (Figure 4).

Figure 4. Illustrating the gap between PV rows for minimizing shadows on panels.
The PV block simulates the selected PV panel's hourly current-voltage curve using a module-specific parameter set from the INSEL library, with meteorological data inputs, including temperature, global radiation, wind speed, and the user inputs like tilt angle and azimuth for each project. It is worth mentioning that a maximum power point tracker block is integrated into the system to get maximum power at each time step. A selected inverter (appropriately sized for the project) converts the PV-generated DC power to AC and provides the PV system output to the energy metering section of UESM. The characteristics of the used PV panel and PV system design parameters are shown in Table 2. The remaining parameters will be determined in each time step and will be fed to the PV block.
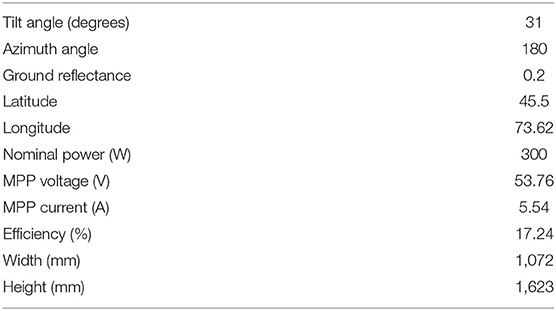
Table 2. Selected PV panel and PV system design parameters for the Montreal case study.
Electrification of heating systems using HPs and electric boilers has been suggested in recent years to reduce GHG emissions of the heating sector (Thomaßen et al., 2021). Integrating HPs with PV or PV/T panels could enhance renewable energy utilization in urban areas. Aguilar et al. conducted a techno-economic assessment of a PV-HP system supplying an office building's heat demand in Spain (Aguilar et al., 2019). This system reduced the primary non-renewable energy consumption and CO2 emissions by 74%.
Heat pumps are included in many projects aiming for energy efficiency and decarbonizing due to their high COP, the capability of integrating into heat recovery systems (process heat or waste heat), their flexibility in using different energy sources, including renewables, and the availability in varying capacities and features. The COP is a unitless HP performance indicator. The COP is highly dependent on different parameters. It cannot be referred to as the best and only equipment selection criteria. The COP is determined by dividing useful energy generated (transferred) by the HP's electricity consumption and varies mainly due to source and sink temperatures, resulting in different values in different working conditions.
Researchers have made numerous attempts to determine a correlation between each project's unique properties (heat sink and source temperatures, demand values) and HP's performance to reach an acceptable range of matching results between simulation and real-world experimental data (HPTCJ, 2010; Arpagaus et al., 2018; Jesper et al., 2021). The availability of various technologies and different technical specifications and details for HPs does not allow for a single parameter set to model all HPs.
In the current study, a previously implemented procedure (Weiler et al., 2019) has been used as an accurate HP system model in different conditions. This model uses HP manufacturers' published performance data and interpolation to specify a correlation between COP, HP's heat output, and electricity consumption in different conditions, including additional heat source and heat sink temperatures and heat demand levels. It is worth mentioning that the third parameter can be derived easily in the presence of the two parameters mentioned above. Moreover, instead of COP, which is only accurate in a single condition, seasonal COP (SCOP) has been used, which can be calculated as follows where Q and E are HP heat output (kWh) and electricity consumption (kWh) and E, and H subscripts relate to the heating and cooling cycles.
Low-temperature heating is crucial for lowering energy loss and improving systems energy and exergy efficiencies. Heating supply temperatures as low as 30 and 35°C are shown to be feasible for surface heating and fan coil systems (Hesaraki et al., 2015). Furthermore, many studies have shown that a supply temperature of 40°C is sufficient for meeting the domestic hot water demand. At the same time, the risk of Legionella can be eliminated via supplementary heating or point of use heating (Lund et al., 2014; Lee, 2018). By reviewing literature regarding the low-temperature heating concept, supply temperatures of 40 and 11–12°C are selected for heating and cooling, respectively (Nordman et al., 2012; Huang et al., 2019).
In each time step, the HP model will take heating and cooling demand (kW) from the input file provided by UBEM. With respect to the outdoor temperature, the model interpolates values for HP's electricity consumption, its COP, and the HP output energy. Then the model divides demand by HP output and rounds the quotient up to the closest integer to obtain the number HPs required to meet the demand in each time step. The HP system's electricity consumption will be scaled up accordingly. Besides, electricity balance, PV self-consumption, energy exported and imported from the grid, and SCOPs are calculated in each iteration. The highest value will be reported as the number of HPs required in heating and cooling cycles.
As the second-largest municipality in Canada, Montreal has provided an action plan that includes goals, challenges, and requirements needed to become more sustainable. In the pathway toward sustainability and carbon mitigation goals, the city has three main sustainable development challenges, which are (Montr, 2020):
• Reduction of GHG emissions by 80% (3,003-kilo tons of CO2 equivalents) by the year 2050 compared to the year 1990 baseline.
• Enhancing access to services and facilities among different city neighborhoods and the ethical distribution of resources for every dwelling.
• To become an exemplary model for other cities by integrating sustainability plans into all aspects of the city.
The developed workflow was applied to a district development called Dominion Bridge in Montreal's Lachine East borough. Lachine-East is a former industrial hub bordered by the Lachine Canal on its southern part, 6th Avenue to the west, Victoria Street to the north, and the east's Canadian Pacific Railway line. This project's area is 63.8 hectares and includes two heritage buildings that are going to be preserved.
Location is one of the main factors in this project, considered in all design stages. The urban plan should respect the site's identity as the former Dominion Bridge steel bridge company represents Canadian industry's golden age. On the other hand, since an urban farm will be located on the south of the site, the entire building roof area can be considered for PV panels installation, as the green spaces requirements of the municipally are already met. The 3D building geometry of the case study is generated in the Rhinoceros 3D software with a total floor area of 277,000 sqm. The model consists of six building blocks with different heights and floor areas. Table 3 indicates the buildings' geometrical characteristics. Figure 5 shows the location of each building in the area and the generated 3D model of the buildings.
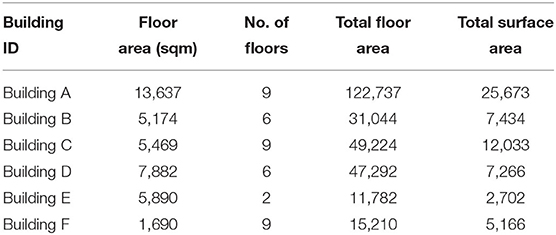
Table 3. Case study buildings' geometrical characteristics.
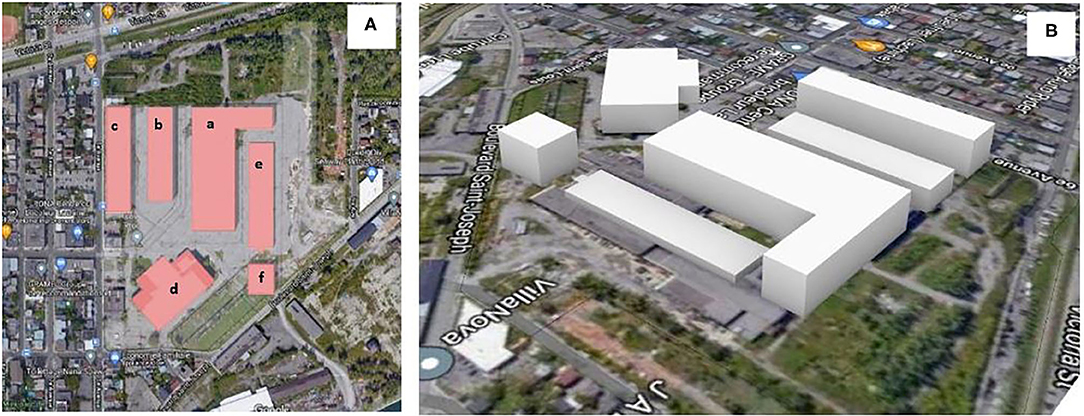
Figure 5. (A) Master plan of the Lachine East project. (B) 3D model of the case study.
The buildings are mixed-use with residential, commercial, civic center, and school use-types. In this massing model, 90% of the total area is considered for residential buildings and 10% for the rest of the buildings. The offices and retails are considered on the buildings' ground floor to make this design respond to eco-district policies. The area of the office and retails are around 9,500 sqm.
New zoning is proposed for the Lachine-Est area in which buildings with distinct shapes, sizes, and orientations and, therefore, different demand profiles are designed. Moreover, two options are considered for the energy systems: air source heat pump (ASHP) and ground source heat pump (GSHP). As a renewable source, an identical PV system, including a maximum power point tracker and inverter, will provide electricity in both cases. For each building, two energy systems will be selected separately regarding its demand profile to understand better and compare GSHP and ASHP performances.
The construction and architectural features and other thermal properties are assigned based on the building use-type. The definition of the building use-types in this model is not precisely the same as DOE building use-types. Therefore, the closest similarities between the DOE building use-types and real building use-types in the Lachine district are shown in Table 4.
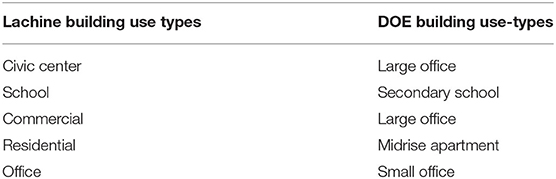
Table 4. Matching building use-types in DOE with the case study buildings' use-types.
The developed UBEM model was used to simulate the energy consumption of the Lachine East project based on the assumptions listed in Table 1. The monthly heating and cooling demand were estimated at the building and district levels. The specific energy demand is shown in Figure 6. According to Figure 6A, the different cooling and heating demand for each building is influenced by the surface area to volume ratio of buildings, which changes solar gain and ventilation. The solar gain through the glazing and wall surface and ventilation have a different effect on building energy demand. Increasing the solar gain increases the cooling demand while increasing the ventilation can prevent heat trapped in the buildings and consequently decrease the cooling demand. Figure 6A shows that building A has the highest specific cooling demand. Figure 6B indicates that the building D and F have the highest specific heating demand, respectively.

Figure 6. (A) Specific cooling demand (kWh/sqm/year). (B) Specific heating demand (kWh/sqm/year).
Figure 7 shows the simulated monthly cooling and heating demand of the buildings. The figure reveals that the cooling load peak is mainly in July, while the heating load peak is between December and January. Building C and D's heating load, and building B, E, and F follow a similar trend, with a slight difference. Building A shows the highest monthly cooling and heating load in a whole year.
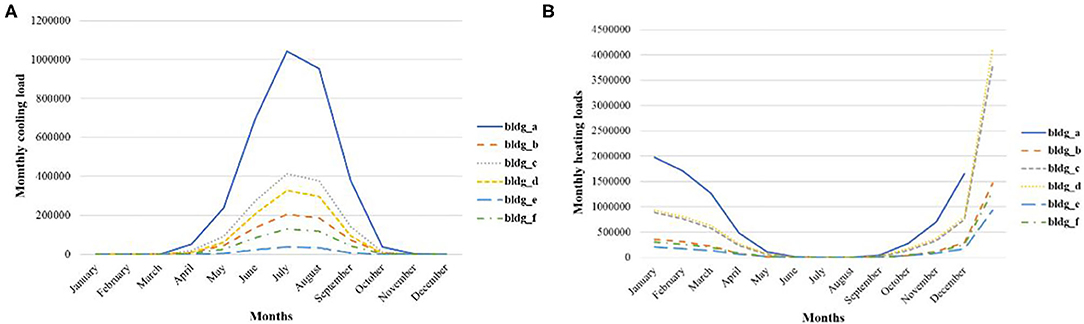
Figure 7. (A) Monthly cooling loads (kWh). (B) Monthly heating loads (kWh).
The annual district heating and cooling demands are 20 and 7 GWh, respectively. The district's predicted heating and cooling loads are used to calculate the energy system performance using UESM.
Urban energy system modeling results for both energy system scenarios are summarized in Table 5. As mentioned before, energy systems are selected to be compatible with low-temperature heating systems with high efficiency. In each scenario, two types of HPs (ASHP and GSHP) were considered to provide heating and cooling demands. Heat pump sizes were selected regarding two criteria, SCOPs and demand, and to have a reasonable comparison between two HP types, a 70-ton (245 kW) HP model is selected for each HP type. Heat pumps are modeled using thorough performance documentation provided by manufacturers (Trane, 2015; Maritime Geothermal, 2018). Performance data of the chosen ASHP and GSHPs are shown in Tables 6, 7. This data is used to simulate the HP performance in each time step and condition precisely.
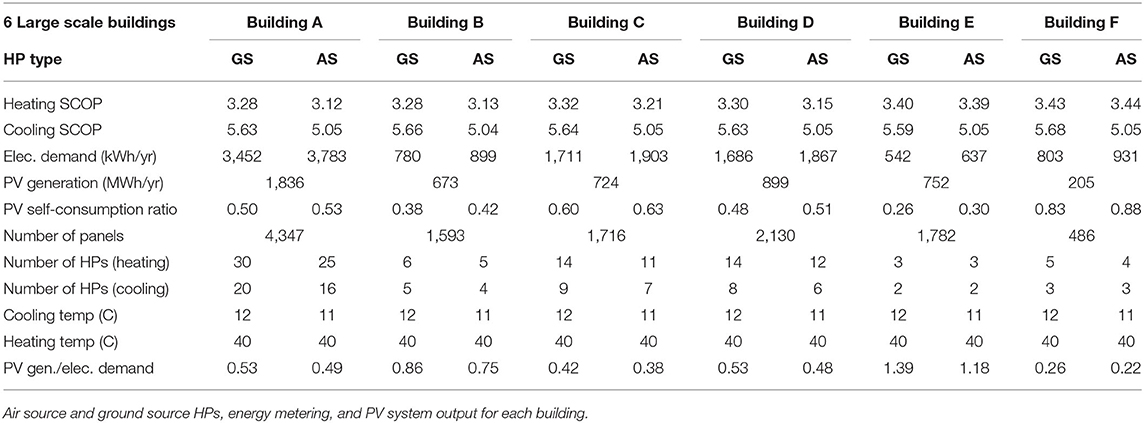
Table 5. UESM results summary.
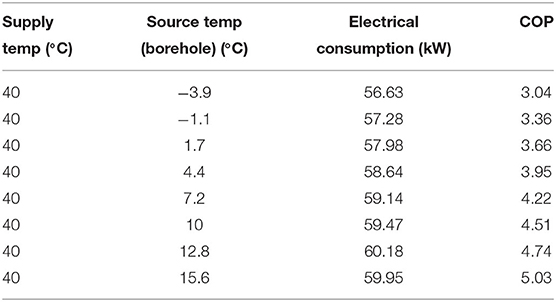
Table 6. W900 GSHP heating performance (Maritime Geothermal, 2018).
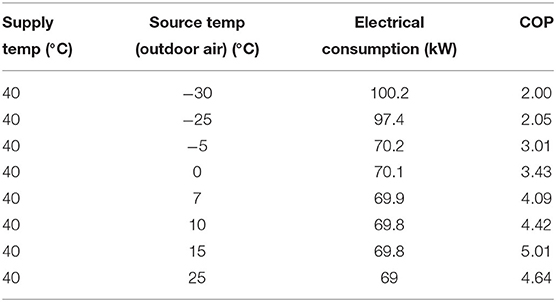
Table 7. CMAA 070 ASHP heating performance (Trane, 2015).
In the present study, due to the sizeable conditioned floor area of the buildings and limited space for PV panels as the only local renewable power generation system, not reaching energy positivity is a foreseeable outcome. The UESM result backed the claim above that low roof area to total floor area ratio plays a vital role in getting closer to energy-positive districts. Figure 8 shows that except for Building E, which has the smallest total floor area among all buildings, the AC electricity generated by PV is insufficient for covering HP's electricity demand. The higher the floor number in a building, the smaller the relative contribution of roof PV generation to the buildings' energy consumption.
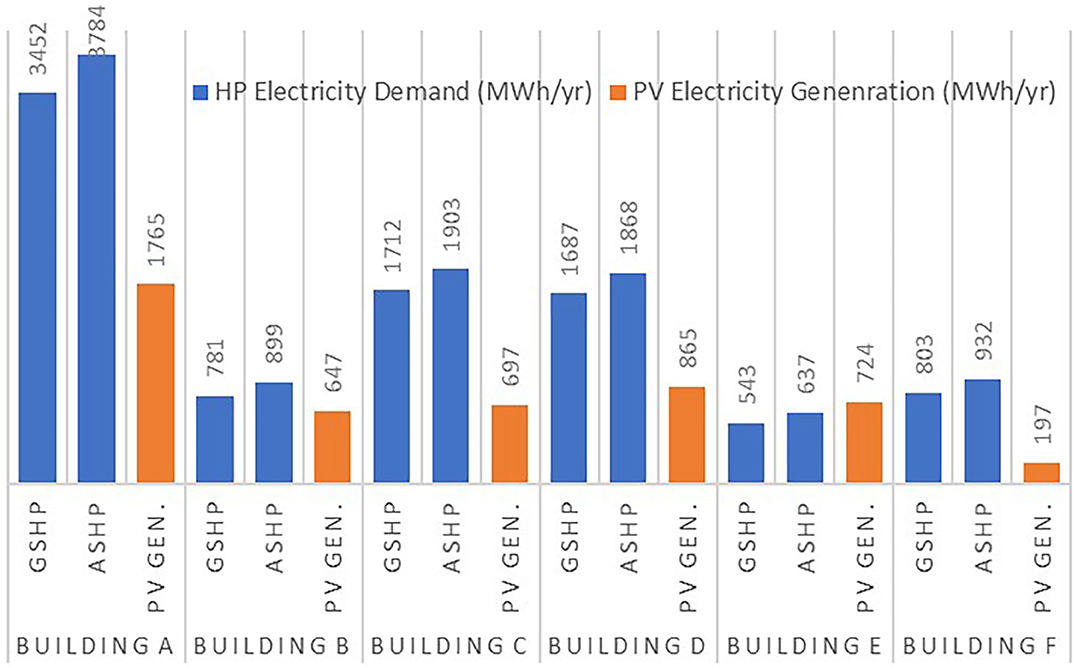
Figure 8. HP total electricity demand vs. AC electricity generated by on-site PV system.
For the HP system, in most time steps the number of operating HPs, consequently, the HPs heat generated is greater than the demand values, as it was designed for maximum load conditions. Thus, the system is not optimized regarding cost or energy efficiency on the system level, as the paper's focus is on introducing an automatized simulation workflow merely.
Although the result of case studies are not necessarily comparable or interchangeably usable for result validation, the study by Xu et al. (2020), due to the similarity of context, is interesting. They studied a 108-ton air source HP system in China's severe cold region (similar weather to Montreal) with a supply temperature of 36°C. They calculated HP's COP and electricity demand to be 3.2 and 10.65 kWh/m2yr, respectively, compared to 3.24 and 22.12 kWh/m2yr in this study. It should be noted that the difference in HP annual electricity demand is entirely compatible with the difference in the heating energy demand of both studies (34.10 and 72 kWh/m2).
Energy-related parameters should be investigated carefully to identify any possible barriers to achieving higher energy efficiency. Parameters such as heating and cooling SCOPs, HPs electricity demand, electricity to/ from grid, and PV self-consumption ratios are considered key performance indicators to UESM. Moreover, in some cases, there might be a restriction that can affect the whole design concept. For instance, having an upper limit for electricity exporting to the grid can be interpreted as a definite need for adding battery storage.
There are some pros and cons associated with each choice in a more focused comparison between two types of HPs. Since the GSHPs heat is mostly provided by boreholes, wells, lakes, or underground water, a GSHP typically has higher source temperature levels than ASHPs. The latter depend on outdoor air temperature, which can be as harsh as −30°C under Canadian conditions. As a result, ASHP needs a significantly higher compression ratio to transfer heat from the outdoor air to the condenser, especially in cold climates such as the case study location, leading to higher electricity consumption and lower COP than GSHPs. The technology improvements and innovations should not be taken for granted as a few years ago, ASHPs could only work down to −8°C, and using ASHPs in cold climates was not a standard option.
Air source heat pumps are generally more sophisticated equipment, with more power and costlier. On the other hand, there are costs associated with GSHPs such as drilling, piping, heat exchanger, or pumps, which might change the balance of cost between two systems. The number of ASHPs and GSHPs required in different buildings shows that the lower number of equipment can be counted toward ASHP systems' advantage.
Developing an integrated UBEM and UESM is a challenge due to the difference in their spatial and temporal input, output, and calculation process resolution. The developed UBEM model was designed to be highly flexible in terms of its temporal and spatial input and output resolution. This flexibility gives the capability to the UBEM to provide suitable input in any temporal and spatial resolution for UESM. As the proposed UESM requires hourly heating and cooling demand for each thermal zone and the whole district, the UBEM can correctly provide these inputs. The resolution of the UBEM heating and cooling demand results can spatially alter the fine-grained resolution, such as in thermal zones scale, to the low resolution of an entire building or a whole district. The temporal resolution can change between yearly to sub-hourly resolution. Although the proposed UBEM uses archetypes for some input parameters, analyzing the heating and cooling demand of UBEM was correlated to the real geometry, building total floor area, and building use-type of the district Lachine. On the other hand, using highly accurate and the same building geometry resolution for renewable potential calculations, the combined UBEM and UESM can calculate the heating and cooling demand and size of different energy systems in any spatial and temporal resolution.
In the current case study, compact, rectangular-shaped buildings with high thermal insulation levels are an excellent start, but not enough toward having a positive energy district. Even though there are always site limits that constrain architects and urban planners' abilities, changing some buildings' orientation so that the longer side faces south could have a significant impact on decreasing the heating demands. Also, in projects with large areas, it can be good practice for implementing innovative ideas like dedicating areas to small urban farms on the site, which reduces food-related transportation energy demands. The residue could be used as an input for biofuel production.
From the energy efficiency point of view and considering the proposed geometry's size and scale, reaching the zero-energy goal with local photovoltaics sounds unattainable, let alone positive energy. Using 65% of the roof area for PV installation and using HPs with high-efficiency ratings are the only measures put into the design process. Although this paper's focus differs from optimization or defining a more detailed energy system design process, a number of improvements out of many are discussed. For instance, adding thermal storage could be beneficial for the system due to the excessive heat generated in each time step (referring to HP section), which lowers the number of HPs required for meeting demands in subsequent hours and, consequently, the HPs electricity demand. Moreover, properly sized battery storage improves the PV self-consumption ratios. It helps the system to meet the upper limit for electricity export to the grid, if there are any. A cost-benefit analysis of the system would be essential for the system, knowing the high cost of batteries and thermal storage systems.
Regarding the energy systems design, using lower heating temperature for heating (40°C) instead of conventional values of up to 60°C or higher is a smart choice that not only can meet the expectations but also increases both energy and exergy efficiencies and lowers heat losses. Adding heat-recovery equipment in the ventilation process could be a significant improvement for lowering heating and cooling demands and associated electricity consumption. The other point that could not go unnoticed is the HP system sizing that needs improvement. Other than sizing based on the maximum demand, a lower percentile like 98% could be a smarter choice. It means that the system is currently sized for 100% of a year's hours and results in the system oversizing for 8,585 h of a year. By designing for lower percentiles, which can be done in either the demand calculation step (UBEM) or limiting the number of HPs (UESM), considerable savings can be achieved.
Decarbonization of the urban area acquires the maximum renewable energy and considers the energy demand reduction measures. This work described a novel workflow integrating an urban building energy simulation module accompanied by an urban energy system simulation model. Combining the UBEM and UESM models allows this opportunity to dynamically predict the district energy demand, calculate the renewable energy systems capacity, and sizing energy systems. To have a compatible UBEM and UESM, the UBEM is designed to be highly flexible capable of calculating the heating and cooling demand in any spatial and temporal resolution. The developed model was tested on a case study, a future district in Montreal, Canada. The heating and cooling demand were simulated at the building and district levels and used as input to the UESM model to size the energy systems. It was shown that reaching the zero-carbon goals requires applying stricter constraints on design parameters. Moreover, owners, planners, and designers ought to illustrate realistic goals for each project. For instance, in the Lachine-East case study, considering the buildings' size and scale made reaching carbon neutrality on a local scale almost impossible given the available renewable resources. Nevertheless, implementing some green and sustainable design strategies could mitigate climate impact and GHG emissions. It is of great importance to distinguish between the PV self-consumption ratio and the net value of HPs' electricity demand covered by local PV production. Table 5 and Figure 8 show that in small buildings like Building E, local PV produces 75–100% of the HP electricity demand, while this value for larger buildings like Building C can be as low as 38%. The proposed integrated workflow promotes advantages including, but not limited to, accurate demand calculations in complex geometries from building scale to urban areas, autonomous PV system sizing and PV potential calculation, HPs system sizing, and energy metering. However, adding a feedback loop in the sense that makes the workflow dynamically update and optimize the demand calculation parameters will bring a much more efficient and sustainable tool to the table.
The raw data supporting the conclusions of this article will be made available by the authors, without undue reservation.
SR, HR, and SD: introduction. BS, SD, AS, and SS: methodology. SS, BS, and SD: formal analysis. AS: geometry. SD, BS, HR, SR, and SS: writing—original draft preparation. UE: writing—review and editing and supervision. All authors contributed to the article and approved the submitted version.
The authors declare that the research was conducted in the absence of any commercial or financial relationships that could be construed as a potential conflict of interest.
Aguilar, F., Crespí-Llorens, D., and Quiles, P. V. (2019). Techno-economic analysis of an air conditioning heat pump powered by photovoltaic panels and the grid. Sol. Energy 180, 169–179. doi: 10.1016/j.solener.2019.01.005
Arpagaus, C., Bless, F., Uhlmann, M., Schiffmann, J., and Bertsch, S. S. (2018). High temperature heat pumps: market overview, state of the art, research status, refrigerants, and application potentials. Energy 152, 985–1010. doi: 10.1016/j.energy.2018.03.166
Chowdhury, A. A., Rasul, M. G., and Khan, M. M. K. (2016). “Parametric analysis of thermal comfort and energy efficiency in building in subtropical climate,” in Thermofluid Modeling for Energy Efficiency Applications, eds M. M. K. Khan and N. M. S. Hassan (Cambridge, MA: Academic Press), 149–168. doi: 10.1016/B978-0-12-802397-6.00007-5
Dominković, D. F., Bačeković, I., Cosić, B., Krajačić, G., Pukšec, T., Duić, N., et al. (2016). Zero carbon energy system of South East Europe in 2050. Appl. Energy 184, 1517–1528. doi: 10.1016/j.apenergy.2016.03.046
Eicker, U., Schumacher, J., Brennenstuhl, M., and Weiler, V. (2020a). “SWC 2019 renewable energy supply concepts for next generation cities using the integrated urban modeling platform INSEL 4D,” in Proceedings of the ISES Solar World Congress 2019 and IEA SHC International Conference on Solar Heating and Cooling for Buildings and Industry 2019 (Santiago), 2479–2487. doi: 10.18086/swc.2019.51.02
Eicker, U., Weiler, V., Schumacher, J., and Braun, R. (2020b). On the design of an urban data and modeling platform and its application to urban district analyses. Energy Build. 217:109954. doi: 10.1016/j.enbuild.2020.109954
Ferrando, M., and Causone, F. (2020). “An overview of urban building energy modelling (UBEM) tools,” in Proceedings of Building stimulation 2019: 16th IBPSA International Conference and Exhibition (Rome), 3452–3459. doi: 10.26868/25222708.2019.210632
Fonseca, J. A., Nguyen, T. A., Schlueter, A., and Marechal, F. (2016). City Energy Analyst (CEA): integrated framework for analysis and optimization of building energy systems in neighborhoods and city districts. Energy Build. 113, 202–226. doi: 10.1016/j.enbuild.2015.11.055
Government of Canada (2020). CER – Canada's Energy Future 2020. Available online at: https://www.cer-rec.gc.ca/en/data-analysis/canada-energy-future/2020/index.html (accessed March 9, 2021).
Green, A. (2018). Why a Feasibility Study is Your First Step Towards a Successful Building Project. New York, NY: Amy Green Design.
Gröger, G., Kolbe, T., Nagel, C., and Häfele, K.-H. (2012). “OGC City Geography Markup Language (CityGML) en-coding standard,” in Ogc, 1–344. Available online at: http://www.opengeospatial.org/legal/ (accessed January 25, 2021).
Halil, F. M., Nasir, N. M., Hassan, A. A., and Shukur, A. S. (2016). Feasibility study and economic assessment in green building projects. Proc. Soc. Behav. Sci. 222, 56–64. doi: 10.1016/j.sbspro.2016.05.176
Happle, G., Fonseca, J. A., and Schlueter, A. (2018). A review on occupant behavior in urban building energy models. Energy Build. 174, 276–292. doi: 10.1016/j.enbuild.2018.06.030
Hesaraki, A., Ploskic, A., and Holmberg, S. (2015). Integrating low-temperature heating systems into energy efficient buildings. Energy Proc. 78, 3043–3048. doi: 10.1016/j.egypro.2015.11.720
Hong, T., Langevin, J., and Sun, K. (2018). Building simulation: ten challenges. Build. Simul. 11, 871–898. doi: 10.1007/s12273-018-0444-x
HPTCJ (2010). Survey of Availability of Heat Pumps in the Food and Beverage Sector. Available online at: http://www.hptcj.or.jp/e/publication/tabid/360/Default.aspx (accessed January 10, 2021).
Hsieh, S., Omu, A., and Orehounig, K. (2017). Comparison of solar thermal systems with storage: from building to neighbourhood scale. Energy Build. 152, 359–372. doi: 10.1016/j.enbuild.2017.07.036
Huang, S., Zuo, W., Lu, H., Liang, C., and Zhang, X. (2019). Performance comparison of a heating tower heat pump and an air-source heat pump: a comprehensive modeling and simulation study. Energy Convers. Manag. 180, 1039–1054. doi: 10.1016/j.enconman.2018.11.050
Jesper, M., Schlosser, F., Pag, F., Walmsley, T. G., Schmitt, B., and Vajen, K. (2021). Large-scale heat pumps: uptake and performance modelling of market-available devices. Renew. Sustain. Energy Rev. 137:110646. doi: 10.1016/j.rser.2020.110646
Johari, F., Peronato, G., Sadeghian, P., Zhao, X., and Widén, J. (2020). Urban building energy modeling: state of the art and future prospects. Renew. Sustain. Energy Rev. 128:109902. doi: 10.1016/j.rser.2020.109902
Kim, Y. J., Yoon, S. H., and Park, C. S. (2013). Stochastic comparison between simplified energy calculation and dynamic simulation. Energy Build. 64, 332–342. doi: 10.1016/j.enbuild.2013.05.026
Lee, S. (2018). An overview of the european technical guidelines for the prevention, control and investigation of infections caused by Legionella species. Perspect Public Health 138, 241–247. doi: 10.1177/1757913918790922
Li, P., Nord, N., Ertesvåg, I. S., Ge, Z., Yang, Z., and Yang, Y. (2015). Integrated multiscale simulation of combined heat and power based district heating system. Energy Convers. Manag. 106, 337–354. doi: 10.1016/j.enconman.2015.08.077
Lizana, J., Chacartegui, R., Barrios-Padura, A., and Valverde, J. M. (2017). Advances in thermal energy storage materials and their applications towards zero energy buildings: a critical review. Appl. Energy 203, 219–239. doi: 10.1016/j.apenergy.2017.06.008
Lund, H., Werner, S., Wiltshire, R., Svendsen, S., Thorsen, J. E., Hvelplund, F., et al. (2014). 4th Generation District Heating (4GDH). Integrating smart thermal grids into future sustainable energy systems. Energy 68, 1–11. doi: 10.1016/j.energy.2014.02.089
Lund, R., Ilic, D. D., and Trygg, L. (2016). Socioeconomic potential for introducing large-scale heat pumps in district heating in Denmark. J. Clean. Prod. 139, 219–229. doi: 10.1016/j.jclepro.2016.07.135
Maritime Geothermal (2018). Commercial W-Series and WH-Series Water to Water Heat Pumps - Installation and Service Manual.
Mohajeri, N., Assouline, D., Guiboud, B., Bill, A., Gudmundsson, A., and Scartezzini, J. L. (2018). A city-scale roof shape classification using machine learning for solar energy applications. Renew. Energy 121, 81–93. doi: 10.1016/j.renene.2017.12.096
Montr, S. (2020). Sustainable Montréal 2016-2020. Available online at: https://montreal.ca/en/articles/sustainable-montreal-2016-2020-8944 (accessed March 9, 2021).
Nordman, R., Kleefkens, O., Riviere, P., Nowak, T., Zottl, A., Arzano-Daurelle, C., et al. (2012). Seasonal Performance Factor and Monitoring for Heat Pump Systems in the Building Sector. SEPEMO-Final Report.
NREL (2018). Building Component Library. Natl. Renew. Energy Lab. Available online at: https://bcl.nrel.gov/ (accessed March 9, 2021).
Petkov, I., and Gabrielli, P. (2020). Power-to-hydrogen as seasonal energy storage: an uncertainty analysis for optimal design of low-carbon multi-energy systems. Appl. Energy 274:115197. doi: 10.1016/j.apenergy.2020.115197
Pilpola, S., Arabzadeh, V., Mikkola, J., and Lund, P. D. (2019). Analyzing national and local pathways to carbon-neutrality from technology, emissions, and resilience perspectives—case of Finland. Energies 12, 1–22. doi: 10.3390/en12050949
Pless, S., and Polly, B. (2018). Communities of the Future: Accelerating Zero Energy District Master Planning Preprint. Available online at: https://www.osti.gov/biblio/1470715 (accessed January 11, 2021).
Rao, S., Conant-Gilles, D., Jia, Y., and Carl, B. (2018). Rapid Modeling of Large and Complex High Performance Buildings Using Energyplus. in 2018 Building Performance Analysis Conference and SimBuild co-organized by ASHRAE and IBPSA-USA (Chicago, IL), 9–16. Available online at: https://www.ashrae.com/FileLibrary/Conferences/SpecialtyConferences/2018BuildingPerformanceAnalysisConferenceandSimBuild/Papers/C002.pdf (accessed January 25, 2021).
Reinhart, C. F., and Cerezo Davila, C. (2016). Urban building energy modeling - a review of a nascent field. Build. Environ. 97, 196–202. doi: 10.1016/j.buildenv.2015.12.001
Remmen, P., Lauster, M., Mans, M., Fuchs, M., Osterhage, T., and Müller, D. (2018). TEASER: an open tool for urban energy modelling of building stocks. J. Build. Perform. Simul. 11, 84–98. doi: 10.1080/19401493.2017.1283539
Rinne, S., and Syri, S. (2013). Heat pumps versus combined heat and power production as CO2 reduction measures in Finland. Energy 57, 308–318. doi: 10.1016/j.energy.2013.05.033
Signelković, A. S., Mujan, I., and Dakić, S. (2016). Experimental validation of a EnergyPlus model: application of a multi-storey naturally ventilated double skin façade. Energy Build. 118, 27–36. doi: 10.1016/j.enbuild.2016.02.045
Soutullo, S., Bujedo, L. A., Samaniego, J., Borge, D., Ferrer, J. A., Carazo, R., et al. (2016). Energy performance assessment of a polygeneration plant in different weather conditions through simulation tools. Energy Build. 124, 7–18. doi: 10.1016/j.enbuild.2016.04.031
Strzalka, A., Bogdahn, J., Coors, V., and Eicker, U. (2011). 3D City modeling for urban scale heating energy demand forecasting. HVAC R. Res. 17, 526–539. doi: 10.1080/10789669.2011.582920
Tabar, V. S., Hagh, M. T., and Jirdehi, M. A. (2021). Achieving a nearly zero energy structure by a novel framework including energy recovery and conversion, carbon capture and demand response. Energy Build. 230:110563. doi: 10.1016/j.enbuild.2020.110563
Thomaßen, G., Kavvadias, K., and Jiménez Navarro, J. P. (2021). The decarbonisation of the EU heating sector through electrification: a parametric analysis. Energy Policy 148:111929. doi: 10.1016/j.enpol.2020.111929
US DOE (2013). Commercial Prototype Building Models/Building Energy Codes Program. U.S. Dep. Energy. Available online at: https://www.energycodes.gov/development/commercial/prototype_models (accessed January 25, 2021).
Weiler, V., Stave, J., and Eicker, U. (2019). Renewable energy generation scenarios using 3D urban modeling tools-methodology for heat pump and co-generation systems with case study application. Energies. 12:403. doi: 10.3390/en12030403
Wiseman, J. (2018). The great energy transition of the 21st century: the 2050 zero-carbon world oration. Energy Res. Soc. Sci. 35, 227–232. doi: 10.1016/j.erss.2017.10.011
Xu, W., Liu, C., Li, A., Li, J., and Qiao, B. (2020). Feasibility and performance study on hybrid air source heat pump system for ultra-low energy building in severe cold region of China. Renew. Energy 146, 2124–2133. doi: 10.1016/j.renene.2019.08.079
Yazdanie, M., and Orehounig, K. (2021). Advancing urban energy system planning and modeling approaches: Gaps and solutions in perspective. Renew. Sustain. Energy Rev. 137:110607. doi: 10.1016/j.rser.2020.110607
Keywords: urban building energy modeling, urban energy system modeling, PV, heat pump, net zero carbon districts
Citation: Samadzadegan B, Samareh Abolhassani S, Dabirian S, Ranjbar S, Rasoulian H, Sanei A and Eicker U (2021) Novel Energy System Design Workflow for Zero-Carbon Energy District Development. Front. Sustain. Cities 3:662822. doi: 10.3389/frsc.2021.662822
Received: 01 February 2021; Accepted: 31 March 2021;
Published: 29 April 2021.
Edited by:
Cait Robinson, University of Liverpool, United KingdomReviewed by:
Edgar Antonio Barragán, Salesian Polytechnic University, EcuadorCopyright © 2021 Samadzadegan, Samareh Abolhassani, Dabirian, Ranjbar, Rasoulian, Sanei and Eicker. This is an open-access article distributed under the terms of the Creative Commons Attribution License (CC BY). The use, distribution or reproduction in other forums is permitted, provided the original author(s) and the copyright owner(s) are credited and that the original publication in this journal is cited, in accordance with accepted academic practice. No use, distribution or reproduction is permitted which does not comply with these terms.
*Correspondence: Ursula Eicker, dXJzdWxhLmVpY2tlckBjb25jb3JkaWEuY2E=
†These authors have contributed equally to this work
Disclaimer: All claims expressed in this article are solely those of the authors and do not necessarily represent those of their affiliated organizations, or those of the publisher, the editors and the reviewers. Any product that may be evaluated in this article or claim that may be made by its manufacturer is not guaranteed or endorsed by the publisher.
Research integrity at Frontiers
Learn more about the work of our research integrity team to safeguard the quality of each article we publish.