 Luis Gasco1
 Rossano Schifanella2,3*
 Luca Maria Aiello4
 Daniele Quercia4,5
 Cesar Asensio1
 Guillermo de Arcas1
- 1Universidad Politécnica de Madrid, Madrid, Spain
- 2Computer Science Department, University of Turin, Turin, Italy
- 3ISI Foundation, Turin, Italy
- 4Nokia Bell Labs, Cambridge, United Kingdom
- 5CUSP, King's College London, London, United Kingdom
Noise is considered the second factor after air pollution to impact citizens' health and well-being in densely populated urban areas, as it takes a heavy toll on the health of the circulatory and nervous systems. Traditionally, research on urban noise was conducted through surveys with a limited temporal and spatial coverage, and focused on a subset of the wide spectrum of sounds sources present in an urban environment. To overcome these limitations, we use geo-referenced social media images from Flickr to characterize the soundscape of London at scale. We build a model that uses socioeconomic variables, official noise exposure levels, and the soundscape estimated from social media to predict at area level the prevalence of hypertension—a cardiovascular condition that is widely studied in connection to high noise exposure. We consistently observe that socioeconomic variables, such as age, gender, and income, play an important role in explaining hypertension rates. Official noise exposure levels add a relatively limited contribution in predicting the health outcome. On the contrary, the social media soundscape information considerably improves the model performance. This result speaks to the value of integrating social media data into strategic noise maps for enhancing their predictive power; it also hints at the fact that the presence (or absence) of specific types of sounds might be a better indicator of hypertension prevalence than noise levels themselves.
Introduction
More than two-thirds of the world's population will live in cities by 2050 (United Nations, 2018). A significant portion of the population shift is directed to large metropolitan hubs in the global economic market, as they provide greater opportunities to their citizens for professional and social development (Sassen, 1991). Population growth is bringing key challenges to policy makers. For example, the rise in rental prices, partly due to the proliferation of short-term rentals (Wachsmuth and Weisler, 2018; Urquiaga et al., 2020) and the increasing cost of living in city centers (Andersson and Turner, 2014; Florida, 2017) have accelerated the process of gentrification. Over the years, the need of long-range commute within the city and the increased number of private vehicles on the streets heavily interfered with the implementation of effective policies for a better spatial organization of our cities and in the deployment of effective road infrastructures and public transportation services (Wallsten, 2015; Barthelemy, 2016). Consequently, traffic congestion and the increase in the environmental pollution have become one of the most important challenges for politicians and planners due to its connection to quality of life and health outcomes.
Noise is considered the second threat after air pollution that most affects our health and well-being in densely populated urban areas (European Environment Agency, 2014). Noise pollution is a health hazard that is connected to the circulatory and nervous systems. Cross-sectional studies based on surveys conducted on population samples in different cities around the world have shown a possible association between noise exposure and the prevalence of hypertension (Leon Bluhm et al., 2007; Belojević et al., 2008; Barregard et al., 2009; Bodin et al., 2009; Dratva et al., 2011). However, cross-sectional research is known to have some limitations. One of them is the low number of participants in the studies, which makes it difficult to show the effects of noise on population health (Stansfeld et al., 2011). Additionally, many of the studies use subjective measures, such as self-reported noise levels, which are not always aligned with objective noise measurements for cardiovascular diseases (Schmit and Lorant, 2009; Mosca et al., 2013). These reasons, together with other research biases, might be the reason why there are differences in the results of the studies of urban noise on people's health (Sørensen et al., 2011; Van Kempen et al., 2018).
The impact of noise on health has led to the development of laws and regulations to control and reduce its presence. In 1996, the European Union (EU) published the Green Paper (European Parliament, 1996), a document containing policy proposals on how to mitigate the unwanted effects on noise in European cities. This document was the basis for the Environmental Noise Directive (END), which was adopted in 2002 as the general regulation for environmental noise management in Europe (European Parliament, 2002). The END defines a general framework to produce noise maps by adopting two noise indicators: night-time noise level (Lnight), which is the average sound pressure level during the night hours within the year, and day-evening-night noise level (Lden), which represents the average overall sound pressure level within the year. The current directive considers four main sources: industrial, aircraft, railway, and road traffic noise. The effect of these sources on population has been previously studied; however, there are a multitude of alternative sounds related to recreational activities that can be potentially linked to positive (Aletta et al., 2018) or negative (Asensio et al., 2018; Ottoz et al., 2018) effects on citizens well-being. The World Health Organization has recently published for the first time a document that provides guidelines to reduce the effect of leisure noise on citizens (World Health Organization, 2018).
Traditionally, research related to noise attitudes in cities was conducted through face-to-face surveys, in which citizens were asked about the presence of specific noise sources. Technological progress has made it possible to develop tools that facilitate this task, whether through online surveys (Silva et al., 2017) or large-scale crowdsourcing systems that allow noise levels to be measured and include questionnaires to characterize urban sounds (Radicchi, 2017). Advances in sound pattern recognition through deep neural networks and their incorporation into low-cost instrumentation have also enabled the detection of urban sounds through urban noise monitoring networks (Bello et al., 2019; Mydlarz et al., 2019). Additionally, with the widespread adoption of the Internet and social media, digital data has became a valuable source to characterize cities and to quantify their environmental dimension. By using geo-located picture tags from social media, Aiello et al. proposed a new methodology to capture the sensory layers of cities. By using social media data from 12 major cities around the world, they showed that it is possible to characterize at scale the smellscape (Quercia et al., 2015) and the soundscape (Aiello et al., 2016) of cities—namely the distribution of the typical categories of smells and sounds that a person would be likely to perceive in a given area. By capturing both pleasant and unpleasant perceptions, their approach expanded the negative perspective on sound and smell that was at the time predominant in urban planning, especially by contributing with knowledge that could lead to new approaches in the domain of noise and sound monitoring.
More recently, researchers have resorted to social media to detect and monitor urban phenomena. Gasco et al. proposed and developed a methodology to detect and classify noise complaints from Twitter by analyzing features from text, and they were able to measure the impact of events in cities in terms of noise perception (Gasco et al., 2017, 2019). Lorente et al. used location data from Online Social Networks to analyze how masses of people move during large events in cities (Lorente-Riverola and Ruiz-Sánchez, 2018).
Overall, research in this area has shown that one can use social media to model effectively the pulse of the urban life at a scale and granularity that would be hard to achieve with traditional methods. The contribution of this study is to assess the value of social media data in predicting hypertension rates in addition to traditional data sources of noise exposure and socio-economic factors. In contrast to cross-sectional studies, mostly based on surveys and small scale samples, we analyzed the whole territory of Greater London at the level of about one thousand census areas. We find that official noise exposure levels add a relatively limited contribution in predicting hypertension. On the contrary, the soundscape extracted from social media, understood as the presence of sound sources extracted from a visual platform such as Flickr, considerably improves the model performance. Our findings suggest that sound maps that incorporate social media information can better inform design policies than just considering maps of noise levels.
The rest of the manuscript is organized as follows. In Methods, we describe both the data sources we use in our analysis and the methodology to compute the hypertension rates, the noise exposure levels, the soundscape of an area and the socioeconomic confounding factors we exploit in a multivariate linear regression analysis. In Results, we present different models that combine noise exposure and area sound profiles estimated from social media data to predict hypertension at area level. In Discussion and Conclusions, we cover the impact and the limitations of our approach and lay out future directions of our work.
Methods
In the following, we describe: (1) the data sources used in the study; the methodology to compute, (2) the hypertension prevalence rates, (3) the noise exposure, and (4) the soundscape of all the MSOAs in the Greater London region. Then, we present the multivariate linear regression model we use to discover the factors that are more strongly associated with hypertension, our target variable.
Data
Next, we describe the data sources we gathered from open data platforms and social media to model noise and hypertension prevalence in the Greater London area. The different data sources do not always overlap in terms of their temporal span. However, we do not expect the data distributions to change significantly over time. The social media data we use spans several years, which allowed us to estimate an average soundscape profile that discounts seasonality and special events. Hypertension rates and noise exposure data are stable overtime and highly correlated from year to year. The spatial unit of our study is the Middle layer Super Output Areas (MSOA), that are 983 geographical areas for use in tabulating census and other statistical data in UK, with an average population of 8,346 inhabitants.
Drugs Prescriptions
Our primary source for information on health outcomes is the National Health Service1 (NHS), a collection of public healthcare providers and infrastructures that handle health care in UK. In this study, we focus on NHS England—one of the four agencies leading the healthcare system in each constituent country of the UK. To model drugs consumption, we refer to the general practice prescribing data2 that contains all medicines, dressings, and appliances that are prescribed and dispensed each month by the set of general practices (GPs) in England. For each practice, we keep track of the total number of items prescribed and dispensed aggregated by BNF codes. The British National Formulary (BNF) is a pharmaceutical reference book that contains a wide spectrum of information and advice on prescribing directives and pharmacology; it provides a taxonomy in which all medicines are organized in classes according the disease that they are intending to treat (EBM, 2018). To characterize the prevalence of hypertension, we considered the prescriptions of the full year 2014 and focused on the drug category 2.5 of the BNF taxonomy (“Hypertension and Heart Failure”). To compute drug consumption rates across spatial units, we refer to open statistics on the patients registered at a GP3. The dataset provides information on the geographical provenance, i.e., where patients come from aggregated by MSOA, along with gender and age distributions.
Noise
The Department for Environment, Food, and Rural Affairs4 (DEFRA) publishes strategic noise maps for urban areas with more than 100,000 inhabitants following the criteria specified in the Environmental Noise Directive (European Parliament, 2002). Strategic noise maps are calculated through by simulating how a noise source produced in different points of the city propagates in the surroundings. The simulation produces different measures of noise estimates for each cell of a mesh covering the full urban area. We considered the strategic noise maps available in the London area published in 2012, corresponding to road and rail sources5. We used the maps that represent the noise levels using the recommended descriptors of the European Union and defined in ISO 1996-2 (International Organization for Standardization, 2007). Specifically, we gathered the day-evening-night noise level (Lden), that quantify the equivalent noise level over the whole day, with a penalty of 5 dBA for evening noise and of 10 dBA for nighttime noise; and the night-time noise level (Lnight), that represents the noise level during the night period (usually between 22.00 and 07.00 h).
Socio-Demographic Statistics
The Office for National Statistics6 (ONS) is responsible for the census in England and Wales, and it is the provider of open data at several geographical aggregation levels on socio-economic, cultural and demographic variables as measured by the Census of Population, whose last update was performed in 20117. In our analysis, we control for three sociodemographic confounding factors that have been linked to cardiovascular diseases and hypertension by previous literature: age (Pinto, 2007), income (Kaplan et al., 2010; Keenan et al., 2011), and gender (Hayes and Taler, 1998). We adopt the age organization in classes from the census, grouping the population in three buckets of 0–44, 45–64, and more than 65 years old, respectively. All the statistics are spatially aggregated at the level of MSOAs.
Social Media
To characterize the soundscape of London, we used to the Flickr8 dataset published by the Chatty Maps project (Aiello et al., 2016). The dataset includes a random sample of 17M geo-referenced Flickr photos taken within the boundary of Greater London and uploaded between 2010 and 2015. Each photo in this sample is geo-referenced with the latitude and longitude of the place they have been taken, and comes with free-text tags added by the Flickr user who uploaded it. Users are denoted by an anonymized identifier.
Hypertension Rates
To characterize the incidence of hypertension we define the prescription rate rhypertension(m) as the number of items per patient prescribed in a timeframe of reference in each MSOA m. We assume that an area with a higher prescription rate for drugs curing hypertensions is a relevant proxy for the prevalence of that condition. The rate in an area m is defined as:
where ihypertension(m) is the total number of items prescribed to residents of the MSOA m (regardless of which practices are prescribing those items), and p(m) is the total number of patients living in MSOA m. We compute ihypertension(m) as:
where ihypertension(g, m) is the number of items prescribed by the practice g to someone living in the MSOA m. Unfortunately, we can't directly measure the quantity ihypertension(g, m); however, we hypothesize that the number of items prescribed in a GP is uniformly distributed according to the patients geographical provenance. Therefore, we define:
where p(g, m) represents the number of patients registered at the practice g and living in the MSOA m as derived from the patients provenance dataset. To compute the rate of drugs curing hypertension in a practice rhypertension(g) we use the relation:
Let p(g) be the total number of patients registered at the practice g:
we are able to derive an estimate of the prescription rate at the level of a spatial unit m. Figure 1 shows the spatial distribution and the probability distribution of the quantity rhypertension(m).
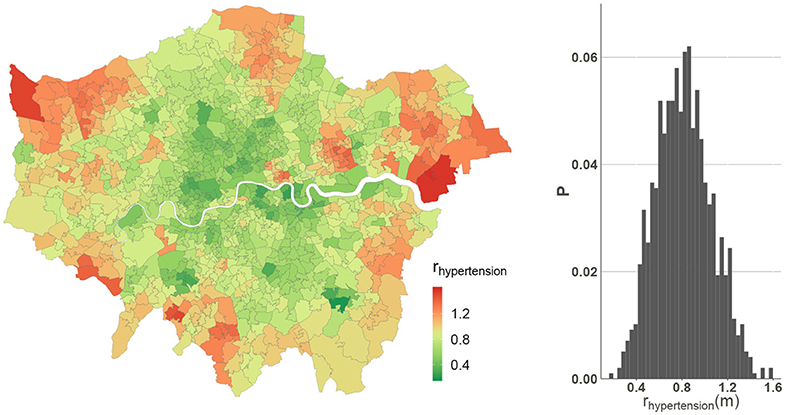
Figure 1. Hypertension rates in London MSOAs. (Left) Spatial distribution; (Right) Probability distribution.
Noise Exposure
Data on the population's exposure to noise are usually presented in an aggregated format together with the noise maps. Nevertheless, we need that information for each area of London, hence we define a method for estimating it.
This method uses the geo-spatial layers of the London noise map, as well as the MSOAs boundaries and the residential buildings present in the city, both available in the London Datastore9. Considering those data sources, the methodology comprises three steps:
• Calculate the exposed area of residential buildings to different noise levels through a spatial intersection between the noise map and the residential terrain within each MSOA.
• From the total residential area in each MSOA and the areas exposed to each noise level, calculate the percentage of dwellings exposed to the different noise levels in each MSOA
• Assuming that the population of each MSOA lives equally distributed within residential areas, calculate the percentage of people exposed to noise levels. Although the population exposed to noise is usually given in numerical terms, we calculated it in percentage terms because it allows us to compare the impact of noise between areas regardless of their population.
Based on the WHO guidelines on the potential effects of noise on the cardiovascular system (Berglund et al., 1999; Hurtley, 2009), we considered the percentage of people exposed to a day-evening-night road track noise level over 55 dB (RD.Lden.over55) and the percentage of people exposed to a day-evening-night railway noise level over 55 dB (RL.Lden.over55). Figure 2 shows the percentage of the population exposed to more than 55 dB for road and railway noise.
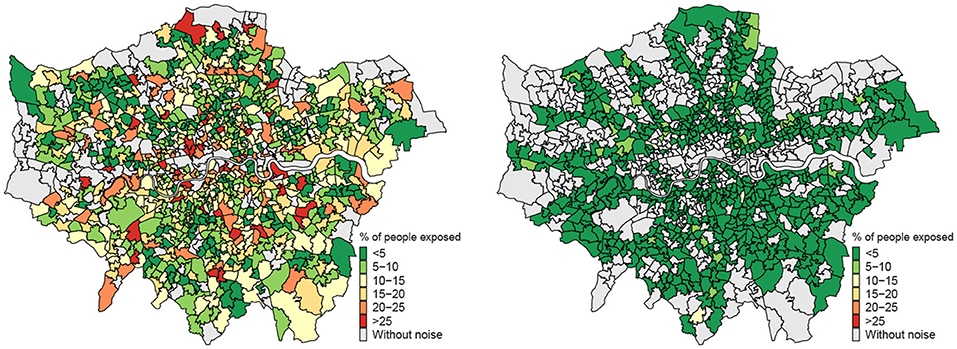
Figure 2. Spatial distribution of percentage of people exposed to noise.
Noise exposure calculations refer to outdoor spaces. However, citizens spend part of their time in their homes, which, depending on the dwellings' quality of construction, will provide a better insulation from outside noise and therefore a possible decrease in hypertension. To account for this factor into our models, we calculated the buildings' Energy Efficiency index EEbuilding. This index is calculated using the domestic energy performance certificates provided by the UK Ministry of Housing, Communities and Local Government through a public API10. These certificates have a numerical index between 0 and 100 that indicates the energy efficiency of the property considering the type of window installed and the quality of construction of the façade. We gathered all the available certificates in Greater London, and we computed the average domestic energy performance index per MSOA with the certificates in each area. The spatial distribution of this index is shown in Figure 3.
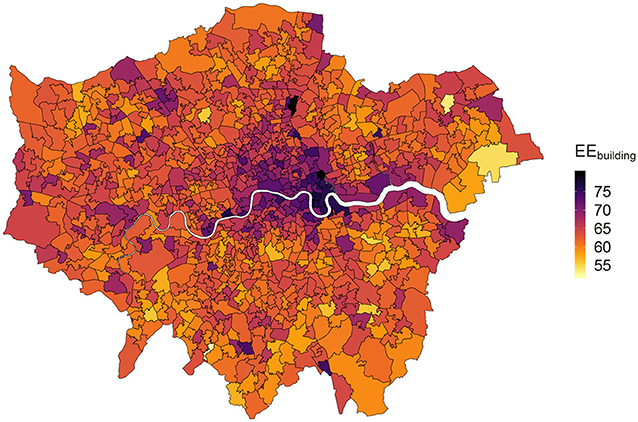
Figure 3. Map of the average energy efficiency index in London MSOAs.
Sound Profile
Strategic noise maps in cities capture noise from road and trains sources. Since the incidence of health conditions due to noise exposure could be potentially traced back to a wider spectrum of sound sources, we refer to social media to characterize the soundscape London areas. To estimate the presence of different types of sound sources from social media data, we use the approach proposed by Aiello et al. (2016). They first compiled a list of words that represent sound sources taken from Murray Schafer's seminal book “The Soundscape” (Schafer, 1993), an influential work that defined the concept of urban soundscape. Based on the co-occurrences of these words in picture tags from social media, they were able to arrange them in a taxonomy of urban sounds in which similar sounds are grouped together. This taxonomy has six top-level categories which match those discussed by Schafer: transport (e.g., sounds generated by cars, trains, and airplanes), mechanical (e.g., drills or other heavy mechanical devices), human (e.g., chatting or footsteps), music (e.g., street bands), nature (e.g., water, foliage, animals), and indoor (e.g., shower, office paper, or sounds typically generated inside buildings).
Specifically, sound words share the same taxonomic category if they have a high semantic similarity, estimated from the frequency of these sound words in Flickr pictures. Sometimes, this data-driven taxonomy groups sets of sounds by their context, rather by their source type. For example, the mechanical sounds from a typewriter or a printer are semantically more similar to “indoor” sounds (e.g., leafing through a paper document or flushing a toilet) than to other “mechanical” sounds that are mainly found in other contexts (e.g., the pounding sound of a jackhammer). Similarly, showering, playing an instrument or driving a car are all “human” activities, but none of them are categorized under the “human” class, as they are respectively “indoor,” “music,” and “transport”; instead, “human” sounds are mostly those that the human body can produce unaided (e.g., footsteps, talking, laughing). Naturally, alternative sound taxonomies are conceivable, but we decided to rely on Aiello et al.'s because it is theoretically-grounded and validated.
This taxonomy can then be applied to geo-referenced social media data to estimate the typical sounds of an area; the underlying idea is that if many pictures taken within an area are tagged with words belonging to a given sound category, that area will likely be characterized by that sound. In their experimental validation using Flickr picture tags in London, Aiello et al. provided evidence to support the validity of this estimation; for example, they showed that the vast majority of retrieved pictures do actually represent sound sources, and that the sound profiles they compute in bounding boxes around streets in London correlate with noise levels in expected ways. In recent years, this data-driven taxonomy has become a common reference for studies on noise and urban sounds (Kang et al., 2016; Zuo et al., 2016; Fairbrass et al., 2017).
This approach has a few working assumptions. First, the social media data considered should be geo-salient, meaning that it should be relevant to the geographical area corresponding to its geo-location. Some social media sources are by nature more geo-salient than others. For example, Twitter is not highly geo-salient because the content of a geo-referenced tweet might often unrelated with the location of the poster (e.g., people tweeting from their homes about a public demonstration happening in a different city). On the contrary, photo-sharing platforms tend to be geo-salient because the tags attached to the pictures are usually describing the picture itself, which is literally a depiction of the space around the geographic coordinates attached to the photo. This is why, like in the original approach (Aiello et al., 2016), we chose Flickr as a data source. Second, this method works effectively only on aggregate for areas that contain an abundant volume of data—as any approach based on collective intelligence applied to the urban context (Chatzigiannakis et al., 2011). This why, as we will detail next, we focused only on areas with large numbers of geo-referenced pictures.
We follow this methodology by first associating each Flickr photo to the MSOA whose boundaries contain its geographical coordinates. For each sound category c and MSOA m, we model the prevalence that sound category in the area as:
where the numerator represents the number of pictures that contain at least one tag from sound category c in the area m and the denominator counts the number of pictures that refer to any sound experience. The result of this step is creation of a 6-dimensional vector for each MSOA that models the prevalence of each sound category in an area. Figure 4 shows the predominant sound type in a MSOA and their distribution. Note that natural and transport sounds are more predominant in the periphery and the inner city is characterized often by sounds related to humans and music. White areas are spatial units with a low coverage (<100 pictures related to sound categories) that consequently are filtered out from our analysis.
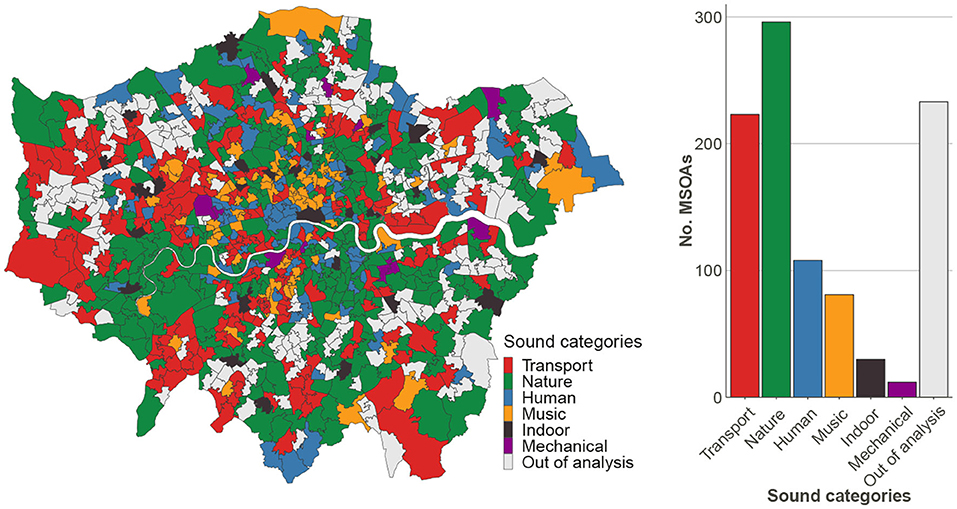
Figure 4. (Left) Map of the prominent sound category in each MSOA. (Right) Frequency distribution of dominant sounds across areas. In gray, areas with low social media coverage.
London is a global financial hub characterized by high population density and a tremendous tourists flow that is concentrated in specific areas of the city. A photo sharing platform as Flickr reflects this unequal spatial distribution of activity that results in a high heterogeneity between central and peripheral MSOAs. To take into account this effect, we estimate the social media platform penetration rate as:
where prFlickr(m) is the ratio between the number of unique Flickr users who posted at least one photo in MSOA m and its population from the census. High photo density is an indicator of a place interestingness, for example because of its scenicness or historic value (Serdyukov et al., 2009). In this direction, a high penetration rate could also be linked to non-acoustic factors that affect noise annoyance (Asensio et al., 2017) and that may have an effect on health outcomes.
Analysis of Correlates
We use multivariate linear regression to determine to what extent the soundscape estimated from social media is related to health outcomes and how it may improve traditional models; in particular, we focus on hypertension that has been connected in the literature as a disease aggravated by noise. In Table 1, we summarize the list of dependent variables used in the study.
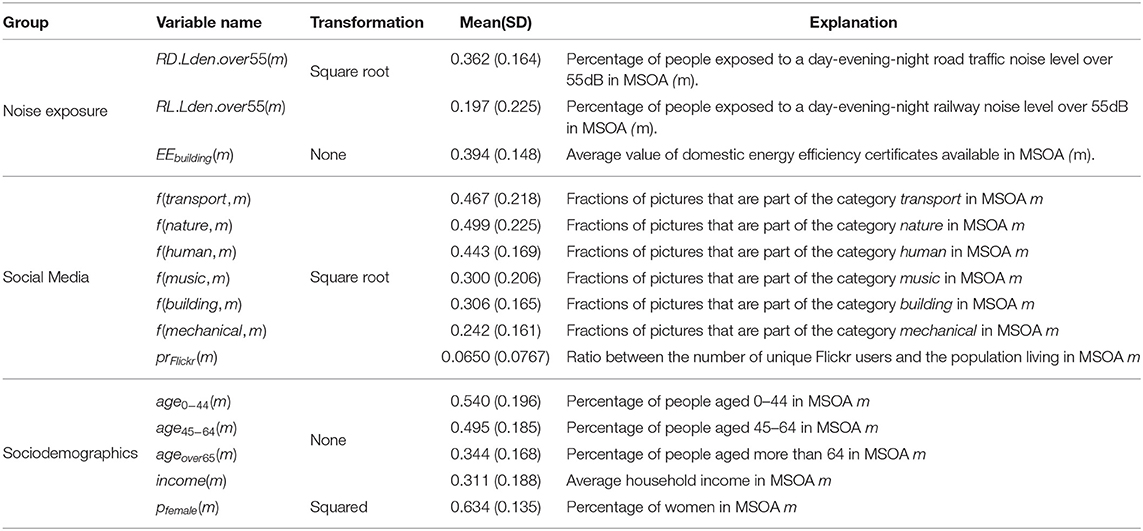
Table 1. Summary of the variables used in the multivariate linear regression model to characterize the prevalence of hypertension in London MSOAs.
Previous work consistently showed how economic status might affect the prevalence of several types of diseases of the circulatory system (Kaplan et al., 2010; Keenan et al., 2011). To account for this confounding factor and to perform our analysis across homogeneous samples, we group London MSOAs in three economic classes following the approach implemented in several studies that looked at the relationship between pollutants and health outcomes (Richardson et al., 2013; Deguen et al., 2015; Fecht et al., 2015). To define the economic boundaries of these three classes we used the updated values defined at the Great British Class Survey (Savage et al., 2013). This study originally identified seven economic classes which we regrouped into three to comply with the methodological specifications of similar studies: a High class containing MSOAs with a yearly average household income greater than 68k pounds, a Middle class with average income between 33k and 68k, and a Low class with income <33k. Figure 5 (left) shows the spatial distribution of the MSOAs color-coded according to their economic class. The distribution of different sound categories for each class is presented in Figure 5 (right). Lower income areas are characterized by a predominant portion of transport-related sounds, whereas human, natural, and music sounds are more frequent in areas with higher economic status.
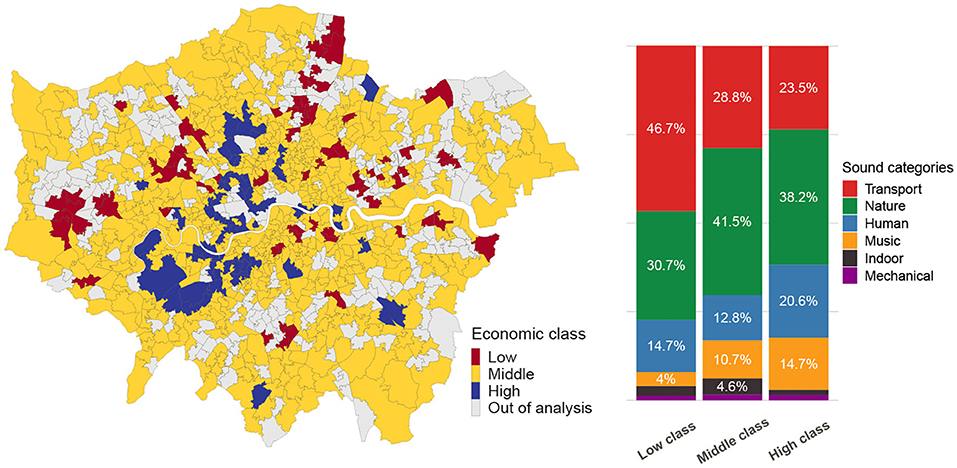
Figure 5. (Left) Spatial distribution of the socioeconomic classes in London MSOAs. (Right) Distribution of the predominant sound categories for each social class.
We build a model for each economic class and we applied different transformation to our variables (Table 1) to make their distributions normal. We then apply a min-max normalization to all the features to ease the interpretation of the regression coefficients.
We perform our analysis in three steps. First, we calculate the control models including only the sociodemographic variables that we use as a baseline to measure the explanatory effect of the rest of the variables. Then, we recalculate the models incorporating the noise exposure variables to verify whether they are significant and their relevance in the model. Finally, we incorporate the social media variables to check if they allow us to better predict the outcome variable.
Results
Next, we present the results of the regression tasks grouped by economic class.
Low-Income Areas
The 72 MSOAs belonging to the lowest economic income group are mainly located in the North and West part of London (Figure 5, left). Age, gender, and income are important explanatory variables. This is true in the low class model (Table 2) as well as for all the other models. In line with previous literature, areas with higher population aged 65 and over (Anderson et al., 1999; Buford, 2016) and with more males (Hayes and Taler, 1998) show higher hypertension prevalence. Income correlates with better healthcare and healthier habits, that have been shown to have a significant impact on cardiovascular diseases (Kaplan et al., 2010; Keenan et al., 2011; Aiello et al., 2019). When adding the noise exposure and energy efficiency variables, we observe a 9% increase in the adjusted R2 (from 0.268 to 0.291). The only other significant variable is the energy efficiency EEbuilding. The higher construction quality of dwellings leads to an improved sound insulation technology and general construction standards that could explain the lower hypertension incidence rate. The noise variables are not significant and the absolute value of their coefficients is small, compared to others in the same model.
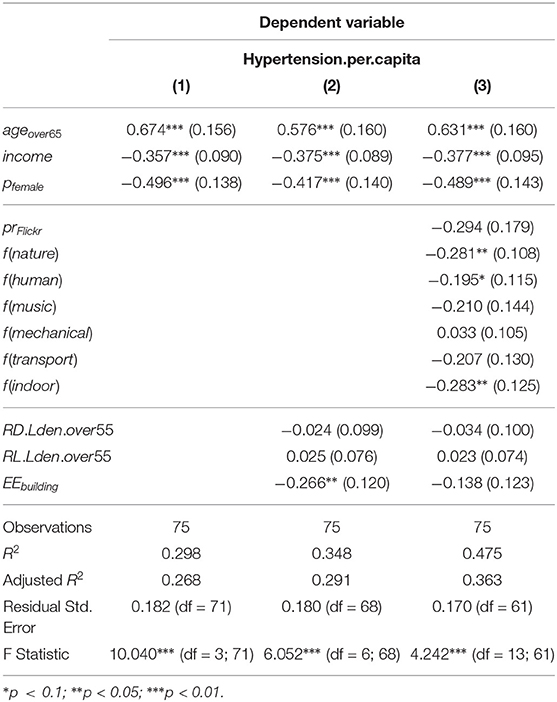
Table 2. Low-income areas results.
When adding soundscape variables from social media, the model achieves the best performance in terms of adjusted R2 (0.363), with an increase of 35% over the socio-demographic baseline. The presence of natural sounds is negatively associated with hypertension prevalence, which is in line with the research hypotheses in the field of soundscapes (Aletta et al., 2018). This is also true for sounds typical of human and indoor activity. According the sound taxonomy from Aiello et al., indoor sounds correspond to activities typical of familiar contexts in either home or office—usually soft background sounds. Indoor sounds are not necessarily “relaxing” as those produced by natural elements; yet, if indoor sounds are predominant in an area, it might be an indicator that the area is denoted by a rather quiet sound ambiance that is not plagued by sounds that are more harmful to the human body.
To shed light on the relative importance of the regressors in the linear models, we apply the lmg method (Lindeman et al., 1980). This method provides the relative contribution of each predictor to the R2 in a multivariate linear regression model. Table 3 shows the results for the low-income areas. Socio-demographic variables explain the highest portion of variance across models. Among the social media variables, Flickr penetration, nature, and indoor the three most important ones.
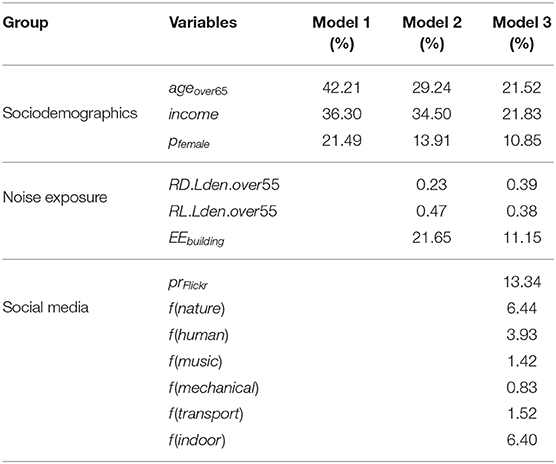
Table 3. Relative variable importance for the Low-class models.
Middle-Income Areas
The middle class represents the majority of London's MSOAs, for a total of 547 areas. Table 4 summarizes the output of the regression task across models. Similar to the low-income class, socioeconomic covariates of age, gender, and income are significant; the baseline model reaches an adjusted R2 of 0.278. The addition of the noise exposure variables increases the R2 to 0.305. The energy efficiency and the road noise are two significant predictors. Unexpectedly, the road noise has a negative coefficient, yet with a low absolute value.
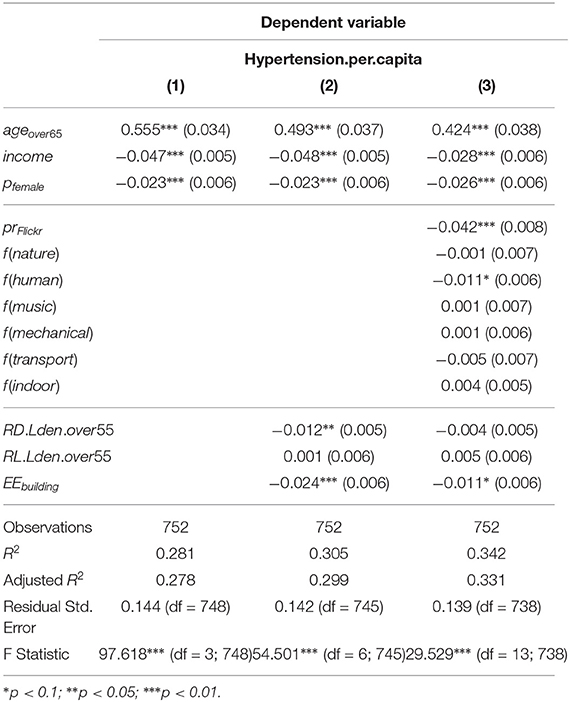
Table 4. Middle income areas results.
The social media model increases the R2 by 22% compared to the socio-demographic baseline. The Flickr penetration is the strongest significant variable. Like in the low class, human-related sounds are associated with arras characterized by lower hypertension levels.
The analysis of variable importance (Table 5) confirms the central role of socioeconomic regressors. Flickr penetration constitutes also a strong signal in the social media model.
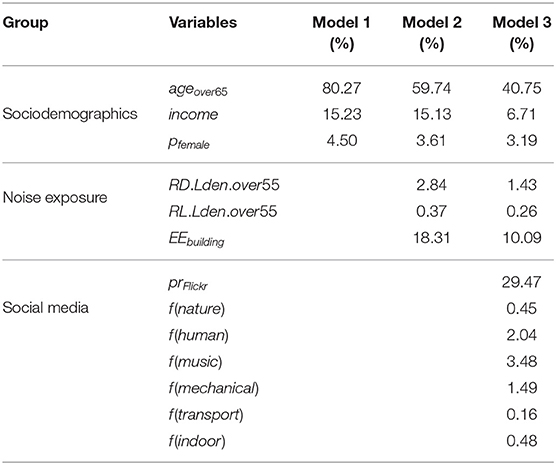
Table 5. Relative variable importance for the Middle-class models.
High-Income Areas
In the 67 high-income London MSOAs, the addition of the noise variables on top of socio-economic factors slightly decreases the performance of the model and yields no new significant regressors (Table 6). The model that includes both noise exposure and social media variables increases the R2 by 74% compared to the socio-demographic baseline, with significant coefficients for indoor sounds and, unlike previous models, for mechanical sounds too. The presence of mechanical sounds, e.g., industrial and work-related sounds emitted by tools and machinery performing tasks like hammering or drilling, is positively associated with higher prevalence of hypertension. The feature importance analysis shows that mechanical sounds are among the most important predictors of the outcome (Table 7).
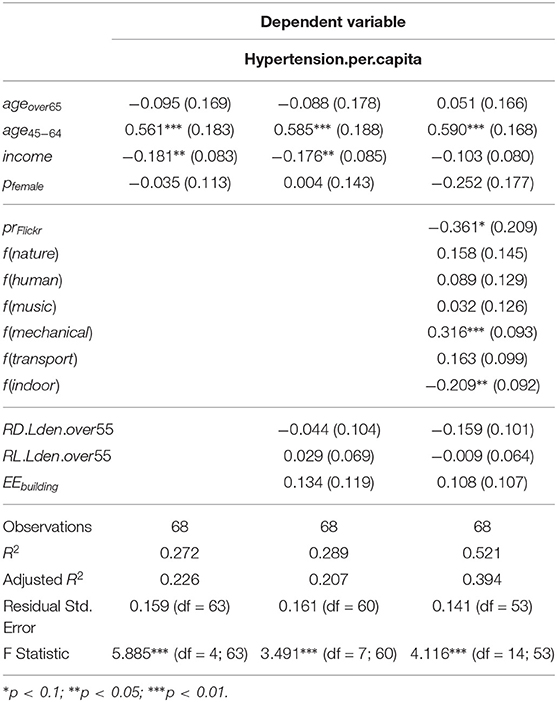
Table 6. High class models.
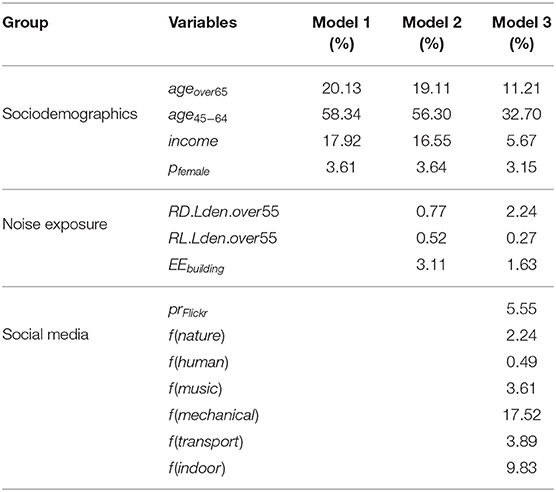
Table 7. Relative variable importance for the High-class models.
There might be several possible reasons why the coefficients associated to noise levels are either not significant or even slightly negative for the middle-income class. One of the reasons might be the geographic granularity of the study. Relatively large areas such as MSOAs can be very diverse in terms of their noise exposure, land use, and socio-demographic characteristics. By considering MSOAs as homogeneous entities, our model misses out on important signals to relate high noise levels to hypertension prevalence. To gauge this intuition, we experimented by restricting our analysis to the noisiest areas, in which noise is likely to be perceived by people living in all parts of those areas. In particular, we focused on the 147 MSOAS above the 85th percentile of the RD.Lden.over55 distribution. On these areas only, we observe a positive Kendall rank correlation coefficient ρ = 0.22 (p < 0.001) between noise exposure and hypertension prevalence, as one would expect. The fact that the traditional noise exposure measures are not able to fully capture the relation with the health outcome does not go against the main goal of this paper, which is to show the benefits of adding the information of social media-data to study the relationship between noise and health.
Discussion
Our results suggest that socioeconomic factors are consistently a primary source of information when studying health outcomes at population level. Although it is widely known that economic status affects the prevalence of some diseases, our study sheds light on the limits of the traditional noise exposure models in capturing the effects of noise on citizens well-being.
Exposure to railway noise is not significantly associated with hypertension in any of the models, despite this connection has been suggested extensively by previous studies (Sørensen et al., 2011). It has to be noted that some previous studies found that excluding from the sample participants exposed to the highest noise levels increased the association between exposure and hypertension (Lee et al., 2019). Also, areas that are potentially exposed to high levels of railway noise are often protected by the installation of noise barriers that reduce the impact on the population living closely to the rail tracks. On the contrary, we showed that the ability of estimate the presence of heterogeneous sound sources (e.g., natural sounds) using social media increases our ability of identifying sound elements that are significantly associated to health outcomes.
These findings could support the work of several stakeholders. Those include urban planners, who could save the cost of deploying large noise monitoring networks (Mydlarz et al., 2019) by using social media platforms to measure the presence of these sound sources, and medical researchers, who could complement their studies about health effects of noise exposure with social media sound maps, which have never been used before in the medical context.
Limitations
Our approach comes with a two main limitations.
Representativeness. Studies analyzing the effects of noise on population health are usually based on small cohorts of selected individuals exposed to specific acoustic conditions. In this work, we study the interaction between sound and health at an unprecedented scale, but at the cost of using a relatively coarse spatial aggregation (MSOAs). Large areas can be very diverse in terms of their noise exposure, land use, and socio-demographic characteristics. The predictive and descriptive power of our models is limited by not considering such heterogeneity. The representation of sound sources that we obtained from social media is also affected by a number of biases, including the uneven representation of location types and the mix between pictures taken by tourists and those taken by locals. Also, we average out the contribution from pictures taken across several years and both during day and night. This approach smooths out seasonal patterns and one-off events, thus yielding an average representation of an area's soundscape. This average representation does not capture the high dinamicity of the urban soundscape. Some previous studies have attempted to carry out longitudinal studies of sensory data from social media (Quercia et al., 2016), but to do that systematically, one would need to overcome several challenges including the data sparsity that slicing the data would entail, and the known inaccuracy of timestamps coming from photocameras (Thomee et al., 2014).
Causality. Our study is observational and its results do not necessarily speak to causality. The health variable we consider as outcome is concurrently influenced by a number of factors other than sound (such as nutrition and physical exercise) that are hard to control for because of the unavailability of data at area-level. Similarly, people's perception of the urban soundscape is mediated by several factors—such as quality of the facade insulation—that one cannot capture through publicly available data and that are therefore hard to control for. Last, it is challenging to disentangle the role of certain sound categories from other sensory factors that co-occur with those categories. For example, disentangling the contribution of the visual perception of greenery from the presence of nature-related sounds in explaining health outcomes is an arduous task when relying on purely observational studies.
Conclusions
We proposed a methodology for studying how urban sound is associated to health outcomes. Instead of conducting a survey-based cohort study, we used open and social media data to conduct an observational study to analyze the hypertension prevalence across areas in London. By grouping city areas by economic class, our study suggests that the use of social media constitutes a practical way of augmenting noise data with information of the presence of different types of sound sources that are currently not considered in the European strategic noise maps and that. In London, these additional social media variables augment the power of noise models to predict hypertension at area level. Also, this approach allowed us to find an inverse association between presence of nature sounds and prevalence of hypertension, which closely relates to existing hypotheses formulated soundscape researchers.
In the future, this type of study could be extended to other noise-related diseases such as effects on stress level, through tranquilizer prescriptions, and sleep quality losses, through hypnotic prescriptions. Additionally, it would be convenient to carry out studies with a lower level of data aggregation, or to quantify the biases produced by working with MSOAs, as well as those produced by the estimates made in the noise exposure calculations.
Data Availability Statement
Publicly available datasets were analyzed in this study and they can be downloaded at the following repositories: https://doi.org/10.1098/rsos.150690; https://digital.nhs.uk; https://data.london.gov.uk/dataset/noisepollution-in-london.
Author Contributions
RS, LA, and DQ conceived, designed, and supervised the project. LG, CA, and GA contributed to the design of the study, writing the protocol, data preparation, and analysis. LG drafted the manuscript. RS, LA, CA, DQ, and GA performed the quality assessment and revised the manuscript. All authors have read and approved the submitted version.
Funding
RS has been partially supported by the project Countering Online hate speech through Effective on-line Monitoring funded by Compagnia di San Paolo. The funders had no role in the study design, data collection and analysis, decision to publish, or preparation of the manuscript. LG has been supported by the funding of EIT Digital Doctoral School.
Conflict of Interest
The authors declare that the research was conducted in the absence of any commercial or financial relationships that could be construed as a potential conflict of interest.
Footnotes
2. ^https://digital.nhs.uk/data-and-information/publications/statistical/practice-level-prescribing-data
3. ^https://digital.nhs.uk/data-and-information/publications/statistical/patients-registered-at-a-gp-practice
4. ^https://www.gov.uk/government/organisations/department-for-environment-food-rural-affairs
5. ^https://data.london.gov.uk/dataset/noise-pollution-in-london
7. ^https://www.ons.gov.uk/census/2011census/2011censusdata
8. ^Flickr is a photo and video hosting service: https://www.flickr.com/
References
Aiello, L. M., Schifanella, R., Quercia, D., and Aletta, F. (2016). Chatty maps: constructing sound maps of urban areas from social media data. R. Soc. Open Sci. 3:150690. doi: 10.1098/rsos.150690
Aiello, L. M., Schifanella, R., Quercia, D., and Del Prete, L. (2019). Large-scale and high-resolution analysis of food purchases and health outcomes. EPJ Data Sci. 8:14. doi: 10.1140/epjds/s13688-019-0191-y
Aletta, F., Oberman, T., and Kang, J. (2018). Positive health-related effects of perceiving urban soundscapes: a systematic review. Lancet 392:S3. doi: 10.1016/S0140-6736(18)32044-0
Anderson, G. H. (1999). Effect of age on hypertension: analysis of over 4,800 referred hypertensive patients. Saudi J. Kidney Dis. Transpl. 10, 286–297.
Andersson, R., and Turner, L. M. (2014). Segregation, gentrification, and residualisation: from public housing to market-driven housing allocation in inner city Stockholm. Int. J. Housing Policy 14, 3–29. doi: 10.1080/14616718.2013.872949
Asensio, C., Gasco, L., and de Arcas, G. (2017). A review of non-acoustic measures to handle community response to noise around airports. Curr. Pollut. Rep. 3, 230–244. doi: 10.1007/s40726-017-0060-x
Asensio, C., Gasco, L., De Arcas, G., Løpez, J. M., and Alonso, J. (2018). Assessment of residents–exposure to leisure noise in Málaga (Spain). Environments 5. doi: 10.3390/environments5120134
Barregard, L., Bonde, E., and Öhrström, E. (2009). Risk of hypertension from exposure to road traffic noise in a population-based sample. Occup. Environ. Med. 66, 410–415. doi: 10.1136/oem.2008.042804
Barthelemy, M. (2016). A global take on congestion in urban areas. Environ. Plann. B 43, 800–804. doi: 10.1177/0265813516649955
Bello, J. P., Silva, C., Nov, O., DuBois, R. L., Arora, A., Salamon, J., et al. (2019). Sonyc: A system for monitoring, analyzing, and mitigating urban noise pollution. Commun. ACM 62, 68–77. doi: 10.1145/3224204
Belojević, G. A., Jakovljević, B. D., Stojanov, V. J., Slepcević, V. Z., and Paunović, K. Z. (2008). Nighttime road-traffic noise and arterial hypertension in an urban population. Hypertens. Res. 31:775. doi: 10.1291/hypres.31.775
Berglund, B., Lindvall, T., Schwela, D. H., and World Health Organization, and Occupational and Environmental Health Team. H. (1999). Guidelines for Community Noise. Available online at: https://apps.who.int/iris/handle/10665/66217
Bodin, T., Albin, M., Ardö, J., Stroh, E., Östergren, P.-O., and Björk, J. (2009). Road traffic noise and hypertension: results from a cross-sectional public health survey in Southern Sweden. Environ. Health 8:38. doi: 10.1186/1476-069X-8-38
Buford, T. W. (2016). Hypertension and aging. Ageing Res. Rev. 26, 96–111. doi: 10.1016/j.arr.2016.01.007
Chatzigiannakis, I., Mylonas, G., and Vitaletti, A. (2011). Urban pervasive applications: challenges, scenarios and case studies. Comput. Sci. Rev. 5, 103–118. doi: 10.1016/j.cosrev.2010.09.003
Deguen, S., Petit, C., Delbarre, A., Kihal, W., Padilla, C., Benmarhnia, T., et al. (2015). Neighbourhood characteristics and long-term air pollution levels modify the association between the short-term nitrogen dioxide concentrations and all-cause mortality in Paris. PLoS ONE 10:e131463. doi: 10.1371/journal.pone.0131463
Dratva, J., Phuleria, H. C., Foraster, M., Gaspoz, J.-M., Keidel, D., Künzli, N., et al. (2011). Transportation noise and blood pressure in a population-based sample of adults. Environ. Health Perspect. 120, 50–55. doi: 10.1289/ehp.1103448
EBM, D. (2018). University of Oxford. Available online at: https://openprescribing.net/bnf/ (accessed November 26, 2018).
European Environment Agency (2014). Noise in Europe 2014. Number 10/2014. Publications Office of the European Union, Luxembourg.
European Parliament (1996). Future Noise Policy. European Commission Green Paper. Office for Official Publications of the European Communities, Luxembourg.
European Parliament (2002). Directive 2002/49/EC of the European Parliament and the Council of 25 June 2002 Relating to the Assessment and Management of Environmental Noise. Official Journal of the European Communities, Luxembourg.
Fairbrass, A. J., Rennert, P., Williams, C., Titheridge, H., and Jones, K. E. (2017). Biases of acoustic indices measuring biodiversity in urban areas. Ecol. Indic. 83, 169–177. doi: 10.1016/j.ecolind.2017.07.064
Fecht, D., Fischer, P., Fortunato, L., Hoek, G., de Hoogh, K., Marra, M., et al. (2015). Associations between air pollution and socioeconomic characteristics, ethnicity and age profile of neighbourhoods in England and the Netherlands. Environ. Pollut. 198, 201–210. doi: 10.1016/j.envpol.2014.12.014
Florida, R. (2017). The New Urban Crisis: Gentrification, Housing Bubbles, Growing Inequality, and What We Can Do About It. Oneworld Publications.
Gasco, L., Asensio, C., and De Arcas, G. (2017). “Towards the assessment of community response to noise through social media,” in INTER-NOISE and NOISE-CON Congress and Conference Proceedings, Vol. 255 (Hong Kong: Institute of Noise Control Engineering), 2209–2217.
Gasco, L., Clavel, C., Asensio, C., and de Arcas, G. (2019). Beyond sound level monitoring: Exploitation of social media to gather citizens subjective response to noise. Sci. Total Environ. 658, 69–79. doi: 10.1016/j.scitotenv.2018.12.071
Hayes, S. N., and Taler, S. J. (1998). “Hypertension in women: current understanding of gender differences,” in Mayo Clinic Proceedings, Vol. 73 (Elsevier), 157–165. doi: 10.1016/S0025-6196(11)63649-5
International Organization for Standardization (2007). ISO 1996-2:2007 Acoustics - Description, Measurement and Assessment of Environmental Noise - Part 2: Determination of Environmental Noise Levels.
Kang, J., Aletta, F., Gjestland, T. T., Brown, L. A., Botteldooren, D., Schulte-Fortkamp, B., et al. (2016). Ten questions on the soundscapes of the built environment. Build. Environ. 108, 284–294. doi: 10.1016/j.buildenv.2016.08.011
Kaplan, M. S., Huguet, N., Feeny, D. H., and McFarland, B. H. (2010). Self-reported hypertension prevalence and income among older adults in Canada and the United States. Soc. Sci. Med. 70, 844–849. doi: 10.1016/j.socscimed.2009.11.019
Keenan, N. L., Rosendorf, K. A., for Disease Control, C., (CDC), P., et al. (2011). Prevalence of hypertension and controlled hypertension–United States, 2005-2008. MMWR Surveill. Summ. 60(Suppl.), 94–97. Available online at: https://www.cdc.gov/Mmwr/preview/mmwrhtml/su6001a21.htm?s_cid=su6001a21_wAuthor
Lee, P. J., Park, S. H., Jeong, J. H., Choung, T., and Kim, K. Y. (2019). Association between transportation noise and blood pressure in adults living in multi-storey residential buildings. Environ. Int. 132:105101. doi: 10.1016/j.envint.2019.105101
Leon Bluhm, G., Berglind, N., Nordling, E., and Rosenlund, M. (2007). Road traffic noise and hypertension. Occup. Environ. Med. 64, 122–126. doi: 10.1136/oem.2005.025866
Lindeman, R. H., Merenda, P., and Gold, R. Z. (1980). Introduction to Bivariate and Multivariate Analysis, Glenview, Il. Scott: Foresman and Company.
Lorente-Riverola, I., and Ruiz-Sánchez, J. (2018). “Spatial footprints of context-aware digital services. Eventual self-regulated alignments of dating apps with the urban shape,” in Smart and Sustainable Planning for Cities and Regions, eds A. Bisello, D. Vettorato, P. Laconte, and S. Costa (Cham: Springer International Publishing), 133–150. doi: 10.1007/978-3-319-75774-2_10
Mosca, I., Bhuachalla, B. N., and Kenny, R. A. (2013). Explaining significant differences in subjective and objective measures of cardiovascular health: evidence for the socioeconomic gradient in a population-based study. BMC Cardiovasc. Disord. 13:64. doi: 10.1186/1471-2261-13-64
Mydlarz, C., Sharma, M., Lockerman, Y., Steers, B., Silva, C., and Bello, J. P. (2019). The life of a New York city noise sensor network. Sensors 19. doi: 10.3390/s19061415
Ottoz, E., Rizzi, L., and Nastasi, F. (2018). Recreational noise: Impact and costs for annoyed residents in Milan and Turin. Appl. Acoust. 133, 173–181. doi: 10.1016/j.apacoust.2017.12.021
Pinto, E. (2007). Blood pressure and ageing. Postgrad. Med. J. 83, 109–114. doi: 10.1136/pgmj.2006.048371
Quercia, D., Aiello, L. M., and Schifanella, R. (2016). “The emotional and chromatic layers of urban smells,” in Tenth International AAAI Conference on Web and Social Media (Cologne).
Quercia, D., Schifanella, R., Aiello, L. M., and McLean, K. (2015). Smelly maps: the digital life of urban smellscapes. arXiv [preprint] arXiv:1505.06851. Available online at: https://www.aaai.org/ocs/index.php/ICWSM/ICWSM15/paper/viewFile/10572/10516
Radicchi, A. (2017). “Hush city: A new mobile application to crowdsource and assess–everyday quiet areas in cities,” in Proceedings of Invisible Places: the International Conference on Sound, Urbanism and the Sense of Place (Azores), 7–9.
Richardson, E. A., Pearce, J., Tunstall, H., Mitchell, R., and Shortt, N. K. (2013). Particulate air pollution and health inequalities: a Europe-wide ecological analysis. Int. J. Health Geogr. 12:34. doi: 10.1186/1476-072X-12-34
Sassen, S. (1991). The Global City. New York, NY; London; Tokyo; Princeton, NJ: Princeton University Press.
Savage, M., Devine, F., Cunningham, N., Taylor, M., Li, Y., Hjellbrekke, J., et al. (2013). A new model of social class? Findings from the BBC's great British class survey experiment. Sociology 47, 219–250. doi: 10.1177/0038038513481128
Schafer, R. M. (1993). The Soundscape: Our Sonic Environment and the Tuning of the World. Destiny Books.
Schmit, C., and Lorant, V. (2009). Noise nuisance and health inequalities in Belgium: a population study. Arch. Public Health 67:52. doi: 10.1186/0778-7367-67-2-52
Serdyukov, P., Murdock, V., and Van Zwol, R. (2009). “Placing flickr photos on a map,” in Proceedings of the 32nd International ACM SIGIR Conference on Research and Development in Information Retrieval (Boston, MA), 484–491. doi: 10.1145/1571941.1572025
Silva, B., Santos, G., Eller, R., and Gjestland, T. (2017). Annoyance survey by means of social media. J. Acoust. Soc. Am. 141, 1019–1026. doi: 10.1121/1.4976055
Sørensen, M., Hvidberg, M., Hoffmann, B., Andersen, Z. J., Nordsborg, R. B., Lillelund, K. G., et al. (2011). Exposure to road traffic and railway noise and associations with blood pressure and self-reported hypertension: a cohort study. Environ. Health 10:92. doi: 10.1186/1476-069X-10-92
Stansfeld, S., and Crombie, R. (2011). Cardiovascular effects of environmental noise: research in the united kingdom. Noise Health 13:229. doi: 10.4103/1463-1741.80159
Thomee, B., Moreno, J. G., and Shamma, D. A. (2014). “Who's time is it anyway? Investigating the accuracy of camera timestamps,” in Proceedings of the 22nd ACM International Conference on Multimedia (Orlando, FL), 909–912. doi: 10.1145/2647868.2655066
United Nations (2018). World Urbanization Prospects: The 2018 Revision. Key Facts. Technical report, United Nations.
Urquiaga, A. A., Lorente-Riverola, I., and Sanchez, J. R. (2020). Platform-mediated short-term rentals and gentrification in Madrid. Urban Stud. doi: 10.1177/0042098020918154
Van Kempen, E., Casas, M., Pershagen, G., and Foraster, M. (2018). Who environmental noise guidelines for the European region: a systematic review on environmental noise and cardiovascular and metabolic effects: a summary. Int. J. Environ. Res. Public Health 15. doi: 10.3390/ijerph15020379
Wachsmuth, D., and Weisler, A. (2018). Airbnb and the rent gap: gentrification through the sharing economy. Environ. Plan. Econ. Space 50, 1147–1170. doi: 10.1177/0308518X18778038
Wallsten, S. (2015). The Competitive Effects of the Sharing Economy: How Is Uber Changing Taxis. Technology Policy Institute, 22.
World Health Organization (2018). Environmental Noise Guidelines for the European Region. World Health Organization.
Keywords: noise, health, Flickr, hypertension, social media, city
Citation: Gasco L, Schifanella R, Aiello LM, Quercia D, Asensio C and de Arcas G (2020) Social Media and Open Data to Quantify the Effects of Noise on Health. Front. Sustain. Cities 2:41. doi: 10.3389/frsc.2020.00041
Received: 04 April 2020; Accepted: 21 July 2020;
Published: 02 September 2020.
Edited by:
Bert De Coensel, Ghent University, BelgiumReviewed by:
Jin Yong Jeon, Hanyang University, South KoreaEdda Bild, McGill University, Canada
Pyoung Jik Lee, University of Liverpool, United Kingdom
Copyright © 2020 Gasco, Schifanella, Aiello, Quercia, Asensio and de Arcas. This is an open-access article distributed under the terms of the Creative Commons Attribution License (CC BY). The use, distribution or reproduction in other forums is permitted, provided the original author(s) and the copyright owner(s) are credited and that the original publication in this journal is cited, in accordance with accepted academic practice. No use, distribution or reproduction is permitted which does not comply with these terms.
*Correspondence: Rossano Schifanella, cm9zc2Fuby5zY2hpZmFuZWxsYUB1bml0by5pdA==