 Rodrigo García-Herrera
 Paola Massyel García-Meneses
- Laboratorio Nacional de Ciencias de la Sostenibilidad, Instituto de Ecología, Universidad Nacional Autónoma de México, Ciudad de México, México
Design and partial implementation of a mobile application that helps bicycle riders flock with other riders while commuting, thus benefiting from the emergent critical mass. Simulations are run to test the model, analysis of their results suggest flock formation is likely given enough users.
1. Introduction
Riding a bike among other cyclists is safer and more fun (Jacobsen, 2003; Secretaría de Salud, 2016). It has many advantages for riders. While interacting with motorized traffic, they have better visibility and it is easier for them to assert their right to share the road, for example by occupying a whole lane. Riders can readily rely on the kindness of strangers in their group, should trouble arise, e.g., a flat tire or other mechanical failure. Also riding together may be an effective security measure: a group of riders is protected from threats to which a lone rider is vulnerable.
Social Cycling is a mobile app that helps with the coordination of bike riders so that groups are assembled in real time.
1.1. Emergent Critical Mass
Social Cycling is about safer rides for urban cyclists that have to share the road with motorists. It is a bottom-up approach in two senses. One literal sense, self-organization of flocks rises from local interactions, as an emergent property of the system1. On the other hand, ride safety is a wicked problem that must be faced on many different levels by different actors such as individuals, governments and organizations. Documents like Secretaría de Salud (2016) describe top-down interventions that may only be carried out by governments (e.g., creation of laws, riding lanes). In contrast, this app is also a bottom-up approach in the sense that it encourages local changes that may be carried out by individuals, with little to no financial burden for public entities, by changing the usage pattern of infrastructure already in place.
Cycling is a potentially egalitarian practice, capable of reorganizing urban space (Stehlin, 2014). Better urban infrastructure for safer riding is a good thing, but can only be achieved through large projects implemented by proper government agencies. Flocking for safer rides is a form of direct action that may be carried out by anyone, and requires only that riders coordinate with each other. This coordination may occur through an app that embodies a set of rules for local interactions. We propose these rules may be tested using agent based simulations, with models developed in such a way that virtual agents may easily be replaced by actual people.
This app may help in overcoming individualism. In the words of Annie Leonard, regarding care for the environment: “Individual actions are a fine place to start, but a terrible place to stop” (Assadourian et al., 2013, p. 112 and 245). It is necessary to join individual change to political action, to larger visions and bolder campaigns. One such political action is the monthly gathering called Critical Mass, which happens in many cities around the world. Many cyclists join, sometimes in the hundreds, and use their numbers to freely ride around cities, celebrating bike culture and asserting their right to share the road (Furness, 2010). Using a bicycle as means for transportation is an individual choice. Joining a flock gathers critical mass. The mobile app here proposed seeks to harbor this critical mass in a spontaneous and commonplace fashion, as opposed to the monthly planned rides.
1.2. Contributions to the Zero Vision
Zero Vision refers to “strategies and action plans that result in zero CO2 emissions, zero fatal traffic accidents, zero waste and zero aggression in the public space of cities” (Zaman, 2014; Komninos, 2016). Zero Vision is a concept that evolved from the vision of zero harm (Harm Zero) which started as a business practice adopted by many municipalities worldwide where elimination of deaths is the main goal. This was expanded due to the connection with digital technologies and the scope of smart cities considering other aspects related to the environment with a sustainable approach.
Whereas, many smart city applications are meant to inform urban planning (Angelidou et al., 2018), Social Cycling focuses on empowerment and intelligence infusion of citizens.
Development of Social Cycling addresses the environmental issues of (1) reducing greenhouse gas emissions and (2) fostering urban collective intelligence. It is a strategy for widening the adoption of bicycle transportation, which increases efficiency and reduces atmospheric pollution. Information and communication technologies are used for real-time information sharing. The overall expected outcome is a more efficient usage of resources, specifically the street network.
2. Context
2.1. Cycling and Smart City Related Mobile Apps
Development of mobile applications to enhance sustainable urban development is useful and commonplace. Mobile devices have wide adoption in urban spaces, and their capabilities have been articulated to address many different problems (Walravens, 2015), including crowd-sourcing of environmental monitoring (Stevens and DâHondt, 2010; Kanhere, 2013), collaborative creation of tree inventories (Fuelling et al., 2018; Stehlin, 2018), even finding parking space (Angelidou et al., 2018). Each can be associated to one or more mitigation strategies for different environmental issues. Those that address issues of high traffic density, air pollution and increased energy consumption mostly focus on multi-modal transit planning (Kramers, 2014; Walravens, 2015).
Regarding applications that enhance bicycle mobility there are no other efforts similar to ours, to the best of our knowledge. Common use cases are the collective creation of maps, route planning (Gavin et al., 2011) and sharing of favorite routes, data gathering about many different aspects of bike trips, such as speed, distance (Oliveira and Afonso, 2015; Porter and Schwartz, 2018), even rider heart-rate and other indicators of exertion (Walmink et al., 2014). Some are created specifically for research purposes (Mattingly et al., 2017; Boss et al., 2018), many are commercially motivated, e.g., bike sharing programs (Chen et al., 2018). There are several apps for cyclists which -like ours- mean to encourage cycling and foster community creation (Navarro et al., 2013; Walmink et al., 2014; Oliveira and Afonso, 2015). However, the strategy of safety in numbers featured by real-time sharing of a bike ride is unique to our design.
2.2. Semi-common Route, Carpooling, Ridesharing
Sharing rides in private vehicles is not new. It has been promoted for decades in different ways with the goal of increasing vehicle usage as a way of optimizing the use of transport infrastructure. The problem of sharing a ride is the coordination of passengers. Using internet technology web applications have been developed to host car pools. Carpooling consists of sharing a private automobile among several passengers that have a semi-common route, i.e., origins and destinations are different for every passenger, although parts of the route can be shared (Ferrari et al., 2003). A service manages their movements, driver and passengers have to know in advance pick-up times and places. Applications help establish trust among registered users, sometimes even help charge passengers and compensate car owners/drivers for the trip's expenses (Ferrari et al., 2003). But the planning must be done in advance, there is no support for ad hoc sharing, which may partly explain the decline in their use (Ferreira et al., 2009).
Carpooling evolved into ridesharing which precisely means ad hoc planning. Users transmit their location and their destination to a central component which will then match them with other travelers that have a close enough route and join them with available taxis. This coordination is a complex problem under active research, using methods that range from operations research to genetic algorithms (Agatz et al., 2012). Ridesharing is more flexible and more popular than carpooling, and is commercially available through several mobile apps available in urban contexts around the world.
Both types of services are meant to help in the sharing of an automobile. But sharing a semi-common route can be done by other types of vehicles, specifically bicycles. Sharing a bike ride is not new either, using the internet to organize a group ride is commonplace. However, it is done in a fashion similar to carpooling, in that times, origins and destinations must be known in advance.
The ad hoc planning of a ride share is innovative with regards to bicycles: using GPS and the internet to organize a group spontaneously. A strategy for achieving this organization is explained in the following section.
2.3. Boids
The emergence of flocks has been studied by simulations such as Craig Raynolds' Boids (bird-oids) (Reynolds, 1987). It is essentially a model of distributed intelligence in which every agent chooses its own route. In Raynolds' simulation each boid is an independent actor that navigates according to its perception of the local environment and a set of rules. Dense interaction of these simple behaviors by individuals results in the collective coordination of boid flocks. These flocks do not rely on a central control, but retain their group identity even while they momentarily disperse to avoid obstacles.
Boids follow these rules:
1. Avoid collisions with other boids.
2. Match speed and heading of the flock by adopting an average of surrounding boids.
3. Keep close to what it perceives as the center of the flock.
The spontaneous creation of cyclist flocks may be achieved by similar mechanisms. Real life cyclists are not following rules, but are voluntarily motivated to participate by the advantages of riding in a group. Parts of the collective behavior are delegated to actual bicycle riders, e.g., they take care of navigating the terrain, avoiding obstacles and collisions, all problems to be dealt with locally. The app provides system-wide information so that the distributed intelligence of flock formation can take place: by getting close to other riders, matching heading and speed. The awareness of a cyclist is augmented through the usage of the app in her mobile device, helping her find the centroid of a group of nearby bicycle riders with destinations close to her own.
A cyclist riding toward the centroid of such a perceived flock will eventually catch up with other riders going in her own direction, thereby joining or creating a flock. However, it is reasonable to suppose that riders will prioritize their own destination, so flocks may be disintegrated as riders part.
The operation of the Social Cycling app depends on its users' altruism, by which they are willing to alter their route in order to share it. This altruism is manifested in two parameters: what ratio of their trip they are willing to ride to join flocks near their current location, and what destinations they consider close enough to their own. Figure 1 shows how red and blue cyclists are great candidates for forming a flock: by riding a short distance they can meet and share most of the trip. The pink cyclist however is not a good match, he is far away and riding in the opposite direction.
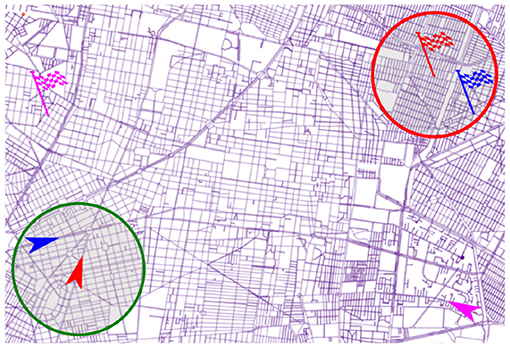
Figure 1. The map represents a portion of any street network. Arrows represent bike riders, same colored flags their destinations. The green circle shows the radius of red's local altruism, i.e., what distance surrounding her she's willing to cover in order to join with others. The red circle shows red's destination altruism, i.e., what distance surrounding her destination is close enough to include in her trip. Red and blue cyclists are great candidates for forming a flock: by riding a short distance they can meet and share most of the trip. Pink cyclist however is not a good match, he is far away and riding in the opposite direction.
Joining a flock may be seen as ridesharing, although while riding in a group what is shared is not a vehicle but the ride itself. Each user has her own vehicle which she uses to reach the semi-common route. The semi-common route is not centrally planned, it is an emergent property of the interactions of users with a mobile app and with the terrain they navigate.
3. Programmatic Elements
The application design functions as a client-server interface. Functionality is split into two programs that cooperate: the server program is a central component that gathers clients' locations into a database, and using the model serves flock centroids back to clients seeking a flock. The client program is meant to run in mobile devices of cyclists, mounted on their handlebars. It uploads their locations to the server and displays a special compass that cyclists use to join other cyclists.
3.1. Mobile Client
A typical session might be: user opens the app in her mobile device. She chooses her destination in a map. Two arrows are shown. One points to her destination, if she heads in the direction pointed to by this arrow she will eventually get there, without regard to the route she improvises. A second arrow points toward the closest flock which is heading to a place nearby the user's destination. Using the size and color of both arrows along with some text the app informs the user about the size, speed, and closeness of the flock. If she rides in the direction pointed to by this second arrow she will eventually join other riders.
Figure 2 shows a prototype of the client app running in a mobile device. In this example a green arrow points toward a flock with a trip similar to the user's, 1.2 km away due north. The top left part of the screen further shows that it is made up of seven riders going at around 9 km/h. There is also a red arrow which points north-west toward a destination 8.3 km away. Below this red arrow the user can read her own average speed, calculated using times and distances from her mobile GPS. By using both arrows each user decides if she wants to join (because it is near), how long to belong (because they are heading in the same direction) and when to leave a flock (because she must head to her own destination).
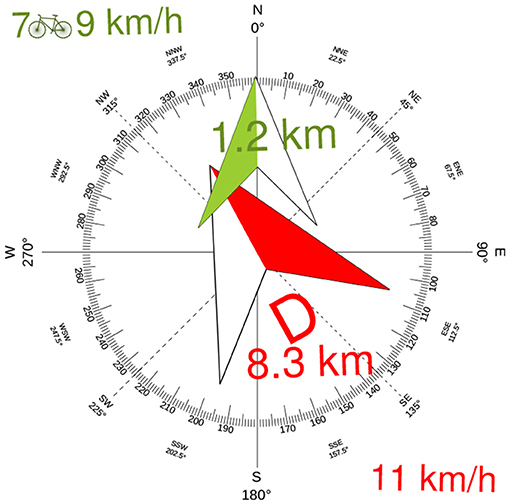
Figure 2. Mock-up of the app running on mobile device. The arrows are properly oriented using the device's magnetometer.
3.2. The Flock Server
The server receives locations and destinations of users. It does not compute routes, it just returns two headings: one toward the user's destination, one toward the centroid of the nearest flock. If there are no flocks nearby, it will just return the heading toward the user's destination. The client will query the server periodically so that the heading toward the user's destination will be updated as the trip goes on, and the heading toward nearby flocks will change according to availability of concurrent users with similar trips.
Communication between client and server is arranged as a web-service. The interface for the service consists of two URLs for registering a trip and updating client location. The synopsis of registering a trip is shown in the following listing.
GET /register/?dest_lat=${dlat}&dest_lon=${dlon}
Response Status 200 {'bike_id': 5263}
Coordinates of current location and destination are sent, server returns a bike_id which identifies the user for further transactions.
The synopsis for updates is shown in the following listing:
GET /update/${bike_id}/?lat=${lat}&lon=${lon}
Response Status 200 {'flock_heading': 34.24,
'flock_distance': 0.43,
'flock_avg_speed': 10.2,
'flock_size': 4,
'dest_heading': 33.11,
'dest_distance': 6,
'speed': 9.4}
${bike_id} is the key obtained at session start, it is sent with the current user's coordinates represented by the variables ${lat} and ${lon}. The server returns two headings: dest_heading and flock_heading along with data about size, speed and distance to nearest flock, destination and user's speed.
Entries in the server's database are time-stamped so that only current data is returned.
4. Agent Based Modeling
Agent Based Modeling is used to analyze the system's behavior. The model description follows the ODD (Overview, Design concepts, Details) protocol (Grimm et al., 2006, 2010).
A modeling library for mobile agents was created, which abstracts some features of agents moving through street networks García-Herrera (2018). The bicycle flocking simulation extends this library through class inheritance. An easily reproducible version of the simulation is available at this location:
https://gitlab.com/rgarcia-herrera/social-cycling/blob/master/abm_comses/social_cycling.ipynb
To analyze different rider densities and different street networks, hundreds of simulations were run in a high throughput computing cluster. Findings are reported in section 5 on page 6.
Animations of some simulation runs are available:
• https://archive.org/details/ride_050bikes_cdneza
• https://archive.org/details/ride_100bikes_xochimilco
• https://archive.org/details/ride_100bikes_uacm
• https://archive.org/details/ride_200bikes_cdneza
4.1. Purpose
The purpose of running simulations is to test if and when flocks of cyclists are formed given the alterations to Craig Raynolds' original set of rules for boids.
The original rules being:
1. Avoid collisions with other boids.
2. Match speed and heading of the flock by adopting an average of surrounding boids.
3. Keep close to perceived center of flock.
To which this model adds:
1. Ride from current location to given destination (i.e., don't just wander around).
2. Consider nearby agents only if their destinations are close to mine.
4.2. Entities, State Variables, and Scales
Entities are cyclists.
Their state variables are: location coordinates (lat, lon), destination coordinates (lat, lon), speed in meters per second (mps), heading (an angle), status which may be solo, seeking, or flocking.
Simulations are run on real-world street network maps, agent locations are latitude-longitude coordinates. Scale depends on desired zoom level.
4.2.1. Density ρ
Density refers to the amount of concurrent trips within an area during a given period. It is normalized to trips per square kilometer per hour.
4.2.2. Local and Remote Altruisms
These parameters are the radii of circles described in Figure 1. Local altruism surrounds the user's current location. Remote altruism surrounds the user's destination. These radii are a ratio of the user's trip total length and are set respectively to 0.1 and 0.2. A user with a trip of 10 km with a local altruism of 0.1 is willing to ride an extra kilometer to join a flock. A remote altruism of 0.2 means she's willing to flock with other riders even if she will stray up to 2 km from her destination. Since these values are ratios of the trip length, finding flocks is likely when trips are long and rare on the last hundred meters.
4.3. Process Overview and Scheduling
The following program listing gives an overview of the simulation process:
for t in planned_steps: # 1800 steps means half an hour
for bike in N: # N has all bike objects in the simulation
if t % 10: # every ten simulation steps
bike.flock() # try to flock
bike.step()
• Every tenth simulation step agents seek to flock with other agents.
- The flock() method queries the bike database for nearby agents with similar destinations.
* If found agents are already within two times the agent's speed, and their headings are similar to within four degrees, then status is set to flocking, route is updated.
* If found agents are farther: status is set to seeking, the centroid of their coordinates is computed and a route is queried that goes through that centroid and then on to the agent's destination, which simulates following the green arrow in Figure 2.
* If no nearby agents found, set status to solo, keep current route.
• Agents are initialized with a location point, a destination point, and a route that connects them. Calling the step() method will move an agent to the next point in its planned route, which is a list of geographic coordinates spaced to match the agents current speed.
4.4. Design Concepts
4.4.1. Basic Principles
This model follows the same basic principles as Craig Raynolds' Boids (Reynolds, 1987) flocking model. From interaction of agents through a set of simple rules system wide flocking behavior emerges.
4.4.2. Emergence
Flock formation is an emergent property of the model.
4.4.3. Agent adaptation
In the simulation agents prefer the flocking state, and adapt by periodically seeking nearby agents with similar destinations to flock with them.
4.4.4. Objectives
Agents have two objectives: 1. Traveling from their current location to their destination 2. Flocking with other agents.
4.4.5. Learning
No learning mechanisms are modeled in the current version. Future work may involve developing features for strengthening communities. For example, using the app might earn users experience points which in turn make them more attractive ride companions. Other community building apps have similar features, which reward members for being helpful. Programming agents to keep track of usage and prefer experienced companions are learning mechanisms that may be investigated in future versions.
4.4.6. Prediction
Agents assume they will flock with other agents if they route through the centroid of perceived flock candidates.
4.4.7. Sensing
Agents perceive nearby agents and can select those with destinations close to their own to flock with them.
4.4.8. Interaction
Agents interact with each other by matching their speeds. Since they follow a semi-common route their headings will also match while they belong to a flock. Interaction with the street network is done by an external routing program.
4.4.9. Stochasticity
Some stochasticity is induced to the simulation by assigning random speeds to agents. If agents are joining a flock (seeking status in the simulation), speeds will stochastically decrease to a random value in the range of 3–3.5 mps in order to wait for it if they are ahead of the flock, or increase to a value in the range of 4.3 – 4.7 mps if they are behind, to catch up. Agents that have joined a flock (flocking status in the simulation) fix their speed at 3.5 mps (12.6 km/h). Solo riders (solo status in the simulation) set their speed at 4 mps.
Also, trips have random origins and destinations, and are of random lengths in the range of 4–6 km.
4.4.10. Collectives
Flocks are formed by agents that have the same heading and speed, and are within a distance of five meters of each other.
4.4.11. Observation
Agent variables under observation are: location (lat, lon), speed and status.
Flock sizes are also observed.
4.5. Initialization
• Trips are setup with random lengths ranging 3–6 km. Agents are initialized with random initial locations and destinations.
• Simulations are configured to run for 1,800 steps, i.e., half an hour if each step represents 1 s. Riders are added during the first 10 min, from t = 0 until t = 600. Agents ride to their destinations during the remaining 20 min.
• Three different densities are simulated: ρ = 50, ρ = 100, and ρ = 200 cyclists/km2/h
• Initial speed for agents is 4 mps.
4.6. Input Data
Inputs to the model are the street network within a chosen area and a simulated agent density.
Agent density is a function of number of riders per unit of time per unit of area, so any density can be achieved using areas of arbitrary sizes. To avoid unnecessary computational cost, simulations take place within squares of 5 km2. This area fits bicycle trips of around 7 km which can easily be completed under half an hour. Four different places are chosen within the Valley of Mexico, with street networks of different layouts:
1. Colonia del Valle, square around Mexico City Autonomous University
2. University City, National Autonomous University of Mexico
3. Xochimilco downtown
4. Nezahualcoyotl City
The criteria for selecting these areas is further discussed in section 5.2.
The data for these street networks is obtained using OSMNX (Boeing, 2017).
4.7. Submodels
4.7.1. Routing Model
The simulation framework uses geographical coordinates, which allows it to run simulations on detailed street network maps. Agents navigate street networks using Open Street Map through the route server BRouter (Brenschede, 2014; Renner, 2018).
Since the focus of this study is the emergent formation of flocks, route computation has been externalized by implementing a ready made routing engine. BRouter specializes in bicycle trips. It will consider terrain elevation changes, it can navigate through parks or using footbridges, etc.
During the simulation agents interrogate BRouter's web-service. This interaction is abstracted in the Agent class through the update_route() method, which will update agents' route attribute with an ordered list of coordinate pairs.
BRouter is just needed for simulations. During real-life use of the model it will be actual bicycle riders doing the navigation, by following the arrows shown in the mobile app.
5. Discussion
Results indicate that changing the rules to consider cyclists (only flock to nearby riders that are approximately heading to the user's destination) does not impede the formation of flocks. On the contrary, flocking is likely to occur with enough users of the app.
5.1. Response to Density
Twenty simulations were run for each density mentioned in section 4.2.1 on page 4. For each time step population sizes were counted for three states: 1. Solo riders, 2. Seeking riders, 3. Flocking riders. The system responded with a larger population of flocking riders as the density increased. This seems a reasonable result: during the small hours of the night when almost no bike riders are out and about flocks are unlikely, whereas at rush hour they are almost inevitable, with or without the use of the app.
Figure 3 shows the dynamics of population size for each density. Flocks are formed even with the lowest density after the first three simulated minutes. Beyond 100 cyclists per hour per square kilometer, there are more flocked riders than solo riders during most of the simulation.
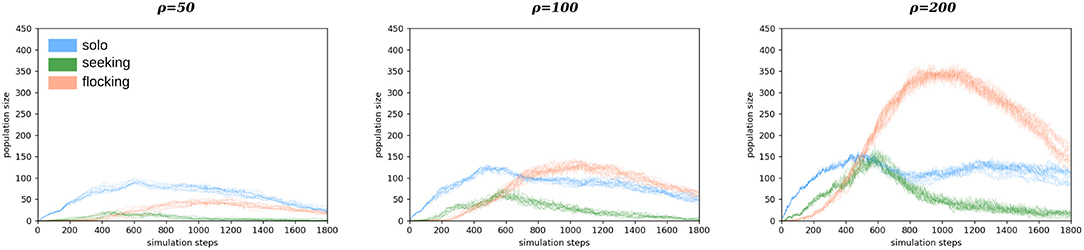
Figure 3. Population sizes for agents in different states for three densities, from left to right: ρ = 50, ρ = 100, ρ = 200. Blue curves depict solo riders, green curves represent the population of agents riding toward a flock, red curves represent the population size of flocking agents. Each plot shows 20 repetitions of a simulation run for the same density.
Figure 4 shows the distribution of flock sizes for simulated densities, at lapses of 200 simulation steps. As time goes by, more flocks emerge and grow. With 200 agents per square kilometer per hour some flocks are formed with up to 15 members.
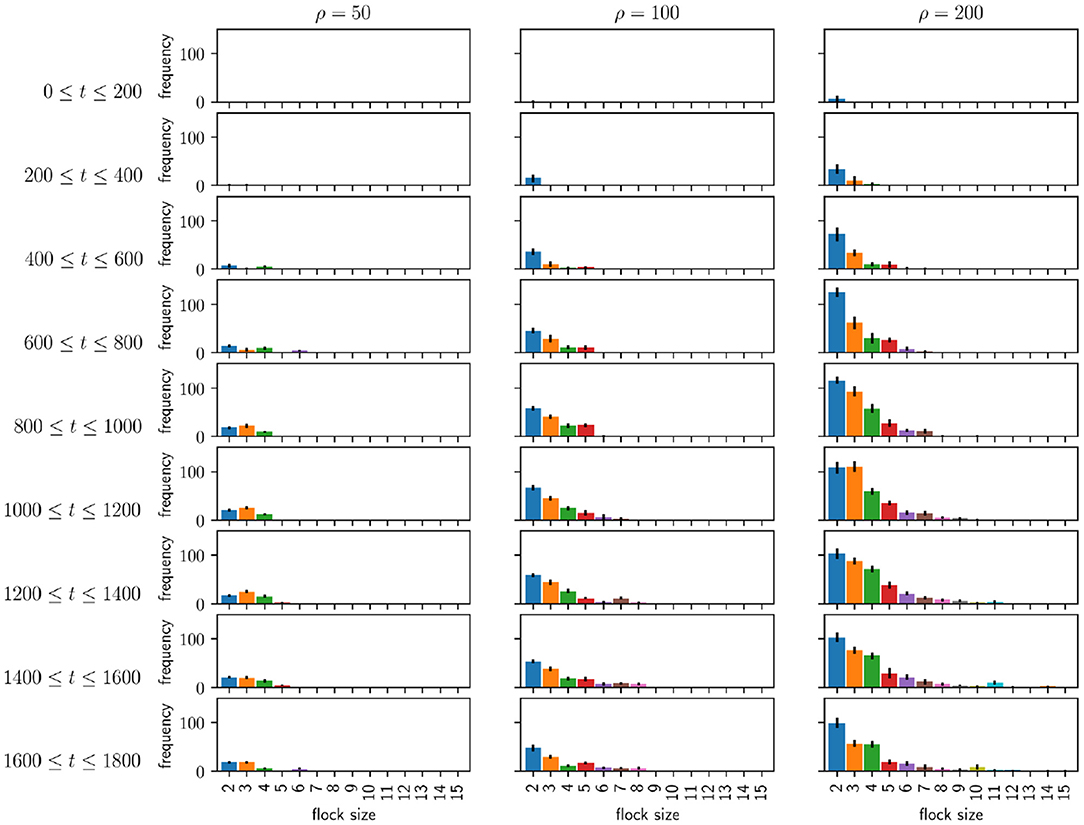
Figure 4. Distribution of flock size for densities ρ = 50, ρ = 100, and ρ = 200 at lapses of 200 simulation steps. Higher densities yield larger flocks.
These simulation results suggest increased trip densities result in more flocks. This might persuade cyclists to use the app, and suggests that bicycle user censuses such as ITDP (2013) might inform on the probability of the spontaneous creation of critical mass on certain neighborhoods.
5.2. Street Network Layout
One of the most striking features of flocking models is how the emergent flock retains its identity even while navigating difficult terrain. It is most noticeable when a flock faces obstacles and becomes fluid as individuals avoid collisions yet retain their unity as a group. This ability is in fact what we originally set out to investigate. Will flock formation occur in a landscape which is mostly obstacles? From the point of view of a cyclist, urban space is very permeable, it is easy to get around anything smaller than a city block. So, in a way, spatial order of the street network (Boeing, 2018) is a measure of these obstacles. We have run simulations on street layouts chosen with different spatial entropy to test if more entropy would obstruct flock formation.
In the simulations we ran, the phenomenon of flock formation is robust to the layout of streets as can be gathered by examining the population dynamics depicted in Figure 5. Street layouts in the four simulated squares mentioned in section 4.6 are very different, ranging from an ostensibly planned regular reticle (Nezahualcoyotl City) to what seems an evolved organic layout (Xochimilco Downtown). Nevertheless, flocks are consistently formed.

Figure 5. Simulations were run in these squares. Radial histograms show street orientation frequencies, as a measure of spatial order. Population dynamics are plotted on the rightmost column, and show that flock formation is robust to the layout of streets.
However, each city has a different bike culture, just as it has a different street network. A safety-in-numbers strategy makes sense in Mexico City where cyclists are at a gross disadvantage to motorists when asserting their right to the road, and perhaps not in Amsterdam where there is a lot of cycling infrastructure already crowded with bicycles.
Just how effective is cycling in any given town or neighborhood? Suitability for cycling is certainly an important aspect to consider while promoting bicycle adoption, which is a mitigation strategy we adhere to. There are many variables which may be important, besides safety, like abrupt changes in terrain elevation, long city distances or even harsh weather. Neighborhood typologies might be generated from different built environment indicators such as population and employment density, land use diversity, etc. However, this systematic comparison of “bikeability” between many different cities and neighborhoods is not the matter under study.
Instead we focus on how “bikeability” can be brought forth by the riders themselves, that by changing the way we ride, previously difficult parts of the street network become friendly and easy to traverse. As long as this change is possible, i.e., if self-organization happens without regard to the topology of the street network, we think our app will help cyclists organize group rides. Ultimately, it is cyclists that decide when and where to ride, and our app might help to coordinate those decisions.
5.3. Reusability of the Model
The agent-based simulation here described is similar to other flocking models, and shares some parameters with them, such as the local radius at which agents perceive other agents. A sensibility analysis of this and other parameters is foregone on the rationale that this project does not seek to understand, e.g., altruist behaviors on bicycle riders. For simplicity radii are set using ratios of the trip length: 0.1 for local altruism, 0.2 for destination altruism. Energies saved by not creating a more nuanced simulation of cyclist behavior have been instead used in designing a model that can be implemented within a web server, and thus directly used by the Flock Server described in section 3.2. In this way simulation agents can be replaced by actual human users, connecting through the client app described in section 3.1, each with her own criteria for altruistic behavior.
5.4. Contribution to Policy
Depending on the perspective of the stakeholder, policy can be described as top-down or bottom-up (Walravens, 2015). These perspectives complement each other, and Social Cycling may cater to both.
From the perspective of top-down smart city design, we can readily imagine two contributions.
1. Data gathering. A side effect of extended usage of this app is that logs may be created which register every bike trip. This is valuable information on mobility, which might inform city planning.
2. Integration to other apps and data sources. Other smart city technologies might be connected, e.g., public transit systems for multi-modal trips, so that the app might help users navigate to bus stops or train stations.
Policy of these sorts can only be enabled and enforced by government. Yet, encouraging platforms that reduce the use of fossil fuels contributes to many governmental agreements dedicated to climate change mitigation, like the Paris agreements and the National Determined Commitments.
From the bottom-up perspective, change and improvement comes only from the people “using” the city. In such a perspective, what defines the Smart City is not the infrastructures or architecture it offers, but the ways in which its citizens interact with these systems as well as each other (Walravens, 2015). This decidedly distributed approach is the main strength of our design. Infusing intelligence through wider awareness of similar bicycle trips, we empower cyclists as local scale decision makers. This might be a valuable contribution to bottom-up policy.
5.5. Impact on Sustainability
This work shows the design for an app that promotes a more social experience of bike riding in a city. Its goal is to enhance the efficiency of street network utilization by increasing safety through flock formation, which may promote bike travel and enable the usage of the public space in cities where there is a lack of infrastructure. As a consequence Social Cycling could indirectly reduce fuel consumption and pollutant emissions.
We do not attempt to predict sizes or impacts of travel preference shifts to cycling. Our simulations show that flocks will emerge, and previous studies show that group rides are safer (Jacobsen, 2003; Furness, 2010; Secretaría de Salud, 2016). Although simulations are run in areas within Mexico City, the same design, indeed the same app can in principle operate in any city. Predictions of health and environmental improvements would probably strengthen the argument for further work, some of which we envisage in section 6.
These predictions must consider many factors and are of enough complexity to justify their own projects, as can be shown by the numerous efforts to quantify the effects of shifting to cycling (Lindsay et al., 2011; Rojas-Rueda et al., 2012; Fyhri et al., 2016; Johansson et al., 2017; Zhang and Mi, 2018). Methods used for quantification are diverse and include big-data analysis, surveys, mathematical and computational modeling, among others. However they all agree that, overall, increased bicycle mobility leads to more sustainable trajectories for cities. Hundreds of deaths avoided (in some models even more that shifting mobility to public transport), thousands of tons of carbon dioxide reduction, millions of liters of fuel not burned, and hundreds of millions of euros saved. Actual predictions depend on the model used for a specific city.
5.6. Flocking in the Time of Pandemic
The recent coronavirus pandemic phenomenon makes us think that social distancing will be the way of life to avoid contagion. But there are several unknowns about what safe distances are, regarding the use of public space (Honey-Roses et al., 2020). In several countries bike mobility is quite relevant and there are very recent studies about safe bike interaction (Chai et al., 2020). Micro-droplet movement during running and walking has been studied and standard distances have been determined to interact with others (Blocken et al., 2020). Calculations for cycling activities are being explored by the same research group and these numbers could be encoded as part of the local rules in future versions of the app.
On the other hand, cycling or micro-mobility, as it is called by Abend (2019), was flourishing prior to the pandemic, and adoption was increasing in urban areas like the ones we simulate in Mexico City. There are interesting trade-offs considering cycling. It is an individualized vehicle, and taking into account research about safe usage and distancing (Blocken et al., 2020; Chai et al., 2020) and in contrast with crowded public transportation, these smaller devices might be welcome in a post-pandemic world and could benefit from street redesigns that include wider sidewalks or enlarged cycling lanes.
Affordability of these devices also make them attractive when the economy is in a downturn (Honey-Roses et al., 2020). Our vision is that Social Cycling will promote bicycle usage by making riding a safer experience in all manners.
6. Recommendations for Delivery and Further Work
In order to deliver the app, there are two areas for further work: 1. the development of the mobile app 2. campaigning for its mass adoption.
Software development for mobile devices faces considerable challenges: e. g. there are many different incompatible platforms, often with incompatibilities within the same platform and each platform has its own standards, interfaces, tools and programming languages. Development is further made difficult by differences in devices' specifications, like CPU speed and screen size. Other obstacles include: the speed at which standards change and the lack of standardized testing platforms (Joorabchi et al., 2013).
To achieve mass adoption of the app these challenges must be met with an appropriate strategy which supports the whole development life-cycle (e.g., requirements analysis, design, implementation, tests, maintenance) (Inukollu et al., 2014). Therefore the development of the mobile app must spin off into a different project.
On the other hand, the computational model shows that flock formation happens beyond a certain number of users, which underlines the importance of a wide adoption of the app.
Thus, a proper campaign should be enacted, perhaps on two fronts. One would reach out to governments and ultimately become a formal program, backed by industry. Similar programs are already in place, e.g., mass rides organized every Sunday in many cities. The other front would try to harness civilian support through networking with influential bike organizations. Many cities are home to large organized communities which usually arrange group rides and other activities through which adoption may be promoted.
Data Availability Statement
The datasets generated for this study are available on request to the corresponding author.
Author Contributions
RG-H designed and implemented the model, ran simulations. PG-M contributed the sustainable cities context to the app. All authors contributed to the article and approved the submitted version.
Conflict of Interest
The authors declare that the research was conducted in the absence of any commercial or financial relationships that could be construed as a potential conflict of interest.
Acknowledgments
RG-H wishes to thank professors Fernando R. Alatriste, José Luis Gutiérrez, Damián Hernández Herrán at the Autonomous University of Mexico City for their valuable input while discussing this work. Likewise I gratefully acknowledge assistance from Be Luecke in proofreading and translation.
Footnote
1. ^The current design uses a centralized component (the Flock Server), but its purpose is to amplify users' awareness, it does not coordinate movements of riders in a centralized way.
References
Abend, L. (2019). Cyclists and E-scooters Are Clashing in the Battle for Europes Streets. New York, NY: Time Magazine.
Agatz, N., Erera, A., Savelsbergh, M., and Wang, X. (2012). Optimization for dynamic ride-sharing: a review. Eur. J. Oper. Res. 223, 295–303. doi: 10.1016/j.ejor.2012.05.028
Angelidou, M., Psaltoglou, A., Komninos, N., Kakderi, C., Tsarchopoulos, P., and Panori, A. (2018). Enhancing sustainable urban development through smart city applications. J. Sci. Technol. Policy Manage. 9, 146–169. doi: 10.1108/JSTPM-05-2017-0016
Assadourian, E., Prugh, T., and Starke, L. (2013). State of the World 2013: Is Sustainability Still Possible? Washington, DC: Island Press.
Blocken, B., Malizia, F., van Druenen, T., and Marchal, T. (2020). Towards Aerodynamically Equivalent Covid-19 1.5 m Social Distancing for Walking and Running. Questions and Answers. Website Bert Blocken, Eindhoven University of Technology and KU Leuven. Available online at: http://www.urbanphysics.net/COVID19.html (accessed May 26, 2020).
Boeing, G. (2017). Osmnx: new methods for acquiring, constructing, analyzing, and visualizing complex street networks. Comput. Environ. Urban Syst. 65, 126–139. doi: 10.1016/j.compenvurbsys.2017.05.004
Boeing, G. (2019). Urban spatial order: Street network orientation, configuration, and entropy. Appl. Netw. Sci. 4:67. doi: 10.1007/s41109-019-0189-1
Boss, D., Nelson, T., Winters, M., and Ferster, C. J. (2018). Using crowdsourced data to monitor change in spatial patterns of bicycle ridership. J. Trans. Health 9, 226–233. doi: 10.1016/j.jth.2018.02.008
Brenschede, A. (2014). BRouter: Let's Get Serious About Bike Routing. Available online at: http://www.webcitation.org/78iVsaXmV (accessed May 28, 2019).
Chai, X., Guo, X., Xiao, J., and Jiang, J. (2020). Spatiotemporal analysis of share bike usage during the covid-19 pandemic: a case study of Beijing. arXiv preprint arXiv:2004.12340.
Chen, F., Turoń, K., Kłos, M., Czech, P., Pamuła, W., and Sierpiński, G. (2018). Fifth-generation bike-sharing systems: examples from Poland and China. Zeszyty Naukowe. Transport/Politechnika Śląska. 99, 5–13. doi: 10.20858/sjsutst.2018.99.1
Ferrari, E., Manzini, R., Pareschi, A., Persona, A., and Regattieri, A. (2003). The car pooling problem: heuristic algorithms based on savings functions. J. Adv. Transport. 37, 243–272. doi: 10.1002/atr.5670370302
Ferreira, J., Trigo, P., and Filipe, P. (2009). Collaborative car pooling system. World Academy of Science, Engineering and Technology, Open Science Index 30. Int. J. Humanit. Soc. Sci., 3, 683–687. doi: 10.5281/zenodo.1063411
Fuelling, G., Neurauter, C., and Spurgeon, L. (2018). Tree data collection app. Available online at: http://cardinalscholar.bsu.edu/bitstream/handle/123456789/201367/GEOG448_Muncie_UrbanForestry_poster_Sp18.pdf (accessed May 28, 2020).
Furness, Z. (2010). One Less Car: Bicycling and the Politics of Automobility, Vol. 29. Philadelphia, PA: Temple University Press.
Fyhri, A., Sundfør, H. B., and Weber, C. (2016). Effect of Subvention Program for Electric Bicycle in Oslo on Bicycle Use, Transport Distribution and Co2 Emissions. TOI Report, (1498/2016). Norway: Institute of Transport Economics/Transportøkonomisk Institutt.
García-Herrera, R. (2018). Road Agent: An Object-Oriented Framework for Modeling Mobile Agents. Available online at: http://www.webcitation.org/78jooVlaq (accessed May 29, 2019).
Gavin, M., Ghosh, B., Pakrashi, V., Barton, J., O'Flynn, B., and Lawson, A. (2011). “A cycle route planner mobile-app for Dublin city,” in Irish Transportation Research Network Conference (ITRN2011) (Cork: University College Cork; Irish Transportation Research Network).
Grimm, V., Berger, U., Bastiansen, F., Eliassen, S., Ginot, V., Giske, J., et al. (2006). A standard protocol for describing individual-based and agent-based models. Ecol. Modell. 198, 115–126. doi: 10.1016/j.ecolmodel.2006.04.023
Grimm, V., Berger, U., DeAngelis, D. L., Polhill, J. G., Giske, J., and Railsback, S. F. (2010). The odd protocol: a review and first update. Ecol. Modell. 221, 2760–2768. doi: 10.1016/j.ecolmodel.2010.08.019
Honey-Roses, J., Anguelovski, I., Bohigas, J., Chireh, V., Daher, C., Konijnendijk, C., et al. (2020). The impact of covid-19 on public space: a review of the emerging questions. OSF Preprints rf7xa, Center for Open Science. doi: 10.31219/osf.io/rf7xa
Inukollu, V. N., Keshamoni, D. D., Kang, T., and Inukollu, M. (2014). Factors influencing quality of mobile apps: role of mobile app development life cycle. arXiv preprint arXiv:1410.4537. doi: 10.5121/ijsea.2014.5502
ITDP (2013). Conteo Ciclista 2013. Available online at: http://www.webcitation.org/78jodtlVJ (accessed May 29, 2019).
Jacobsen, P. L. (2003). Safety in numbers: more walkers and bicyclists, safer walking and bicycling. Injury Prevent. 9, 205–209. doi: 10.1136/ip.9.3.205
Johansson, C., Lövenheim, B., Schantz, P., Wahlgren, L., Almström, P., Markstedt, A., et al. (2017). Impacts on air pollution and health by changing commuting from car to bicycle. Sci. Tot. Environ. 584, 55–63. doi: 10.1016/j.scitotenv.2017.01.145
Joorabchi, M. E., Mesbah, A., and Kruchten, P. (2013). “Real challenges in mobile app development,” in 2013 ACM/IEEE International Symposium on Empirical Software Engineering and Measurement (Vancouver, BC: IEEE), 15–24. doi: 10.1109/ESEM.2013.9
Kanhere, S. S. (2013). “Participatory sensing: Crowdsourcing data from mobile smartphones in urban spaces,” in International Conference on Distributed Computing and Internet Technology (Berlin: Springer), 19–26. doi: 10.1007/978-3-642-36071-8_2
Komninos, N. (2016). “Afterword: smart urban futures,” in Technology and the City: Systems, Applications and Implications, ed T. Yigitcanlar (London: Routledge), 172–181. doi: 10.4324/9781315739090-12
Kramers, A. (2014). Designing next generation multimodal traveler information systems to support sustainability-oriented decisions. Environ. Modell. Softw. 56, 83–93. doi: 10.1016/j.envsoft.2014.01.017
Lindsay, G., Macmillan, A., and Woodward, A. (2011). Moving urban trips from cars to bicycles: impact on health and emissions. Austral. N. Z. J. Public Health 35, 54–60. doi: 10.1111/j.1753-6405.2010.00621.x
Mattingly, S. P., Casey, C., and Johnson, T. (2017). App-Based Crowd Sourcing of Bicycle and Pedestrian Conflict Data. Technical report, Western Michigan University. Transportation Research Center for Livable.
Navarro, K. F., Gay, V., Golliard, L., Johnston, B., Leijdekkers, P., Vaughan, E., et al. (2013). “Socialcycle what can a mobile app do to encourage cycling?” in 38th Annual IEEE Conference on Local Computer Networks-Workshops (Sydney, NSW: IEEE), 24–30. doi: 10.1109/LCNW.2013.6758494
Oliveira, D. S., and Afonso, J. A. (2015). “Mobile sensing system for georeferenced performance monitoring in cycling,” in World Congress on Engineering 2015, Vol. 2217 (London, UK: IAEng), 269–273.
Porter, A. K., and Schwartz, M. (2018). Ride report: mobile app user guide. Brit. J. Sports Med. 52:e4. doi: 10.1136/bjsports-2017-098364
Renner, N. (2018). Web Client for BRouter. Available online at: http://www.webcitation.org/78joWcZwU (accessed May 29, 2019).
Reynolds, C. W. (1987). “Flocks, herds and schools: a distributed behavioral model,” in ACM SIGGRAPH Computer Graphics, Vol. 21 (Los Angeles, CA: ACM), 25–34. doi: 10.1145/37402.37406
Rojas-Rueda, D., de Nazelle, A., Teixidó, O., and Nieuwenhuijsen, M. J. (2012). Replacing car trips by increasing bike and public transport in the greater barcelona metropolitan area: a health impact assessment study. Environ. Int. 49, 100–109. doi: 10.1016/j.envint.2012.08.009
Secretaría de Salud (2016). Más ciclistas, Más seguros. Guía de Intervenciones Para la Prevención de Lesiones en Ciclistas Urbanos. STCONAPRA/ITDP, México, Distrito Federal.
Stehlin, J. (2014). Regulating inclusion: spatial form, social process, and the normalization of cycling practice in the USA. Mobilities 9, 21–41. doi: 10.1080/17450101.2013.784527
Stehlin, J. A. (2018). UNG tree inventory mapping using a mobile GIS app and volunteer field crews. Available online at: https://digitalcommons.northgeorgia.edu/ngresearchconf/2018/ComputerScience_GIS/4/ (accessed May 28, 2020).
Stevens, M., and DâHondt, E. (2010). “Crowdsourcing of pollution data using smartphones,” in Workshop on Ubiquitous Crowdsourcing (Brussels), 1–4.
Walmink, W., Wilde, D., and Mueller, F. (2014). “Displaying heart rate data on a bicycle helmet to support social exertion experiences,” in Proceedings of the 8th International Conference on Tangible, Embedded and Embodied Interaction (Melbourne, VIC), 97–104. doi: 10.1145/2540930.2540970
Walravens, N. (2015). Mobile city applications for Brussels citizens: smart city trends, challenges and a reality check. Telemat. Informat. 32, 282–299. doi: 10.1016/j.tele.2014.09.004
Zaman, A. U. (2014). Roadmap towards zero waste cities. Int. J. Waste Resour. 4:1000e1106. doi: 10.4172/2252-5211.1000e106
Keywords: self organization, bicycle safety, Zero Vision, mobile app, bicycle, smart cites, agent-based modeling, critical mass (cycling)
Citation: García-Herrera R and García-Meneses PM (2020) Social Cycling: Critical Mass Through a Mobile App. Front. Sustain. Cities 2:36. doi: 10.3389/frsc.2020.00036
Received: 04 September 2019; Accepted: 10 June 2020;
Published: 24 July 2020.
Edited by:
Francesco Pilla, University College Dublin, IrelandReviewed by:
Eduarda Marques Da Costa, University of Lisbon, PortugalRichard Grant Gilmore III, College of Charleston, United States
Copyright © 2020 García-Herrera and García-Meneses. This is an open-access article distributed under the terms of the Creative Commons Attribution License (CC BY). The use, distribution or reproduction in other forums is permitted, provided the original author(s) and the copyright owner(s) are credited and that the original publication in this journal is cited, in accordance with accepted academic practice. No use, distribution or reproduction is permitted which does not comply with these terms.
*Correspondence: Paola Massyel García-Meneses, cGFvbGEuZ2FyY2lhQGVjb2xvZ2lhLnVuYW0ubXg=