- 1Center for Environmental Building and Design, Weitzman School of Design, University of Pennsylvania, Philadelphia, PA, United States
- 2School of Architecture, University of Ulsan, Ulsan, South Korea
This paper examines the metabolism of urban location, which is offered as a contribution to the expansion of urban metabolism analysis beyond the largely biophysical methods of mass-energy-balance and emergy accounting. But how does the real estate logic of location enter the stock and flow calculations of urban metabolism, and how can it help us better understand the physiology of a more sustainable city? A new, locational quantity, EL, is defined as the additional emergy value obtained by a tract of urban land due to interconnection with the other land parcels in the city. It is based on their level of development and proximity measured in terms of travel time. The article uses the greater Philadelphia region as a case study to examine the metabolic value of location, and its role in the transition to a renewable economy.
Throughout this evolution [of cities] there is only one factor which defines the extent of human settlements: the distance man wants to go or can go in the course of his daily life.
Introduction
This paper examines the metabolism of urban location, which is offered as a contribution to the expansion of urban metabolism analysis beyond the largely biophysical methods of mass-energy-balance and emergy accounting (Pincetl et al., 2012; John et al., 2019). The biophysical approach of urban metabolism has provided powerful insights into the effect of human settlements on their environments, beginning in the nineteenth century with the application of thermodynamic principles to social activities at many scales and then focusing in the late twentieth century on a variety of methods applied specifically to cities (Fischer-Kowalski, 1998; Fischer-Kowalski and Hüttler, 1998). The recent focus has been to better “understand the drivers that affect the flows” of energy and materials through cities, to more directly connect them to “social and economic spatio-temporal processes” (Dijst et al., 2018).
Our interest in a locational principle derived from an earlier study using emergy analysis to examine the spatial distribution of assets within the greater Philadelphia region (Braham et al., 2019). That study focused on metabolic activities at the level of the census tract to identify factors driving consumption decisions, looking specifically at the interaction between the accumulation of assets (buildings, infrastructures, vehicles, education, etc.) and the flows of resources. It used a classic stock and flow approach, but we ultimately recognized that it dramatically undervalued the importance of one particular form of asset: transportation. We accounted for the investment in transformation infrastructures (highways, roads, rails, etc.) and the power to operate them, but we were missing the actual effect of transportation, the connection between areas of the city and the shortening of travel time between them.
The formative logic of cities is proximity. Despite the many powerful modes of long distance communication, people continue to gather in larger and larger cities, to get closer and closer together. An empty lot in the center of a city is valuable because of its proximity to nearby jobs, customers, transportation, and infrastructure. The same lot in a rural setting is only as valuable as the adjacent farmland, unless it is close to a transit system connecting it to the city, then it becomes a potential site of development. But how does the real estate logic of location enter the stock and flow calculations of urban metabolism, and how can it help us better understand the physiology of a more sustainable city?
In a biophysical approach, the value of land derives from the assets collected on it or buried underneath it, which in turn attract the people and resources that drive economic activity. But location is neither a stock nor a flow of resources; it is a relational property of the urban system that emerges from the spatial arrangement of activities on the landscape. The value of location cannot be measured directly and is typically established by a real estate market. This paper proposes a method for assigning a metabolic value to urban location, using the average travel time between locations as a factor to determine how much value a lot obtains from or shares with the lots that surround it. Applied across a city or region, this not only provides us with a method to evaluate specific locations, but to understand the spatial organization of cities as they have grown into the polycentric mega-cities that now characterize urbanized areas.
In a 1970 article explaining his theories of urban planning, the Greek urbanist Constantinos Doxiadis presented a sequence of plan diagrams illustrating the effect of available energy on the growth of cities (Figure 1). The examples range from a compact, pre-modern village with a “daily per capita consumption of 8,000 calories” to a sprawling “central settlement of a system of villages during the era of the automobile and industry” (33,000–100,000 calories per person per day). In his account, each increase in available energy results in a corresponding increase in size, which certainly describes much of the transition from pre-modern to contemporary cities. According to the Energy Information Agency, the average energy consumption in North America is now about 173,000 calories per person per day, while the global average is 53,000 and the lowest is 11,000 in Africa (EIA, 2016).
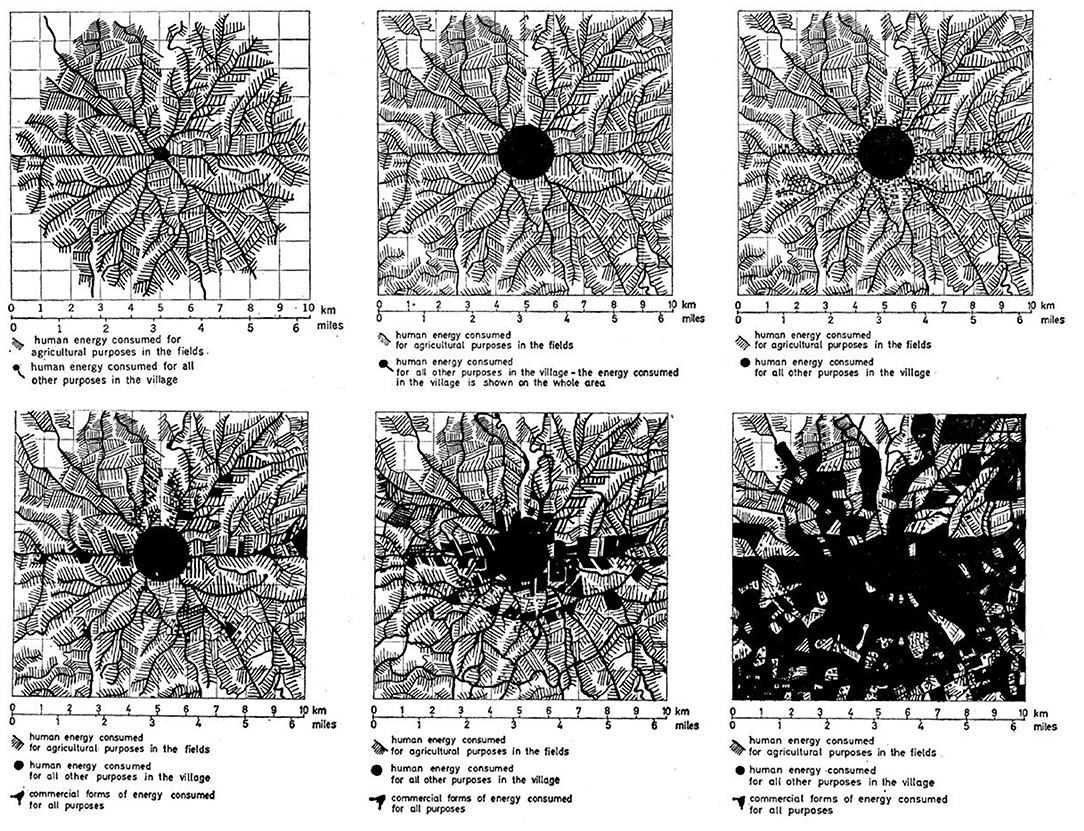
Figure 1. C. Doxiadis, Urban regions with different levels of available energy, from pre-modern village in the upper left to a sprawling central settlement of a system of villages during the era of the automobile and industry in the lower right. The dark color shows the area of human activity spreading out as the amounts of availble energy increase. Initially this just makes the concentric city larger, but then the expanded shape changes according to topography and internal connections.
Energy is only a first requirement for growth, however, and other limiting factors quickly come into play, especially travel time within and around the city, which is determined by much more than the amounts of power directly available for movement (a fast car is little use without a road or faced with a traffic jam). Travel time is determined by the whole system of the city, by all the resources invested in vehicles and transportation systems, as well as in the buildings and resources needed to support the higher densities of population. Greater density will eventually crowd the more popular routes and require larger roads and faster networks, in a classic example of self-organizing and self-limiting growth.
A generation of urban scholars have charted, explained, and criticized the sprawling urban areas that have appeared through the twentieth century (Geddes, 1915; Doxiadis, 1968; Garreau, 1991; Calthorpe, 2001; Batty, 2018). Many denounce urban sprawl as inefficient and wasteful, but it is a surprisingly predictable form that cities assume when energy resources are plentiful and populations grow. H.T. Odum described sprawl as a “weedy” form of growth, useful for quickly covering large portions of land and preparing for more durable forms, but that initial coverage has grown “lumpy” over time, producing multiple points of intensity that often rival the original city center (Odum, 2007, p. 46, Krugman, 1996). According to Marchetti, the fundamental factor shaping city growth is the hour that most people were willing to commute each day and empirical data from many different periods and cities still supports that limit (Zehavi, 1974; Marchetti, 1994; Ahmed and Stopher, 2014). The constraint of the half-hour one-way commute means that at a certain distance from the center, smaller regional centers become attractive destinations for commuters located further out, allowing those centers to expand and intensify.
Locational value is an emergent and constantly shifting property that helps shape cities, so the transition to a renewable urban economy cannot be achieved simply with reduced consumption or greater operational efficiencies. People are remarkably mobile and relocate quickly to avoid inconvenience or to seek new opportunities. In the classic view, more effective transit enhances sprawl, while slower transit increases density, but existing buildings and infrastructures cannot move as quickly as people, so any transition will begin as an adaptation of contemporary sprawl.
Location
Cities are not genetically regulated organisms that grow and operate according to a formal code, though we constantly impose rules and regulations to constrain their excesses and channel their growth. They are more like eco-systems, made up of many, separate elements that interact, and cooperate in a more open fashion to create a stable entity. The effect (and cause) is a reinforcing interaction among many different kinds of actors, from living creatures like bacteria and humans to social and technological systems like governments and transit systems, all assembling themselves on top of a landscape with spatial opportunities previously constructed by geology, hydrology, and other natural processes. Most pre-modern cities were located on a river or port, providing easier, faster transportation. For example, Philadelphia is situated between the Delaware and Schuylkill rivers, at the point in the state of Pennsylvania with the most direct connection to the sea.
Once the first structures or infrastructures are built, mutually interacting activities shape the patterns of growth that follow. In Philadelphia it began with the focusing effect of the port on the Delaware River and the market it supported, but the power of location quickly diffuses though the many sites of social and economic interaction, whose locations are ultimately determined by the ease of connection to other active locations. A residential neighborhood is valuable because of its transportation links to nearby jobs and that increase in value is related to the time it takes to travel between them. The longer it takes to reach a job, the less value it adds to the neighborhood.
The value of urban locations lies precisely in linking land of different types, values, and intensities. A plot of land has three ways to provide value. First is the spatial ability to receive resource flows—sun, rain, wind, fuels, materials, etc.—determined largely by its size and position. Second is the value of the assets located on or under the land, such as soil, buildings, minerals, or fuels. Third is its location relative to other parcels of land. This paper examines the third value of location, using time of travel between locations as a measure of the interconnection, and is built on a previous study of the first two values, which determined the assets and resources flows (renewable and non-renewable) for the 1,379 census tracts in the nine-county Philadelphia region (Braham et al., 2019).
Transportation costs formed the basis of Von Thunen's theory of economic geography. He based his theory of land value (rent) on the difference between the costs of production for a particular crop and the cost of transportation to the market center (Thünen et al., 2009). For this study we use an emergy accounting (see below) of the total resources invested in a site instead of the economic value determined by a market. Previous emergy based studies have only considered the assets and inputs directly attributed to a site (Brown, 1980; Odum et al., 1995; Huang and Chen, 2005; Ascione et al., 2009; Campbell and Ohrt, 2009; Liu et al., 2011). These studies revealed the richly hierarchical distribution of intensity within cities, mirroring the land value described in von Thunen's model, but they do not distinguish the value that land obtains simply by its location or explain the variations from a purely mono-centric city shape. We account for the reinforcing effect of urban interconnection with a proportional formula based on the time of travel between parcels of land, assigning some of the value of high-intensity land to lower intensity parcels to which they are connected. This puts a precise value on location, which can be affected both by the speed of the transportation system connecting them and by changes in investments in the other locations to which it is connected by those systems. It also provides a metric for considering the effect of teleconnection, though that is not fully explored in this paper and would require an accounting of the movements of goods between locations (Seto et al., 2012).
Methodology: Emergy Synthesis
The project uses the method of emergy synthesis to evaluate the interaction of natural and socioeconomic factors in the self-organization of the Philadelphia region. As Odum explained it, “Emergy (spelled with an m) is the available energy of one kind previously used up directly and indirectly to make a product or service” (Odum, 2007). Emergy is a comprehensive form of life-cycle analysis that accounts for all the work and resources dissipated in the production of a product, service, or activity, including the “free” work performed by global eco-systems. The result is normalized to the original solar energy in “solar emjoules” (sej), which produces Unit Emergy Values (UEV) expressed as sej/J, sej/g, sej/$, etc. that can be used for calculation and as a measure of the intensity or quality of the resource (Odum, 1996). The UEVs used in the study were drawn from many sources. Where possible they have been adapted specifically to the region, but in other cases, the closest analog was used to complete the analysis (Braham et al., 2019).
Although emergy synthesis provides a powerful common metric of comparison, the ultimate goal of the method is to understand the structure and behavior of self-organizing systems. Odum's insight was that the emergy intensity of a resource in a mature system was a measure of the value of that resource to the system. The original hypothesis was based on natural food-chains, in which predators are an “expensive” resource that regulate the population of herbivorous animals who would otherwise deplete the available plant matter, justifying the higher cost of the predator. A successful ecosystem results from the interaction of many different actors, balancing populations and resources, and the method of emergy synthesis has been successfully extended to the interaction of human and natural systems (Odum, 1996; Campbell and Ohrt, 2009).
Urban Metabolism: Assets and Resource Flows in Philadelphia Region
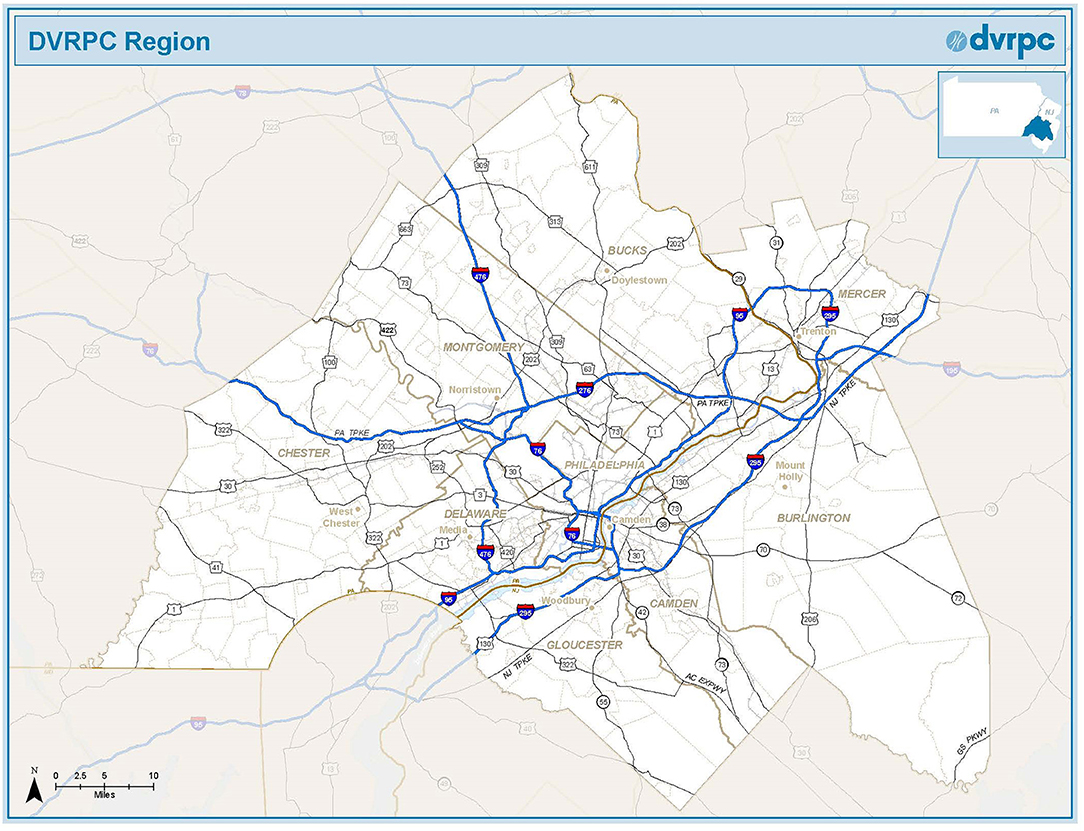
The city of Philadelphia is currently the sixth largest city and the seventh largest “metropolitan statistical area (MSA)” in the United States (Census, 2017). It is located in the middle of the Northeast Megaregion that extends from Boston to Washington DC. The study area selected for the project is the nine-county region established by the Delaware Valley Regional Planning Commission (DVRPC), which includes 95% of the MSA, comprising 6,096,905 people in 2,346,978 households with 3,189,505 jobs (Figure 2). The DVRPC administers many programs and monitors all modes of travel throughout the region, for which they maintain a comprehensive transportation model that provided the zone-to-zone travel time data for this study (DVRPC, 2017).
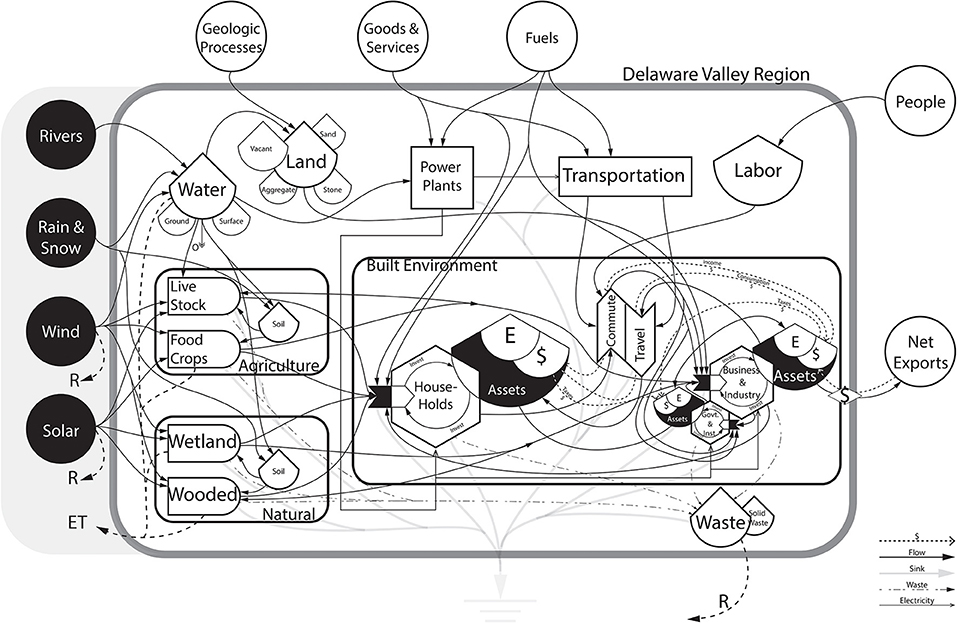
The Energy Systems Language (ESL) diagram shown in Figure 3 describes the urban metabolism of the region. It was developed for the base study and focused on the consumption level activities of households, non-residential actors, and basic interactions with government activities. The land use and building information was extracted and harmonized from county level tax data, the DVRPC GIS land-use models, the US Census, and the American Community Survey (ACS, 2017). The region has 352 municipalities, including the cities of Philadelphia, Camden, and Trenton (the capital of New Jersey) and 1,379 census tracts, which each represent about 4,400 residents.
The census tracts form the basic unit of analysis and an overlay of the county-level tax data, the land use map, the municipal government expenditure data, and the census data was used to establish the number of residents, workers, and land and building areas in each census tract, distinguished by type and use. Annual costs of transportation were included with the depreciation cost of the infrastructure and the amounts expended on travel and commuting as determined with DVRPC surveys. The DVRPC traffic model uses Traffic Analysis Zones (TAZ) of slightly different sizes and shapes than census tracts, so these were overlaid and the average tract-to-tract travel times were calculated accordingly. These travel times combine automobile and transit times, using the shortest travel time for the calculation about location.
Assets were evaluated for each category of land-use in a census tract, from soils and biomass for agriculture and wooded areas to buildings and education levels for households. Building and household consumption data for food, water, and energy were derived from national (and regional) norms, multiplying building areas, or number of residents by normalized consumption data, which were checked against county level utility data. Developed land was grouped in three broad categories, Residential, Business and Industry, and Government and Institutional. The results are compiled and reported at the level of the census tract, giving a detailed picture of the emergy intensity of land-uses within the region (Figure 4).
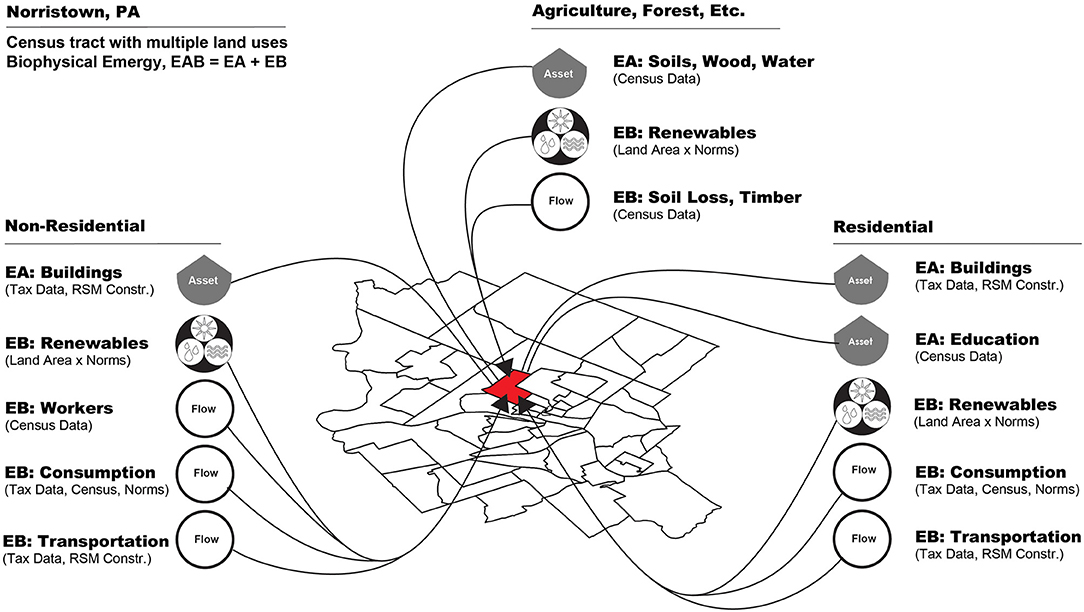
Figure 4. Biophysical emergy intensity, EAB, of a census tract accounting for assets (EA, stocks) and annual inputs (EB, flows), sej/yr.
Accounting for Location
The method used to account for the value of a particular location within the region is based on the proposition that the benefit it receives from proximity to other locations is inversely proportional to the time it takes to travel between them. The longer it takes to get to another location, the less effect it has on the value of your location. Time of travel is determined by distance, by the means of transportation connecting them, and by amounts of traffic. The reason the DVRPC and urban planners study transportation so carefully is that almost any change in transportation systems, traffic patterns, or travel choices can dramatically alter the decisions that individuals and businesses make about where to locate.
This is conceptually similar to the popular “gravity model” of traffic forecasting, which uses travel time, cost, or distance to describe the degree of attraction between two locations (Barnes, 1961; Lenormand et al., 2016). In its simplest form, the number of trips (Tij) is proportional to the population (Pi, Pj) and inversely to a “friction factor,” which is typically distance, cost, or travel time (Cij): (Wikipedia, 2019). However, we are interested in the total value (or trips) received by a location rather than the strength of one particular connection, so we developed a simple expression using average, midday travel time as the friction or proportion factor. We started with the base emergy for each census tract x, EABx, which can be called the biophysical emergy of the tract to distinguish it from the locational value. The biophysical emergy is the annual depreciation of the assets or stocks (EAx) plus the annual inputs or flows (EBx) as developed in our previous paper and conventionally calculated in emergy synthesis (Braham et al., 2019). Assets include structures, infrastructures, and the education of the residents. In economic terms, they are all “funds” built with an initial investment of work and resources that then provide a “service” over a predictable lifespan. Annual inputs include all the renewable and non-renewable resource flows. The interaction between assets and annual inputs was the focus in the previous study, but for this project the sum of the two, the total biophysical emergy, EABx, will be used.
To understand the value of location a new quantity was defined, ELx, the emergy value obtained by tract x due to connection with all the other tracts in the region. It is the benefit obtained from other parcels based on their level of development and proximity measured in terms of travel time. Figure 5 illustrates the benefit received by one tract in the Norristown CBD, EAB1, from the physically adjacent tracts, EAB2-EAB8 and from two located in the central business district, EAB9 and EAB10 to which it is connected by rail and highway networks. Each connection contributes some location value, ELij. In this case, the tract is located at the intersection of almost all the major networks in the region and so benefits enormously from its location.
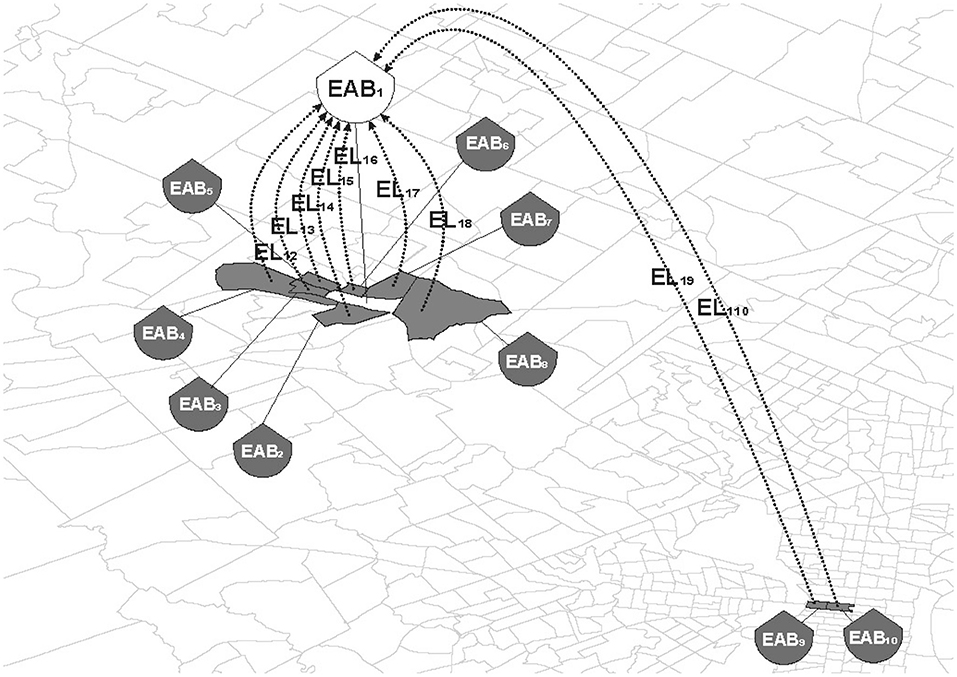
Figure 5. Calculation of locational value for a regional center, the Norristown CBD, with biophysical emergy value, EAB1. Locational value EL1x is shared by each adjacent tract with biophysical emergy value, EAB1x and by more remote sites, such as EAB9 and EAB10 located in Philadelphia's CBD.
In the full calculation of ELx, tract x receives some benefit from every other tract in the region, which is proportional to the emergy invested in those other tracts and inversely proportional to the amount of time it takes to reach them. The amount of benefit is scaled to the maximum travel time between parcels in the region, which is a somewhat arbitrary factor discussed in more detail below.
Where:
EAx = Emergy of assets on land parcel x, annual depreciation, sej/yr
EBx = Emergy of annual inputs on land parcel x, sej/yr
EABx = EAx+EBx, sej/yr
a = scaling factor, minutes2
txj = average time of travel between parcel x and j, minutes
tmax = maximum time of travel within region, minutes
With the benefit to the location determined, we can calculate another new quantity called the Urban Morpho-Emergy, UMEx, which is the biophysical emergy, EABx, plus the locational value, ELx. Depending on its relative position in the region, the locational value can be much smaller or larger than the biophysical emergy, giving UME a different spatial pattern than EAB. Even though the UME of individual parcels can increase or decrease in value according to the magnitude of EL the total biophysical emergy of the region doesn't change, so a balancing factor, fc, is introduced to preserve the total.
Where:
UMEx = Urban morpho-emergy of land parcel x, sej/yr
fc = balancing factor, see below
The base emergy of each parcel, EABx, is reduced by this factor and the individual locational value is added. Since EL can vary widely depending on its position and access to transportation systems, it means that UME can be larger or smaller than the biophysical emergy, EAB. The balancing factor is based on the premise that UMEtot = EABtot, so fc is determined as follows:
Where:
The size of the balancing factor is ultimately determined by tmax, the scaling factor introduced in the calculation of EL. The larger the maximum travel time (tmax), the smaller the locational benefits (EL), the larger the balancing factor (fc), and smaller the difference between UME and EAB. This is illustrated in Figure 6 which shows ranked plots of EAB and of UME at multiple values of tmax. The distribution of UME visibly flattens as tmax decreases, with some values dropping dramatically at tmax between 40 and 60 min. We settled on a scaling factor of tmax = 60 min because it represented the maximum distribution of value across the region, enhancing the effect of location, though the precise amount of the distribution remains a topic for further study. Ultimately, it is the patterns of the redistribution of value that are so interesting and appear to balance the dramatic concentration of value at the center that is revealed in the biophysical measure of value. The flattening visible in the plot suggests a common-sense principle of urban self-organization, that the population relocates according the relative value of land so they can maximize their own wealth and power and as result help the city balance value across its territory.
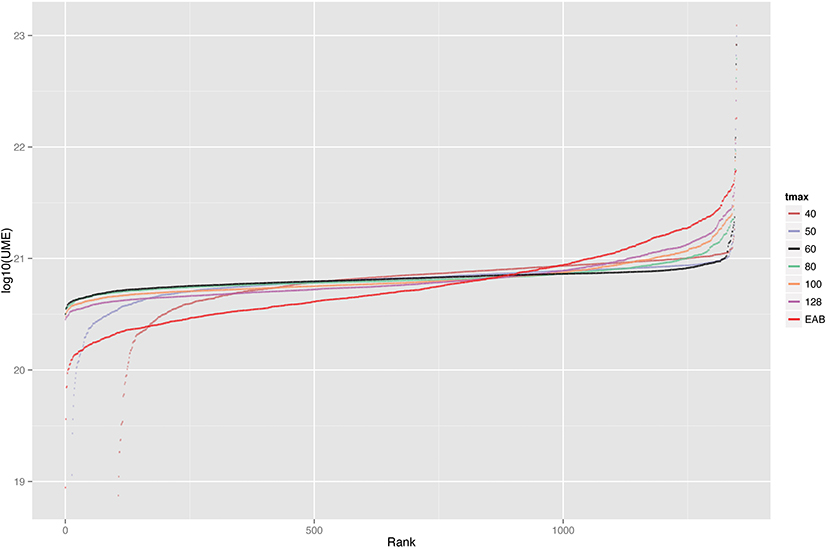
Figure 6. Ranked chart of EAB and UME per census tract, showing UME at multiple values of tmax and fc.
It is worth noting that census tracts have roughly the same population, so UME is effectively a per capita calculation. In other words, the Urban Morpho-Emergy, UMEx, of each census tract is a property of the city as a system. It describes the relative value of land within the city-region, so it can't be compared directly with the biophysical emergy of EAB, but reveals one of the factors regulating the urban metabolism. Ultimately it was the ratio between EAB and UME that proved to be a more useful metric, since it is not as affected by the scaling factor. Table 1 shows the data for the 10 census tracts used to illustrate the calculation of EL in Figure 5 and we see the differences in biophysical emergy intensity, EAB, and the emergy of location, EL, between the regional CBD in Philadelphia and that of an exurban center, Norristown. The implications of those differences will be discussed in the results.

Table 1. Data for 10 census tracts used to illustrate calculation of EL in Figure 5.
To further explain the calculation of UME, Figure 7 illustrates the locational benefits received by two different tracts. The first, the Norristown CBD, part of an exurban center that developed around a colonial town on the upper Schuylkill river, and the second, Bass River, a rural township in the Pine Barrens of New Jersey. Each receives locational benefits from all the other 1,379 tracts in the region in proportion to the level of development of those other tracts and the ease of reaching them. However, the net effect on the two tracts is quite different. The UME of Norristown is double its EAB, while that of Bass River is reduced to 70% of its EAB, meaning that Norristown benefits tremendously from its location. See Table S1 in Supplementary Material for full data.
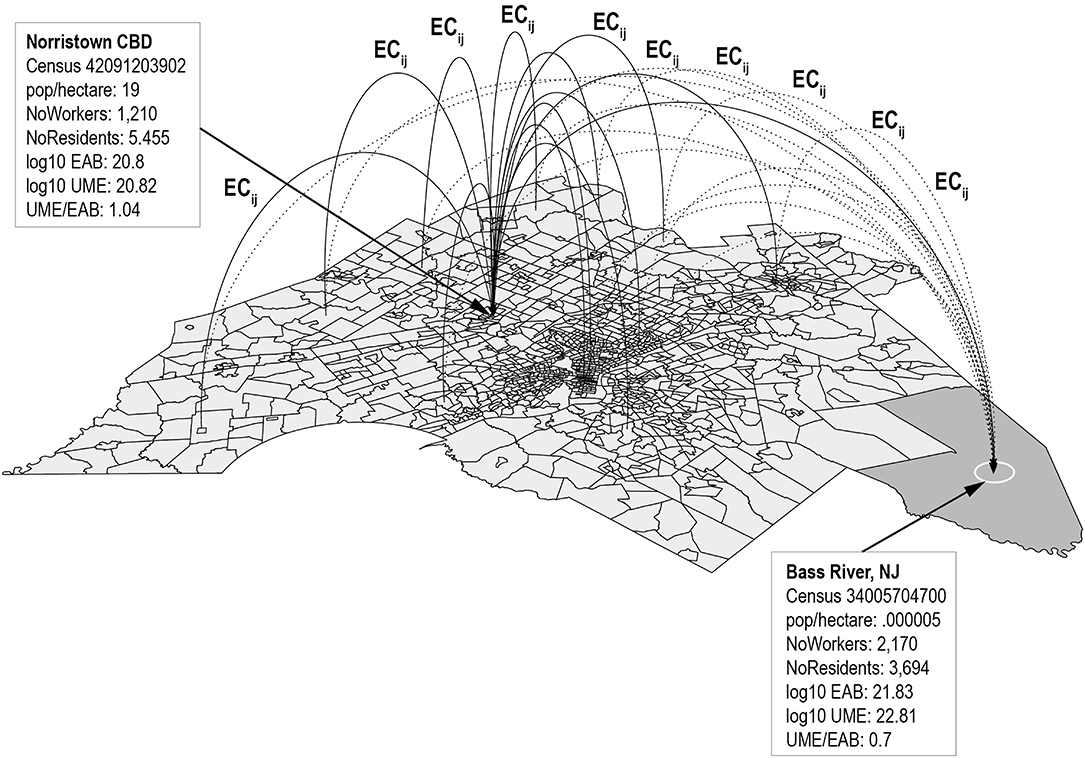
Figure 7. Diagram of Philadelphia region illustrating the benefit received by two different locations, an exurban center, Norristown CBD, and a rural township, Bas River, NJ. Each receives some benefit from each of the other 1,378 census tracts, but the UME of Norristown is double its EAB, while that of Bass River is reduced to 70%.
Of course, the boundary of a region is always a factor. Tracts at the edge of the nine-county region will receive locational benefit from nearby municipalities outside the boundary, but the premise of the regional definition adopted by DVRPC is that it captures most of the commuting and employment within the region. Philadelphia also benefits from its connections to New York and Washington, DC, which are even further outside the reach of the dataset we developed. The strength of those connections will have to be tested in a future study, but the even longer travel times suggest that the effect will be modest. The validity of this approach can be tested against tax assessments or real estate values, which are also influenced by other factors, but the most interesting results may be detected in the changing pattern of emergy intensity across the region as a result of including the effect of transportation.
Results
The effect of locational value becomes evident in the regional maps of emergy intensity. Figure 8 shows the emergy intensity per square meter (sej/m2) for EAB and UME. The basic pattern of greater intensity in the center are similar for both plots, but the UME/m2 shows a greater difference between center and periphery and a larger central area of intensity that includes the exurban centers. Including the effect of transportation makes the poly-centric sprawl more visible. As Krugman observed in The Self Organizing Economy, the concentrations within cities result from the balance between factors attracting people and businesses to a location and others pushing them away (Krugman, 1996). In our accounting of location, it is the concentration of assets that attracts, while the time it takes to reach the location reduces that attraction. As the size and population of the city expands, the time to reach Center City increases and the attractiveness of regional employment and shopping centers grows.
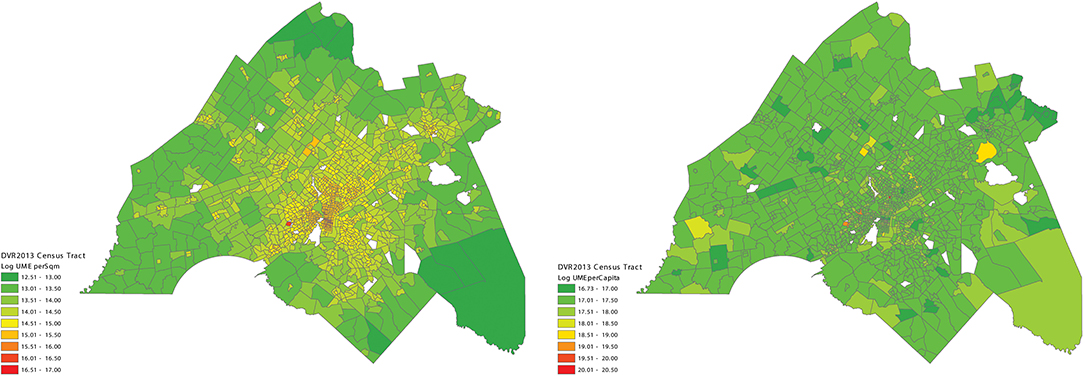
Figure 8. Emergy Per Square Meter. EAB, assets and annual inputs (left), UME, urban morpho-emergy adjusted for location (right) sej/m2.
Figure 9 shows the emergy intensity per capita for EAB and UME. The dramatic contrast visible in the map of EAB per capita, in which the outlying areas show much greater intensity per person than the center, is visibly reduced in the map of UME per capita, with the flattening of UME described in the sensitivity plots of tmax. If we only examine the per capita intensity of EAB, it is easy to conclude that rural or undeveloped land is costly and/or wasteful, but the more even pattern of UME per capita suggests that more lightly occupied land still has a role in the city as an interconnected system.
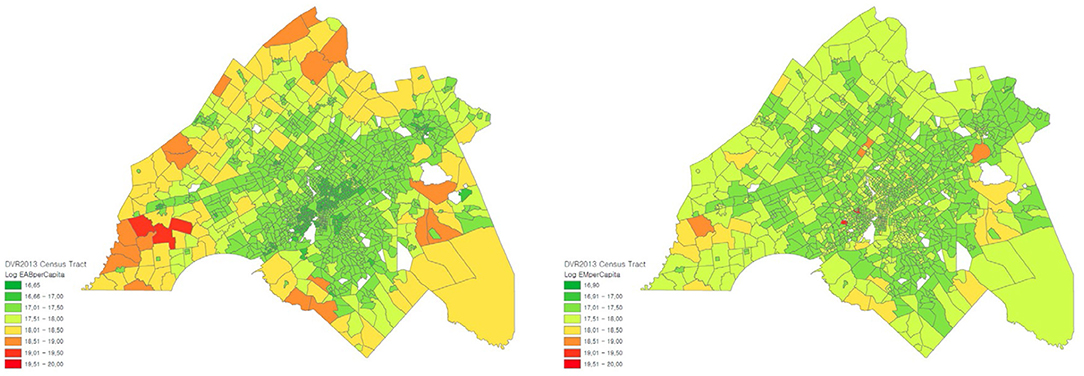
Figure 9. Emergy Per Capita. EAB, assets and annual inputs (left), UME, urban morpho-emergy adjusted for location (right) sej/capita.
As illustrated previously, the intensities revealed in these maps of UME are dictated by the tmax scaling factor, heightening or reducing this effect. However, the ratio between UME/EAB, which is less influenced by the scaling factor, provides a clearer picture of the effect of transportation infrastructure in the self-organization of the region. Figure 10 shows a map of UME/EAB for each tract, highlighting the increase in location value that follows the transportation networks. The two major highways I-76 and I-95, along with the regional rail system generally determine the patterns of urban value. The limits of daily travel time help to explain the emergence of the exurban centers, which have developed in a ring around the central business district (CBD). These all exhibit increases in UME/EAB, benefitting from their location within suburban residential regions and their connections the CBD.
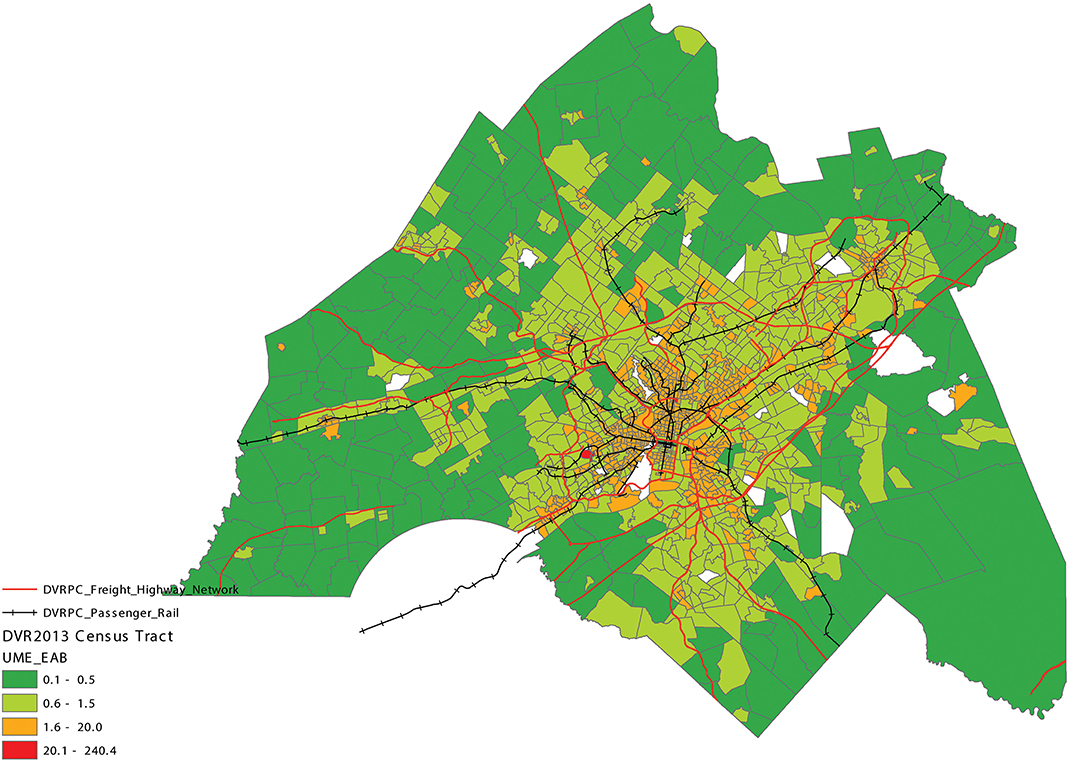
Figure 10. Locational value, UME/EAB, ratio of urban morpho-emergy to assets and inputs, showing that the pattern of urban value follows transportation networks.
The ratio between UME/UAB also provides a snapshot in the life-cycle of urban neighborhoods, which develop and decline over time, attracting residents and businesses to less expensive land located close to land with greater value. Figure 11 shows the ratio of UME/EAB in the center of Philadelphia. The central business district (CBD) actually decreases in value by 0.25–0.5 because it of the intensity of development, while they immediately adjacent, mixed-use neighborhoods range from 0.6 to 0.97. It is the poorer, less developed neighborhoods just outside the central area that show some of the largest benefits of location, with increases on the order of 2 to 4, indicating the value that they receive from proximity to the CBD. If these areas had accumulated or retained as many assets (structures, infrastructures, and education) as wealthier areas then their net increase in value would be smaller. These ratios suggest that these areas are ripe for redevelopment and all of them are active sites of gentrification as others move in to take advantage of the value of the location.
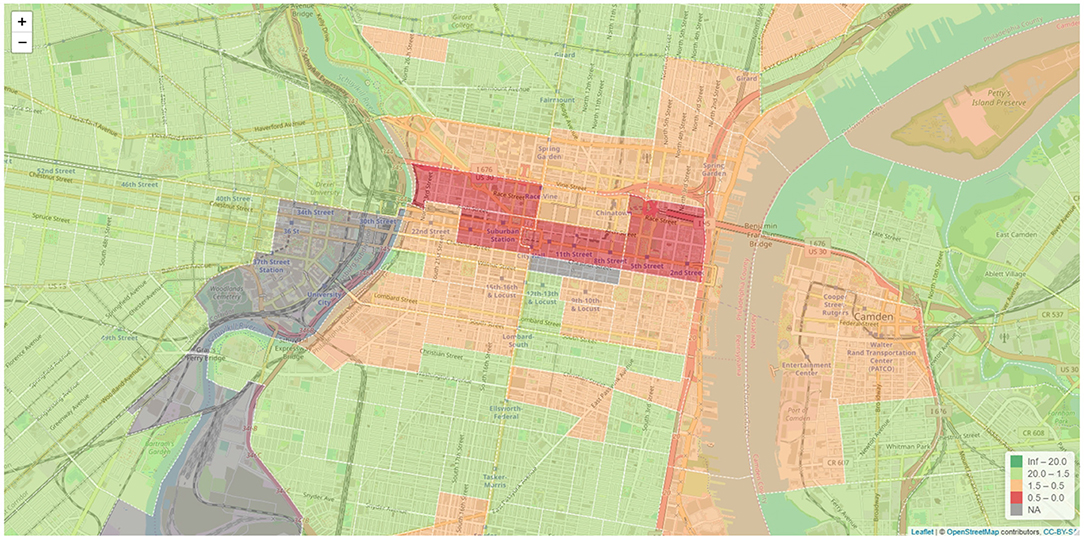
Figure 11. Locational value in Center City Philadelphia, UME/EAB, ratio of urban emergy to assets and inputs, showing that the pattern of investment and decay around the city center.
The decrease or sharing of UME by the CBD may seem counter intuitive at first, but it exemplifies the importance of location in the behavior of the city as a system and provides a valuable counterpoint to the spatial concentration of biophysical emergy at the center. The degree of concentration of buildings and jobs in the center is only possible because of the connection to the large populations in surrounding areas. As suggested by the sensitivity tests of tmax, transportation works to even out the emergy intensity per capita across the region, essentially confirming Doxiadis's observation that travel time determines the functional size of the city.
Conclusions
This paper examines the metabolism of urban location using the method of emergy synthesis and a new, system property based on average travel time. In a previous paper, detailed data on assets, and annual inputs were developed for each of the 1,379 census tracts in the nine-county Philadelphia region (Braham et al., 2019). Assets included buildings, infrastructures, and education levels of the population (which depreciate over time). Annual inputs included all the biophysical resource flows, the food, energy, water, materials, supplies, and services that power the contemporary city, including the environmental resources that are typically discounted as free. In particular, this study sought to determine the value of urban location, which is not a biophysical property, but an emergent property of urban settlements, a spatial and temporal property that influences its morphology and metabolism.
The previous study focused on the importance of the assets—buildings, infrastructures, and education—in determining the annual flows of resources through the city. Unlike people, buildings and infrastructures are fixed in place and because of their longevity and the social and cultural institutions that develop around them, they continue to attract people and activities even when they no longer serve their original purposes. This is especially true of transportation networks, whose rights-of-way constitute a foundational element shaping cities, as illustrated by the endurance of topographically located (and named) roads, like Ridge Avenue or Baltimore Pike in Philadelphia, even though they meander across more efficient, high-speed networks.
Cities increase their power by bringing more people together for more interactions, which can be accomplished either by increasing the spatial density of population, by shortening the time of travel between locations, or both. This study used a simple formula to determine a specific locational value for each census tract, which is inversely proportional to the time of travel to other locations and proportional to the intensity of development on those other tracts. An empty lot surrounded by highly developed land receives a great deal of locational benefit from its neighbors, while that developed land loses value in turn by being located near vacant properties. We add this locational value, EL, to the biophysical value of each tract, EAB, to produce a measure called Urban Morpho-Emergy, UME, adjusted to avoid double counting across the region.
Locational value is a property of urban land that reveals the internal pressures that inspire urban populations to relocate and that enable the city as a system to adjust its use of land. Populations move according to the value of urban land and the opportunities provided by different locations, balancing time of travel against the benefits of proximity to highly developed urban sites. Fueled by concentrated and inexpensive power, contemporary cities have extended their transportation networks, allowing them to grow dramatically over the last 200 years and expanding across the landscape, but the demands will change as the economy shifts to less concentrated forms of power. That can occur in many ways, but any change that affects the time of travel will alter the shape of the city. The transportation assets built by one generation dictate the design options of subsequent generations, and each decrease in travel time brings more land into the daily activity of the city.
For planners and policy makers considering the paths to a sustainable city, transportation is the tool that has facilitated the emergence of the mega-region. Unless land use is regulated, greater efficiency of transportation will simply intensify sprawl.
Future Work
The current study was based on data compiled at the level of the census tract, and while the patterns of locational value across the region revealed some important dynamics, analysis with more fine-grained data sets offers the potential for further insights.
The study was also undertaken initially in support of an interactive, agent-based planning game, but the first formulation was mostly a linear expression of the assets assembled on a site, something like the board game Monopoly. The factor needed to make the game dynamic, and playable, was a relational value for land, which could inspire the population to relocate or adjust their consumption patterns. With the derivation of an emergy-based locational value, EL, we have the first piece needed to develop a dynamic tool to explore the metabolic effects of different urban planning strategies.
Data Availability Statement
All datasets generated for this study are included in the article/Supplementary Material.
Author Contributions
This project grew out of a multi-year collaboration between WB and JL on the metabolism of the Philadelphia region. The concept for locational value was developed by WB and the calculations were prepared by JL.
Conflict of Interest
The authors declare that the research was conducted in the absence of any commercial or financial relationships that could be construed as a potential conflict of interest.
Supplementary Material
The Supplementary Material for this article can be found online at: https://www.frontiersin.org/articles/10.3389/frsc.2020.00004/full#supplementary-material
References
ACS (2017). The American Community Survey. Washington, DC: U.S. Dept. of Commerce, Economics and Statistics Administration.
Ahmed, A., and Stopher, P. (2014). Seventy minutes plus or minus 10—a review of travel time budget studies. Transport Rev. 34, 607–625. doi: 10.1080/01441647.2014.946460
Ascione, M., Campanella, L., Cherubini, F., and Ulgiati, S. (2009). Environmental driving forces of urban growth and development. An emergy-based assessment of the city of Rome, Italy. Landscape Urban Plan. 93, 238–249. doi: 10.1016/j.landurbplan.2009.07.011
Barnes, C. F. Jr. (1961). Integrating Land Use and Traffic Forecasting. In: Highway Research Board. Bulletin: Highway Research Board.
Braham, W. W., Lee, J. M., Oskierko-Jeznacki, E., Silverman, B., and Khansari, N. (2019). Spatial concentration of urban assets in the Philadelphia region: an emergy synthesis. Ecol. Model. 401, 52–68. doi: 10.1016/j.ecolmodel.2019.03.016
Brown, M. T. (1980). Energy Basis for Hierarchies in Urban and Regional Landscapes. Ph.D. Department of Environmental Sciences, University of Florida.
Calthorpe, P. (2001). The Regional City: Planning for the End of Sprawl, ed William BF. Washington, DC: Island Press.
Campbell, D. E., and Ohrt, A. (2009). Environmental Accounting Using Emergy: Evaluation of Minnesota. Narragansett, RI: US Environmental Protection Agency.
Dijst, M., Worrell, E., Böcker, L., Brunner, P., Davoudi, S., Geertman, S., et al. (2018). Exploring urban metabolism—towards an interdisciplinary perspective. Resour. Conserv. Recycling 132, 190–203. doi: 10.1016/j.resconrec.2017.09.014
Doxiadis, C. A. (1968). Man's movement and his city. Science 162, 326–334. doi: 10.1126/science.162.3851.326
Doxiadis, C. A. (1970). Ekistics, the science of human settlements.? Science 170, 393–404. doi: 10.1126/science.170.3956.393
DVRPC (2017). Data and Products. Available online at: http://www.dvrpc.org/Data/DVRPC/ (accessed February 11, 2020).
Fischer-Kowalski, M. (1998). Society's metabolism. J. Industr. Ecol. 2, 61–78. doi: 10.1162/jiec.1998.2.1.61
Fischer-Kowalski, M., and Hüttler, W. (1998). Society's metabolism. J. Industr. Ecol. 2, 107–136. doi: 10.1162/jiec.1998.2.4.107
Geddes, P. (1915). Cities in Evolution; An Introduction The Town Planning Movement and to the Study of Civics. New York, NY: H. Fertig.
Huang, S. L., and Chen, C.-W. (2005). Theory of urban energetics and mechanisms of urban development. Ecol. Model. 189, 49–71. doi: 10.1016/j.ecolmodel.2005.03.004
John, B., Luederitz, C., Lang, D. J., and von Wehrden, H. (2019). Toward sustainable urban metabolisms. From system understanding to system transformation. Ecol. Econom. 157, 402–414. doi: 10.1016/j.ecolecon.2018.12.007
Lenormand, M., Bassolas, A., and Ramasco, J. J. (2016). Systematic comparison of trip distribution laws and models. J. Transport Geogr. 51, 158–169. doi: 10.1016/j.jtrangeo.2015.12.008
Liu, G., Yang, Z., Chen, B., and Zhang, L. (2011). Analysis of resource and emission impacts:an emergy-based multiple spatial scale framework for urban ecological and economic evaluation. Entropy 13, 720–743. doi: 10.3390/e13030720
Marchetti, C. (1994). Anthropological invariants in travel behavior. Tech. Forecast. Soc. Change 47, 75–88. doi: 10.1016/0040-1625(94)90041-8
Odum, H. T. (1996). Environmental Accounting: EMERGY and Environmental Decision Making. New York, NY: Wiley.
Odum, H. T. (2007). Environment, Power, and Society for the Twenty-First Century: The Hierarchy of Energy. New York, NY: Columbia University Press.
Odum, H. T., Brown, M. T., Whitefield, L. S., Woithe, R., and Doherty, S. (1995). Zonal Organization of Cities and Environment: A Study of Energy System Basis for Urban Society. A Report to the Chiang Ching-Kuo Foundation for International Scholarly Exchange. Center for Environmental Policy, University of Florida, Gainesville: FL.
Pincetl, S., Bunje, P., and Holmes, T. (2012). An expanded urban metabolism method: toward a systems approach for assessing urban energy processes and causes. Landscape Urban Plann. 107, 193–202. doi: 10.1016/j.landurbplan.2012.06.006
Seto, K. C., Reenberg, A., Boone, C. G., Fragkias, M., Haase, D., Langanke, T., et al. (2012). Urban land teleconnections and sustainability. Proc. Natl. Acad. Sci. U.S.A. 109, 7687–7692. doi: 10.1073/pnas.1117622109
Thünen, J., Heinrich, V., van Suntum, U., and Tribe, K. (2009). “The isolated state in relation to agriculture and political economy,” in Part 3, Principles for the Determination of Rent, the Most Advantageous Rotation Period and the Value of Stands of Varying Age in Pinewoods, 1 Vols. Basingstoke: Palgrave Macmillan.
Keywords: urban self-organization, urban metabolism, emergy synthesis, Philadelphia, transportation, land value
Citation: Braham WW and Lee JM (2020) Metabolism of Urban Location: Travel Time and the Morphology of Cities. Front. Sustain. Cities 2:4. doi: 10.3389/frsc.2020.00004
Received: 20 October 2019; Accepted: 20 January 2020;
Published: 20 February 2020.
Edited by:
Sergio Ulgiati, Università degli Studi di Napoli Parthenope, ItalyReviewed by:
Olivier Le Corre, IMT Atlantique Bretagne-Pays de la Loire, FranceElliott Thomas Campbell, Maryland Department of Natural Resources, United States
Copyright © 2020 Braham and Lee. This is an open-access article distributed under the terms of the Creative Commons Attribution License (CC BY). The use, distribution or reproduction in other forums is permitted, provided the original author(s) and the copyright owner(s) are credited and that the original publication in this journal is cited, in accordance with accepted academic practice. No use, distribution or reproduction is permitted which does not comply with these terms.
*Correspondence: William W. Braham, YnJhaGFtd0B1cGVubi5lZHU=
 William W. Braham
 Jae Min Lee2