 Jelena Kronic
 Ralph M. Duckworth1
 Claudio Angione
 Steven M. Levy
 Fatemeh Vida Zohoori
- 1School of Health and Life Sciences, Teesside University, Middlesbrough, United Kingdom
- 2School of Computing, Engineering and Digital Technologies, Teesside University, Middlesbrough, United Kingdom
- 3College of Dentistry and Dental Clinics, University of Iowa, Iowa City, IA, United States
Introduction: Currently available dietary recommendations for fluoride provided as “adequate intake” (AI) and “tolerable upper intake level” (UL) assume 100% fluoride availability for utilization by the body, which is often not the case. To prevent the development of dental fluorosis, AI and UL values must include fluoride bioavailability. However, the lack of data on fluoride bioavailability/bio-accessibility has hindered progress so far. This study aimed to measure fluoride bio-accessibility of the dietary sources commonly consumed by children below four years of age.
Methods: A total of 103 food and meal samples were purchased, prepared, and analyzed for fluoride content, subjected to a standardized static in vitro digestion procedure and subsequent determination of fluoride concentration of resultant mixtures necessary for the final fluoride bio-accessibility calculation. Fluoride concentrations before and after in vitro digestion were determined directly using a fluoride-ion-selective electrode after addition of TISAB III, or indirectly by an acid diffusion method. Additionally, fluoride concentration of milk samples was determined using a combination of microwave-assisted acid digestion and the direct method of fluoride analysis.
Results: Mean (SD) fluoride bio-accessibility for individual food samples was 44.7% (37.5%). The mean (SD) fluoride bio-accessibilities for meals created with juice, carbonated drinks, tap water, and milk were 79.0% (21.9%), 64.3% (20.7%), 40.2% (20.9%), and 71.5% (17.1%), respectively. For the rest of the meals with no common mixing agent, the mean (SD) fluoride bio-accessibility was 50.8% (55.9%).
Conclusion: The majority of dietary sources analyzed in this project resulted in fluoride bio-accessibilities below 100%, indicating incomplete utilization of consumed fluoride. As the first study of its kind, these findings represent a critical initial step for future research and provide valuable insights to inform policymakers and health authorities in revising fluoride intake guidelines.
1 Introduction
Although fluoride (F) is important for the prevention of dental caries (1, 2), excessive systemic fluoride intake in infancy and early childhood may result in the development of dental fluorosis (3). While different timeframes have been suggested in the literature (4–7), the first three years of life are generally considered to be the most critical for the development of dental fluorosis on the aesthetically important permanent maxillary central incisors (5). To minimize the risk of dental fluorosis development, it is crucial to ensure fluoride intake remains within recommended guidelines. However, an increase in the occurrence of dental fluorosis has been noted in many industrialized countries (8–11) as a potential consequence of increased fluoride exposure through dietary as well as non-dietary sources along with increased globalization and movement of dietary products from fluoridated areas of production to fluoridated and non-fluoridated areas of consumption (12).
To monitor fluoride intake, a range of 0.05 and 0.07 mg of fluoride per kilogram of body weight per day (mg F/kg bw/day), commonly referred to as the “optimal” fluoride intake, has been in use since the 1940s (13, 14). Additional terminologies like “adequate intake” (AI) of 0.05 mg F/kg bw/day (15) and “tolerable upper intake level” (UL) of 0.1 mg F/kg bw/day for children between 1 and 8 years of age (16) were developed by various international organizations (17–19) to describe fluoride intake levels that reduce the probability of dental caries while simultaneously presenting minimal risk of dental fluorosis. However, the “optimal” fluoride intake was empirically determined in 1943 based on the average fluoride intake from diets commonly consumed by children between 1 and 12 years of age (14, 20). Studies looking to provide concrete evidence on the “optimal” fluoride intake failed to do so, prompting the suggestion that the term “optimal” fluoride intake should be removed from common usage (20, 21). Furthermore, recommended intake levels were created based on the assumption that 100% of consumed fluoride is available for utilization by the body, which is often not the case (22). Factors like diet and age can affect overall fluoride ingestion, absorption, and retention (23, 24). Hence dental fluorosis may rather be a consequence of fluoride bioavailability and it is important to measure the amount of absorbed and body-retained fluoride rather than only the absolute fluoride intake (25). The “San Francisco Fluoride Symposium - 2017” highlighted the significance of fluoride metabolism research, specifically focusing on overall fluoride bioavailability, as such research could lead to evidence-based information needed for improvement of presently available AI and UL values for fluoride (26). Furthermore, insights into fluoride bioavailability could help with Global Target 2.2 of the World Health Organization Global Health Action Plan, which aims for a minimum of 50% of countries to adopt national guidance ensuring optimal fluoride delivery to the population by 2030 (27).
However, current knowledge of fluoride bioavailability is limited. Bioavailability of any nutrient is defined as the amount of nutrient that is released in the gastrointestinal tract, enters the systemic circulation, and is used by the body for different biological functions (28–30). Although absolute fluoride bioavailability was detected in earlier studies after sodium fluoride (NaF) ingestion by healthy adults upon fasting (31, 32), the presence of food reduced fluoride bioavailability by almost 50% (32, 33). Villa (34) found 58% fluoride bioavailability from tea consumed on a fasting stomach and 32% when consumed with solids, while more complex fluoride sources like fish or bone-meal tablets revealed fluoride bio-availabilities of only 30% and 5%, respectively (34, 35). Similarly, fluoride bioavailability of commonly consumed diets from different parts of India ranged from 1.6% to 31.7% for north Indian vegetarian and south Indian non-vegetarian dishes, respectively (36).
Despite numerous studies on fluoride bioavailability, researchers mainly focused on simple fluoride sources like NaF, failing to examine its bioavailability from more complex dietary sources of low fluoride concentration. The bioavailability of any nutrient is determined using in vivo methods. Although most accurate, in vivo methods are often lengthy, costly, and ethically questionable (37), especially when participants are young children and the study involves invasive procedures (i.e., blood donation) (38). A suitable alternative was found in “bio-accessibility” - the amount of nutrient that is released from food in the gastrointestinal tract during digestive processes and is available for absorption (30). Bio-accessibility is measured using in vitro methods that simulate different stages of gastrointestinal digestion. In vitro digestion models range from simple static systems to multi-compartmental dynamic systems (39). Although dynamic models simulate the human gastrointestinal tract more accurately, they mainly focus only on one specific part of digestion. Furthermore, available dynamic models are in different developmental stages requiring further validation. On the other hand, although simple, standardized static in vitro digestion models simulate the three phases of digestion (oral, gastric, and intestinal) and allow for inter-laboratory comparison. This type of experiment requires commonly available laboratory equipment; it is cost-effective, quick, and without ethical constraints (39). Fluoride bio-accessibility experiments are rare. One study conducted on tea infusions showed 91.4% of fluoride bio-accessible after the gastric stage and 92.1% after the gastrointestinal stage. The addition of milk reduced fluoride bio-accessibility by approximately 15% (40).
Considering the importance of fluoride for dental health and complexities related to its bioavailability, this study aims to remove current gaps in knowledge by measuring fluoride bio-accessibility in commonly consumed dietary sources by children during their first three years of life, increasing the understanding of its impact on oral health and promoting improvement of currently available dietary recommendations.
This paper is part of a larger study (41, 42) that aimed to examine the association between fluoride bio-accessibility and dental fluorosis on permanent teeth. This study utilized information gathered through the Iowa Fluoride Study (IFS) – a comprehensive, longitudinal study that aimed to assess the relationship between long-term fluoride exposure from dietary and non-dietary sources and different health outcomes (21, 43–47). The IFS involved the recruitment of families with newborns from eight Iowa hospitals between 1992 and 1995 (5, 21, 43, 44, 48). Assessment of fluoride exposure involved data collection using questionnaires that were sent to participants every few months starting from when a child was 1.5 months of age (43) alongside 3-day food diaries that involved data collection over 2 weekdays/1 weekend day at 1.5, 3, 6, 9, and 12 months of age, continuing every 4–6 months until they were 8.5 years old (49, 50).
2 Materials and methods
2.1 Selection of food/meals
Copies of the 3-day food diaries gathered in the IFS were obtained from the University of Iowa and analyzed using RStudio 4.2.2 and MS Excel 365 to identify the most commonly consumed dietary sources by children who participated. As the first three years of life were earlier highlighted as the most critical for dental fluorosis development on permanent maxillary central incisors (5), this period became the main focus of the present study. Therefore, the 3-day food diaries were analyzed at six time points: 1.5, 3, 6, 12, 24, and 36 months of age. The analysis involved 91 participants for whom 3-day food diaries were available at all time points of interest (41). A list of dietary sources most commonly consumed by the children was compiled (see Supplementary Tables S1, S2).
2.2 Sample preparation
For the 34 individual foodstuffs identified, five sub-samples were purchased online or at local supermarkets in Middlesbrough, UK. Analyzed samples were aggregate samples, comprising equal amounts of each sub-sample purchased. Furthermore, two tap water samples were obtained in Middlesbrough and Newcastle representing non-fluoridated (0.083 µg/ml) and fluoridated water (0.983 µg/ml), respectively. Depending on the sample, individual foodstuffs were analyzed as they were or mixed with water according to the manufacturer's instructions. Samples were prepared using double deionized water, non-fluoridated, and fluoridated tap water. All samples were purchased between October 2021 and March 2022.
Additionally, the food diaries identified 67 meals consumed by the 91 participants, which were created by mixing two or more previously identified individual food samples. Mixing was determined according to the recommended calorie intake for children (51) and the recommended daily intake of each product marked on the package to ensure the most accurate representation of meals consumed by children. The quantities of each individual food sample used for the creation of meals were expressed as ratios calculated using Equation 1
where
R = ratio of individual food sample
I = weight of individual food sample (g)
T = total weight of meal (g)
2.3 Measurement of fluoride concentration
2.3.1 Laboratory measured fluoride concentration
The fluoride concentration of tap water samples was determined directly using a fluoride ion-selective electrode (Orion Research, model 96–09) upon adding TISAB III. The rest of the food/meal samples were analyzed using the HMDS-facilitated diffusion method (52, 53). All samples were analyzed in triplicate. The fluoride concentration (µg/g) of each sample was then calculated as the average of each triplicate. Additionally, semi-skimmed milk (UK equivalent of 2% milk) and whole milk samples were analyzed using a microwave-assisted acid digestion procedure, which served as a pre-treatment to the direct method of fluoride analysis to allow for the complete extraction of fluoride from food where fluoride might exist bound to cations that prevent detection of fluoride ions (54). In short, 1 g of each sample was weighed in a Teflon vessel, covered with 8 ml of 7 mol/L HNO3, and subjected to microwave digestion for 15 min at 180°C. Once cooled down, samples were neutralized with NaOH (8 mol/L and 1.8 mol/L stock solutions) before direct fluoride analysis.
2.3.2 Calculated fluoride concentration of meals
A hypothesis indicating that the fluoride concentration of a meal would match the sum of the fluoride concentrations of individual food samples used for its preparation (expected value) was developed. Expected values were calculated using Equation 2
where
E = expected fluoride content of meal (µg/g),
Ri = ratio of the i-th food sample used to create a meal,
Fi = fluoride concentration of the i-th food sample used to create a meal (µg/g),
n = number of food samples used to create a meal.
2.3.3 In vitro digestion and calculation of fluoride bio-accessibility
One hundred and three food/meal samples were duplicated and subjected to a standardized static in vitro digestion procedure that mimics oral, gastric, and small intestinal phases of human digestion (55, 56). Before digestion, chewing of solid food/meal samples was mimicked using a household blender (IMURZ, TC-18), converting food into small enough particles that would be safe for swallowing. Five grams of each sample were then placed into 50 ml centrifuge tubes. The oral phase involved the addition of human salivary α-amylase (Sigma-Aldrich, A1031) and simulated salivary fluid (SSF) followed by a short incubation of approximately 2 min accompanied by manual stirring. The gastric phase of the digestion began with the addition of pepsin (Sigma-Aldrich, P7012) and pH adjustment to∼3.0. Incubation was performed at 37°C for 2 h at 150 rpm in an orbital shaker/incubator (Sartorius Stedim Biotech GmbH, CERTOMAT® BS-1). The final phase of the digestion included the addition of bile (Sigma-Aldrich, B3883) and pancreatin (Sigma-Aldrich, P7545), adjustment of the pH value to∼7.0, and incubation at 37°C for 2 h at 150 rpm in the orbital shaker/incubator. Once completed, digestion was stopped by placing the centrifugation tubes in ice, which stopped enzymatic activity. Samples were centrifuged (Eppendorf, 5810 R) at 3,900 rpm for 20 min and the resultant supernatants were stored frozen until further analysis. Fluoride concentrations of supernatants were determined in triplicate using the HMDS-facilitated diffusion method (52, 53).
Alongside food/meal samples, NaF standards of different concentrations (0.1, 1.0, and 10.0 µg/ml) were subjected to the same in vitro digestion procedure described above, as earlier bio-accessibility studies indicated different fluoride bio-accessibility values detected between gastric and whole gastrointestinal digestion (40, 57). To examine this further, standards were analyzed using (a) in vitro digestion consisting only of the oral and gastric phases of the digestion, and (b) the whole gastrointestinal digestion process.
Final fluoride bio-accessibility was calculated using the following equation:
where
F1 = fluoride content of the sample determined before in vitro digestion (μg/g), and
F2 = fluoride content determined after in vitro digestion (bio-accessible fraction) (μg/g).
2.3.4 Validity and reliability of the analytical method
To check the validity of the analytical method, a known concentration of fluoride standard (NaF) was added to approximately 10% (n = 11) of the samples. These samples were then analyzed in triplicate to measure the recovery of added fluoride. To check reliability, fluoride measurement of approximately 20% of samples (n = 24) was repeated. Samples were analyzed in triplicate and double-distilled, deionized water was used as a blank.
2.3.5 Statistical analysis
To compare laboratory-measured and expected fluoride concentrations of meals, a Bland-Altman plot was created (58) using RStudio 4.2.2. This procedure is a standard approach that allows comparison between two methods of measurement, usually a new method and an already established one, and it helps with the decision of whether the new method is acceptable. The analysis involved plotting the average of two methods against the difference between them, enabling a visual assessment of their agreement. The methods are considered to show good agreement if the points on the scatterplot lie close to the middle line.
3 Results
3.1 Validity and reliability of measurements
The mean (SD) recovery of fluoride added to food/meal samples was 103.4 (7.6)%. The overall recovery ranged from 92.0% to 117.3% detected for fruit-based baby food and peanut butter, respectively. Re-analysis of 24 samples resulted in a mean (SD) difference in fluoride concentration of 0.002 (0.012) µg/g with all the results being within 0.03 µg F/g.
3.2 Most commonly consumed food/meals
Analysis of 1,000 individual food diaries during infancy (1.5–6 months of age) and early childhood (12–36 months of age) for the frequency of consumption revealed a final list of 36 individual food items and 67 meals (Supplementary Tables S1, S2, respectively) as the most commonly consumed food/meal samples by children during the first three years of their life (41).
3.3 Fluoride concentration of food/meals
3.3.1 Individual food items
Details on fluoride concentration (µg/g) of individual food samples are found in Supplementary Table S1. The overall mean (SD) fluoride concentration of the 36 individual food items was 0.518 (1.811) µg/g. Ten food samples analyzed as representatives of infancy resulted in a mean (SD) fluoride concentration of 0.136 (0.095) µg/g ranging from 0.011 µg/g to 0.249 µg/g for powdered infant formula and vegetable-based baby foods, respectively. Food samples regularly consumed during early childhood (n = 26) resulted in a mean (SD) fluoride concentration of 0.665 (2.123) µg/g ranging from 0.023 µg/g to 10.730 µg/g for fruit and canned fish in tomato sauce, respectively.
Food samples available in the UK and US markets were also analyzed in this study (Table 1) indicating mean (SD) fluoride concentrations of 0.097 (0.093) µg/g and 0.195 (0.089) µg/g for the UK and US market, respectively.
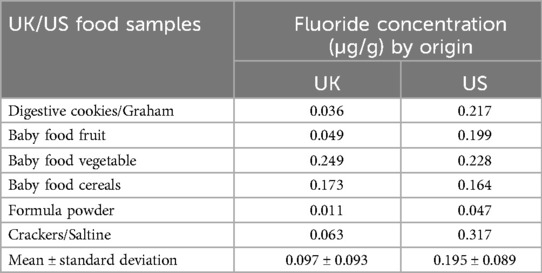
Table 1. Fluoride concentrations (µg/g) of foods available in the UK and US markets.
3.3.2 Meal items
Sixty-seven analyzed meal samples were grouped according to preparation method. The overall mean (SD) laboratory-measured fluoride concentration of meals was 0.140 (0.213) µg/g while the overall mean expected value (SD) equaled 0.152 (0.219) µg/g. When groups were examined, the highest laboratory-measured mean (SD) fluoride concentration was detected for meals created with water: 0.442 (0.360) µg/g. The corresponding expected fluoride concentration was almost identical: 0.439 (0.379) µg/g. A graphical comparison between laboratory-measured and expected fluoride concentrations for each group is found in Figure 1. Further details are available in Supplementary Table S2.
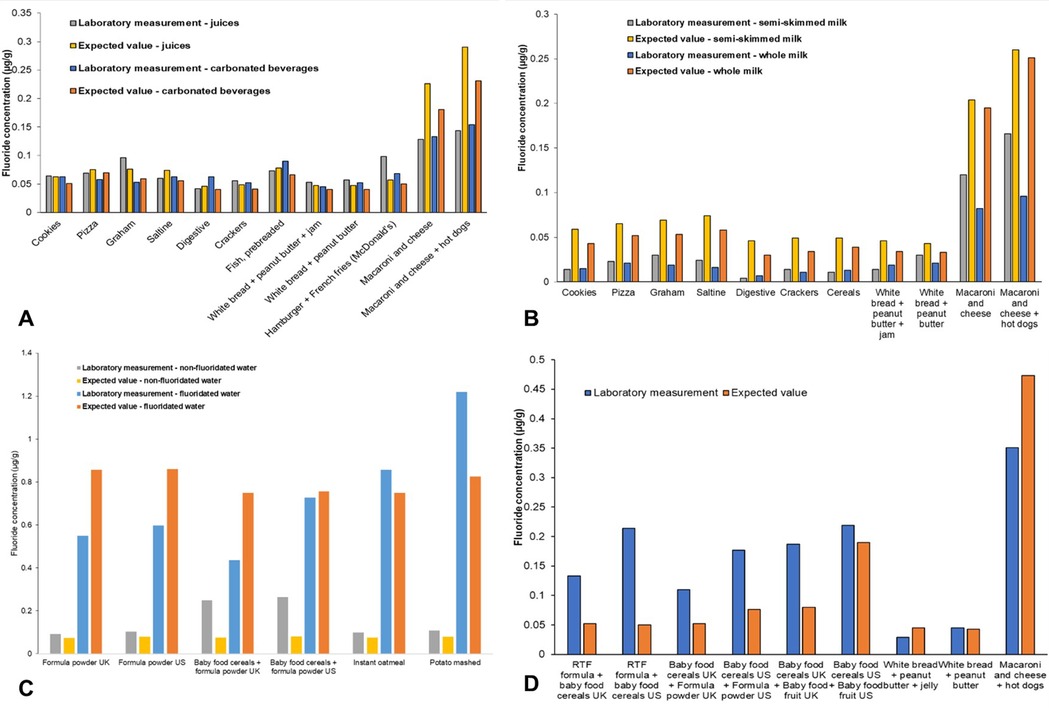
Figure 1. Laboratory-measured and expected (calculated) fluoride concentrations (µg/g) of meal samples when consumed with (A) juices or carbonated beverages; (B) whole or semi-skimmed (2%) milk; (C) fluoridated or non-fluoridated water; and (D) other meal samples without a common preparation method.
Figure 2 shows a Bland-Altman plot, where the average of the two methods is shown on the x-axis while the difference between the two is plotted on the y-axis of the scatterplot. The analysis was conducted using “laboratory-measured” and “expected” fluoride concentrations (µg/g) for 67 meal samples. The average difference (−0.012 µg F/g) is represented by the middle line on the scatterplot while the upper and lower lines represent the limits of agreement (LoA). The upper and lower LoAs (0.186 and −0.210 µg F/g, respectively) were calculated as average difference ± 1.96*standard deviation of the difference. The plot shows a small mean difference between the measured and expected values and narrow LoAs, indicating a good agreement between the methods.
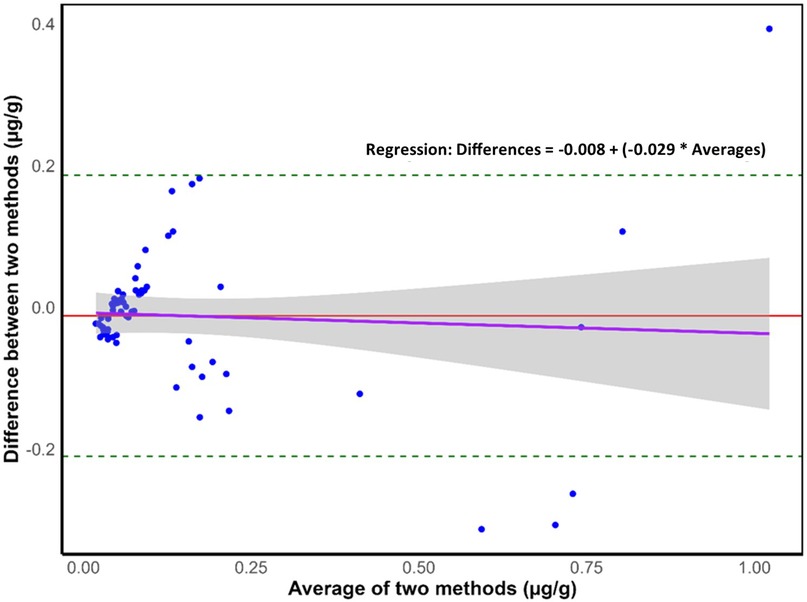
Figure 2. Bland–Altman plot where dashed lines represent the 95% upper and lower limits of agreement (loAs), the middle red line represents the mean difference, the purple line represents the regression line (n = 67), and the grey shaded area around the regression line indicates the 95% confidence interval for the regression line.
3.4 Fluoride bio-accessibility
3.4.1 NaF standards
When small intestinal digestion was excluded from the procedure, the measured fluoride bio-accessibilities were 64.7, 77.6, and 100.1% for the 0.1, 1.0, and 10.0 µg/ml fluoride standards, respectively. The corresponding whole gastrointestinal digestion results were: 56.9, 60.0, and 66.2%, respectively.
3.4.2 Individual food items
Details on fluoride bio-accessibility (%) of individual food samples are found in Supplementary Table S1. The overall mean (SD) fluoride bio-accessibility of the 36 individual food items was 44.7% (37.5%). Ten food samples analyzed as representatives of infancy resulted in a mean (SD) fluoride bio-accessibility of 24.2% (11.8%) ranging from 0.1% to 46.7% for powdered infant formula available on the UK market and fruit-based baby food available on the US market, respectively. Food samples regularly consumed during early childhood (n = 26) resulted in a mean (SD) fluoride bio-accessibility of 52.6% (41.1%) ranging from 1.0% to 152.3% for canned fish in tomato sauce and jam, respectively.
3.4.3 Meal items
The mean (SD) fluoride bio-accessibilities for meals when consumed with juice, carbonated drinks, tap water, and milk were 79% (21.9%), 64.3% (20.7%), 40.2% (20.9%), and 102.0% (75.8%), respectively. For the rest of the meals, the average fluoride bio-accessibility was 50.8% (55.9%) (Supplementary Table S4). Figure 3A shows higher fluoride bio-accessibilities recorded for those meals prepared with fluoridated tap water compared with those prepared with non-fluoridated water. Furthermore, all meals shown in Figure 3A resulted in fluoride bio-accessibilities below 100%. Figure 3B shows higher fluoride bio-accessibilities for a majority of meal samples created with juice when compared to those created with carbonated beverages with a notable outlier resulting in 127% bio-accessibility when digestive cookies are consumed with juice. High fluoride bio-accessibilities were also recorded for meals created with whole milk (Figure 3C). Overall, four outliers with fluoride bio-accessibilities above 150% were detected – (a) white bread with peanut butter and jam mixed with both types of milk and (b) white bread with peanut butter mixed with both types of milk. When those were removed, the overall mean (SD) fluoride bio-accessibility of meals when consumed with milk was 71.5% (17.1%). Finally, Figure 3D highlights two outliers – (a) white bread with peanut butter and jam and (b) white bread with peanut butter that resulted in fluoride bio-accessibilities of 164.0% and 129.1%, respectively.
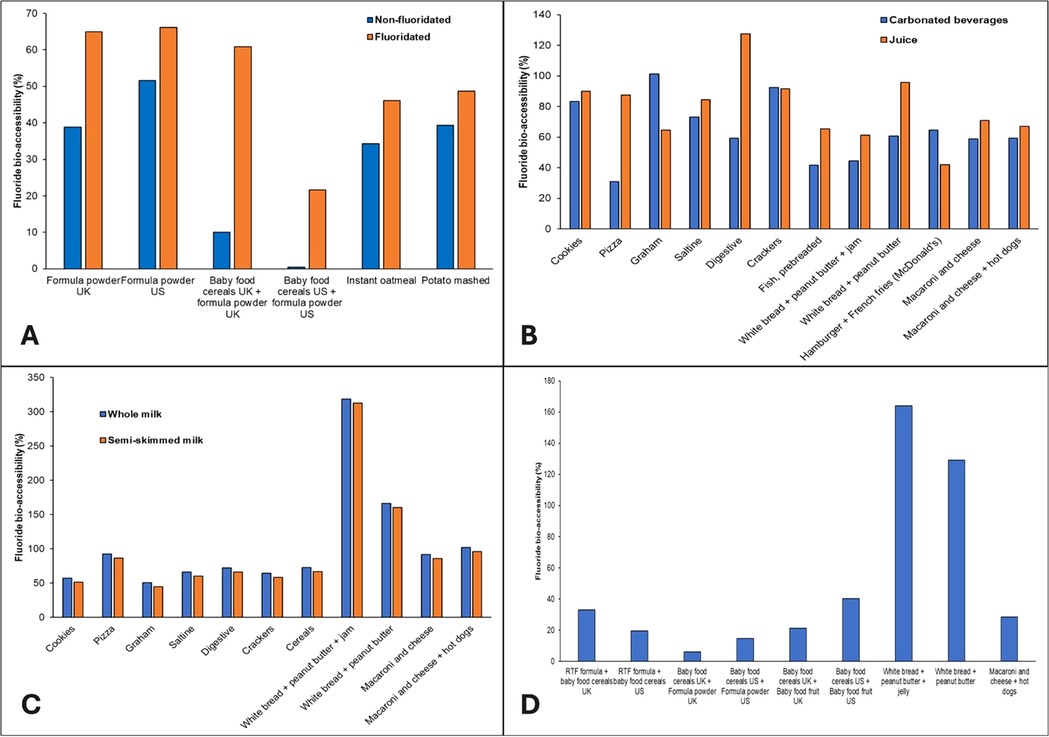
Figure 3. Fluoride bio-accessibility (%) of meal samples when consumed with (A) fluoridated or non-fluoridated water; (B) carbonated beverages or juice; (C) whole or semi-skimmed (2%) milk; and (D) other meal samples without a common preparation method.
4 Discussion
4.1 Most commonly consumed food/meals
The first three years of life are generally considered to be the most critical period for dental fluorosis development on permanent maxillary central incisors (5). A comprehensive evaluation of dietary sources was conducted using 3-day food diaries gathered from 91 participants of the IFS at six key time points: 1.5, 3, 6, 12, 24, and 36 months of age. The relatively limited number of diaries was a result of incomplete digitization of these documents and decreasing response rates with increasing age (59). The final list of the most commonly consumed food/meals encompassed both infant and adult dietary sources. In infancy, these sources were almost exclusively focused on breast milk and infant formula expanding to include fruit-based, vegetable-based, and meat-based baby foods, which gradually transitioned towards regular adult foods from approximately 6 months of age. Such results mirrored previous findings on the topic, which identified baby foods, infant formulas, and breastmilk as the main energy sources of children contributing over 99% and 73% to the total energy intake of children between birth and 6 months of age and of children between 6 and 12 months of age, respectively (60). Although commonly consumed (59), breastmilk was excluded from the present study as it poses a low risk for dental fluorosis development due to a very low fluoride content (61–63). Furthermore, children between 6 and 12 months of age are rarely exclusively breastfed (58), favoring intake of infant formulas (64). Therefore, powdered and ready-to-feed (RTF) infant formula alongside various baby foods were used as the main representatives of infancy in this study. In earlier studies, bread, cereals, potatoes, fruit, peanut butter, sweetened beverages, unflavored whole and semi-skimmed milk, along with sweet/salty snacks were among the most commonly consumed energy sources of children up to 4 years of age (65–68), while starches, grains, cereals, and water were identified as the main fluoride sources in early childhood (59). Although based on 3-day food diaries collected in the Iowa Fluoride Study in the 1990s, the findings on the most common dietary sources align with more recent studies, highlighting consistent consumption patterns over time (60, 65–68). Therefore, the assembled list of dietary sources (Supplementary Tables S1, S2) encompassed the main representatives of each food category consumed regularly by young children and provided a sound basis for further bio-accessibility measurements. To calculate fluoride bio-accessibility, an experimental design encompassing three laboratory procedures had to be employed: (a) measurement of fluoride concentration in raw material before in vitro digestion; (b) in vitro digestion of dietary sources; and (c) measurement of fluoride concentration in supernatants created by in vitro digestion.
4.2 Fluoride concentration of food/meal items
4.2.1 Individual food items
The mean (SD) fluoride concentration of individually measured food items was 0.518 (1.811) µg/g. Fluoride concentrations of individual food samples analyzed in this study and consumed during infancy are consistent with results found in the literature. For example, a study conducted in Canada in 1982 (69) revealed the fluoride concentration of vegetable-based baby foods between 0.02 and 1.29 µg/g, fruit-based baby foods 0.04–0.39 µg/g, meat-based baby foods 0.05–3.93 µg/g, and cereals 1.24–4.98 µg/g. Heilman et al. (70) reported the fluoride concentration of vegetable-based baby foods to be between 0.01 and 0.42 µg/g, fruit-based baby foods and deserts 0.01–0.49 µg/g, meat-based baby foods 0.01–8.38 µg/g, and cereals 0.01–0.31 µg/g. As for food samples commonly consumed during early childhood, the highest value of 10.730 µg/g was recorded for canned fish in tomato sauce, which aligns with the value recorded for a similar sample in the UK fluoride database (71). The fluoride concentration of fluoridated tap water from Newcastle upon Tyne (0.98 µg/g) matches fluoride levels set by the water fluoridation scheme that aims to achieve 1 mg F/L of water (72). Although in line with previous findings, minor differences in fluoride concentration between samples analyzed in this study and those presented in the literature can be expected. Brand, production site, or the fluoride concentration of the water used for production are just some factors that can impact the final fluoride content (73–76), which highlights the complexity of fluoride measurements. Finally, food samples available in the UK and US markets were analyzed in this study indicating small but detectable differences in fluoride concentration between the different countries (Table 1). Although such variations among different geographical areas are common (73, 77), they should not be ignored. The global movement of goods, including dietary sources, complicates monitoring systemic fluoride exposure and efforts to link total fluoride exposure to health outcomes. This highlights the need for a universal policy on fluoride labelling of food and drink products, especially those consumed in infancy and early childhood (74).
4.2.2 Meal items
Semi-skimmed and whole milk samples were analyzed for fluoride concentration using an indirect method of fluoride determination and a combination of microwave-assisted acid digestion with a direct method of fluoride determination (54). A noticeable difference in fluoride concentration was observed between the two methods. For both whole and semi-skimmed milk, the indirect method of fluoride measurement yielded 0.001 µg/g, whereas the microwave-assisted acid digestion followed by direct method of fluoride measurement resulted in concentrations of 0.029 and 0.047 µg/g for both whole and semi-skimmed milk, respectively. An earlier study found the average fluoride concentration of different samples of homogenized milk to be 0.011–0.035 µg/g, with the highest recorded value being 0.063 µg/g (excluding plant-based milk) (78). Similarly, the fluoride concentration of milk available in Brazil ranged from 0.02–0.07 µg/ml for whole milk and 0.02–0.05 µg/ml for skimmed milk samples (79). Agreement between results obtained using a combination of microwave-assisted acid digestion and those found in the literature prompted usage of specifically these values for further bio-accessibility calculations.
The overall mean (SD) laboratory-measured fluoride concentration of meals was 0.140 (0.213) µg/g, ranging from 0.004 to 1.219 µg/g. Such results are comparable to those obtained by Buzalaf et al. (80) and Pagliari Tiano et al. (81), where the fluoride concentration of meals ranged from 0.007 to 0.580 mg and 0.011 to 0.743 µg/g, respectively. Similarly, the expected fluoride concentration of meals averaged 0.152 (0.219) µg/g, ranging between 0.003 and 0.861 µg/g. While for approximately 50% of samples the expected fluoride concentration of meals was higher than the laboratory-obtained values, suggesting the formation of insoluble complexes between fluoride and other cations potentially lowering fluoride detectability (82), the mean (SD) difference between the two groups was low: 0.012 (0.101) µg/g. A strong positive relationship between laboratory-obtained and expected values was detected through correlation and regression analysis, while a Bland-Altman analysis confirmed the close agreement between the two methods (58) suggesting that they are both valid, produce consistent results, and can be used interchangeably in the future.
Finally, upon examining the groups, the highest laboratory-measured mean (SD) fluoride concentration of 0.442 (0.360) µg/g was observed for meals created with water. This closely matched the expected fluoride concentration of 0.439 (0.379) µg/g. The fluoride concentration of the water used for food preparation is known to affect the overall fluoride concentration of the prepared product. For instance, the UK fluoride database showed varying fluoride levels in food and drink samples prepared with waters of different fluoride concentrations (75). Similarly, Heilman et al. (70) noted variability in the fluoride concentration of analyzed infant foods, identifying the fluoride concentration of the water used for processing as the primary factor, a finding corroborated by Wiatrowski et al. (83).
4.3 Fluoride bio-accessibility
4.3.1 NaF standards
Earlier studies on fluoride bioavailability showed complete fluoride bioavailability when NaF was consumed in a fasting state (31) but reduced bioavailability when it was consumed alongside other food items (32, 33, 84). Although the present study also showed 100% fluoride bio-accessibility for pure NaF of the highest concentration (10 µg/ml), a gradual reduction in fluoride bio-accessibility was recorded from 10 to 0.1 µg/ml NaF standards analyzed in this study. Such results are most likely a consequence of a lower proportion of fluoride ions available at lower concentrations when the effect of other, possibly present, cations could have been more significant. The gastric phase of digestion resulted in slightly higher fluoride bio-accessibility when compared to those values obtained after the whole gastrointestinal process. Similar results were recorded in an earlier study when digestion of seafood samples resulted in a reduction of over 50% between gastric and intestinal phases (57), highlighting the significance of complete gastrointestinal digestion when examining the potential effects of fluoride intake (57).
4.3.2 Individual food items
The overall mean (SD) fluoride bio-accessibility for individual food samples was 44.7% (37.5%) with the highest value of 152.3% recorded for jam. Such a value might be considered an outlier as a consequence of jam's sticky texture and high viscosity that might have limited mixing with gastric fluids and enzymes. A study from 2023 conducted using peanut butter indicated that higher mixing forces are needed for the successful digestion of viscous products, therefore favoring dynamic models (85). On the other hand, a result of 150% might not be impossible. Digestion processes might have released more fluoride ions than acid diffusion used for the initial measurement of fluoride concentration (52). The challenging texture of jam might have restricted the contact between the acid and the food item preventing the effective release of fluoride making it undetectable. As for the rest, a majority of samples commonly consumed during infancy and early childhood resulted in fluoride bio-accessibilities below 100%, which emphasizes the limited availability of consumed fluoride for utilization in the human body.
4.3.3 Meal items
The results of this study indicate significant variability in fluoride bio-accessibility depending on the type of beverage consumed alongside meals. Meals consumed with juice and milk exhibited higher fluoride bio-accessibility, averaging 79% and 102%, respectively, while those consumed with carbonated drinks and tap water showed lower bio-accessibility, with averages of 64.3% and 40.2%, respectively. These differences can be partly attributed to the varying fluoride concentrations in the beverages and their distinct chemical properties, which may influence fluoride release and absorption during digestion. As expected, meals prepared with fluoridated tap water generally showed higher fluoride bio-accessibility compared to those made with non-fluoridated water, highlighting the impact of water fluoridation on overall fluoride intake. Meals consumed with milk demonstrated exceptionally high fluoride bio-accessibility, with some outliers exceeding 150%. After removing these outliers, the mean fluoride bio-accessibility for milk-consumed meals dropped to 71.5%, still higher than most other beverage categories. This suggests that milk, particularly whole milk, may enhance fluoride bio-accessibility, possibly due to its fat content or other constituents that influence fluoride absorption. It is interesting to see that peanut butter and jam were common constituents of removed outliers. As explained above, such anomalies could have been a result of a sticky texture and high viscosity characteristic for those products which interfered with digestion and release of fluoride ions (85).
As with individual food samples, the majority of analyzed meal samples resulted in fluoride bio-accessibilities below 100%. Such an outcome can be attributed to the chemical properties of fluoride. Fluoride ions, owing to their electronegativity, tend to form complexes with various cations (57). This must be considered as samples analyzed during this study were mainly complex food matrices containing a variety of ingredients, while the simulated digestive fluids used throughout this project contained a wide range of cations that could have potentially reacted with fluoride rendering it undetectable. In acidic conditions, the creation of hydrogen fluoride (HF) is favored whereas, in alkaline environments, fluoride exists in a dissociated form. Thus, when in its dissociated form, fluoride readily binds with these cations which could result in reduced bio-accessibility, especially during the intestinal phase. This was already proven to be the case above while inspecting the influence of the digestion phase on overall fluoride bio-accessibility from NaF standards. These results showed that the intestinal phase of digestion decreased fluoride bio-accessibility by more than 40% while a reduction of more than 50% between gastric and intestinal phases was observed in an earlier study (57). These results highlight the importance of the entire gastrointestinal process when evaluating the potential risks or benefits of fluoride ingestion.
Furthermore, it should be noted that the static in vitro digestion model used in this study, while commonly applied to assess the bio-accessibility of various nutrients (86, 87), has limitations. Unlike dynamic models, which simulate the gradual movement of food through the digestive system, the static model exposes food samples to different digestive phases without changing conditions like pH or enzyme concentration. For example, the gastric pH in this study was adjusted to 1.5–2.5, but in reality, food intake temporarily raises stomach pH (88), potentially reducing fluoride solubilization. One study found that at pH 6, less than 13% of fluoride was soluble when certain seafood types were digested (57).
Overall, these findings highlight the need for careful interpretation of bio-accessibility data, especially given the constraints of the static in vitro digestion model and suggest that further research is needed to refine measurement techniques and better understand the factors influencing fluoride absorption in different dietary contexts.
4.4 Limitations and recommendations for future studies
This study revealed fluoride bio-accessibilities below 100% for the majority of analyzed food/meal samples, indicating that part of consumed fluoride is unavailable for utilization in the human body. It also underscores the significant variability in fluoride bio-accessibility across different dietary sources, probably influenced by both the chemical composition of the consumed items and the digestion process itself. The static in vitro digestion model used for this study fails to fully capture the dynamics of fluoride release and absorption in the human gastrointestinal tract. Furthermore, the complexity of analyzed food matrices could have prevented the release of fluoride ions at any stage of the experiment, rendering it undetectable. Due to their high viscosity and sticky texture, dietary sources like peanut butter and jam further complicated the digestion process and release of fluoride ions highlighting the need for more sophisticated models and experimental designs to accurately measure fluoride content and its bio-accessibility.
Therefore, future studies utilizing dynamic digestion models that more accurately replicate the dynamic nature of human digestion and identify factors influencing fluoride absorption are needed. This is particularly crucial during early childhood, a period when the risk of dental fluorosis is highest. While the present study focused on dietary patterns and fluoride exposures in the USA, future research should encompass a broader range of dietary patterns and regional fluoride exposures. Investigating the impact of other dietary components, such as calcium and iron, on fluoride bio-accessibility is also essential. Furthermore, it is recommended to include all types of milk (e.g., breast milk, plant-based milk, specialized formula) in future studies to provide a more comprehensive understanding of fluoride bioaccessibility in infants.
5 Conclusion
Current dietary recommendations for fluoride intake, such as “adequate intake” (AI) and “tolerable upper intake level” (UL) assume that 100% of consumed fluoride is available for utilization by the body. However, this assumption does not align with the observed fluoride bio-accessibility of below 100% detected for the majority of analyzed food/meal samples, as demonstrated in this study.
As the first research of its kind, this study addresses a critical gap in knowledge and provides a foundation for future studies focused on examining factors that can influence fluoride bio-accessibility across diverse populations and dietary sources. Policymakers and health authorities should recognize the significance of these findings and use them to inform future revisions of dietary recommendations providing more precise dietary advice and promoting optimal fluoride intake for overall health. Aligned with Global Target 2.2 of the WHO Global Health Action Plan, this study provides crucial information for shaping evidence-based policy and advancing public health strategies.
Finally, the variability in fluoride content of dietary sources across different geographical regions and food processing methods highlights the significance of systematic monitoring of fluoride intake and introduction of a universal policy on fluoride labelling of food and beverages, particularly due to increased global movement of goods. These measures would enable better consumer awareness and improved public health guidance.
Data availability statement
The original contributions presented in the study are included in the article/Supplementary Material, further inquiries can be directed to the corresponding author.
Ethics statement
The studies involving humans were approved by the University of Iowa Institutional Review Board (IRB) in 1991 (approval number: 199112665) and it was re-approved on the 30th of April 2020. The studies were conducted in accordance with the local legislation and institutional requirements. Written informed consent for participation was not required from the participants or the participants' legal guardians/next of kin in accordance with the national legislation and institutional requirements.
Author contributions
JK: Data curation, Formal Analysis, Investigation, Methodology, Visualization, Writing – original draft. RMD: Supervision, Writing – review & editing, Conceptualization. CA: Supervision, Validation, Writing – review & editing. SML: Supervision, Writing – review & editing, Data curation. FVZ: Conceptualization, Funding acquisition, Resources, Supervision, Validation, Writing – original draft.
Funding
The author(s) declare financial support was received for the research, authorship, and/or publication of this article. This article is based on a thesis entitled “Predictor of fluorosis: total fluoride intake or subsequent fluoride absorption?” submitted to Teesside University, UK, in partial fulfilment of the requirements for a PhD degree by JK, which received funding from the European Union's Horizon 2020 research and innovation programme under the Marie Skłodowska-Curie grant agreement No 801604.
Conflict of interest
The authors declare that the research was conducted in the absence of any commercial or financial relationships that could be construed as a potential conflict of interest.
Authors FVZ and CA declared that they were editorial board members of Frontiers, at the time of submission. This had no impact on the peer review process and the final decision.
Generative AI statement
The author(s) declare that no Generative AI was used in the creation of this manuscript.
Publisher's note
All claims expressed in this article are solely those of the authors and do not necessarily represent those of their affiliated organizations, or those of the publisher, the editors and the reviewers. Any product that may be evaluated in this article, or claim that may be made by its manufacturer, is not guaranteed or endorsed by the publisher.
Supplementary material
The Supplementary Material for this article can be found online at: https://www.frontiersin.org/articles/10.3389/froh.2025.1526262/full#supplementary-material
References
1. The British Fluoridation Society. The Extent of Water Fluoridation—One in a Million: The Facts About Water Fluoridation. Worcestershire: British Fluoridation Society (2012).
2. Dean HT. Fluorine in dental caries control. Postgrad Med. (1949) 5(5):361–7. doi: 10.1080/00325481.1949.11693815
3. Zohoori FV, Duckworth RM. Fluoride: intake and metabolism, therapeutic and toxicological consequences. In: Collins JF, editor. Molecular, Genetic, and Nutritional Aspects of Major and Trace Minerals. Boston, MA, USA: Academic Press (2017). p. 539–50.
4. Evans RW, Darvell BW. Refining the estimate of the critical period for susceptibility to enamel fluorosis in human maxillary central incisors. J Public Health Dent. (1995) 55(4):238–49. doi: 10.1111/j.1752-7325.1995.tb02376.x
5. Hong L, Levy SM, Broffitt B, Warren JJ, Kanellis MJ, Wefel JS, et al. Timing of fluoride intake in relation to development of fluorosis on maxillary central incisors. Community Dent Oral Epidemiol. (2006) 34(4):299–309. doi: 10.1111/j.1600-0528.2006.00281.x
6. Hong L, Levy SM, Warren JJ, Broffitt B, Cavanaugh J. Fluoride intake levels in relation to fluorosis development in permanent maxillary central incisors and first molars. Caries Res. (2006) 40(6):494–500. doi: 10.1159/000095648
7. Ismail AI, Messer JG. The risk of fluorosis in students exposed to a higher than optimal concentration of fluoride in well water. J Public Health Dent. (1996) 56(1):22–7. doi: 10.1111/j.1752-7325.1996.tb02390.x
8. Rozier RG. The prevalence and severity of enamel fluorosis in North American children. J Public Health Dent. (1999) 59(4):239–46. doi: 10.1111/j.1752-7325.1999.tb03276.x
9. Clark DC. Trends in prevalence of dental fluorosis in North America. Community Dent Oral Epidemiol. (1994) 22(3):148–52. doi: 10.1111/j.1600-0528.1994.tb01832.x
10. Pendrys DG, Haugejorden O, Bårdsen A, Wang NJ, Gustavsen F. The risk of enamel fluorosis and caries among Norwegian children: implications for Norway and the United States. J Am Dent Assoc. (2010) 141(4):401–14. doi: 10.14219/jada.archive.2010.0192
11. Spencer AJ, Do LG. Changing risk factors for fluorosis among South Australian children. Community Dent Oral Epidemiol. (2008) 36(3):210–8. doi: 10.1111/j.1600-0528.2007.00389.x
12. Zohoori FV, Moynihan PJ, Omid N, Abuhaloob L, Maguire A. Impact of water fluoride concentration on the fluoride content of infant foods and drinks requiring preparation with liquids before feeding. Community Dent Oral Epidemiol. (2012) 40(5):432–40. doi: 10.1111/j.1600-0528.2012.00688.x
13. Burt BA. The changing patterns of systemic fluoride intake. J Dent Res. (1992) 71(5):1228–37. doi: 10.1177/00220345920710051601
14. McClure FJ. Ingestion of fluoride and dental caries: quantitative relations based on food and water requirements of children one to twelve years old. Am J Dis Child. (1943) 66(4):362–9. doi: 10.1001/archpedi.1943.02010220015002
15. EFSA Panel on Dietetic Product, Nutrition, and Allergies. Scientific opinion on dietary reference values for fluoride. EFSA J. (2013) 11(8):3332. doi: 10.2903/j.efsa.2013.3332
16. EFSA. Opinion of the scientific panel on dietetic products, nutrition and allergies on a request from the commission related to the tolerable upper intake level of fluoride. EFSA J. (2005) 3(3):192–257. doi: 10.2903/j.efsa.2005.192
17. Institute of Medicine Food and Nutrition Board. Dietary Reference Intakes. Washington, D.C: National Academies Press (1998). doi: 10.17226/6432
18. EFSA Panel on Dietetic Products, Nutrition, and Allergies (NDA). Scientific opinion on principles for deriving and applying dietary reference values. EFSA. (2010) 8(3):1458. doi: 10.2903/j.efsa.2010.1458
19. Australian Government Department of Health. Australian and New Zealand Nutrient Reference Values for Fluoride. Woden: Australian Government Department of Health (2017).
20. Buzalaf MAR. Review of fluoride intake and appropriateness of current guidelines. Adv Dent Res. (2018) 29(2):157–66. doi: 10.1177/0022034517750850
21. Warren JJ, Levy SM, Broffitt B, Cavanaugh JE, Kanellis MJ, Weber-Gasparoni K. Considerations on optimal fluoride intake using dental fluorosis and dental caries outcomes—a longitudinal study. J Public Health Dent. (2009) 69(2):111–5. doi: 10.1111/j.1752-7325.2008.00108.x
22. Parada J, Aguilera JM. Food microstructure affects the bioavailability of several nutrients. J Food Sci. (2007) 72(2):R21–32. doi: 10.1111/j.1750-3841.2007.00274.x
23. Maguire A, Zohoori FV. Fluoride balance in infants and young children in the UK and its clinical relevance for the dental team. Br Dent J. (2013) 214(11):587–93. doi: 10.1038/sj.bdj.2013.531
24. Whitford GM. Intake and metabolism of fluoride. Adv Dent Res. (1994) 8(1):5–14. doi: 10.1177/08959374940080011001
25. Zohoori FV, Omid N, Sanderson RA, Valentine RA, Maguire A. Fluoride retention in infants living in fluoridated and non-fluoridated areas: effects of weaning. Br J Nutr. (2019) 121(1):74–81. doi: 10.1017/S0007114518003008
26. Zohoori FV. Summary of general discussion and conclusions. Adv Dent Res. (2018) 29(2):183–5. doi: 10.1177/0022034517750591
27. WHO. Global Strategy and Action Plan on Oral Health 2023–2030. Geneva: World Health Organization (2024).
28. Carbonell-Capella JM, Buniowska M, Barba FJ, Esteve MJ, Frigola A. Analytical methods for determining bioavailability and bioaccessibility of bioactive compounds from fruits and vegetables: a review. Compr Rev Food Sci Food Saf. (2014) 13(2):155–71. doi: 10.1111/1541-4337.12049
29. Benito P, Miller D. Iron absorption and bioavailability: an updated review. Nutr Res. (1998) 18(3):581–603. doi: 10.1016/S0271-5317(98)00044-X
30. Rodrigues DB, Marques MC, Hacke A, Loubet Filho PS, Cazarin CBB, Mariutti LRB. Trust your gut: bioavailability and bioaccessibility of dietary compounds. Cur Res Food Sci. (2022) 5:228–33. doi: 10.1016/j.crfs.2022.01.002
31. Ekstrand J, Ehrnebo M, Boréus LO. Fluoride bioavailability after intravenous and oral administration: importance of renal clearance and urine flow. Clin Pharmacol Ther. (1978) 23(3):329–37. doi: 10.1002/cpt1978233329
32. Ekstrand J, Ehrnebo M. Influence of milk products on fluoride bioavailability in man. Eur J Clin Pharmacol. (1979) 16(3):211–5. doi: 10.1007/BF00562063
33. Spak CJ, Ekstrand J, Zylberstein D. Bioavailability of fluoride added by baby formula and milk. Caries Res. (1982) 16(3):249–56. doi: 10.1159/000260605
34. Villa A, Guerrero S, Cisternas P, Mönckeberg F. Caries prevention through a nutritional vehicle. Arch Latinoam Nutr. (1990) 40(2):197–208.2133180
35. Trautner K, Siebert G. An experimental study of bio-availability of fluoride from dietary sources in man. Arch Oral Biol. (1986) 31(4):223–8. doi: 10.1016/0003-9969(86)90053-1
36. Goyal A, Gauba K, Tewari A. Bioavailability of fluoride in humans from commonly consumed diets in India. J Indian Soc Pedod Prev Dent. (1998) 16(1):1–6.11813711
37. Bornhorst GM, Singh RP. Gastric digestion in vivo and in vitro: how the structural aspects of food influence the digestion process. Annu Rev Food Sci Technol. (2014) 5:111–32. doi: 10.1146/annurev-food-030713-092346
38. Hjelmgren H, Ygge BM, Nordlund B, Andersson N. Nurses’ experiences of blood sample collection from children: a qualitative study from Swedish paediatric hospital care. BMC Nurs. (2022) 21(1):62. doi: 10.1186/s12912-022-00840-2
39. Li C, Yu W, Wu P, Chen XD. Current in vitro digestion systems for understanding food digestion in human upper gastrointestinal tract. Trends Food Sci Technol. (2020) 96:114–26. doi: 10.1016/j.tifs.2019.12.015
40. Chan L. Human exposure assessment of fluoride from tea (Camellia sinensis L.) with specific reference to human bioaccessibility studies. [PhD thesis]. University of Derby (2014).
41. Kronic J, Zohoori FV, Duckworth RM, Angione C, Levy SM. Predictor of Fluorosis: Total Fluoride Intake or Subsequent Fluoride Absorption?—Supplementary Material. Middlesbrough: Teesside University (2024). doi: 10.17632/yd86dmhfxv.1
42. Kronic J. Predictor of fluorosis: total fluoride intake or subsequent fluoride absorption? [PhD thesis]. Teesside University (2024).
43. Levy SM, Warren JJ, Davis CS, Kirchner HL, Kanellis MJ, Wefel JS. Patterns of fluoride intake from birth to 36 months. J Public Health Dent. (2001) 61(2):70–7. doi: 10.1111/j.1752-7325.2001.tb03369.x
44. Franzman MR, Levy SM, Warren JJ, Broffitt B. Fluoride dentifrice ingestion and fluorosis of the permanent incisors. J Am Dent Assoc. (2006) 137(5):645–52. doi: 10.14219/jada.archive.2006.0261
45. Levy SM, Kohout FJ, Kiritsy MC, Heilman JR, Wefel JS. Infants' fluoride ingestion from water, supplements and dentifrice. J Am Dent Assoc. (1995) 126(12):1625–32. doi: 10.14219/jada.archive.1995.0110
46. Rankin SJ, Levy SM, Warren JJ, Gilmore JE, Broffitt B. Relative validity of an FFQ for assessing dietary fluoride intakes of infants and young children living in Iowa. Public Health Nutr. (2011) 14(7):1229–36. doi: 10.1017/S1368980011000474
47. Marshall TA, Levy SM, Warren JJ, Broffitt B, Eichenberger-Gilmore JM, Stumbo PJ. Associations between intakes of fluoride from beverages during infancy and dental fluorosis of primary teeth. J Am Coll Nutr. (2004) 23(2):108–16. doi: 10.1080/07315724.2004.10719350
48. Levy SM, Kiritsy MC, Slager SL, Warren JJ, Kohout FJ. Patterns of fluoride dentifrice use among infants. Pediatr Dent. (1997) 19(1):50–5.9048414
49. Willing MC, Torner JC, Burns TL, Janz KF, Marshall T, Gilmore J, et al. Gene polymorphisms, bone mineral density and bone mineral content in young children: the Iowa bone development study. Osteoporos Int. (2003) 14(8):650–8. doi: 10.1007/s00198-003-1416-1
50. Marshall TA, Eichenberger–Gilmore JM, Broffitt B, Stumbo PJ, Levy SM. Relative validity of the Iowa Fluoride Study targeted nutrient semi-quantitative questionnaire and the block kids’ food questionnaire for estimating beverage, calcium, and vitamin D intakes by children. J Am Diet Assoc. (2008) 108(3):465–72. doi: 10.1016/j.jada.2007.12.002
51. Gidding SS, Dennison BA, Birch LL, Daniels SR, Gilman MW, Lichtenstein AH, et al. Dietary recommendations for children and adolescents. Circulation. (2005) 112(13):2061–75. doi: 10.1161/CIRCULATIONAHA.105.169251
52. Martínez-Mier EA, Cury JA, Heilman JR, Katz BP, Levy SM, Li Y, et al. Development of gold standard ion-selective electrode-based methods for fluoride analysis. Caries Res. (2011) 45(1):3–12. doi: 10.1159/000321657
53. Taves DR. Separation of fluoride by rapid diffusion using hexamethyldisiloxane. Talanta. (1968) 15(9):969–74. doi: 10.1016/0039-9140(68)80097-9
54. Rocha RA, Rojas D, Clemente MJ, Ruiz A, Devesa V, Velez D. Quantification of fluoride in food by microwave acid digestion and fluoride ion-selective electrode. J Agric Food Chem. (2013) 61(45):10708–13. doi: 10.1021/jf403728r
55. Minekus M, Alminger M, Alvito P, Ballance S, Bohn T, Bourlieu C, et al. A standardised static in vitro digestion method suitable for food—an international consensus. Food Funct. (2014) 5(6):1113–24. doi: 10.1039/C3FO60702J
56. Brodkorb A, Egger L, Alminger M, Alvito P, Assunção R, Ballance S, et al. INFOGEST Static in vitro simulation of gastrointestinal food digestion. Nat Protoc. (2019) 14(4):991–1014. doi: 10.1038/s41596-018-0119-1
57. Rocha RA, de la Fuente B, Clemente MJ, Ruiz A, Vélez D, Devesa V. Factors affecting the bioaccessibility of fluoride from seafood products. Food Chem Toxicol. (2013) 59:104–10. doi: 10.1016/j.fct.2013.05.042
58. Bland JM, Altman D. Statistical methods for assessing agreement between two methods of clinical measurement. Lancet. (1986) 327(8476):307–10. doi: 10.1016/S0140-6736(86)90837-8
59. Rankin SJ, Levy SM, Warren JJ, Gilmore JE, Broffitt B. Fluoride content of solid foods impacts daily intake. J Public Health Dent. (2012) 72(2):128–34. doi: 10.1111/j.1752-7325.2011.00292.x
60. Grimes CA, Szymlek-Gay EA, Campbell KJ, Nicklas TA. Food sources of total energy and nutrients among U.S. infants and toddlers: national health and nutrition examination survey 2005–2012. Nutrients. (2015) 7(8):6797–836. doi: 10.3390/nu7085310
61. Koparal E, Ertugrul F, Oztekin K. Fluoride levels in breast milk and infant foods. J Clin Pediatr Dent. (2000) 24(4):299–302. doi: 10.17796/jcpd.24.4.pt4860767j25247l
62. Sener Y, Tosun G, Kahvecioglu F, Gökalp A, Koç H. Fluoride levels of human plasma and breast milk. Eur J Dent. (2007) 1(1):21–4. doi: 10.1055/s-0039-1698307
63. Spak CJ, Hardell LI, de Chateau P. Fluoride in human milk. Acta Paediatr Scand. (1983) 72(5):699–701. doi: 10.1111/j.1651-2227.1983.tb09796.x
64. Fomon SJ, Ekstrand J. Fluoride intake by infants. J Public Health Dent. (1999) 59(4):229–34. doi: 10.1111/j.1752-7325.1999.tb03274.x
65. Fox MK, Condon E, Briefel RR, Reidy KC, Deming DM. Food consumption patterns of young preschoolers: are they starting off on the right path? J Am Diet Assoc. (2010) 110(12, Supplement):S52–9. doi: 10.1016/j.jada.2010.09.002
66. Welker EB, Jacquier EF, Catellier DJ, Anater AS, Story MT. Room for improvement remains in food consumption patterns of young children aged 2–4 years. J Nutr. (2018) 148(9s):1536s–46. doi: 10.1093/jn/nxx053
67. Damen FWM, Luning PA, Fogliano V, Steenbekkers BLPA. What influences mothers’ snack choices for their children aged 2–7? Food Qual Pref. (2019) 74:10–20. doi: 10.1016/j.foodqual.2018.12.012
68. Mireault A, Mann L, Blotnicky K, Rossiter M. Evaluation of snacks consumed by young children in child care and home settings. ICEP. (2023) 17:1. doi: 10.1186/s40723-023-00106-7
69. Dabeka RW, McKenzie AD, Conacher HB, Kirkpatrick DC. Determination of fluoride in Canadian infant foods and calculation of fluoride intakes by infants. Can J Public Health. (1982) 73(3):188–91.7127240
70. Heilman JR, Kiritsy MC, Levy SM, Wefel JS. Fluoride concentrations of infant foods. J Am Dent Assoc. (1997) 128(7):857–63. doi: 10.14219/jada.archive.1997.0335
71. Zohoori FV, Maguire A. Database of the Fluoride (F) Content of Selected Drinks and Foods in the UK. Middlesbrough: Teesside University and Newcastle University (2015).
72. Office for Health Improvement and Disparities. Water Fluoridation—Health Monitoring Report for England. London: Teesside University (2022).
73. Cantoral A, Luna-Villa LC, Mantilla-Rodriguez AA, Mercado A, Lippert F, Liu Y, et al. Fluoride content in foods and beverages from Mexico city markets and supermarkets. Food Nutr Bull. (2019) 40(4):514–31. doi: 10.1177/0379572119858486
74. Zohoori FV, Maguire A. Are there good reasons for fluoride labelling of food and drink? Br Dent J. (2018) 224(4):215–7. doi: 10.1038/sj.bdj.2018.123
75. Zohoori FV, Maguire A. A Database of the Fluoride Content of Selected Drinks and Foods in the UK and Republic of Ireland. Middlesbrough: Teesside University and Newcastle University (2019).
76. Kiritsy MC, Levy SM, Warren JJ, Guha – Chowdhury N, Heilman JR, Marshall T. Assessing fluoride concentrations of juices and juice-flavored drinks. J Am Dent Assoc. (1996) 127(7):895–902. doi: 10.14219/jada.archive.1996.0347
77. Maraver F, Vitoria I, Almerich-Silla JM, Armijo F. Fluoruro en aguas minerales naturales envasadas en españa y prevención de la caries dental. Aten Primaria. (2015) 47(1):15–24. doi: 10.1016/j.aprim.2014.04.003
78. Liu CF, Wyborny LE, Chan JT. Fluoride content of dairy milk from supermarket—a possible contributing factor to dental fluorosis. Fluoride. (1995) 28(1):10–6.
79. Buzalaf MA, Pessan JP, Fukushima R, Dias A, Rosa HM. Fluoride content of UHT milks commercially available in Bauru, Brazil. J Appl Oral Sci. (2006) 14(1):38–42. doi: 10.1590/S1678-77572006000100008
80. Buzalaf MAR, Pinto CS, Rodrigues MHC, Levy FM, Borges AS, Furlani TA, et al. Availability of fluoride from meals given to kindergarten children in Brazil. Community Dent Oral Epidemiol. (2006) 34(2):87–92. doi: 10.1111/j.1600-0528.2006.00266.x
81. Pagliari Tiano AV, Moimaz SA, Saliba O, Saliba NA, Sumida DH. Fluoride intake from meals served in daycare centres in municipalities with different fluoride concentrations in the water supply. Oral Health Prev Dent. (2009) 7(3):289–95. doi: 10.3290/j.ohpd.a17332
82. Cerklewski FL. Fluoride bioavailability — nutritional and clinical aspects. Nutr Res. (1997) 17(5):907–29. doi: 10.1016/S0271-5317(97)00057-2
83. Wiatrowski E, Kramer L, Osis D, Spencer H. Dietary fluoride intake of infants. Pediatrics. (1975) 55(4):517–22. doi: 10.1542/peds.55.4.517
84. Trautner K, Einwag J. Influence of milk and food on fluoride bioavailability from NaF and Na2FPO3 in man. J Dent Res. (1989) 68(1):72–7. doi: 10.1177/00220345890680011201
85. Jin Y, Wilde PJ, Li C, Jin W, Han J, Liu W. Impact of food viscosity on in vitro gastric emptying using dynamic and semi-dynamic models. Food Hydrocoll. (2023) 137:108410. doi: 10.1016/j.foodhyd.2022.108410
86. Kulkarni SD, Acharya R, Rajurkar NS, Reddy AVR. Evaluation of bioaccessibility of some essential elements from wheatgrass (Triticum aestivum L.) by in vitro digestion method. Food Chem. (2007) 103(2):681–8. doi: 10.1016/j.foodchem.2006.07.057
87. Antoine T, Icard-Verniere C, Scorrano G, Salhi A, Halimi C, George S, et al. Evaluation of vitamin D bioaccessibility and mineral solubility from test meals containing meat and/or cereals and/or pulses using in vitro digestion. Food Chem. (2021) 347:128621. doi: 10.1016/j.foodchem.2020.128621
Keywords: fluoride, infant, child, bio-accessibility, diet, Iowa fluoride study
Citation: Kronic J, Duckworth RM, Angione C, Levy SM and Zohoori FV (2025) Assessment of fluoride bio-accessibility in early childhood diets. Front. Oral. Health 6:1526262. doi: 10.3389/froh.2025.1526262
Received: 11 November 2024; Accepted: 20 January 2025;
Published: 6 February 2025.
Edited by:
Shahzad Muhammad, Zarqa University, JordanReviewed by:
Bibi Hajira, Khyber Medical University, PakistanSaad Liaqat, Khyber Medical University, Pakistan
Copyright: © 2025 Kronic, Duckworth, Angione, Levy and Zohoori. This is an open-access article distributed under the terms of the Creative Commons Attribution License (CC BY). The use, distribution or reproduction in other forums is permitted, provided the original author(s) and the copyright owner(s) are credited and that the original publication in this journal is cited, in accordance with accepted academic practice. No use, distribution or reproduction is permitted which does not comply with these terms.
*Correspondence: Fatemeh Vida Zohoori, di56b2hvb3JpQHRlZXMuYWMudWs=